Abstract
This study focuses on preventing scale formation in hard waters by controlled electrode-position of Ca2+ and Mg2+ on a stainless-steel cathode at constant applied current intensity. The influence of the anode material, BDD or Ti/Pt/PbO2, cathode active area, stirring speed, and applied anodic current intensity on the inorganic carbon (IC), Ca2+, and Mg2+ removal was investigated. Assays were performed with model hard water solutions, simulating Bounouara (Algeria) water. The scaling inhibiting properties of the treated water were followed by measuring IC, calcium, and magnesium concentrations and chronoamperometric characterization of the treated solutions. The influence of the Ca/Mg molar ratio on the inorganic carbon removal by electrolysis was also evaluated, utilizing model solutions with different compositions. It was found that an increase in stirring speed or cathode geometric area favors IC and Ca2+ and Mg2+ removal rates. The applied current intensity was varied from 0.025 to 0.5 A, and the best results were obtained for 0.1 A, either in IC and Ca2+ and Mg2+ removals or by the accelerated scaling tests. However, energy costs increase with applied current. The deposit formed over the cathode does not seem to influence posterior deposition rate, and after eight consecutive assays, the solid deposition rate was kept constant. Ca/Mg ratio influences IC removal rate that increases with it. The results showed that hard-water scaling phenomena can be prevented by solid electrodeposition on the cathode at applied constant current.
Keywords:
hard water; electrodeposition; scaling phenomena; calcium; magnesium; carbonate; chronoamperometry 1. Introduction
The scaling phenomenon is one of the problems that has taken a large concern in aquatic environmental studies for decades [1,2,3,4,5]. Natural and spontaneous scale formation on metallic surfaces leads to numerous technical and economic problems in several domains, namely in the drinking water distribution system, where the precipitation and accumulation of crystals of insoluble salts over time causes pipes damage by decreasing its internal diameter, which can reach up to 90% after a few years of use [4]. This reduction in pipes’ diameter blocks and decreases the water flow rate. For instance, in industrial applications of reverse osmosis technology, considered among the most efficient technologies in wastewater treatment and seawater purification [6,7,8,9], the formation of inorganic scale, which is often characterized by calcium carbonate, calcium sulfate and silica, on membranes surface is considered one of the main factors leading to the reduction of reverse osmosis application/efficiency [10,11,12].
Scaling deposits formation is due to water hardness that, unfortunately, characterizes the majority of groundwaters, the main source of drinking and irrigation water for agricultural development in arid and semi-arid regions, because the climate change effects lead to scarcity of water resources. Thus, it is very important to find economically viable processes that allow the exploitation of these water resources by reducing technical and economic problems resulting from their utilization.
To prevent scale deposits formation, mainly of calcium carbonate [13,14,15], many studies have been reported using different methods, such as chemical treatment based on the addition of chemical inhibitors to reduce the water hardness (polyacids, synthetic polymers, metal cations, and anions, etc.) [4,15,16,17,18,19,20]. Recently, some studies have been conducted on natural inhibitors as an alternative for chemical inhibitors, and they have proved their efficiency in reducing calcium carbonate potential [21,22]. The addition of such compounds can lead to a change in the chemical and physical properties of the water and may cause undesirable effects over time. Thus, the recovery of CaCO3 from hard water before being distributed and utilized could be the best solution to avoid scale formation in pipes, tubes, and membranes.
The controlled formation of CaCO3 by electrodeposition is rarely used to prevent natural scale formation. Some previous studies addressed the controlled precipitation of calcium carbonate by applying different negative electric potentials to reduce the oxygen that leads to the production of hydroxyl ions, which increases the pH value near the electrode’s surface, where calcium carbonate is formed [23,24,25].
Dirany and collaborators reported the electrodeposition of calcium carbonate to prevent scale formation [23]. The electrodeposition of calcium carbonate was carried out in real samples of a cooling water system (at 40 °C) by imposing different potentials and testing two different cathode materials, stainless-steel (SS) and titanium. Potentials of −0.78, −1.0, and −1.2 V vs. Ag/AgCl were applied for SS, and −1.1, −1.3, and −1.4 V vs. Ag/AgCl for Ti, to determine the optimum CaCO3 electrodeposition potential for each cathode material. They found that the potential and the cathode material were the most influencing parameters on calcium carbonate electrodeposition at the chronoamperometric experimental conditions studied. The use of titanium cathode led to a faster calcium carbonate deposition rate than SS, at the optimum potential, i.e., −1.2 and −1.4 V vs. Ag/AgCl, respectively.
Amzert and collaborators have also investigated the electrodeposition of calcium carbonate, using a rotating stainless-steel electrode as the cathode. In addition to the cathodic polarization, the effect of the hardness (50,100, 300, 600 mg L−1), the rotation speed (0, 600, 1500, 3000 rpm), and the temperature (25, 30, 40, and 70 °C) on the calcium carbonate electrodeposition have been reported [26]. The results showed that all the studied parameters significantly affect the calcium carbonate deposition kinetics on the SS electrode. To study the scale inhibition of calcium carbonate by cathodic and anodic processes, the electrodeposition of calcium carbonate was performed by Edvardsen and colleagues. They reported the growth of calcium carbonate deposits on graphite cathode and anode, at different calcium chloride concentrations (0.5 and 1.5 wt% CaCl2) and positive potentials (1, 3, 5, 10 V), proving that both cathodic and anodic processes can be utilized in scale prevention [27]. The simultaneous electrodeposition of calcium and magnesium ions by applying different current intensities was reported for artificial and natural seawater and for phosphorous-containing domestic wastewater [28,29].
The present work aimed to study the prevention of scale formation on natural hard water that can be utilized for consumption and drinking. It is focused on the recovery of the scale deposit by a simple method that eliminates the elements responsible for scale formation by controlled electrodeposition of Ca2+ and Mg2+ on a stainless-steel cathode at a different applied electrical charge. The removal of calcium and magnesium by electrodeposition may be the best solution for drinking water softening, avoiding the addition of chemicals or other compounds to the water that may have undesirable effects on the treated water, human health, and environment, in addition to the high cost of some of those chemicals. Moreover, the electrodeposition of cations to reduce the hardness of water may have several other advantages, like environmental compatibility, low maintenance, the possibility of automation and convenient process control, valorization of insoluble compounds that can be recovered, such as calcium carbonate, which can be used in construction and industrial processes [30]. To attain the objectives, electrochemical experiments, with model hard water solutions simulating Bounouara (Algeria) water, were carried out, and the influence of the anode material, BDD or Ti/Pt/PbO2, cathode active area, 10 or 20 cm2, and applied anodic current intensity, 0.1, 0.3 and 0.5 A, on the scale electrodeposition were investigated. The scaling inhibiting properties of the treated water was followed by measuring inorganic carbon, calcium, and magnesium concentrations during electrochemical experiments. The consequent reduction in scale was also characterized by chronoamperometry, usually utilized to evaluate the effectiveness of the scale inhibition process [4,20,21,22]. Finally, the influence of the Ca/Mg molar ratio on the inorganic carbon removal by electrolysis was evaluated, utilizing model solutions with different compositions.
2. Materials and Methods
To perform the electrochemical experiments (EE), aqueous solutions were prepared with ultrapure water, obtained with Milli-Q system (Merck, Lisbon, Portugal), using sodium hydrogen carbonate (CAS Number 144-55-8), magnesium chloride hexahydrate (CAS Number 7791-18-6), and calcium chloride (CAS Number 10035-04-8), all purchased from Sigma-Aldrich (Lisbon, Portugal). The concentration in HCO3−, Mg2+, and Ca2+ of the different solutions is presented in Table 1. Solution S intended to simulate the Bounouara (Algeria) water. Solutions A to E were utilized to understand the effect of the Mg2+/Ca2+ ratio on the carbonate removal.

Table 1.
Composition of the aqueous solutions utilized in the experiments, with molar fractions for HCO3− + Ca2+ + Mg2+ = 1.
The EE assays were performed in batch mode, using two different undivided and cylindrical glass cells, with 200 and 500 mL working volumes. During the experiments, the solution was continuously stirred at 300, 500, or 1000 rpm, at room temperature, to increase the mass transport of reactants/products toward/from the electrodes.
A commercial Si/BDD (BDD) electrode, purchased from Neocoat (La Chaux-de-Fonds, Switzerland), with an immersed area of 20 cm2, and a Ti/Pt/PbO2, with an area of 10 cm2, prepared in the lab [31,32], were used as anodes. The anode was centered in the cell and parallel to a stainless-steel cathode with submerged areas of 10 and 20 cm2, since one of the objectives was also to investigate the influence of the cathode area.
A direct current (DC) power supply type GW, Lab DC, model GPS-3030D (0–30 V, 0–3 A), purchased from ILC (Lisbon, Portugal), was utilized to attain the anodic current intensities from 0.025 to 0.5 A. The experiments were performed with 4 and 8 h duration. The samples were collected every 60 minutes for the 4 h-assays and every 120 minutes for the 8 h-assays. Samples collected (10 mL) were utilized for calcium, magnesium, inorganic carbon, pH, and conductivity determinations performed in triplicate.
Inorganic carbon was measured in a Shimadzu TOC-V CPH analyzer, purchased from Izasa Scientific (Carnaxide, Portugal). Calcium and magnesium ions concentrations were followed by ion chromatography (HPLC), using a Shimadzu 20 A Prominence HPLC system, purchased from Izasa Scientific (Carnaxide, Portugal), equipped with a CDD 10 Avp conductivity detector. The column was an IC YK-A Shodex (4.6 mm ID × 100 mm), purchased from VWR International (Amadora, Portugal), and the column temperature was 40 °C. The mobile phase consisted of a 5.0 mM tartaric acid, 1.0 mM dipicolinic acid, and 24 mM boric acid aqueous solution at a flow rate of 1.0 mL min−1. The injection volume was 20 μL. All chemicals used were of HPLC grade, supplied by Sigma-Aldrich (Lisbon, Portugal), and solutions were prepared with ultrapure water obtained from a Milli-Q system (Merck, Lisbon, Portugal). pH was measured with a HANNA pH meter (HI 931400) and conductivity using a Mettler Toledo conductivity meter (SevenEasy S30K), both purchased from MT Brandão (Oporto, Portugal).
Initial and EE final samples were submitted to accelerate scaling tests. These chronoamperometric studies were carried out using a thermostated double-walled conventional three-electrode electrochemical cell, with a volume of 500 mL, having Ag/AgCl as reference electrode, a platinum wire as the auxiliary electrode, and a 1 cm2 XC10 stainless-steel plate as the working electrode. A potential of −0.96 V vs. Ag/AgCl was applied for 60 min, using a Potentiostat-Galvanostat Autolab B.V. equipment with NOVA 1.10 (2013) software (Reference 3526 KM Utrecht), purchased from Dias de Sousa S.A. (Alcochete, Portugal). The accelerated scaling tests were performed with 400 mL of solution at continuous stirring of 500 rpm.
Solids deposited over the cathode were analyzed by X-ray diffractometry, in a Rigaku diffractometer, model DMAX III/C, with automatic data acquisition (MDI, Materials Data), equipped with a monochromatized Cu kα radiation (λ = 0.15406 nm), purchased from Dias de Sousa S.A. (Alcochete, Portugal), operating at 30 mA and 40 kV. Energy dispersive spectroscopy (EDS) characterization was performed in a Hitachi (S-3400N)/ Bruker system, purchased from Monocomp Instrumentación S.A. (Madrid, Spain), operating at 20 keV. Scanning electron microscopy (SEM) images were obtained in a Hitachi (S- 3400N) system, purchased from Monocomp Instrumentación S.A. (Madrid, Spain), operating at 20 keV.
3. Results and Discussion
3.1. Influence of Stirring Speed
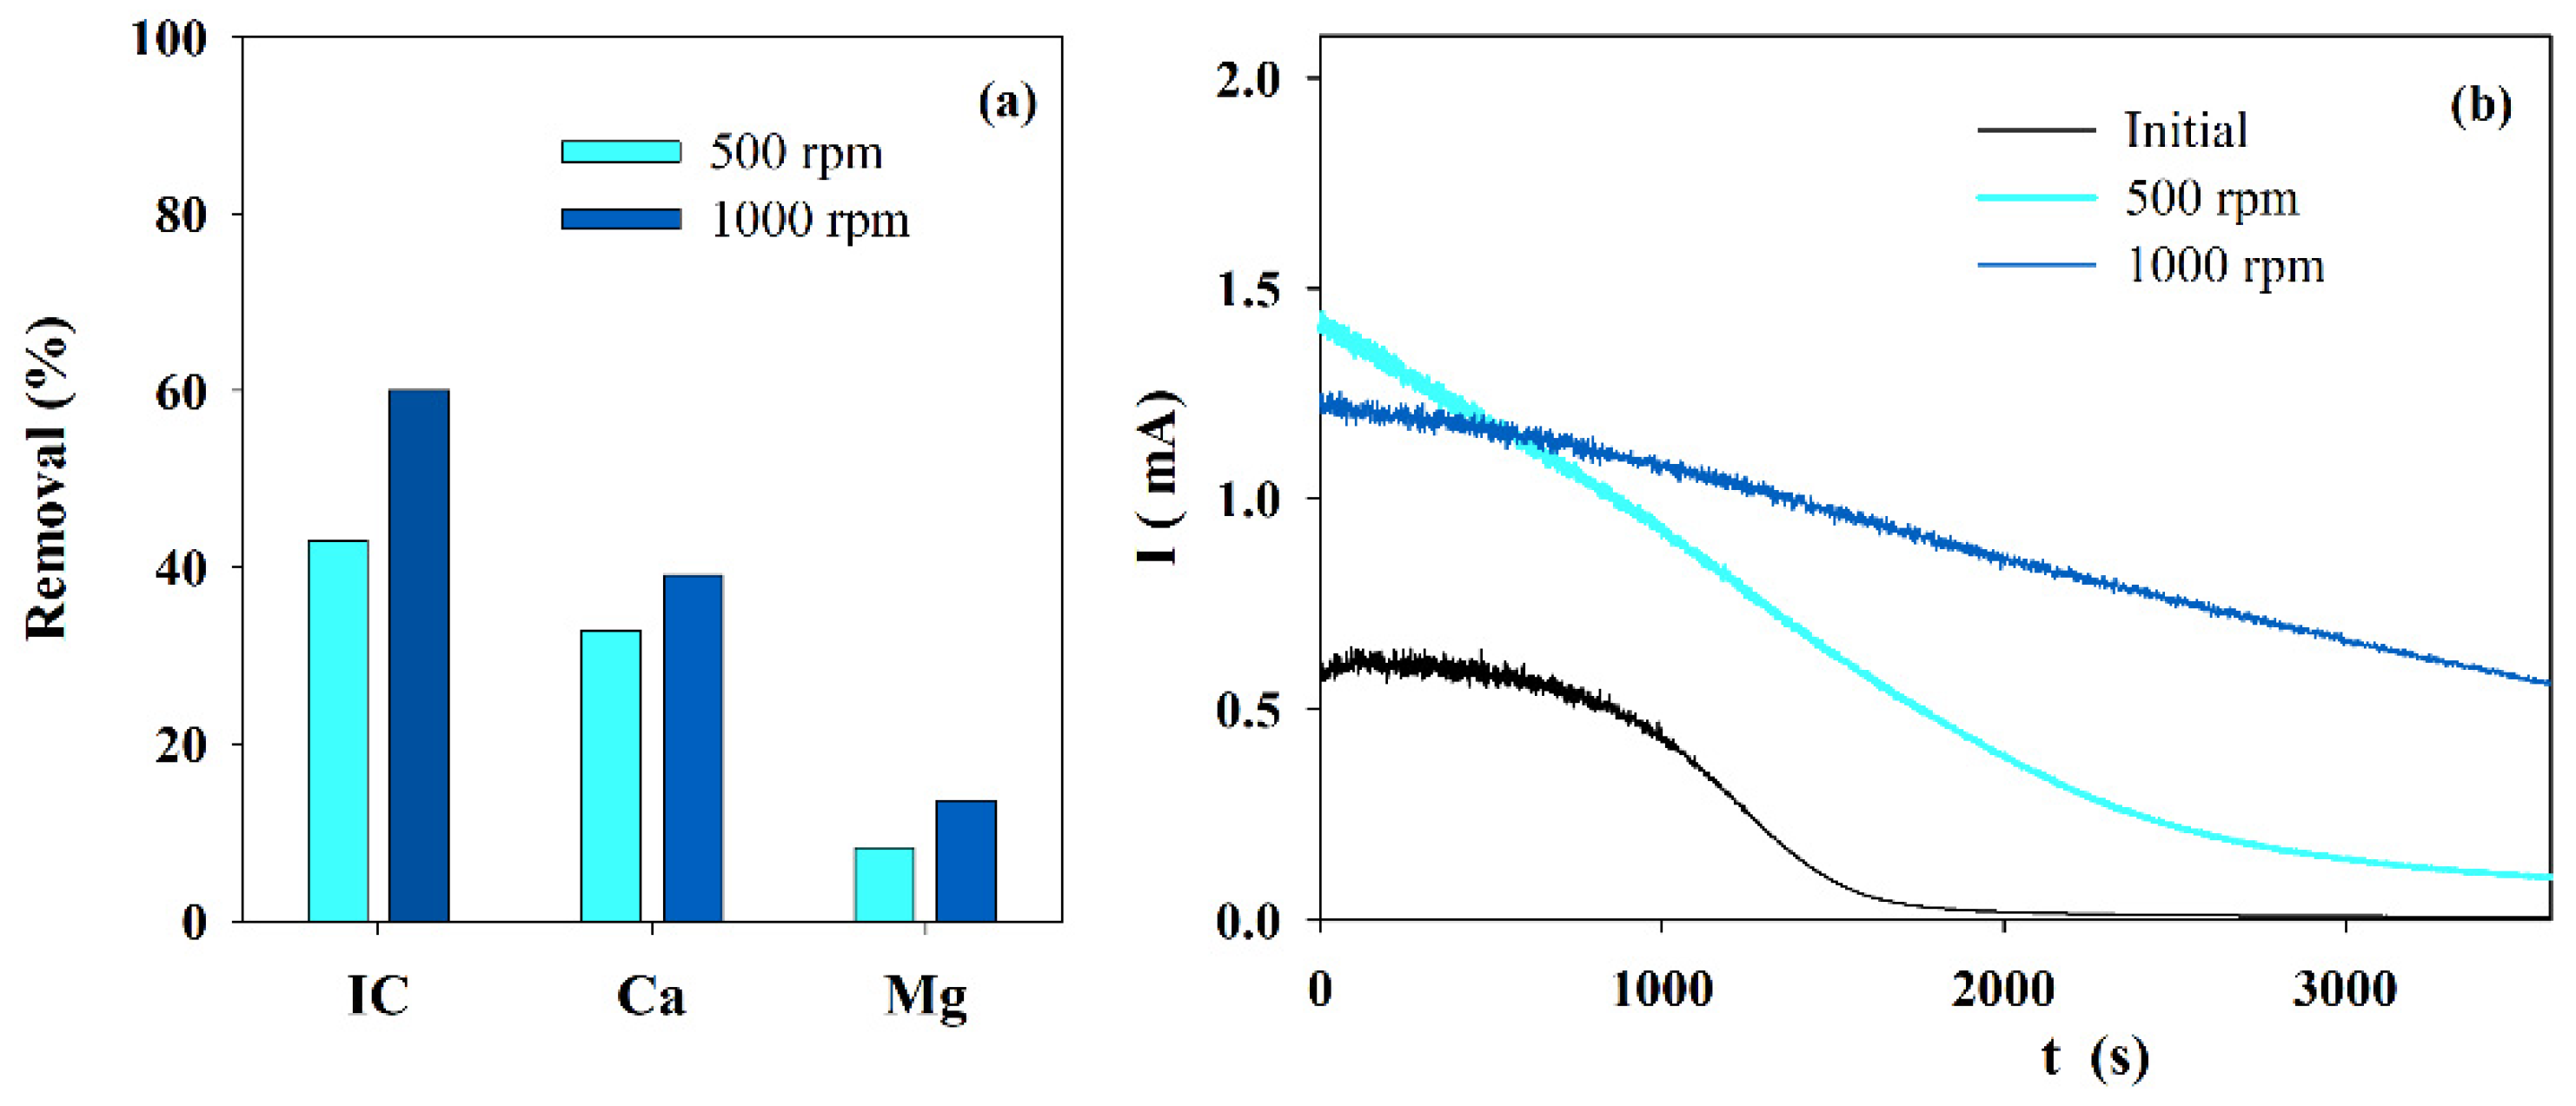
Figure 1a presents the IC and calcium and magnesium ions removal obtained during electrolysis performed with solution S at different stirring speeds.
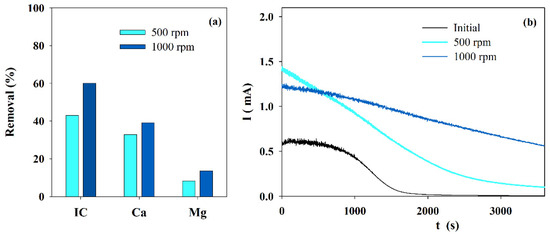
Figure 1.
Influence of the stirring speed on the (a) IC, Ca2+ and Mg2+ removals, during electrolysis (I = 0.1 A; Anode—BDD 20 cm2; Cathode—SS 10 cm2; 4 h), and (b) chronoamperometric tests (E = −0.96 V vs. Ag/AgCl) run with S solution before and after the electrolytic assays performed at different stirring speed.
It shows an increased removal in IC and in calcium and magnesium ions when the stirring speed was changed from 500 to 1000 rpm. An explanation for this fact must be the increase in mass transfer from the bulk to the reaction zone and a possible decrease in the boundary layer thickness due to the increase in turbulence promoted by the higher stirring speed. The lower removal in the ions content at lower stirring speed leads to a current reduction over time, promoted by the blocking effect of the solid deposit formed over the electrode’s surface, as can be observed in the chronoamperometric curves of the initial and the final solutions, treated at similar experimental conditions but different stirring speeds (Figure 1b).
3.2. Influence of the Cathode Area
Since calcium and magnesium ions are removed from the solution by deposition on the cathode, different cathode areas were tested in the electrolytic assays run with solution S. Results are displayed in Figure 2a. An increase in the cathode area allows a higher removal in the IC and the calcium and magnesium ions from the solution during electrolysis since the surface exposed for the solid phase deposition doubled. This increase happens mainly for magnesium ions and introduces a much better performance in the accelerated scaling tests, as observed in the chronoamperometric curves (Figure 2b). The treated solution in the assay performed with a higher cathode area presents a much lower blocking effect, with an almost constant current in time.
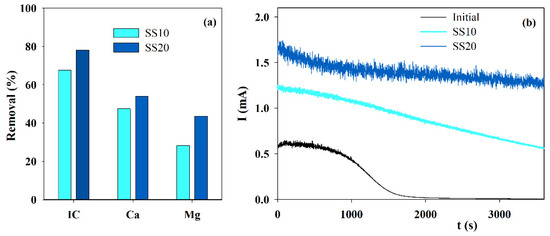
Figure 2.
Influence of the cathode area on the (a) IC, Ca2+ and Mg2+ removals, during electrolysis (I = 0.1 A; Anode—BDD 20 cm2; Cathode—SS, 10 or 20 cm2; Stirring speed—1000 rpm; 4 h), and (b) chronoamperometric tests (E = −0.96 V vs. Ag/AgCl) run with S solution, before and after the electrolytic assays performed using different cathode areas.
3.3. Influence of the Current Intensity
Although EE assays were run at applied current intensities ranging from 0.025 to 0.5 A, it was observed that smaller currents were better to attain the expected results. Thus, only the results obtained at current densities ranging from 0.025 to 0.2 A are presented in Figure 3. When the removals in IC and Ca2+ are compared, similar results are observed for current intensities of 0.05, 0.1, and 0.2 A. However, the best results for Mg2+ were attained at 0.1 A. This higher Mg2+ removal has an enormous influence on the chronoamperometric curve since this curve shows assuredly the best behavior because almost no reduction in the current is observed during the accelerated scaling test. The current intensity of 0.1 A, which corresponds to a current density of 100 A m−2, was also the best experimental condition found in literature research [30]. According to those authors, this must happen because the process is diffusion-controlled higher applied currents are a waste. Higher currents can increase hydrogen evolution that may even hinder solids’ deposition.
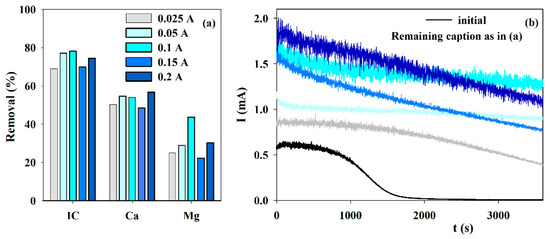
Figure 3.
Influence of the current intensity on the (a) IC, Ca2+ and Mg2+ removals, during electrolysis (I = 0.025 to 0.2 A; Anode—BDD 20 cm2; Cathode—SS 20 cm2; Stirring speed—1000 rpm; 4 h), and (b) chronoamperometric tests (E = −0.96 V vs. Ag/AgCl) with S solution before and after the electrolytic assays at different intensities.
The final pH, presented in Table 2, is lower than the initial one and is almost independent of the applied current intensities utilized. Conductivity reduction (Table 2) follows a similar trend to that observed in Figure 3a for the IC removal, probably because carbonate/hydrogen carbonate are the ions that most contribute to this parameter.
Table 2.
Results for the final pH (initial pH = 7.9 ± 0.2), conductivity removal (initial conductivity = 1.7 ± 0.2 mS cm−1), and specific energy consumptions per mass of inorganic carbon or calcium and magnesium removed, during electrolytic assays performed at different current intensities. Anode—BDD 20 cm2; Cathode—SS 20 cm2; Stirring speed—1000 rpm; 4 h.
Specific energy consumptions, SEC, per mass of IC, Ca2+, or Mg2+ removed during the assays performed at different current intensities were calculated using Equation 1 and are also presented in Table 2.
where SEC is in kWh kg−1, I is in A, E in V, t in h, and Δc refers to the variation of IC, Ca2+ or Mg2+ concentration during the 4 h of the assays, and is in g L−1, and V is in L [33].
As expected, specific energy consumption increases with applied current intensity since potential difference increases with it, and the removals obtained for the different parameters, particularly for IC and Ca2+, are not so dependent on the applied potential, as observed in Figure 3a.
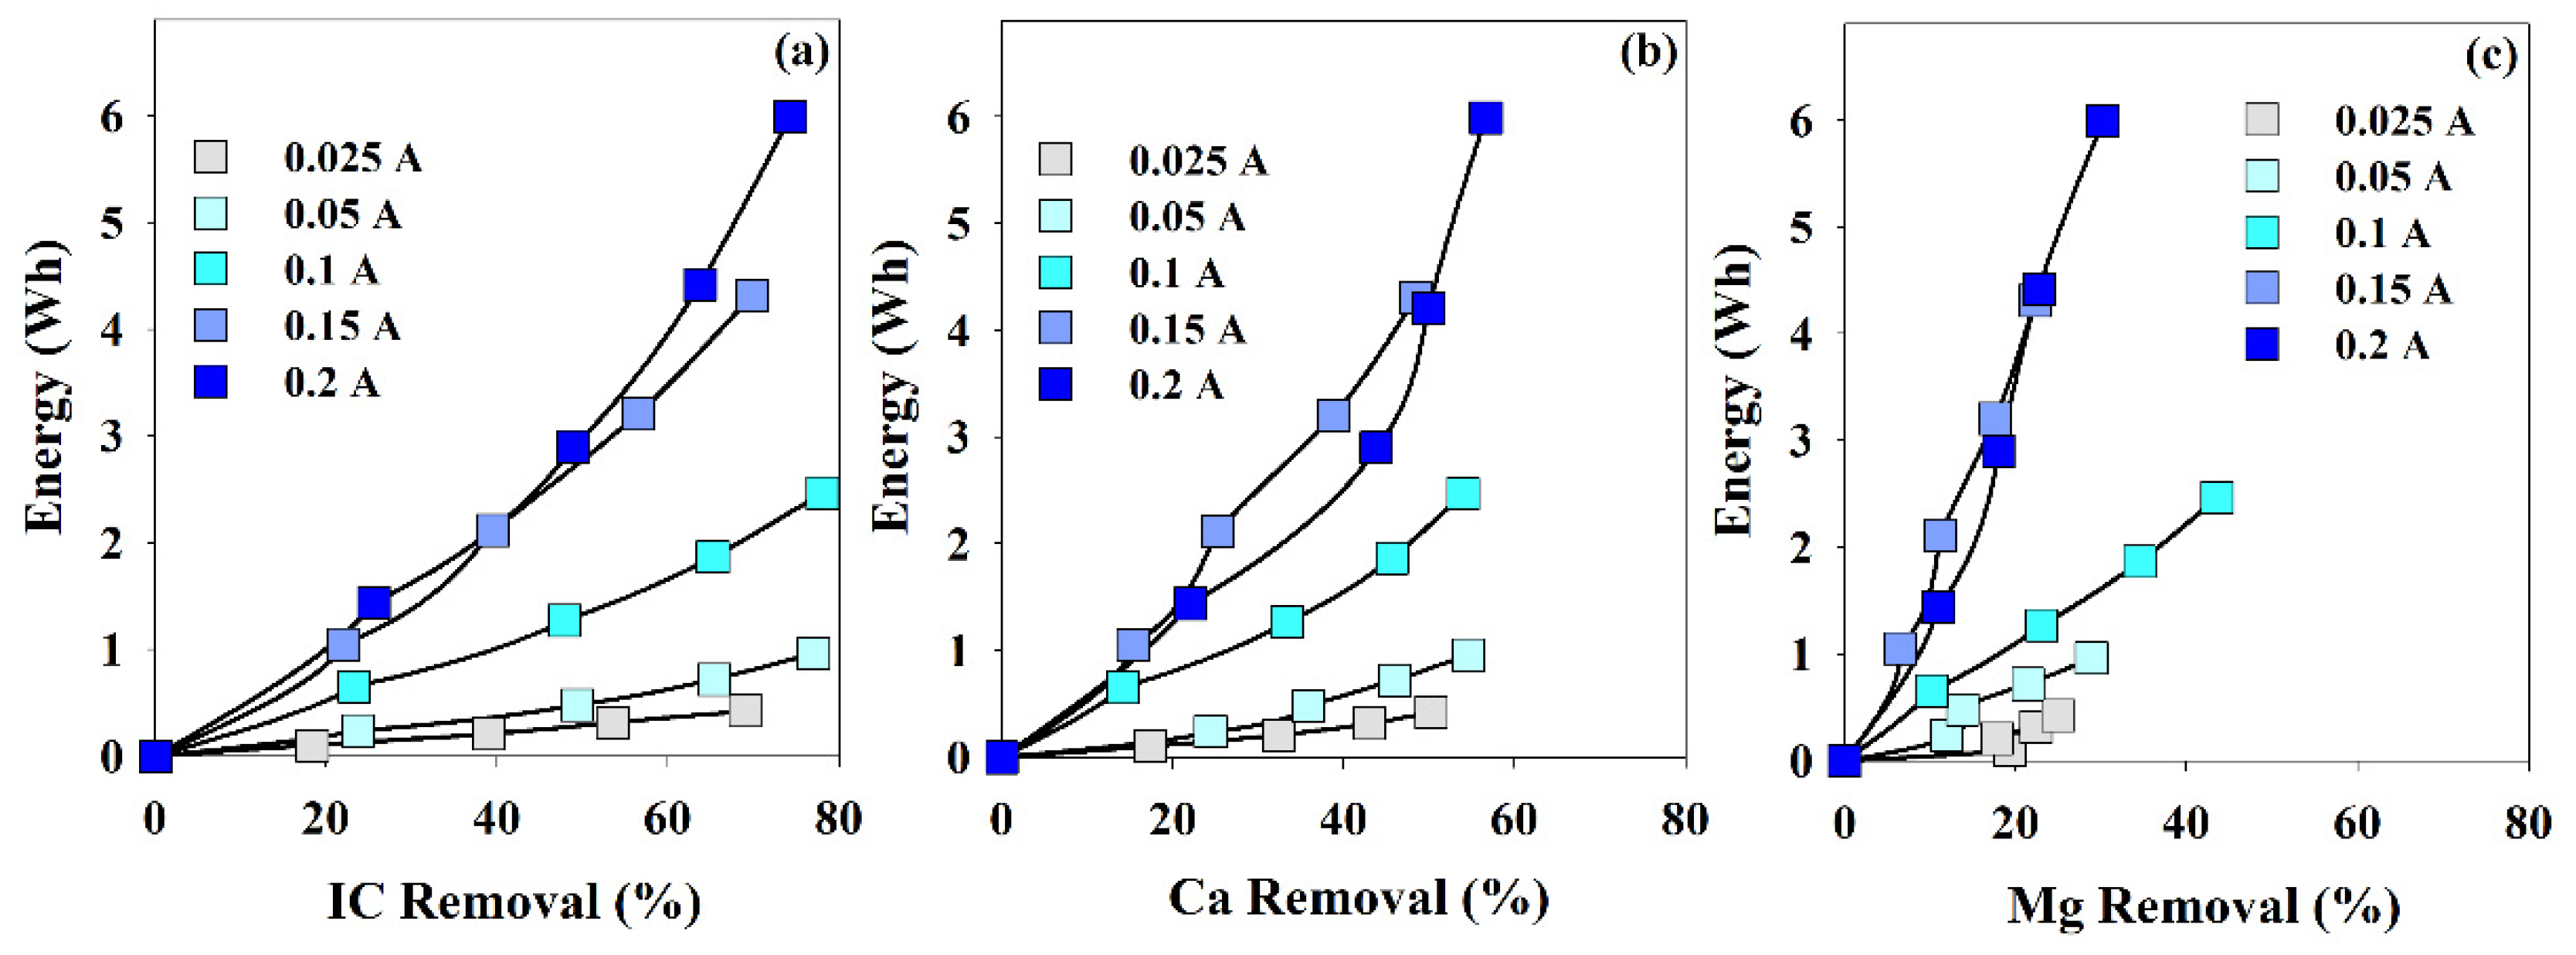
In Figure 4, the energy being consumed during the EE assays is plotted against the removal percentage in IC, Ca2+, or Mg2+. The most remarkable fact is that, in 4 h, the highest removal in Mg2+ was obtained at 0.1 A. IC and Ca2+ removals were not very influenced by the current intensity, and for the different applied current intensities, after the 4-h assays, they presented values within 70–80% and 50–60%, respectively. On the other hand, Mg2+ removal presented a much more accentuated dependence with the intensity, 0.1 A, the current promoting the highest Mg2+ removal rate. This fact may be related to the Mg2+ affinity by the cathode back face, and very low current intensities do not promote potential differences high enough to favor this process. On the other hand, the very high current intensity may promote a chaotic environment, not adequate for the supersaturation degree needed for the solids deposition.
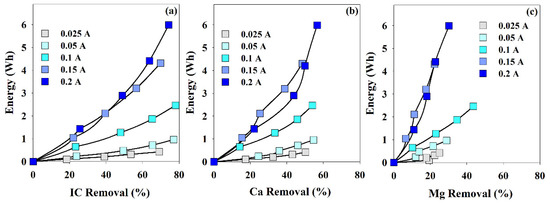
Figure 4.
Energy consumption vs. removal percentage of (a) IC, (b) Ca2+ and (c) Mg2+, during the assays performed at different current intensities. I = 0.025 to 0.2 A; Anode—BDD 20 cm2; Cathode—SS 20 cm2; Stirring speed—1000 rpm; 4 h.
3.4. Influence of the Anode Material
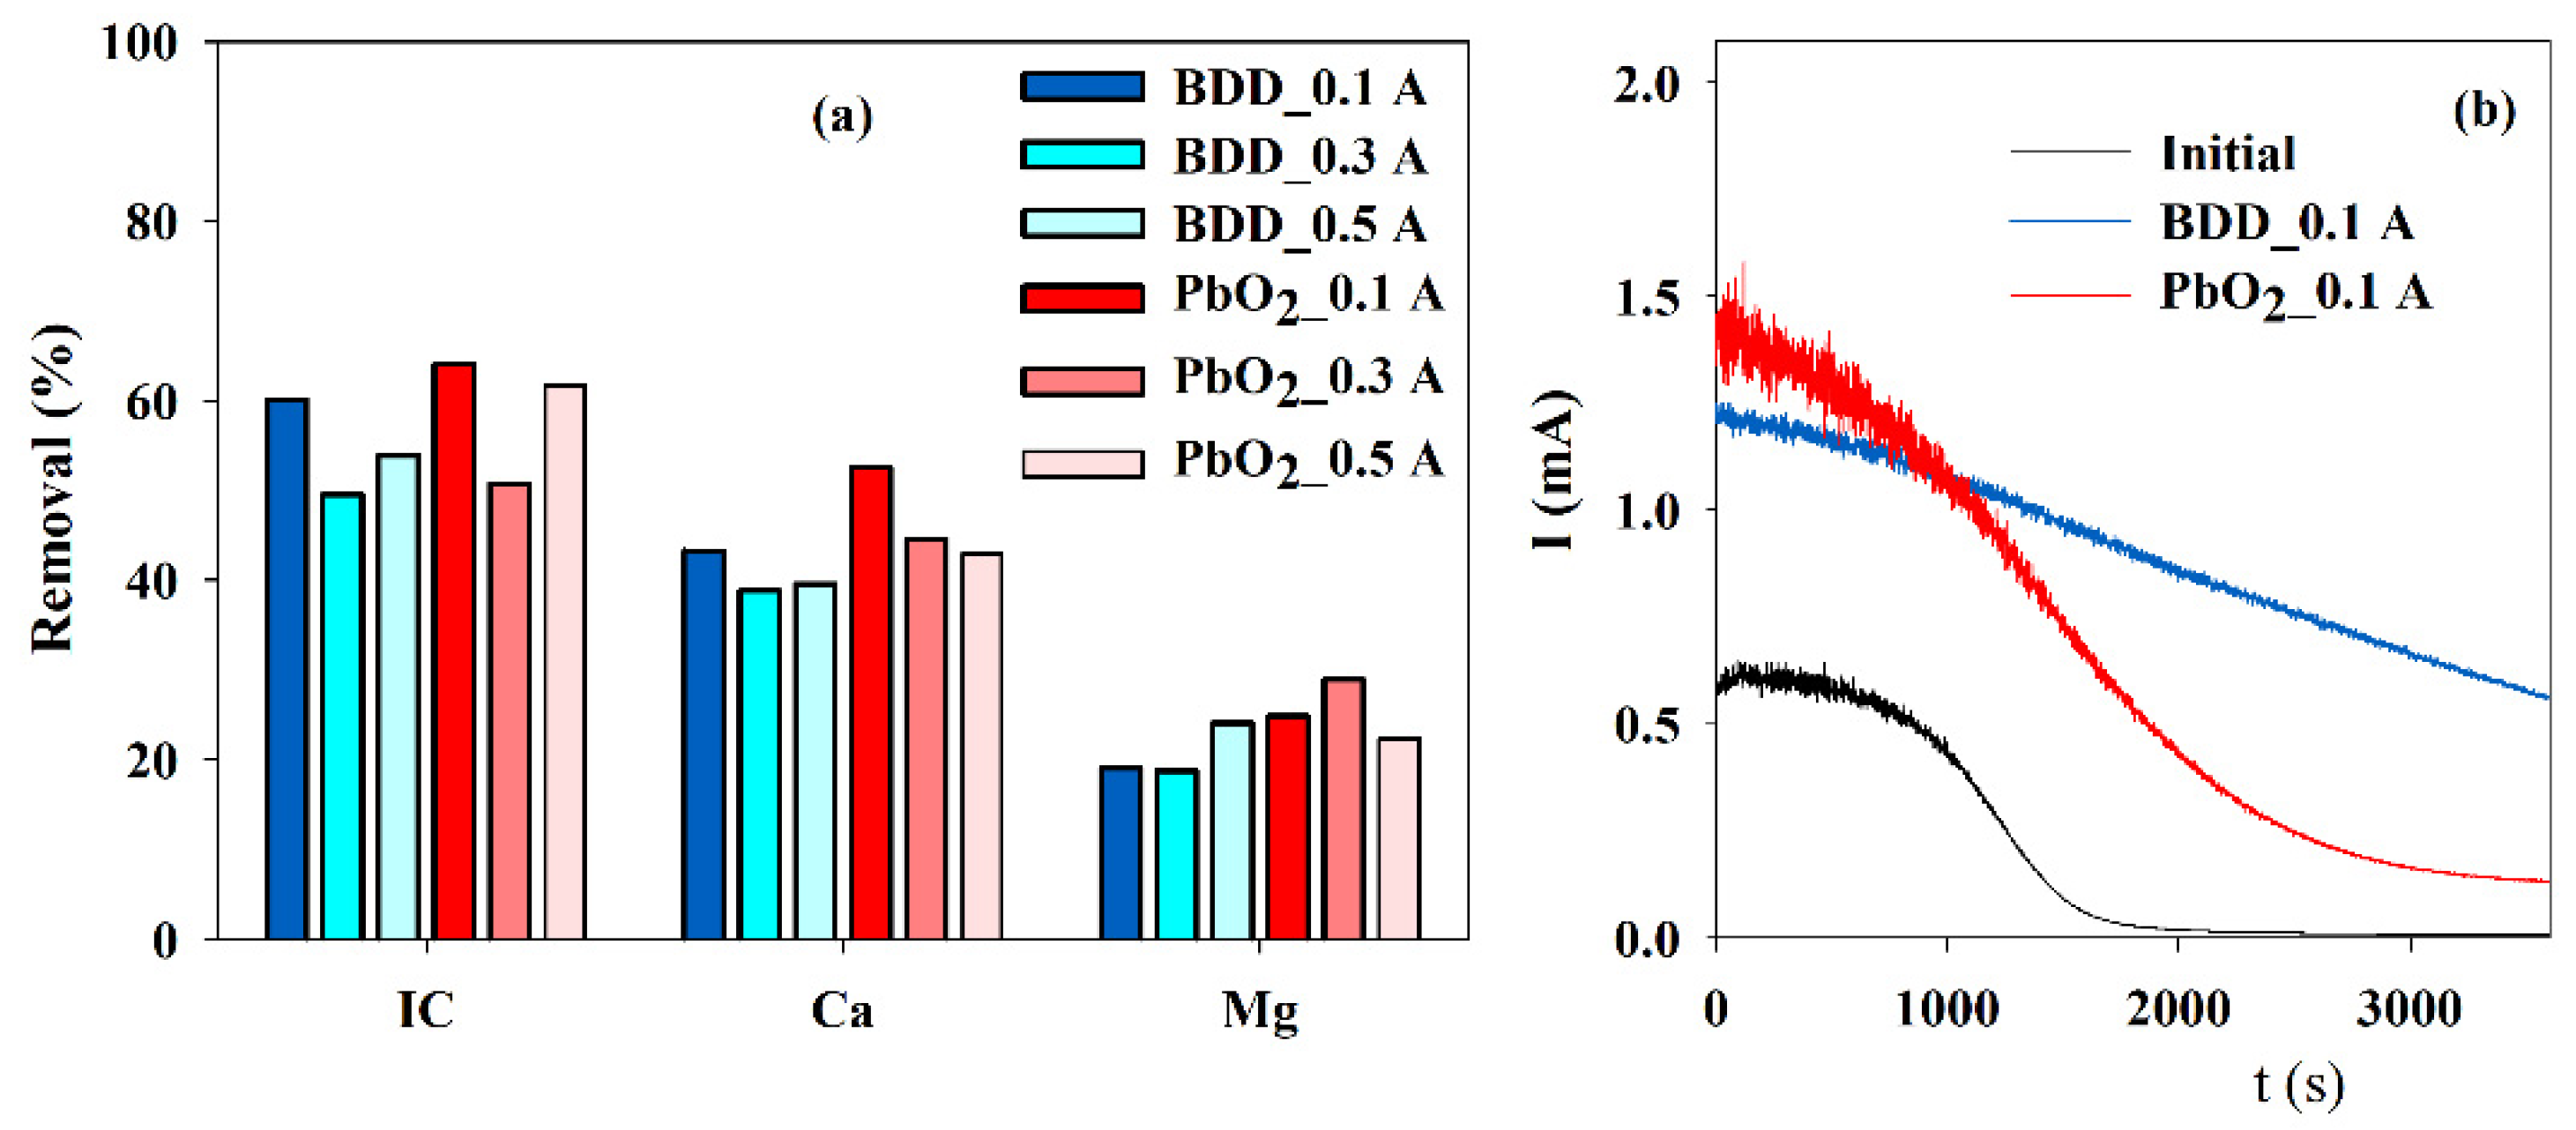
To study the possibility of using cheaper anode material, such as Ti/Pt/PbO2, EE were run at different current intensities using both materials as anode and using a SS cathode with 10 cm2. The best IC, Ca2+, and Mg2+ removals were achieved with Ti/Pt/PbO2, IC, and Ca2+ at 0.1 A and Mg2+ at 0.3 A (Figure 5a). However, when subjected to the accelerated scaling tests, the results obtained with the electrolyzed solution, using a BDD or Ti/Pt/PbO2 as an anode, at 0.1 A current intensity, show that a higher reduction in the current is observed for the solution from the electrolysis run with Ti/Pt/PbO2.
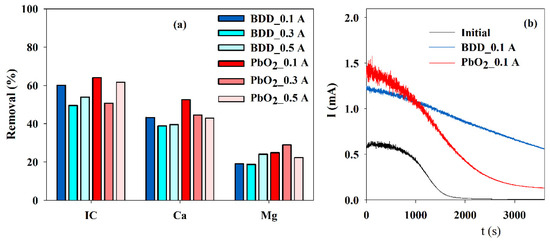
Figure 5.
Influence of the anode material and current intensity on the (a) IC, Ca2+ and Mg2+ removals, during electrolysis (Anode—BDD 20 cm2 or Ti/Pt/PbO2 10 cm2; Cathode—SS 10 cm2; Stirring speed—1000 rpm; 4 h) and on (b) the chronoamperometric tests (E = −0.96 V vs. Ag/AgCl) run with S solution before and after the electrolytic assays run at 0.1 A, with different anode material.
Table 3 shows the final pH, conductivity reduction, and specific energy consumptions for the assays presented in Figure 5. Regarding the final pH of the electrolyzed solutions, the variation was very small, showing a small decrease for all the tests, except for the one performed with a BDD anode at 0.1 A. The reduction in conductivity with the BDD anode was almost independent of the applied current intensity, but for Ti/Pt/PbO2, it increased with the applied current intensity. The specific energy consumptions also increased deeply with applied current. This increase was higher for the EE run with Ti/Pt/PbO2 as the anode, because, for similar applied intensity, the potential difference is much higher for this anode, especially for 0.5 A. Sanjuán and collaborators, during the electrodialysis of synthetic wastewater similar to effluent from a brackish water desalination plant with a 3D stainless-steel wool cathode, obtained an energy consumption of 3.3 kWh/kg CaCO3 (27.5 kWh/kg IC). This was a much lower energy consumption than the values observed for this study [30]. However, the composition of that synthetic wastewater contained several other ions, like chloride, sulfate, nitrate, and a very different hardness and alkalinity that may influence the energy consumption.
Table 3.
Results for the final pH (initial pH = 7.9 ± 0.2), conductivity removal (initial conductivity = 1.7 ± 0.2 mS cm−1) and specific energy consumptions per mass of inorganic carbon or calcium and magnesium removed, during electrolytic assays performed at different current intensities. BDD 20 cm2 or Ti/Pt/PbO2 10 cm2; Cathode—SS 10 cm2; Stirring speed—1000 rpm; 4 h.
3.5. Influence of the Solid Deposit over the Cathode
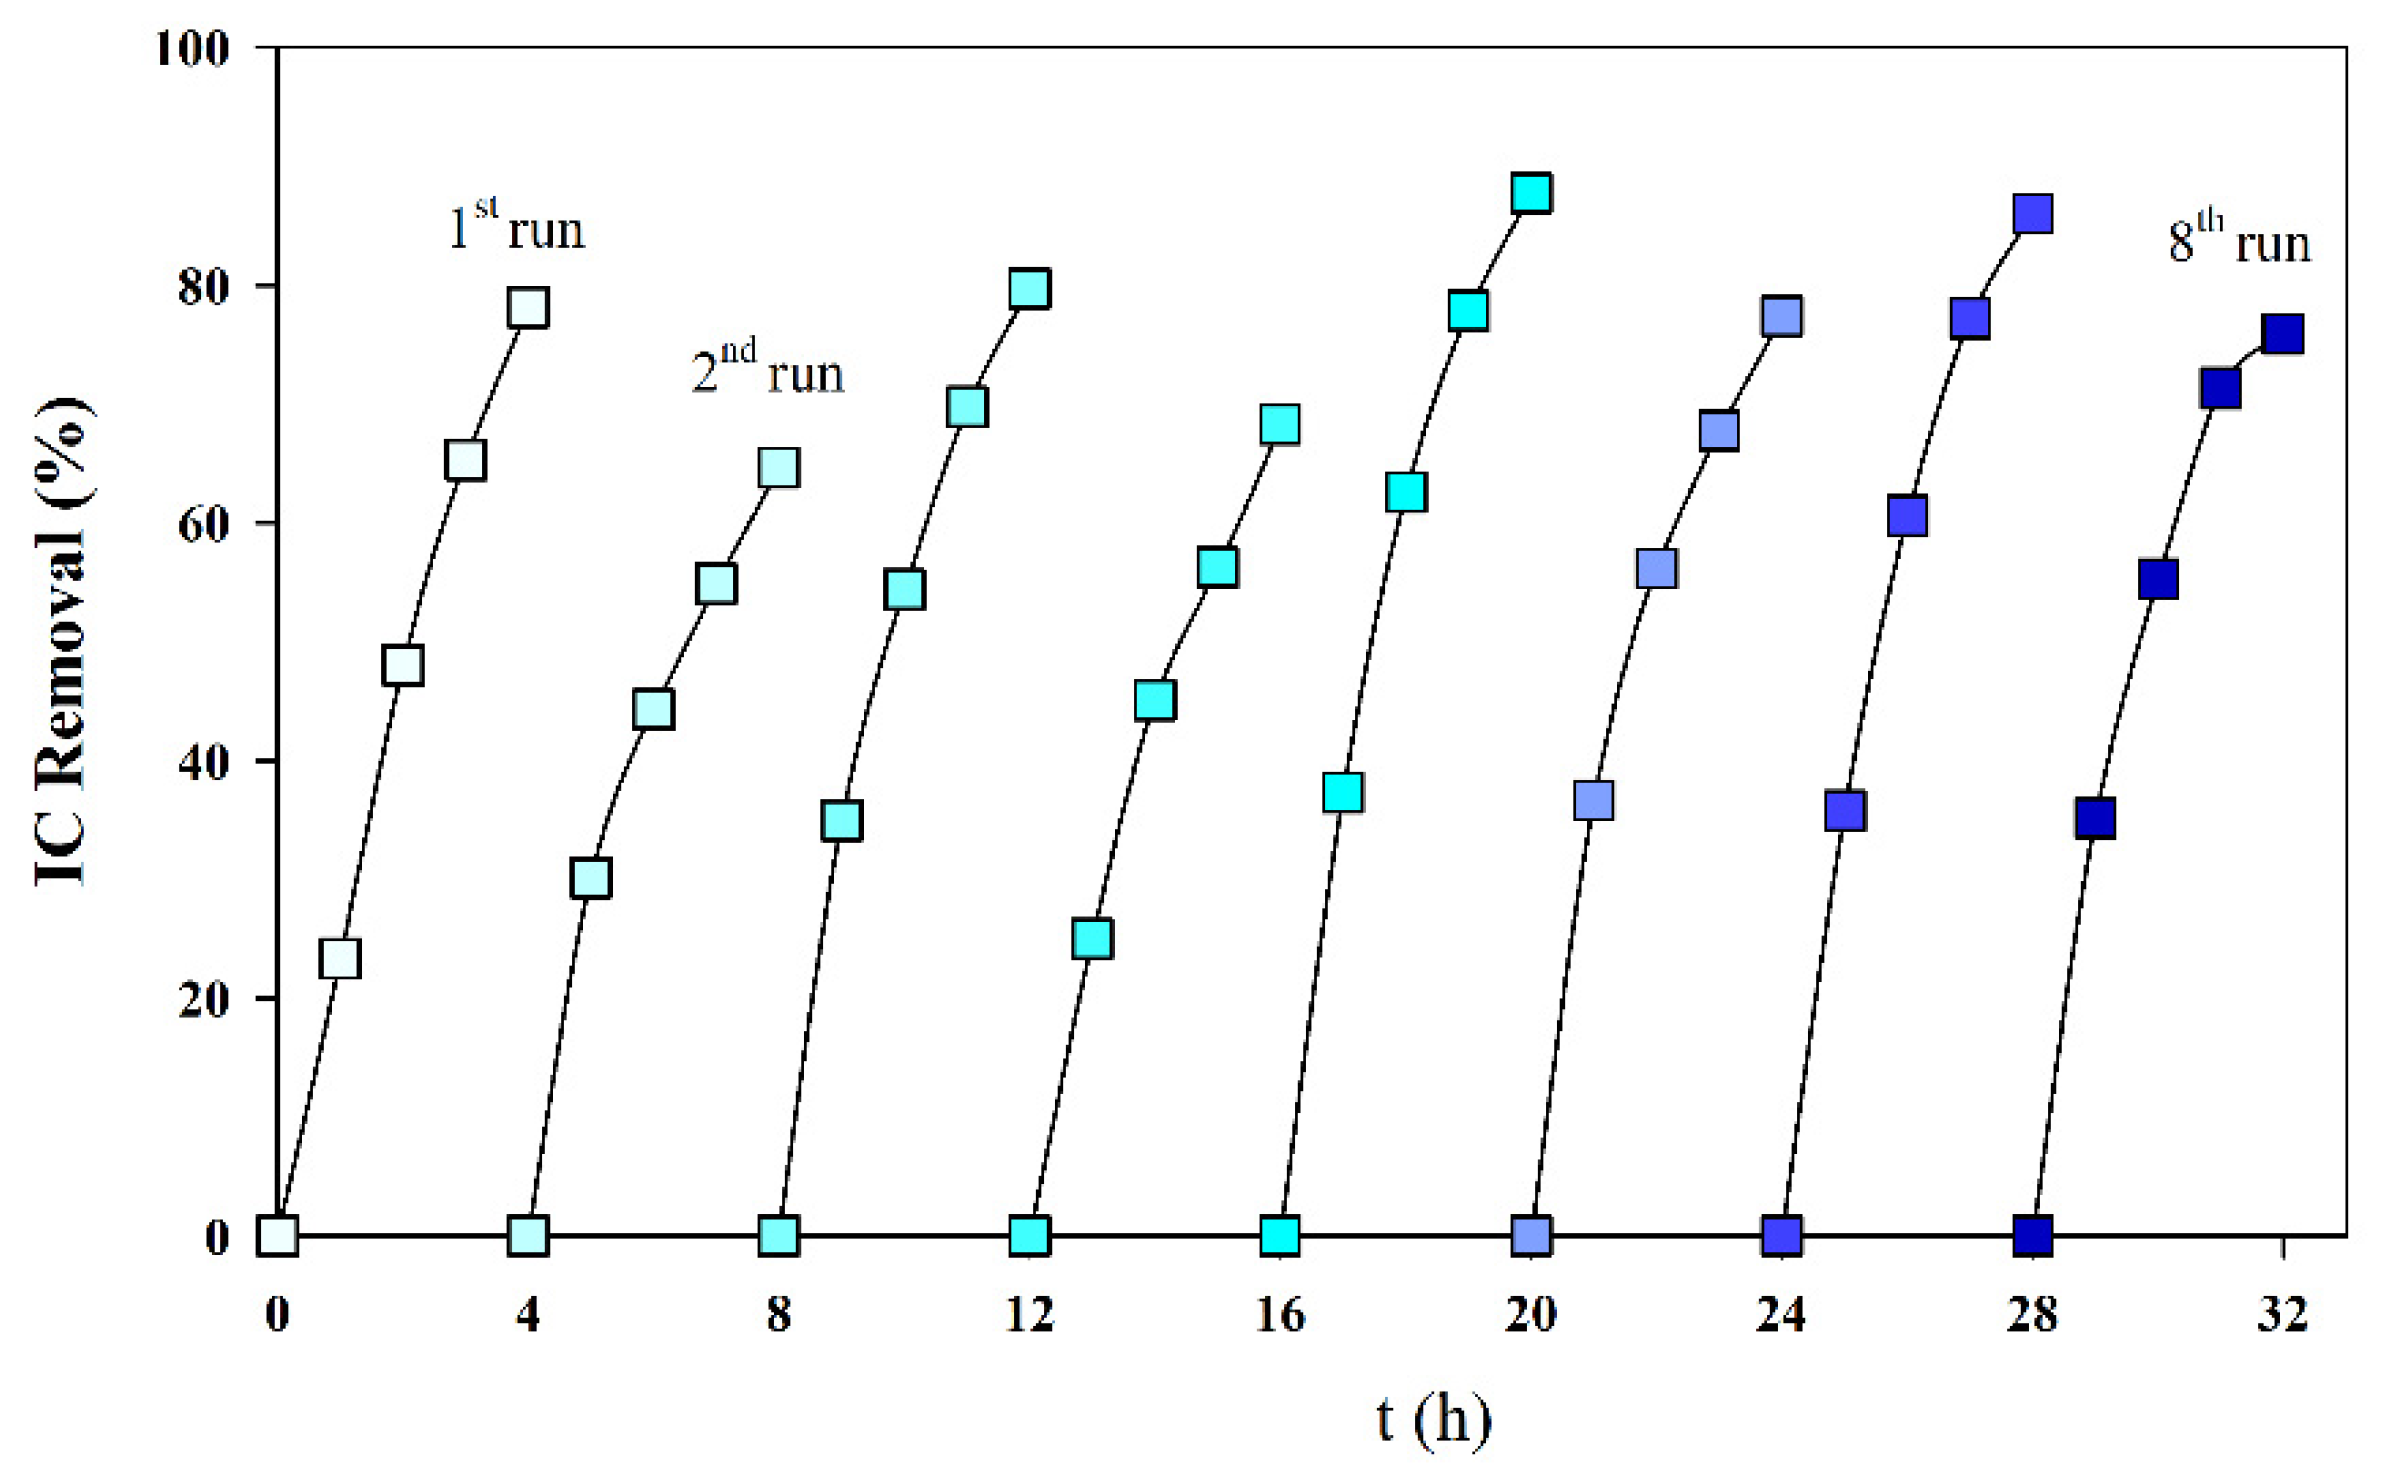
To study the influence of the cathode deposit on the reproducibility of the IC removal, eight consecutive assays were run, with fresh S solutions, without cleaning the cathode deposit formed in the previous assays. Figure 6 presents the obtained results, and it can be observed that the deposit formed did not significantly influence the IC removal. This is a good evaluation for the process scale-up since it is not necessary to clean the cathode often.
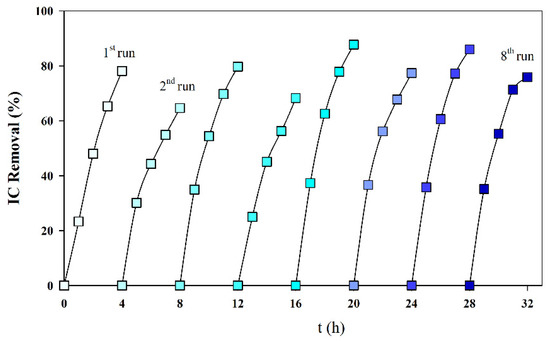
Figure 6.
IC removal in successive galvanostatic assays run without cleaning the deposit formed in the cathode surface. Solution S; I = 0.1 A; Anode—BDD 20 cm2; Cathode—SS 20 cm2; Stirring speed 1000 rpm.
Since during the electrolytic assays, there was deposition of a solid phase on both sides of the cathode, the deposits on the side facing the anode and on the cathode back side were analyzed by EDS (Table 4). The composition of both deposits is slightly different, with higher content in carbon and calcium in the cathode’s side facing the anode and more reach in Mg on the cathode’s backside. Nevertheless, the X-ray diffractograms (Supplementary Material—Figure S1) for both solids present similar crystalline phases, composed of magnesian calcite (Ca,Mg(CO3)) and magnesium oxide carbonate (Mg3O(CO3)2). The data analysis from EDS and X-ray may indicate that the deposit formed on the cathode back surface is richer in Mg3O(CO3)2 than the surface facing the anode. SEM micrographs (Supplementary Material—Figure S2) show different morphologies, already observed in similar studies [28,30]. The crystallites morphology on the cathode back surface was more heterogeneous than the surface facing the anode, with dimensions lower than 10 μm. The different composition on both cathode faces must be related to the electric potential resulting from the different applied currents, the thermodynamics of the formation of the crystals, namely, a balance between the Gibbs free energy of the formation of the different lattice, the spatial rearrange of the ions in the lattice, as well as the solubility products. Thus, the structure more favorable at the applied experimental conditions will be formed first, on the front side of the cathode, and the remaining ions will form other structures on the outer part of the electrode or on the backside.
Table 4.
Medium composition of the solid deposited on both faces of the cathode during 3 different EE assays. Solution S; I = 0.1 A; Anode—BDD 20 cm2; Cathode—SS 20 cm2; Stirring speed 1000 rpm.
3.6. Influence of Ca/Mg Ratio on the IC Removal
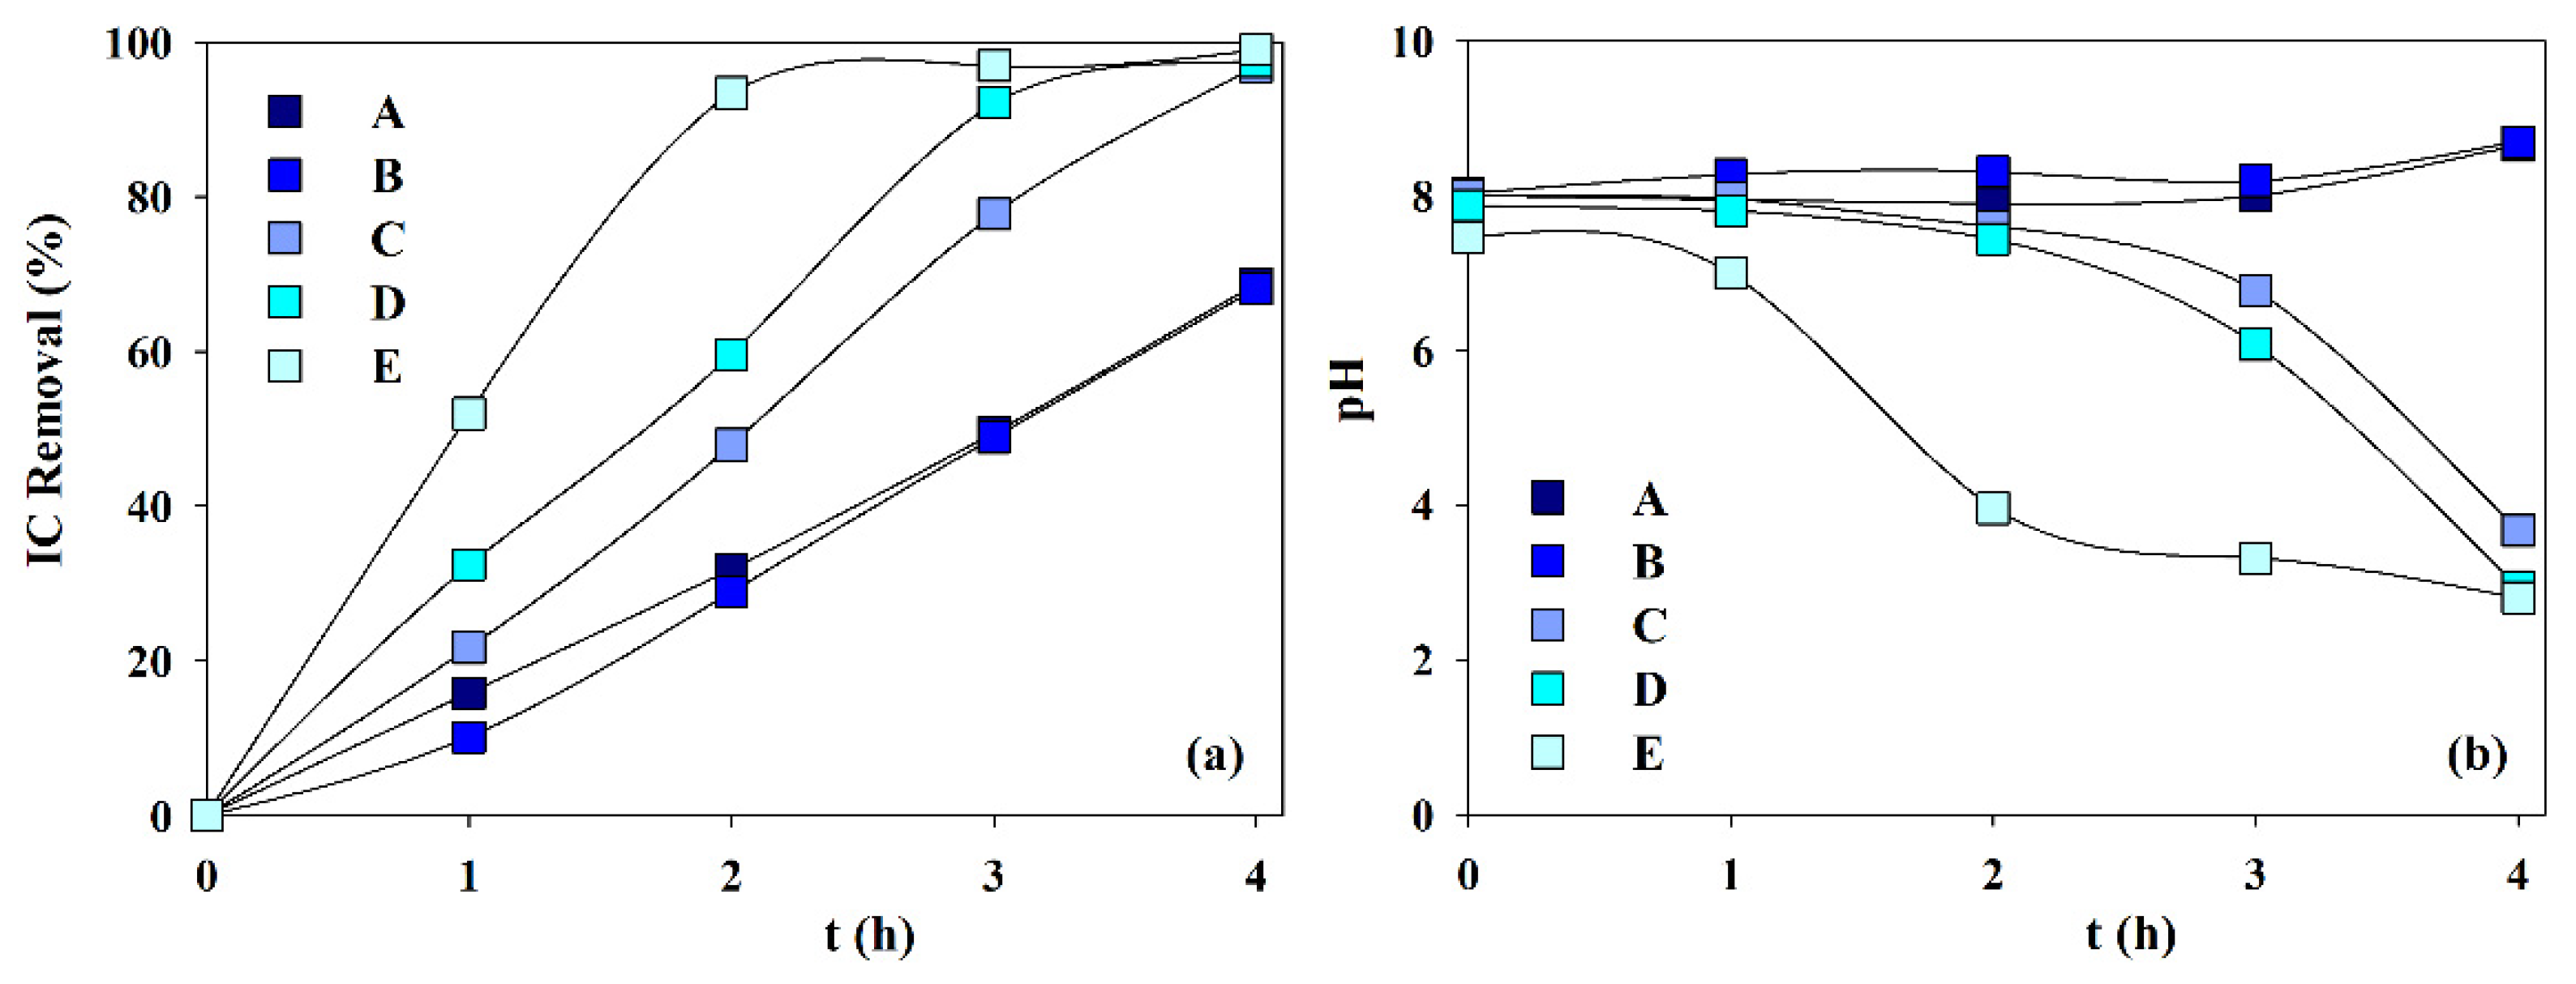
Figure 7 presents the IC removal and pH variation during the electrolytic assays performed with solutions A to E. It can be observed that IC removal increases with calcium ion content and decreases with magnesium ion initial concentration. This must be due to the lower solubility product of the calcium carbonate (8.7 × 10⁻⁹) than that of the magnesium carbonate (4.0 ×10⁻⁵). Regarding pH variation (Figure 7b), for solutions A and B, with none or low calcium content, and both with low IC removal, the existence of high carbonate concentration makes the carbonate buffer effect important, thus keeping a constant pH value. However, when calcium concentration is increased, in solutions C, D, and E, the lower calcium carbonate solubility product makes carbonates precipitation easier, as magnesian calcite, and the buffer effect is reduced and even nullified happens for solution E after 1-h electrolysis. These observations indicate that carbonate removal by electrolysis increases with the Ca/Mg molar ratio.
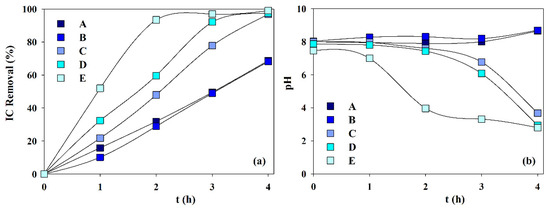
Figure 7.
Effect of samples composition (Table 1) on the (a) inorganic carbon removal and the (b) pH variation during the electrochemical experiments. I = 0.3 A; SS 10 cm2 cathode; BDD 20 cm2 anode; volume 200 mL; stirring speed 300 rpm; 4 h.
4. Conclusions
The removal of carbonates, calcium, and magnesium from simulated hard water by solid electrodeposition, at controlled current intensity, on a stainless-steel cathode was accomplished with success. The deposit formed was composed of magnesian calcite and magnesium oxide carbonate. It was found that magnesium removal is more sensitive to the applied current intensity than calcium or inorganic carbon. The IC, Ca2+, and Mg2+ removals increase with stirring speed, probably due to increased mass transfer from the bulk to the reaction zone and decreased boundary layer thickness. Their removals also increase with cathode area since it offers a higher surface for the solid phase deposition. The solids deposited over the cathode did not offer resistance to posterior deposition and, after seven assays without cleaning the cathode, the IC removal was like that of the first assay. This will allow an easier scale-up of the process since cleaning operations may be delayed. Regarding the utilization of BDD or Ti/Pt/PbO2 as anode material, the best IC, Ca2+ and Mg2+ removal rates were attained with Ti/Pt/PbO2. Still, the accelerated scaling tests showed a higher reduction in the current for the electrolysis run with Ti/Pt/PbO2 anode. The influence of the Ca/Mg initial ratio in the solution composition was also assessed, and it was found that carbonate removal by electrolysis is more effective when the molar ratio Ca/Mg is higher than 1.
Supplementary Materials
The following are available online at https://www.mdpi.com/article/10.3390/w13192752/s1, Figure S1: X-ray diffractogram of the deposit collected on the cathode after electrodeposition assays, with reference to the JCPDS cards data, Figure S2: SEM images of the deposit collected on the (a) front side and (b) back side of the cathode after electrodeposition assays.
Author Contributions
Conceptualization, F.S., Y.B.-B. and A.L.; Data curation, F.S., L.C. and A.L.; Formal analysis, F.S. and A.L.; Investigation, F.S., A.S.R. and A.F.; Methodology, F.S. and A.L.; Project administration, Y.B.-B. and A.L.; Resources, M.J.P.; Software, L.C. and A.L.; Supervision, A.L.; Validation, Y.B.-B. and A.L.; Visualization, A.L.; Writing—original draft, F.S. and A.L.; Writing—review & editing, Y.B.-B., A.F., L.C., M.J.P. and A.L. All authors have read and agreed to the published version of the manuscript.
Funding
This research was funded by Fundação para a Ciência e a Tecnologia, FCT, through the funding of the UID Fiber Materials and Environmental Technologies (FibEnTech-UBI), project UIDB/00195/2020, the contract funding awarded to A. Fernandes, and the grant SFRH/BD/109901/2015 awarded to A.S. Rodrigues. This work was also financed by the Algerian Ministry of Higher Education and Scientific Research (F. Souiad).
Institutional Review Board Statement
Not applicable.
Informed Consent Statement
Not applicable.
Data Availability Statement
Data sharing is not applicable to this article.
Conflicts of Interest
The authors declare no conflict of interest. The funders had no role in the design of the study; in the collection, analyses, or interpretation of data; in the writing of the manuscript, or in the decision to publish the results.
References
- Lédion, J.; Leroy, P.; Labbé, J. Détermination du caractère incrustant d’une eau par un essai d’entartrage accéléré. TSM-L’eau 1985, 7, 323–328. [Google Scholar]
- Gabrielli, C.; Keddam, M.; Maurin, G.; Perrot, H.; Rosset, R.; Zidoune, M. Estimation of the deposition rate of thermal calcareous scaling by the electrochemical impedance technique. J. Electroanal. Chem. 1996, 412, 189–193. [Google Scholar] [CrossRef]
- Lin, W.; Colin, C.; Rosset, R. Caractérisation du pouvoir incrustant d’une eau par chronoampérométrie au potentiel optimal d’entartrage. TSM-L’eau 1990, 12, 613–620. [Google Scholar]
- Ketrane, R.; Leleyter, L.; Baraud, F.; Jeannin, M.; Gil, O.; Saidani, B. Characterization of natural scale deposits formed in southern Algeria groundwater. Effect of its major ions on calcium carbonate precipitation. Desalination 2010, 262, 21–30. [Google Scholar] [CrossRef]
- Ben-aazza, S.; Hadfi, A.; Mohareb, S.; Karmal, I.; Belattar, M.; Hafid, N.; Driouiche, A. Geochemical characterization and thermodynamic study of water scaling phenomenon at Tiznit region in Southern Morocco. Groundw. Sustain. Dev. 2020, 11, 100379. [Google Scholar] [CrossRef]
- Zhang, P.; Hu, J.; Li, W.; Qi, H. Research progress of brackish water desalination by reverse osmosis. J. Water Resour. Prot. 2013, 5, 304–309. [Google Scholar] [CrossRef] [Green Version]
- Badruzzaman, M.; Voutchkov, N.; Weinrich, L.; Jacangelo, J.G. Selection of pretreatment technologies for seawater reverse osmosis plants: A review. Desalination 2019, 449, 78–91. [Google Scholar] [CrossRef]
- Li, X.; Hasson, D.; Semiat, R.; Shemer, H. Intermediate concentrate demineralization techniques for enhanced brackish water reverse osmosis water recovery—A review. Desalination 2019, 466, 24–35. [Google Scholar] [CrossRef]
- Anis, S.F.; Hashaikeh, R.; Hilal, N. Reverse osmosis pretreatment technologies and future trends: A comprehensive review. Desalination 2019, 452, 159–195. [Google Scholar] [CrossRef] [Green Version]
- Matin, A.; Rahman, F.; Shaf, H.Z.; Zubair, S.M. Scaling of reverse osmosis membranes used in water desalination: Phenomena, impact, and control; future directions. Desalination 2019, 455, 135–157. [Google Scholar] [CrossRef]
- Goh, P.S.; Lau, W.J.; Othman, M.H.D.; Ismail, A.F. Membrane fouling in desalination and its mitigation strategies. Desalination 2018, 425, 130–155. [Google Scholar] [CrossRef]
- Demadis, K.D.; Neofotistou, E.; Mavredaki, E.; Tsiknakis, M.; Sarigiannidou, E.-M.; Katarachia, S.D. Inorganic foulants in membrane systems: Chemical control strategies and the contribution of “green chemistry”. Desalination 2005, 179, 281–295. [Google Scholar] [CrossRef]
- Rosset, R.; Sok, P.; Poindessous, G.; Amor, M.B.; Walha, K. Caractérisation de la compacité des dépôts de carbonate de calcium d’eaux géothermales du Sud tunisien par impédancemétrie. Comptes Rendus De L’académie Des Sci.-Ser. IIC-Chem. 1998, 1, 751–759. [Google Scholar] [CrossRef]
- Bouchkima, B. L’eau de la nappe albienne du sud algérien. Journées Tech. Et Sci. Sur La Qual. Des Eaux Du Sud El-Oued 2003, III, 39–51. [Google Scholar]
- Rakitin, A.R.; Kichigin, V.I. Electrochemical study of calcium carbonate deposition on iron. Effect of the anion. Electrochim. Acta 2009, 54, 2647–2654. [Google Scholar] [CrossRef]
- Kettab, A. Les ressources en eau en Algérie: Stratégies, enjeux et vision. Desalination 2001, 136, 25–33. [Google Scholar] [CrossRef]
- Zeppenfeld, K. Prevention of CaCO3 scale formation by trace amounts of copper (II) in comparison to zinc (II). Desalination 2010, 252, 60–65. [Google Scholar] [CrossRef]
- Gritli, M.; Cheap-Charpentier, H.; Horner, O.; Perrot, H.; Amor, Y.B. Scale inhibition properties of metallic cations on CaCO3 formation using fast controlled precipitation and a scaling quartz microbalance. Desalin. Water Treat. 2019, 167, 113–121. [Google Scholar] [CrossRef]
- Gu, X.; Qiu, F.; Zhou, X.; Qi, J.; Zhou, Y.; Yang, D.; Guo, Q.; Guo, X. Synthesis and application of terpolymer scale inhibitor in the presence of β-cyclodextrins. J. Pet. Sci. Eng. 2013, 109, 177–186. [Google Scholar] [CrossRef]
- Ghizellaoui, S.; Lédion, J.; Ghizellaoui, S.; Chibani, A. Etude de l’inhibition du pouvoir entartrant des eaux du Hamma par précipitation contrôlée rapide et par un essai d’entartrage accéléré. Desalination 2004, 166, 315–327. [Google Scholar] [CrossRef]
- Belarbi, Z.; Gamby, J.; Makhloufi, L.; Sotta, B.; Tribollet, B. Inhibition of calcium carbonate precipitation by aqueous extract of Paronychia argentea. J. Cryst. Growth 2014, 386, 208–214. [Google Scholar] [CrossRef] [Green Version]
- Menzri, R.; Ghizellaoui, S.; Tlili, M. Calcium carbonate inhibition by green inhibitors: Thiamine and Pyridoxine. Desalination 2017, 404, 147–154. [Google Scholar] [CrossRef]
- Dirany, A.; Drogui, P.; El Khakani, M.A. Clean electrochemical deposition of calcium carbonate to prevent scale formation in cooling water systems. Environ. Chem. Lett. 2016, 14, 507–514. [Google Scholar] [CrossRef]
- Karoui, H.; Riffault, B.; Jeannin, M.; Kahoul, A.; Gil, O.; Amor, M.B.; Tlili, M.M. Electrochemical scaling of stainless steel in artificial seawater: Role of experimental conditions on CaCO3 and Mg(OH)2 formation. Desalination 2013, 311, 234–240. [Google Scholar] [CrossRef]
- Gabrielli, C.; Keddam, M.; Khalil, A.; Maurin, G.; Perrot, H.; Rosset, R.; Zidoune, M. Quartz crystal microbalance investigation of electrochemical calcium carbonate scaling. J. Electrochem. Soc. 1998, 145, 2386–2396. [Google Scholar] [CrossRef]
- Amzert, S.A.; Arbaoui, F.; Boucherit, M.N.; Selmi, N.; Hanini, S. Electrodeposition of CaCO3 on stainless steel 316 L substrate: Influence of thermal-hydraulics and electrochemical parameters. Alger. J. Eng. Technol. 2021, 4, 90–98. [Google Scholar]
- Edvardsen, L.; Gawel, K.; Wenner, S.; Gawel, B.; Torsæter, M. Electrochemical enhancement and inhibition of calcium carbonate deposition. J. Environ. Chem. Eng. 2020, 8, 104239. [Google Scholar] [CrossRef]
- Park, J.M.; Lee, M.H.; Lee, S.H. Characteristics and Crystal Structure of Calcareous Deposit Films Formed by Electrodeposition Process in Artificial and Natural Seawater. Coatings 2021, 11, 359. [Google Scholar] [CrossRef]
- Lei, Y.; Hidayat, I.; Saakes, M.; van der Weijden, R.; Buismana, J.N. Fate of calcium, magnesium and inorganic carbon in electrochemical phosphorus recovery from domestic wastewater. Chem. Eng. J. 2019, 362, 453–459. [Google Scholar] [CrossRef]
- Sanjuán, I.; Benavente, D.; García-García, V.; Expósito, E.; Montiel, V. Electrochemical softening of concentrates from an electrodialysis brackish water desalination plant: Efficiency enhancement using a three-dimensional cathode. Sep. Purif. Technol. 2019, 208, 217–226. [Google Scholar] [CrossRef] [Green Version]
- Andrade, L.S.; Rutuolo, L.A.M.; Rocha-Filho, R.C.; Bocchi, N.; Biaggio, S.; Iniesta, J.; García-Garcia, V.; Montiel, V. On the performance of Fe and Fe,F doped Ti–Pt/PbO2 electrodes in the electrooxidation of the Blue Reactive 19 dye in simulated textile wastewater. Chemosphere 2007, 66, 2035–2043. [Google Scholar] [CrossRef] [PubMed]
- Ciríaco, L.; Anjo, C.; Correia, J.; Pacheco, M.J.; Lopes, A. Electrochemical degradation of Ibuprofen on Ti/Pt/PbO2 and Si/BDD electrodes. Electrochim. Acta 2009, 54, 1464–1472. [Google Scholar] [CrossRef]
- Labiadh, L.; Fernandes, A.; Ciríaco, L.; Pacheco, M.J.; Gadri, A.; Ammar, S.; Lopes, A. Electrochemical treatment of concentrate from reverse osmosis of sanitary landfill leachate. J. Environ. Manag. 2016, 181, 515–521. [Google Scholar] [CrossRef] [PubMed]


Publisher’s Note: MDPI stays neutral with regard to jurisdictional claims in published maps and institutional affiliations. |
© 2021 by the authors. Licensee MDPI, Basel, Switzerland. This article is an open access article distributed under the terms and conditions of the Creative Commons Attribution (CC BY) license (https://creativecommons.org/licenses/by/4.0/).