Adsorption Performance of Modified Fly Ash for Copper Ion Removal from Aqueous Solution


 ,
,  ,
, 

 and
and 
Abstract
1. Introduction
2. Materials and Methods
2.1. Materials
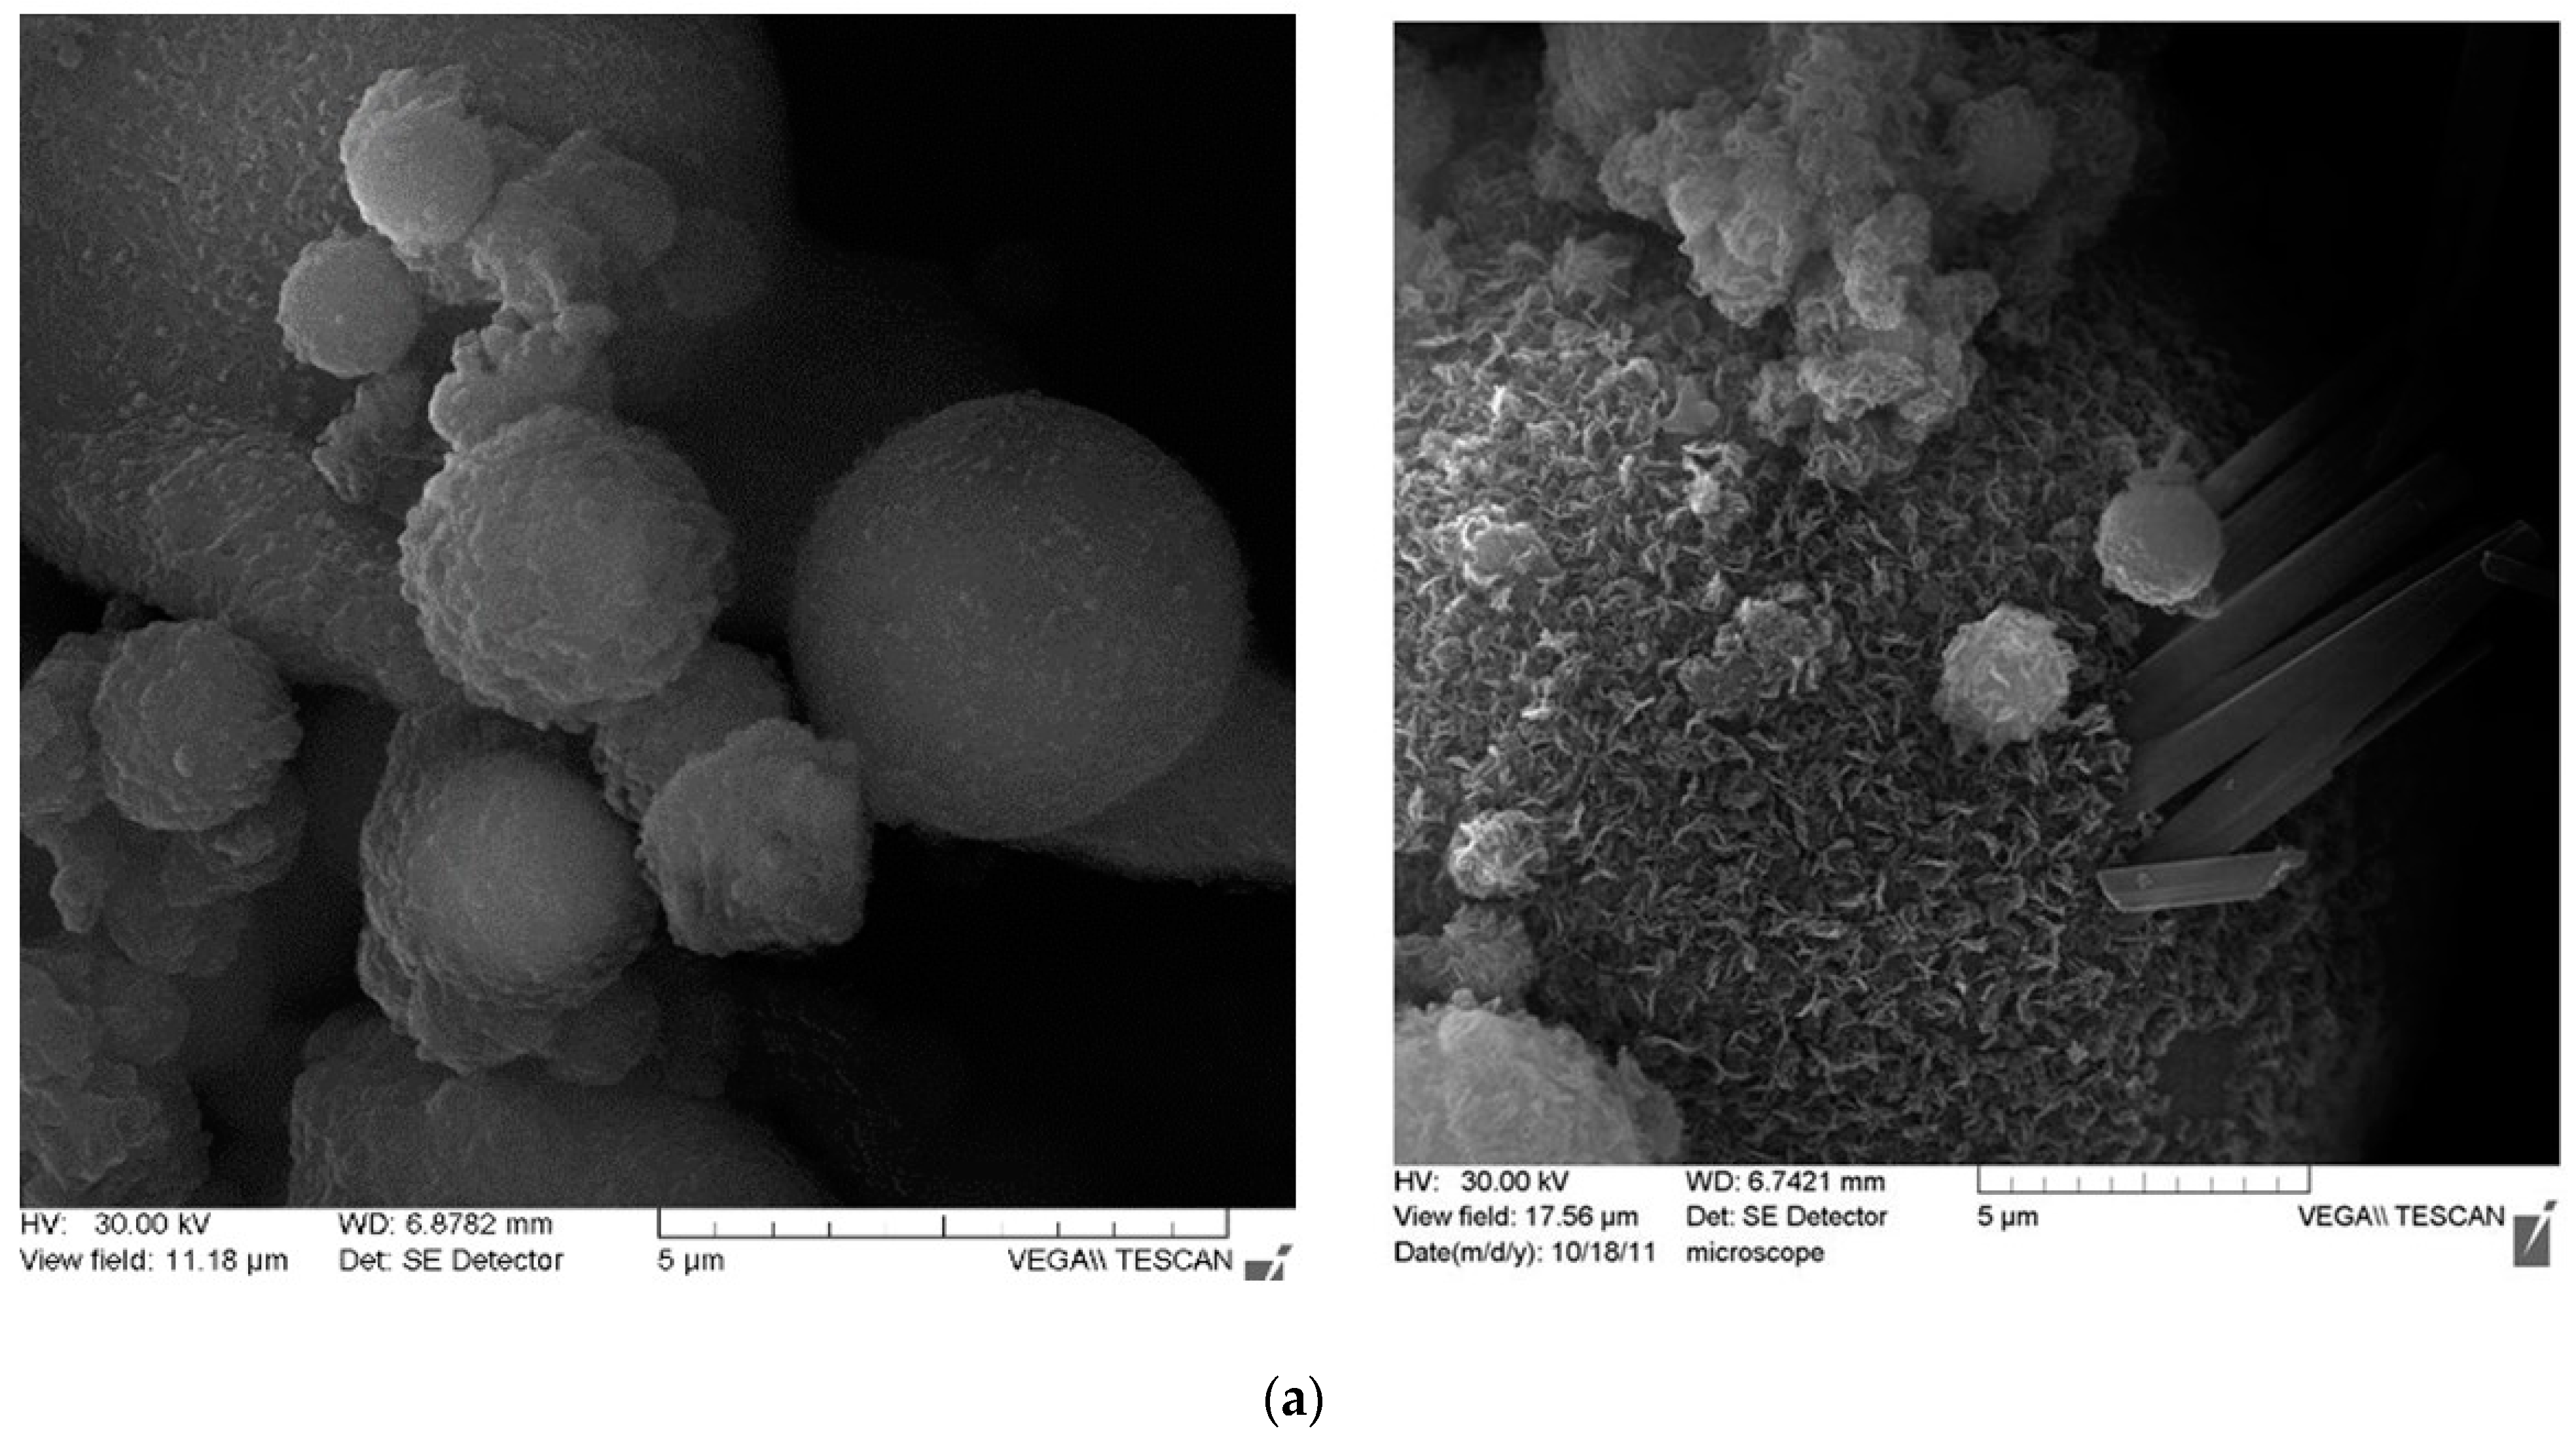
- The morphology and the chemical composition were determined using a Vega Tescan 3 SBH (Brno, Czech Republic) and a QUANTA 3D-AL99/D8229 (FEI Company, Hillsboro, OR, USA);
- The determination of the trace elements was performed using instrumental neutron activation analysis (INAA) at the 2 MW pool-type research reactor of the Technical University of Delph (Delph, The Netherlands) combined with high resolution c-ray spectroscopy.
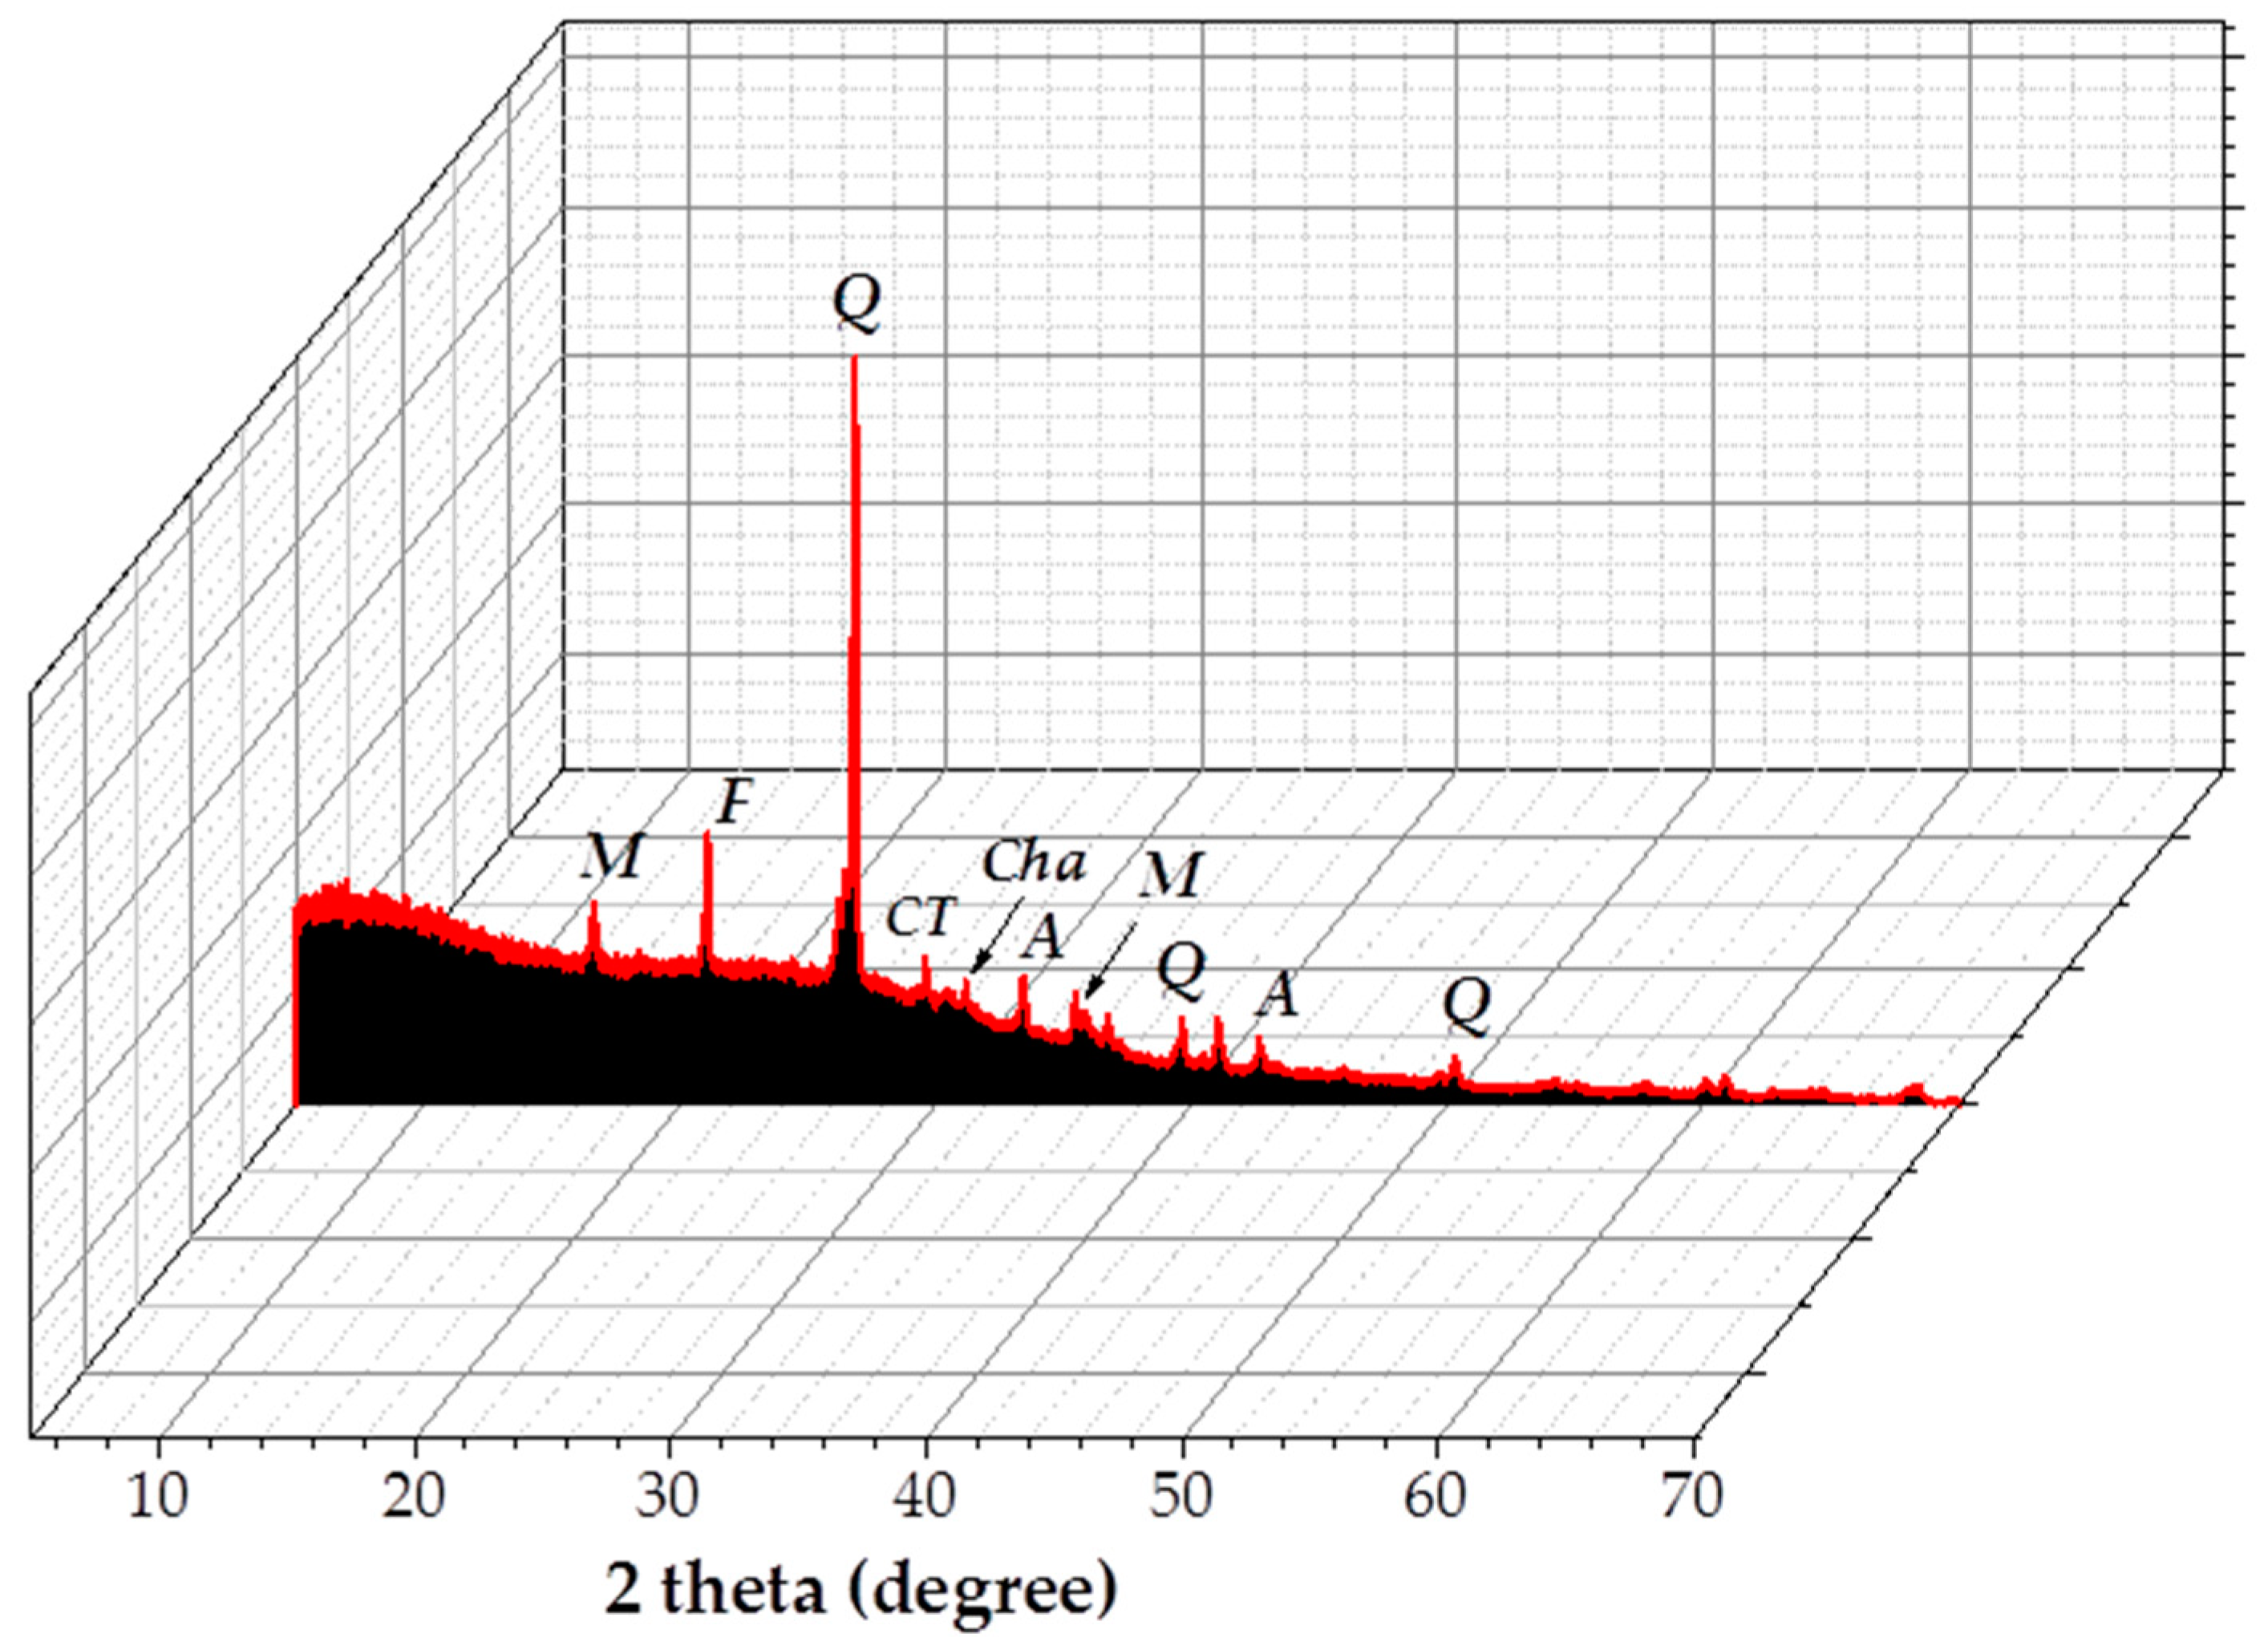
- The X-ray diffraction pattern was recorded using an X’PERT PRO MRD Diffractometer (PANalytical, Almelo, The Netherlands);
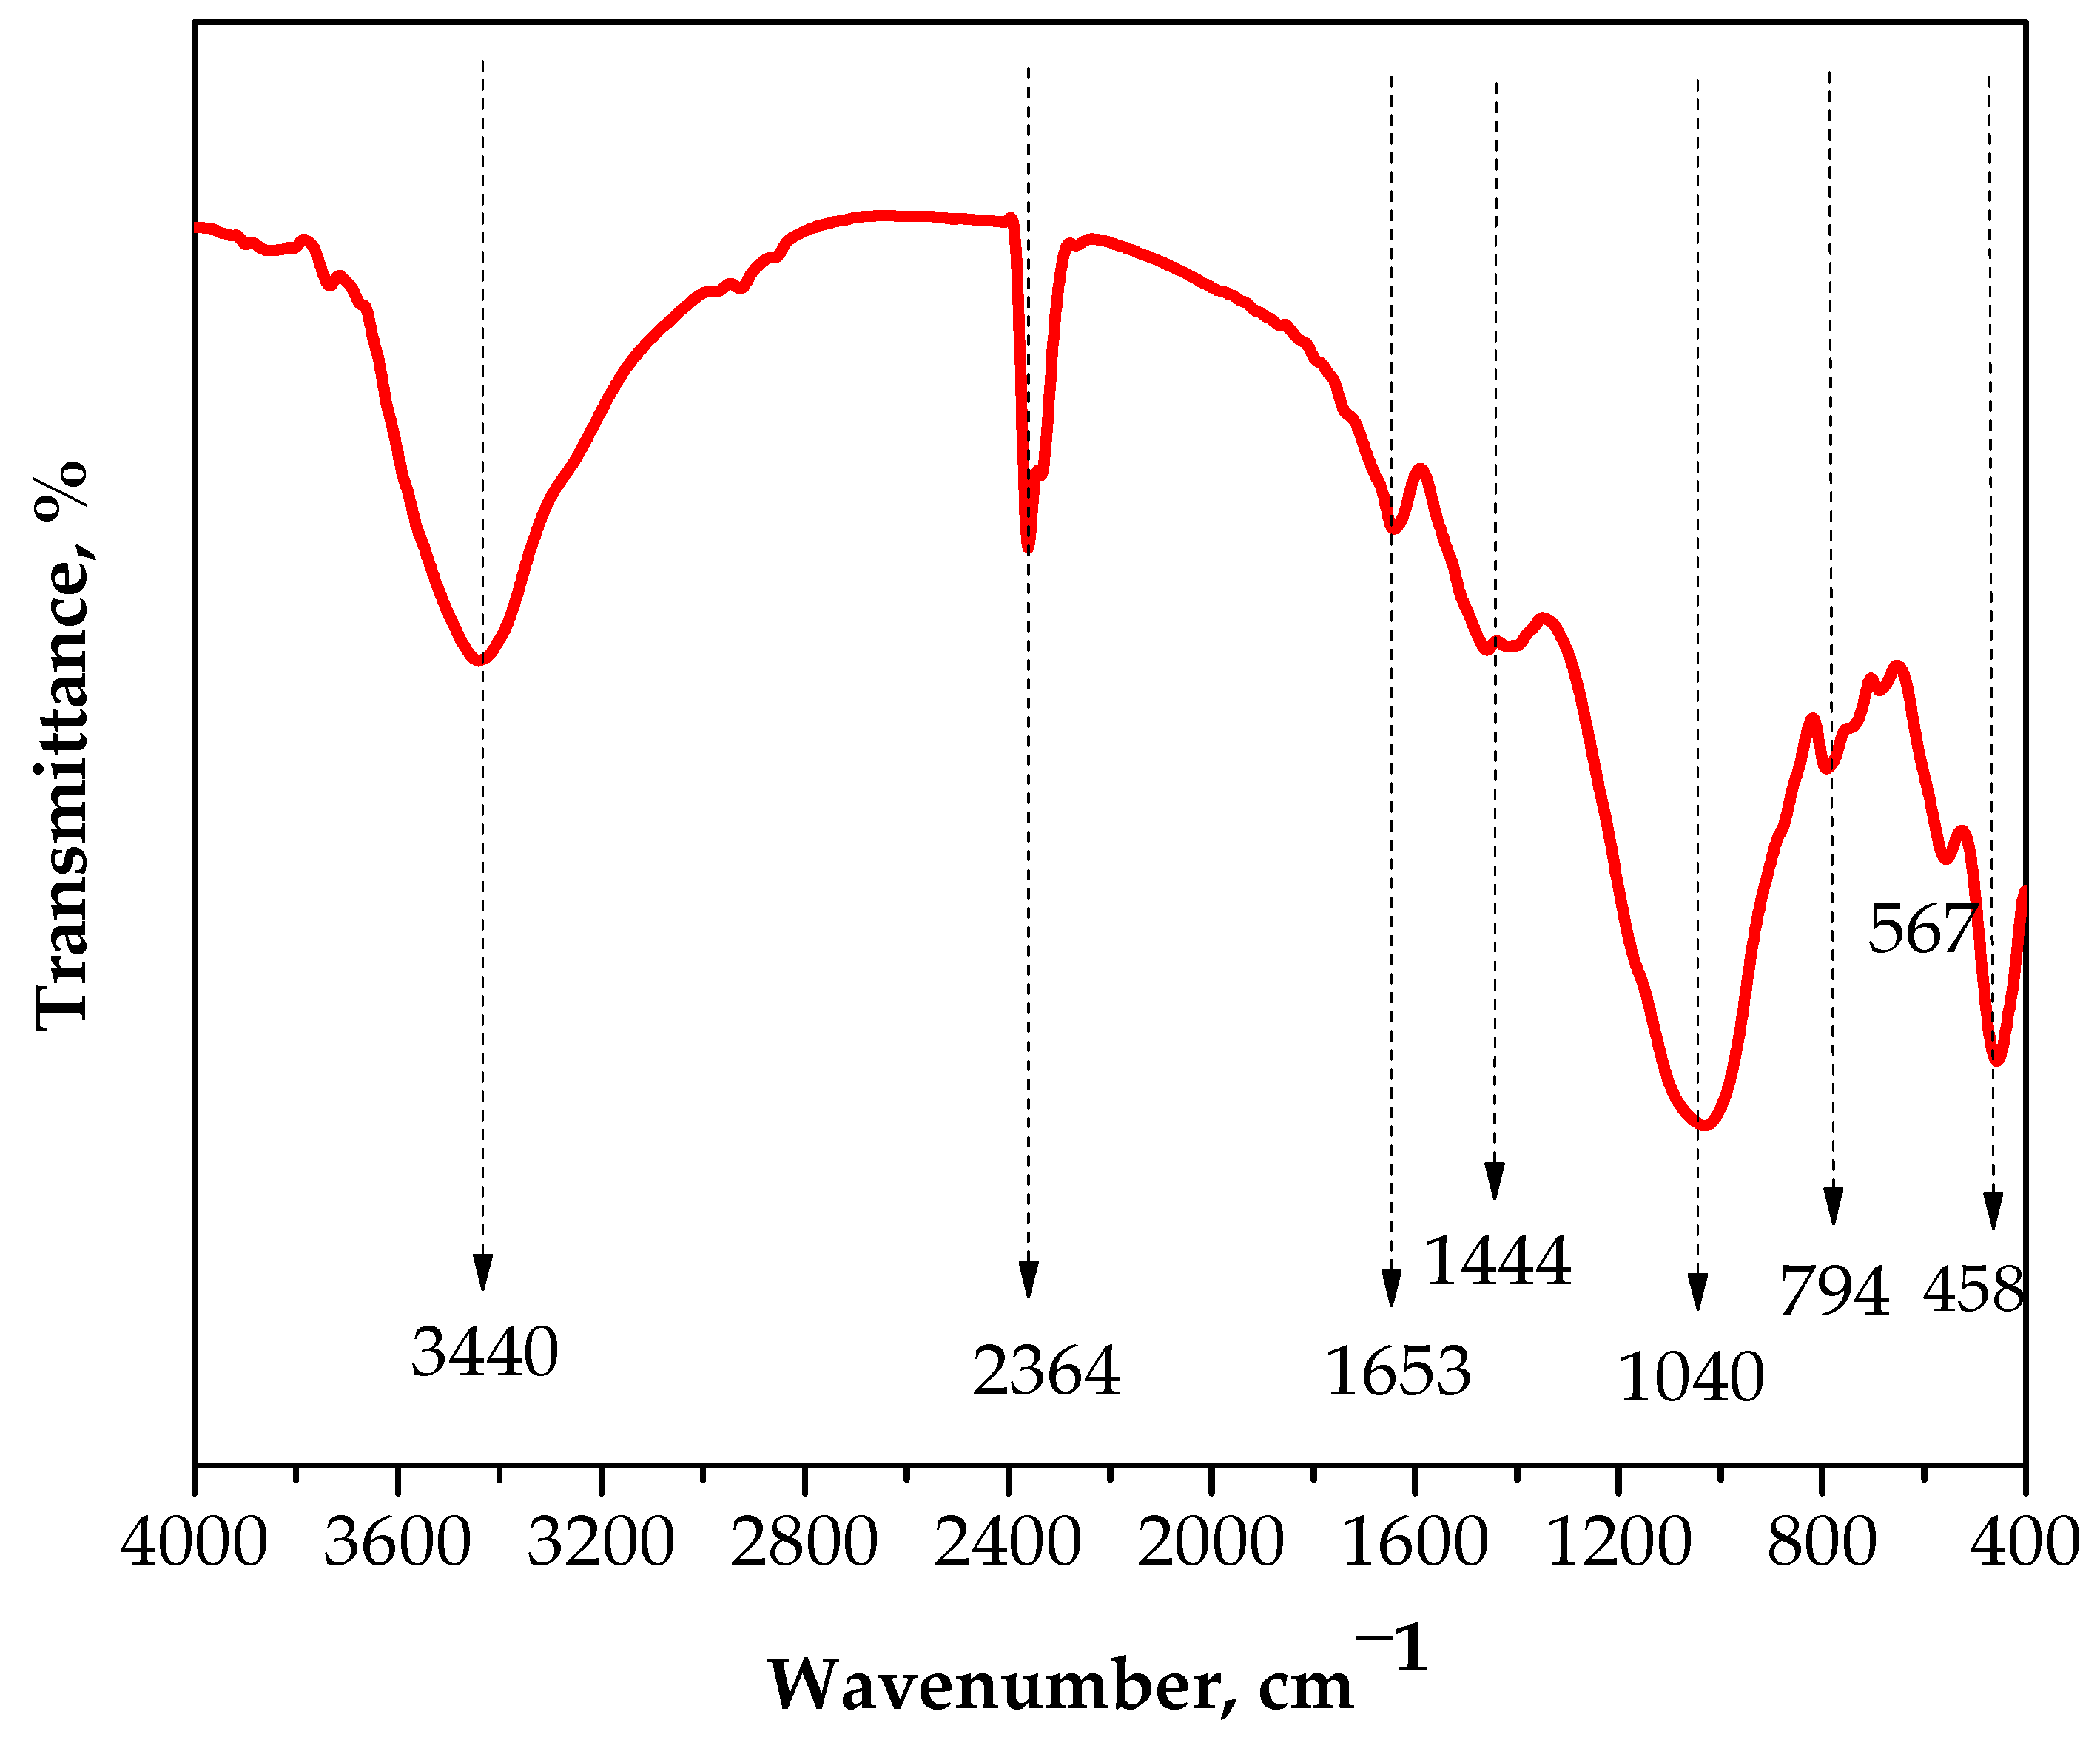
- Fourier transform infrared spectroscopy (FTIR) was performed on a Thermo Scientific Nicolet 6700 FT-IR spectrometer;
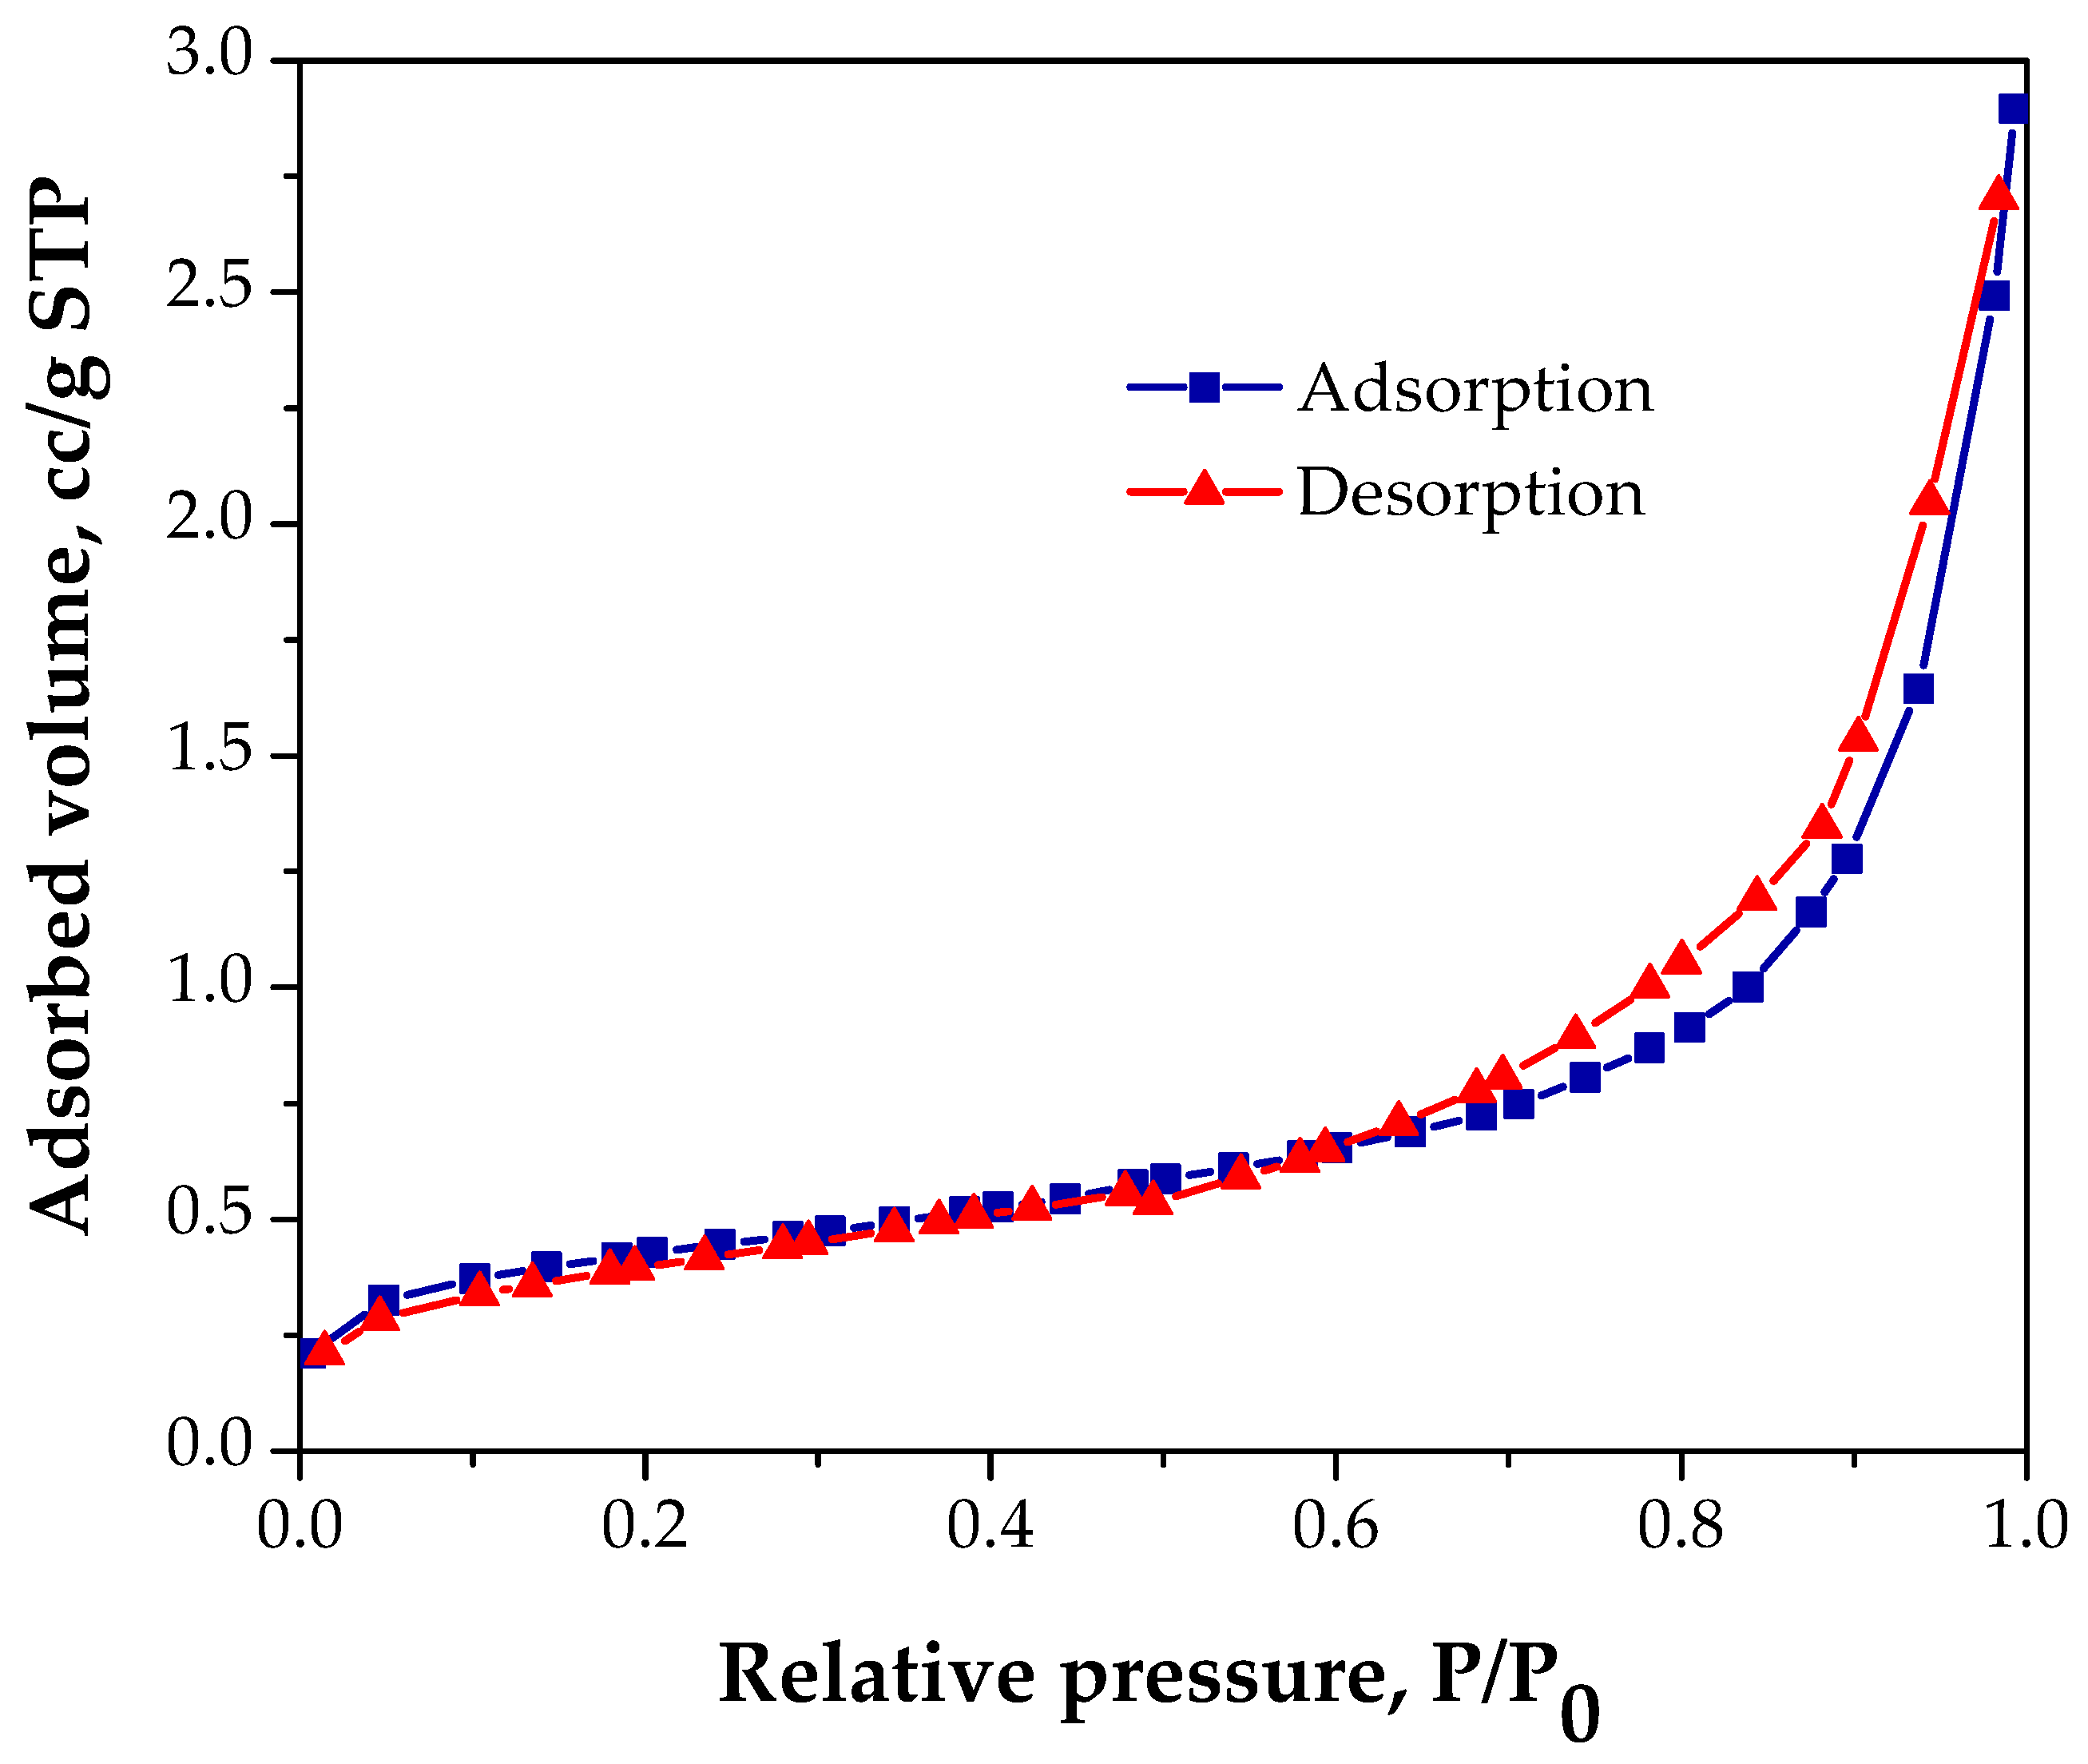
- Nitrogen physical sorption was carried out at –196 °C on an Autosorb 1-MP gas sorption system (Quantachrome Instruments, Boynton Beach, FL, USA);
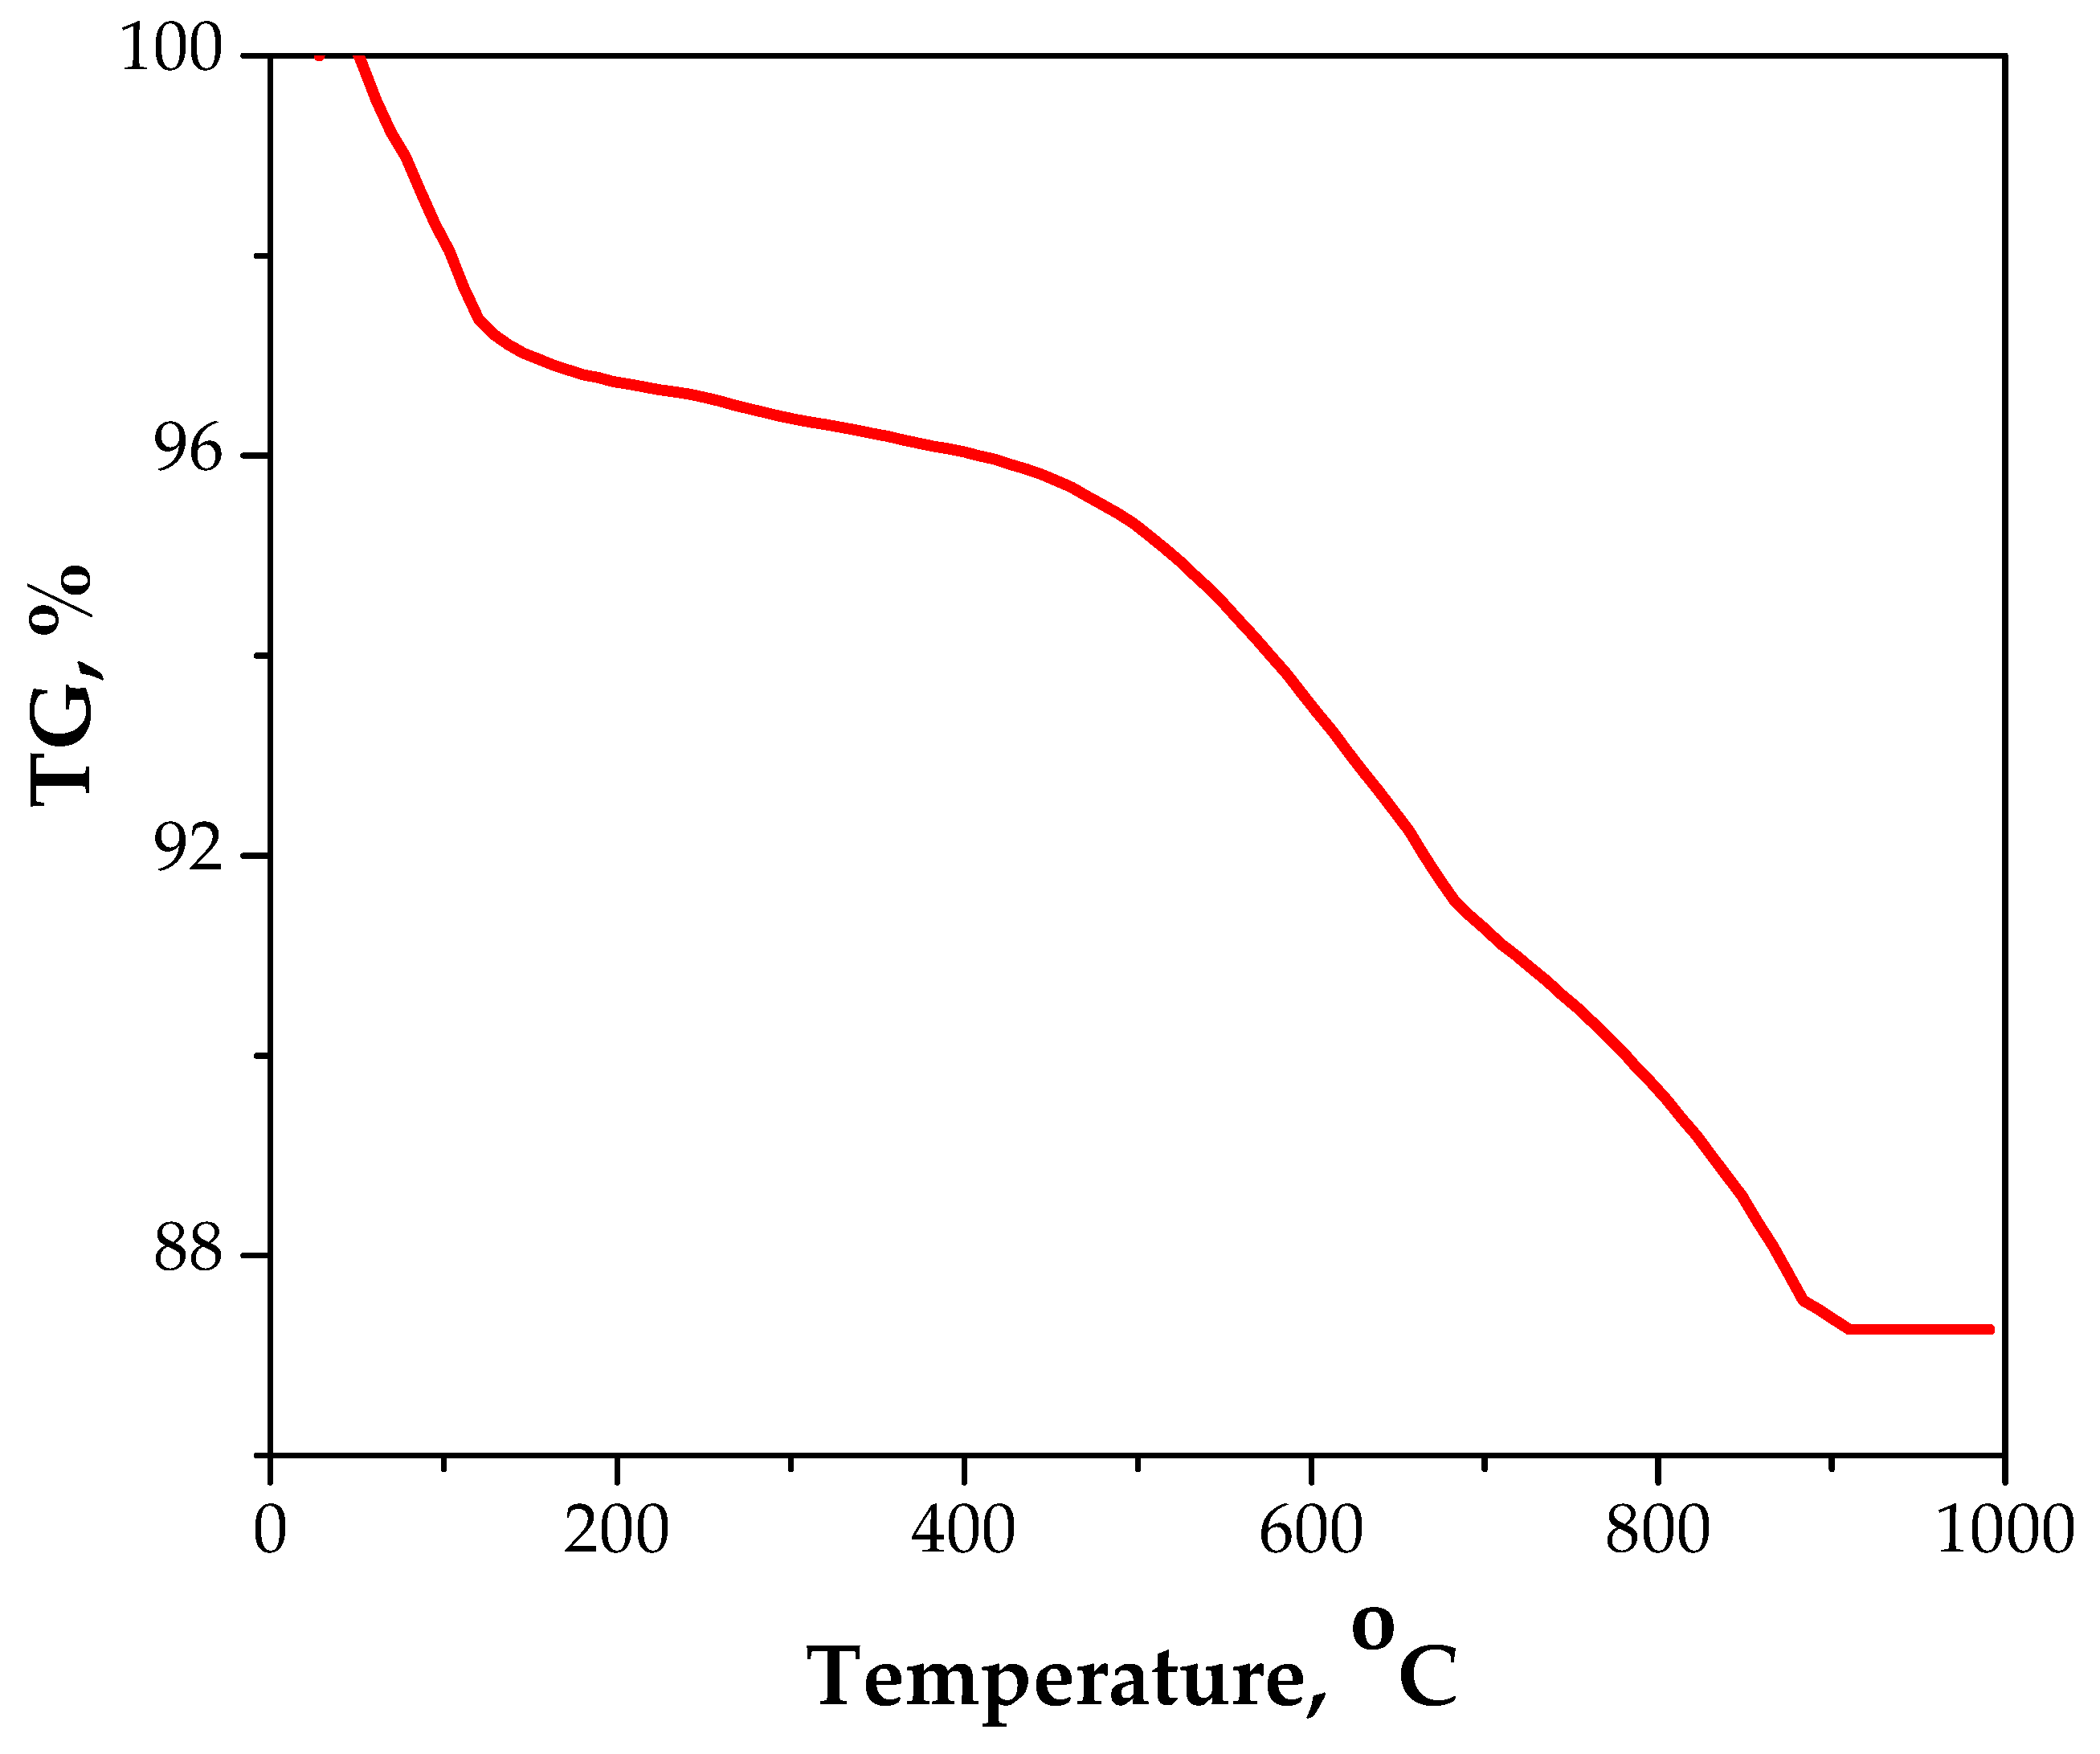
- The thermal analysis was performed with a METTLER TOLEDO TGA/SDTA 851;
- The pH was measured with a pH-meter (Hanna Instruments, Cluj-Napoca, Romania), while a Spectrophotometer Buck Scientific was used for copper ion detection (Buck Scientific, East Norwalk, CT, USA).
2.2. Adsorbent Synthesis
2.3. Experimental Procedure
3. Results
3.1. Characterization of Adsorbent
- Through this analysis, more than 30 elements in a sample can be analyzed, even if the elements are found in low levels;
- It does not require a large quantity of the sample.
- At 43.90 °C and 82.55 °C, when the loss of moisture occurs (1.81 and 2.22%, respectively);
- At 500.45 °C, when the loss of crystallization water takes place (2.32%);
- Between 778.72 and 900 °C, due to the decarbonation of the structure (3.81%).
3.2. Effect of Adsorption Parameters
3.2.1. Effect of pH
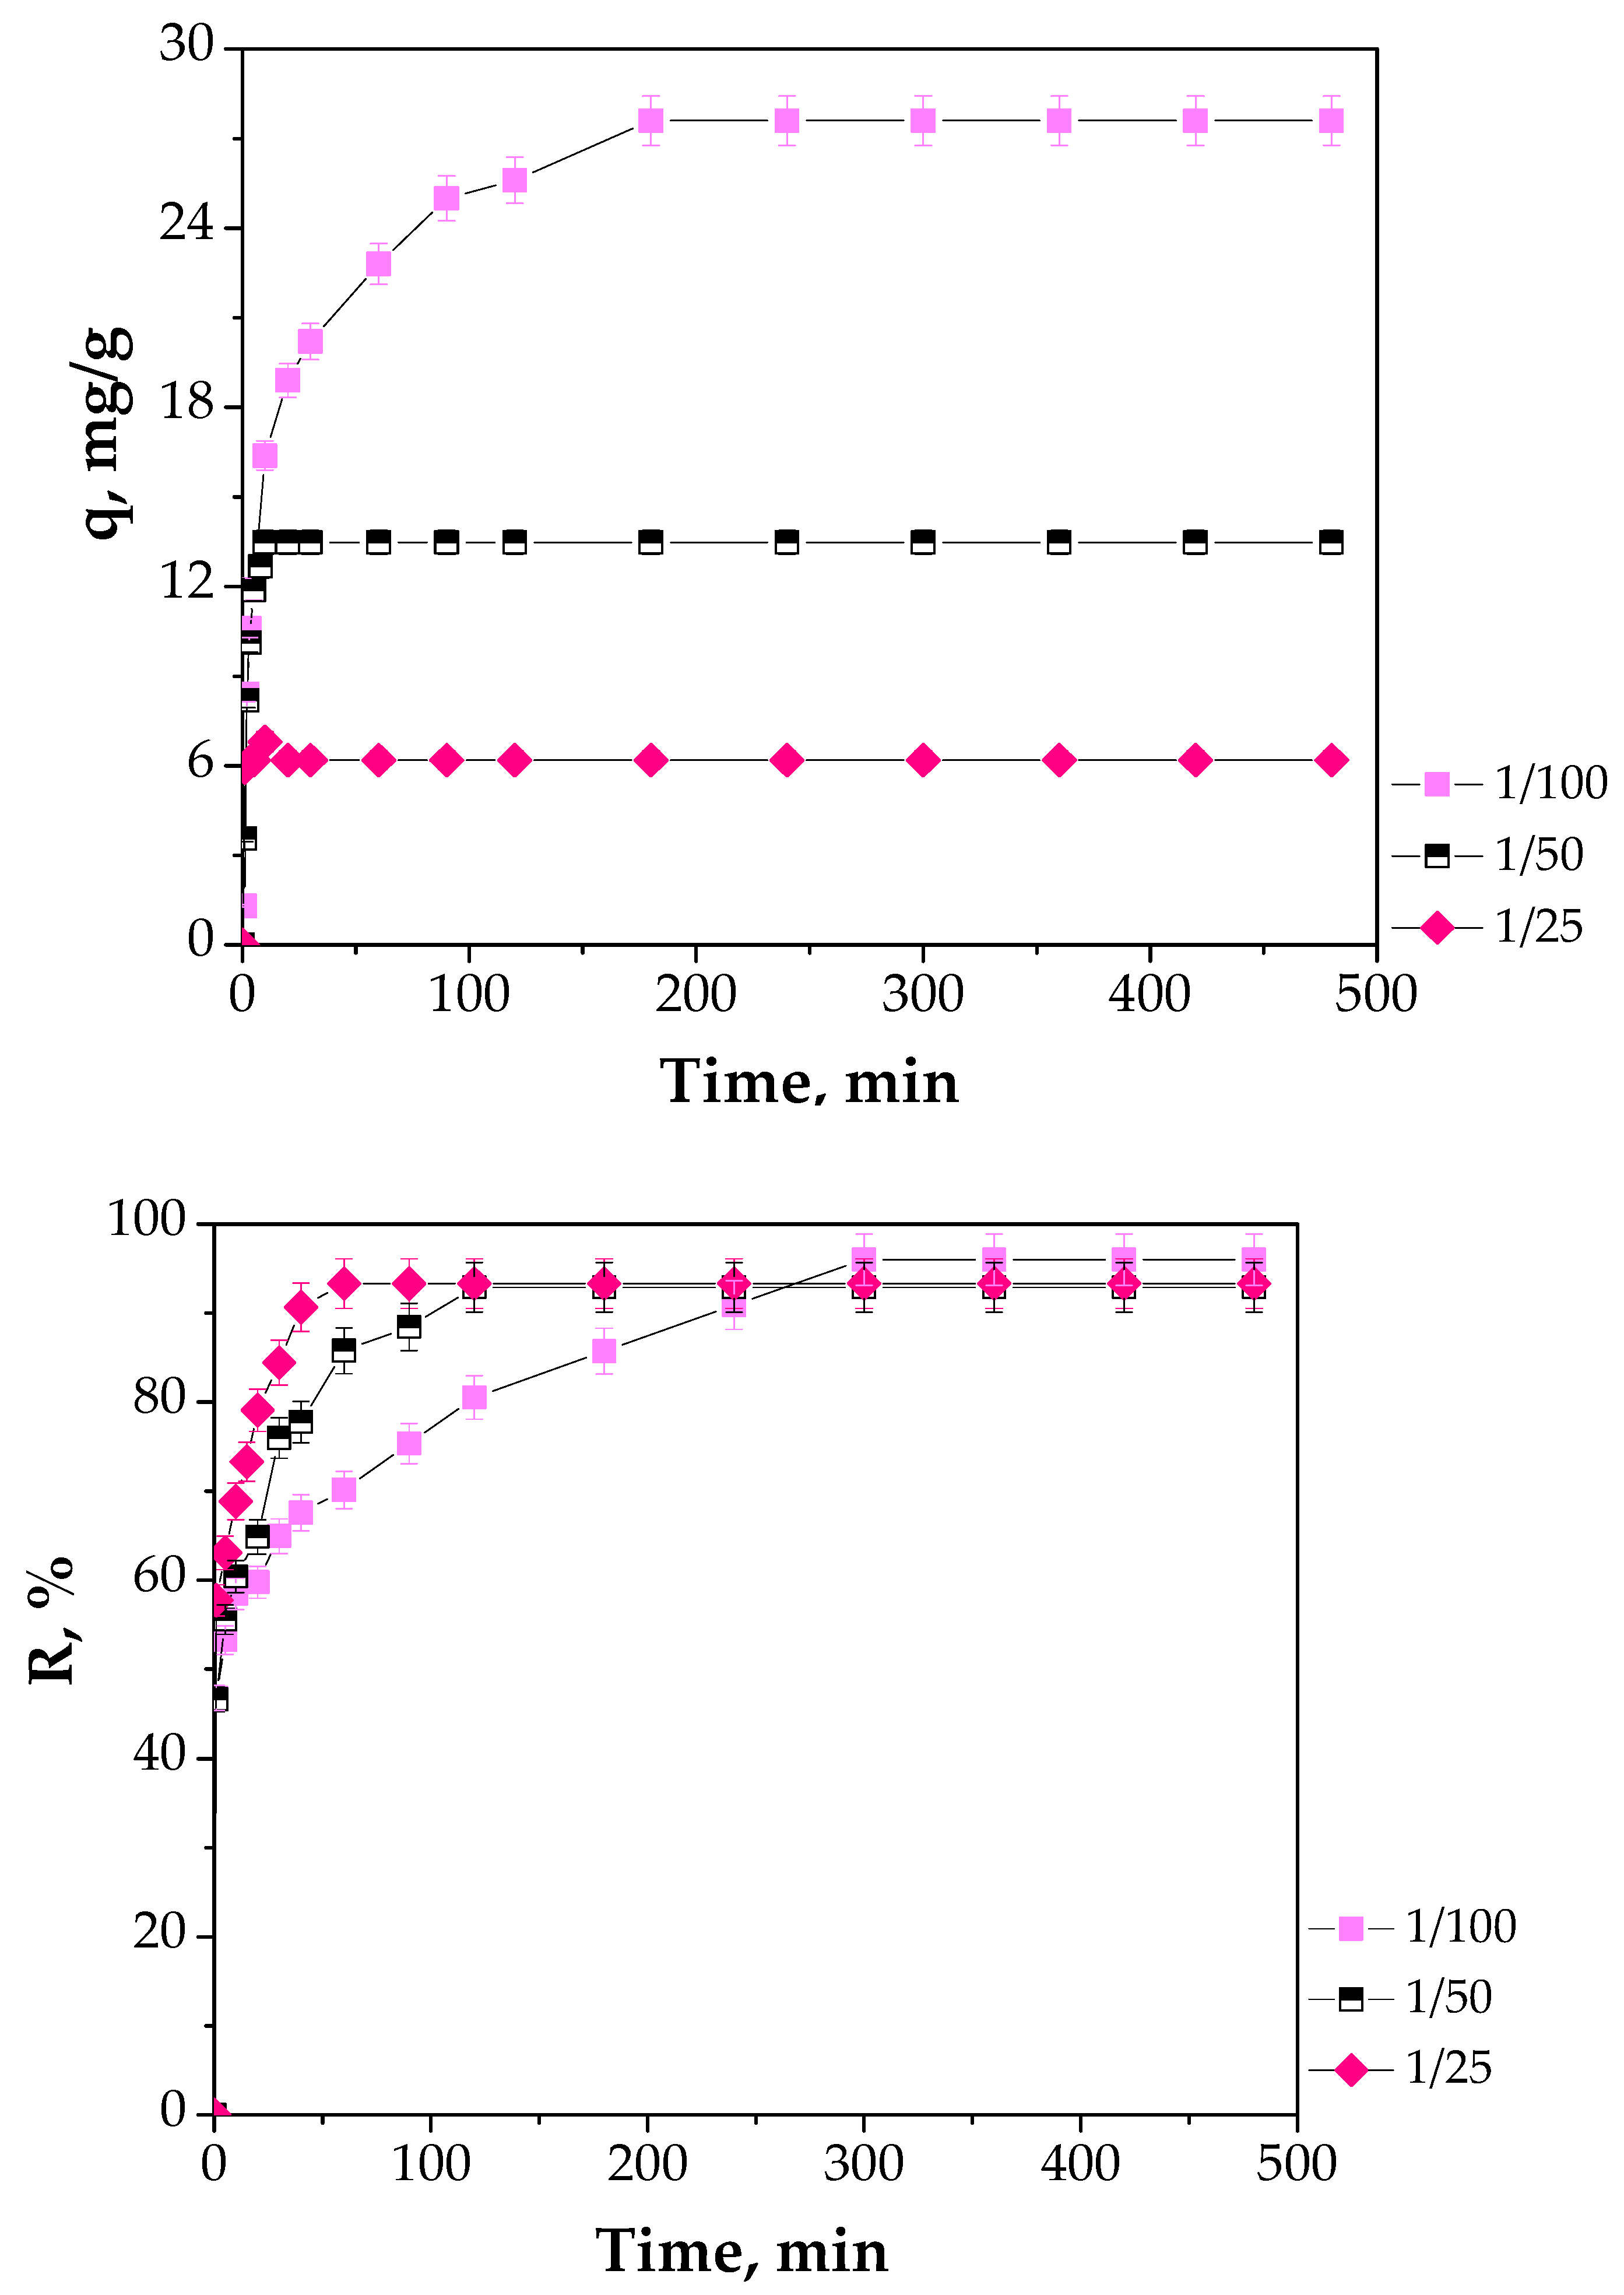
3.2.2. Effect of Adsorbent Dose
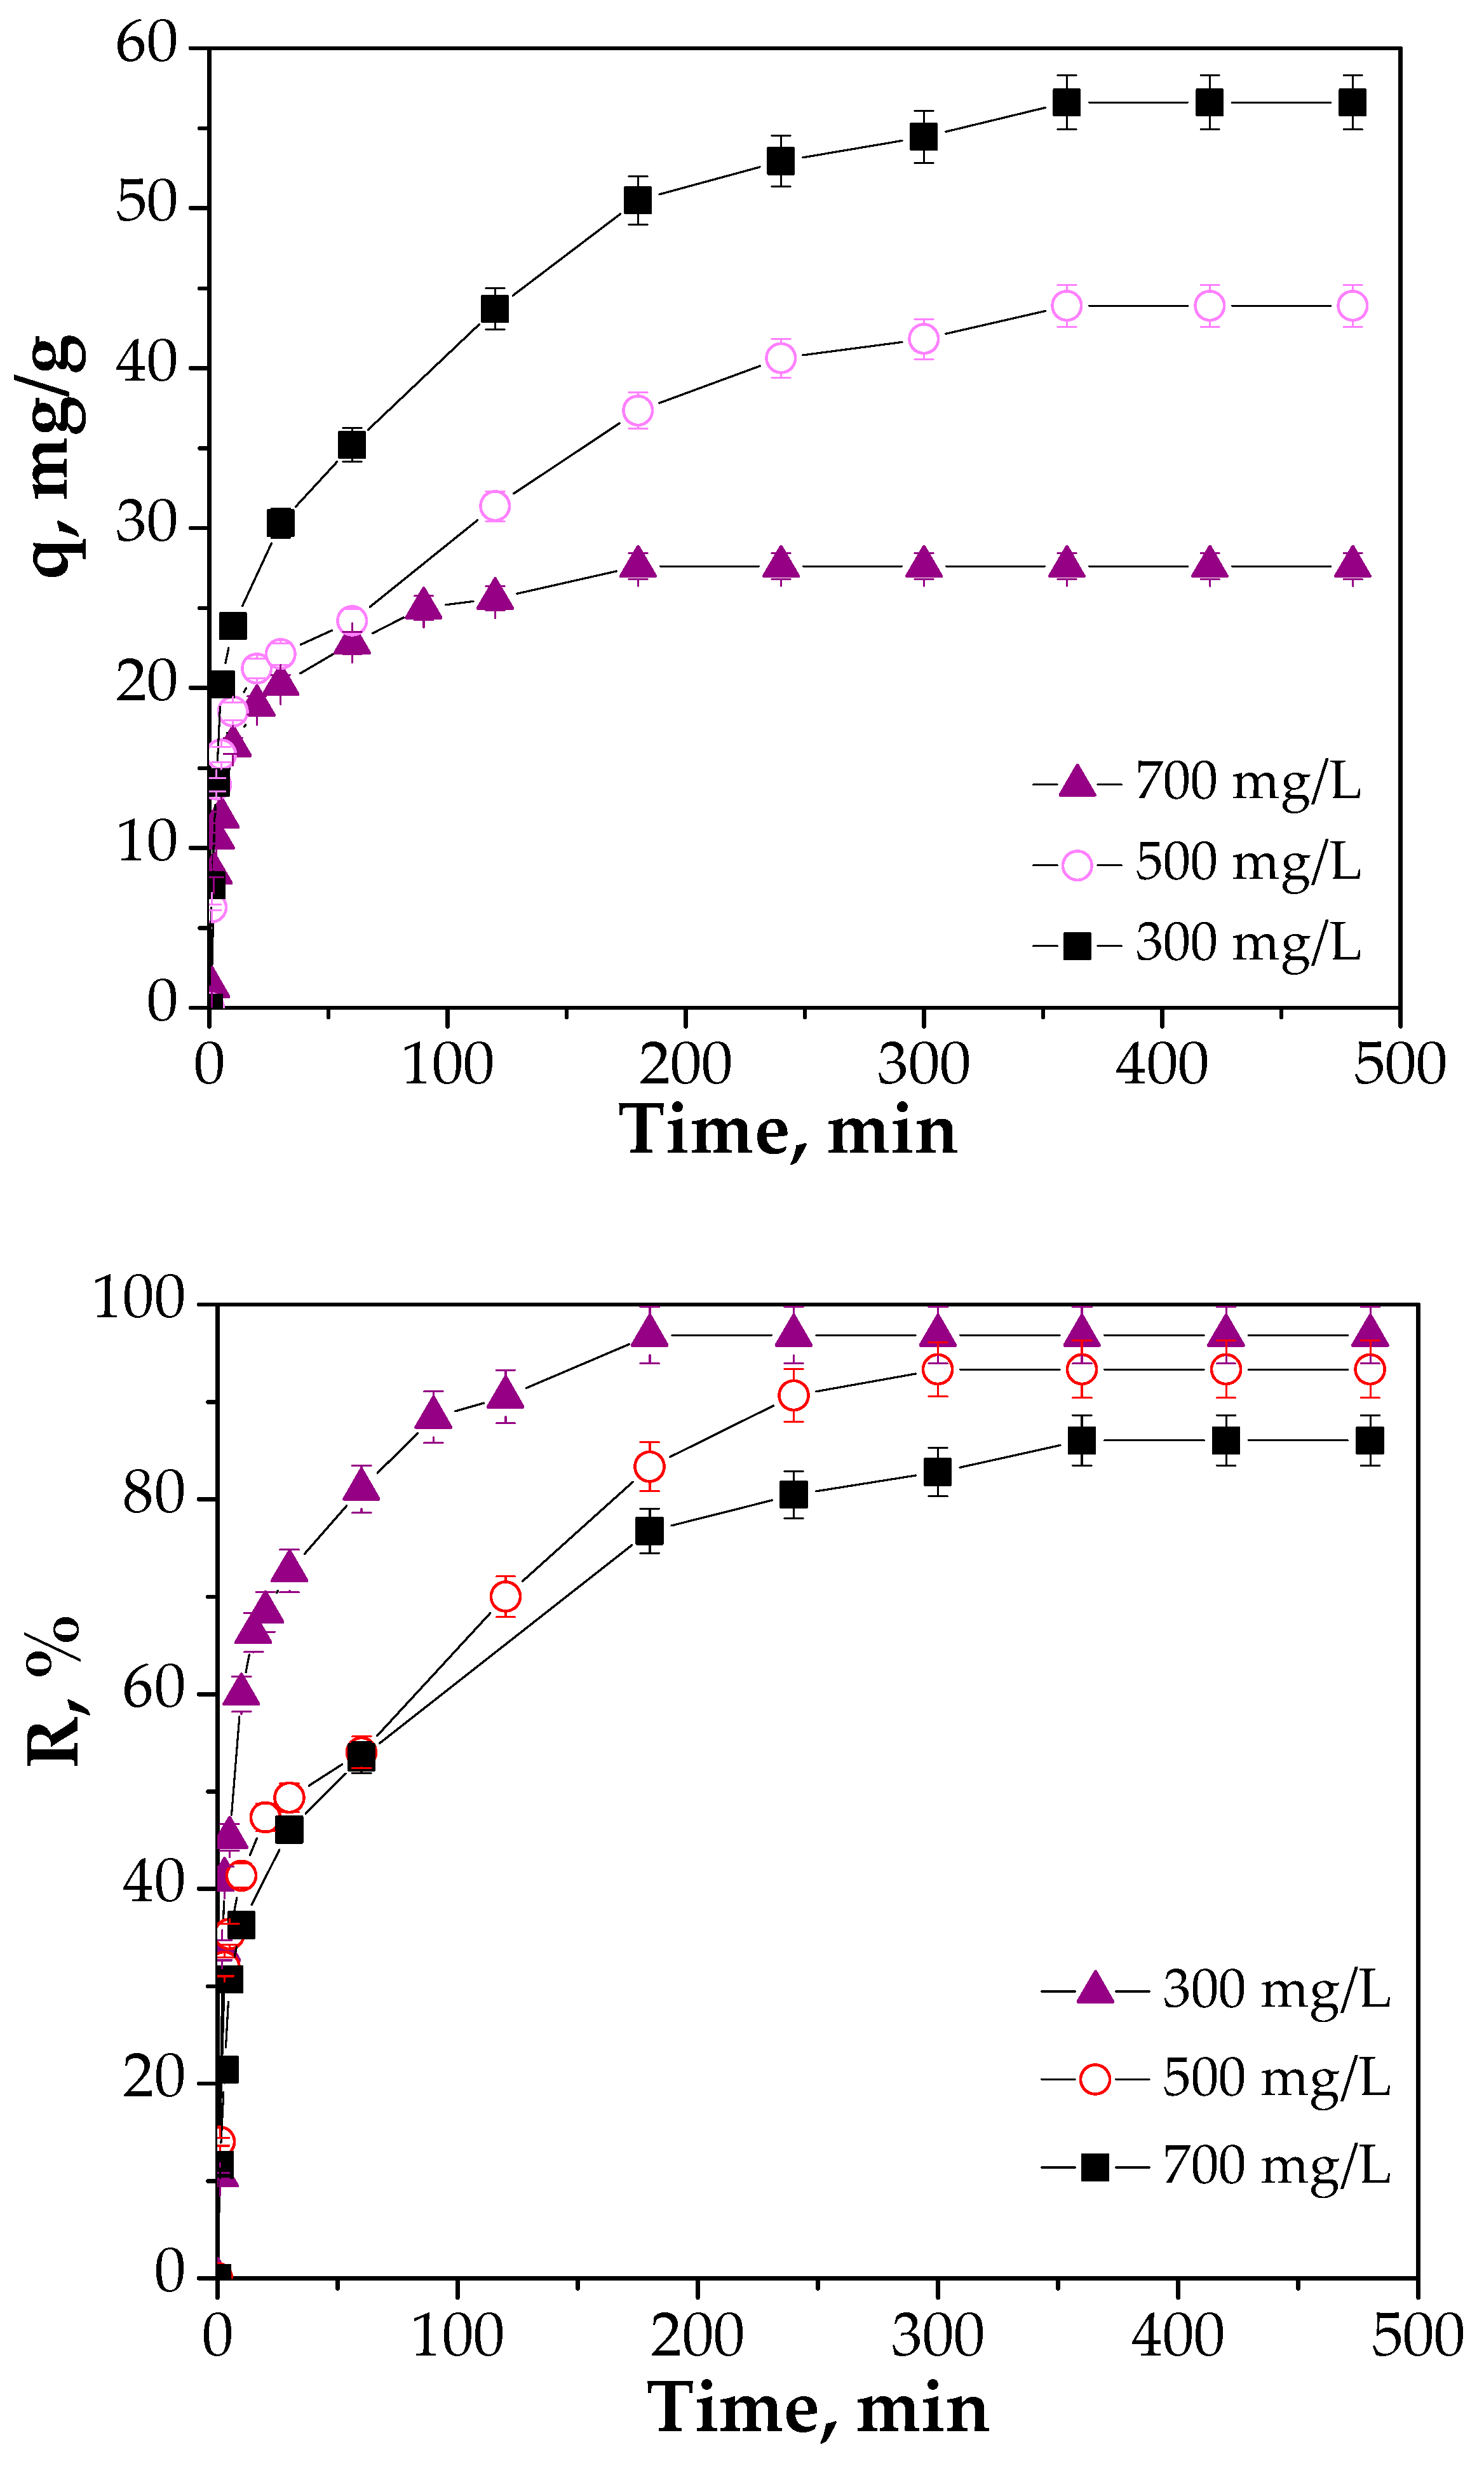
3.2.3. Effect of Initial Concentration and Contact Time
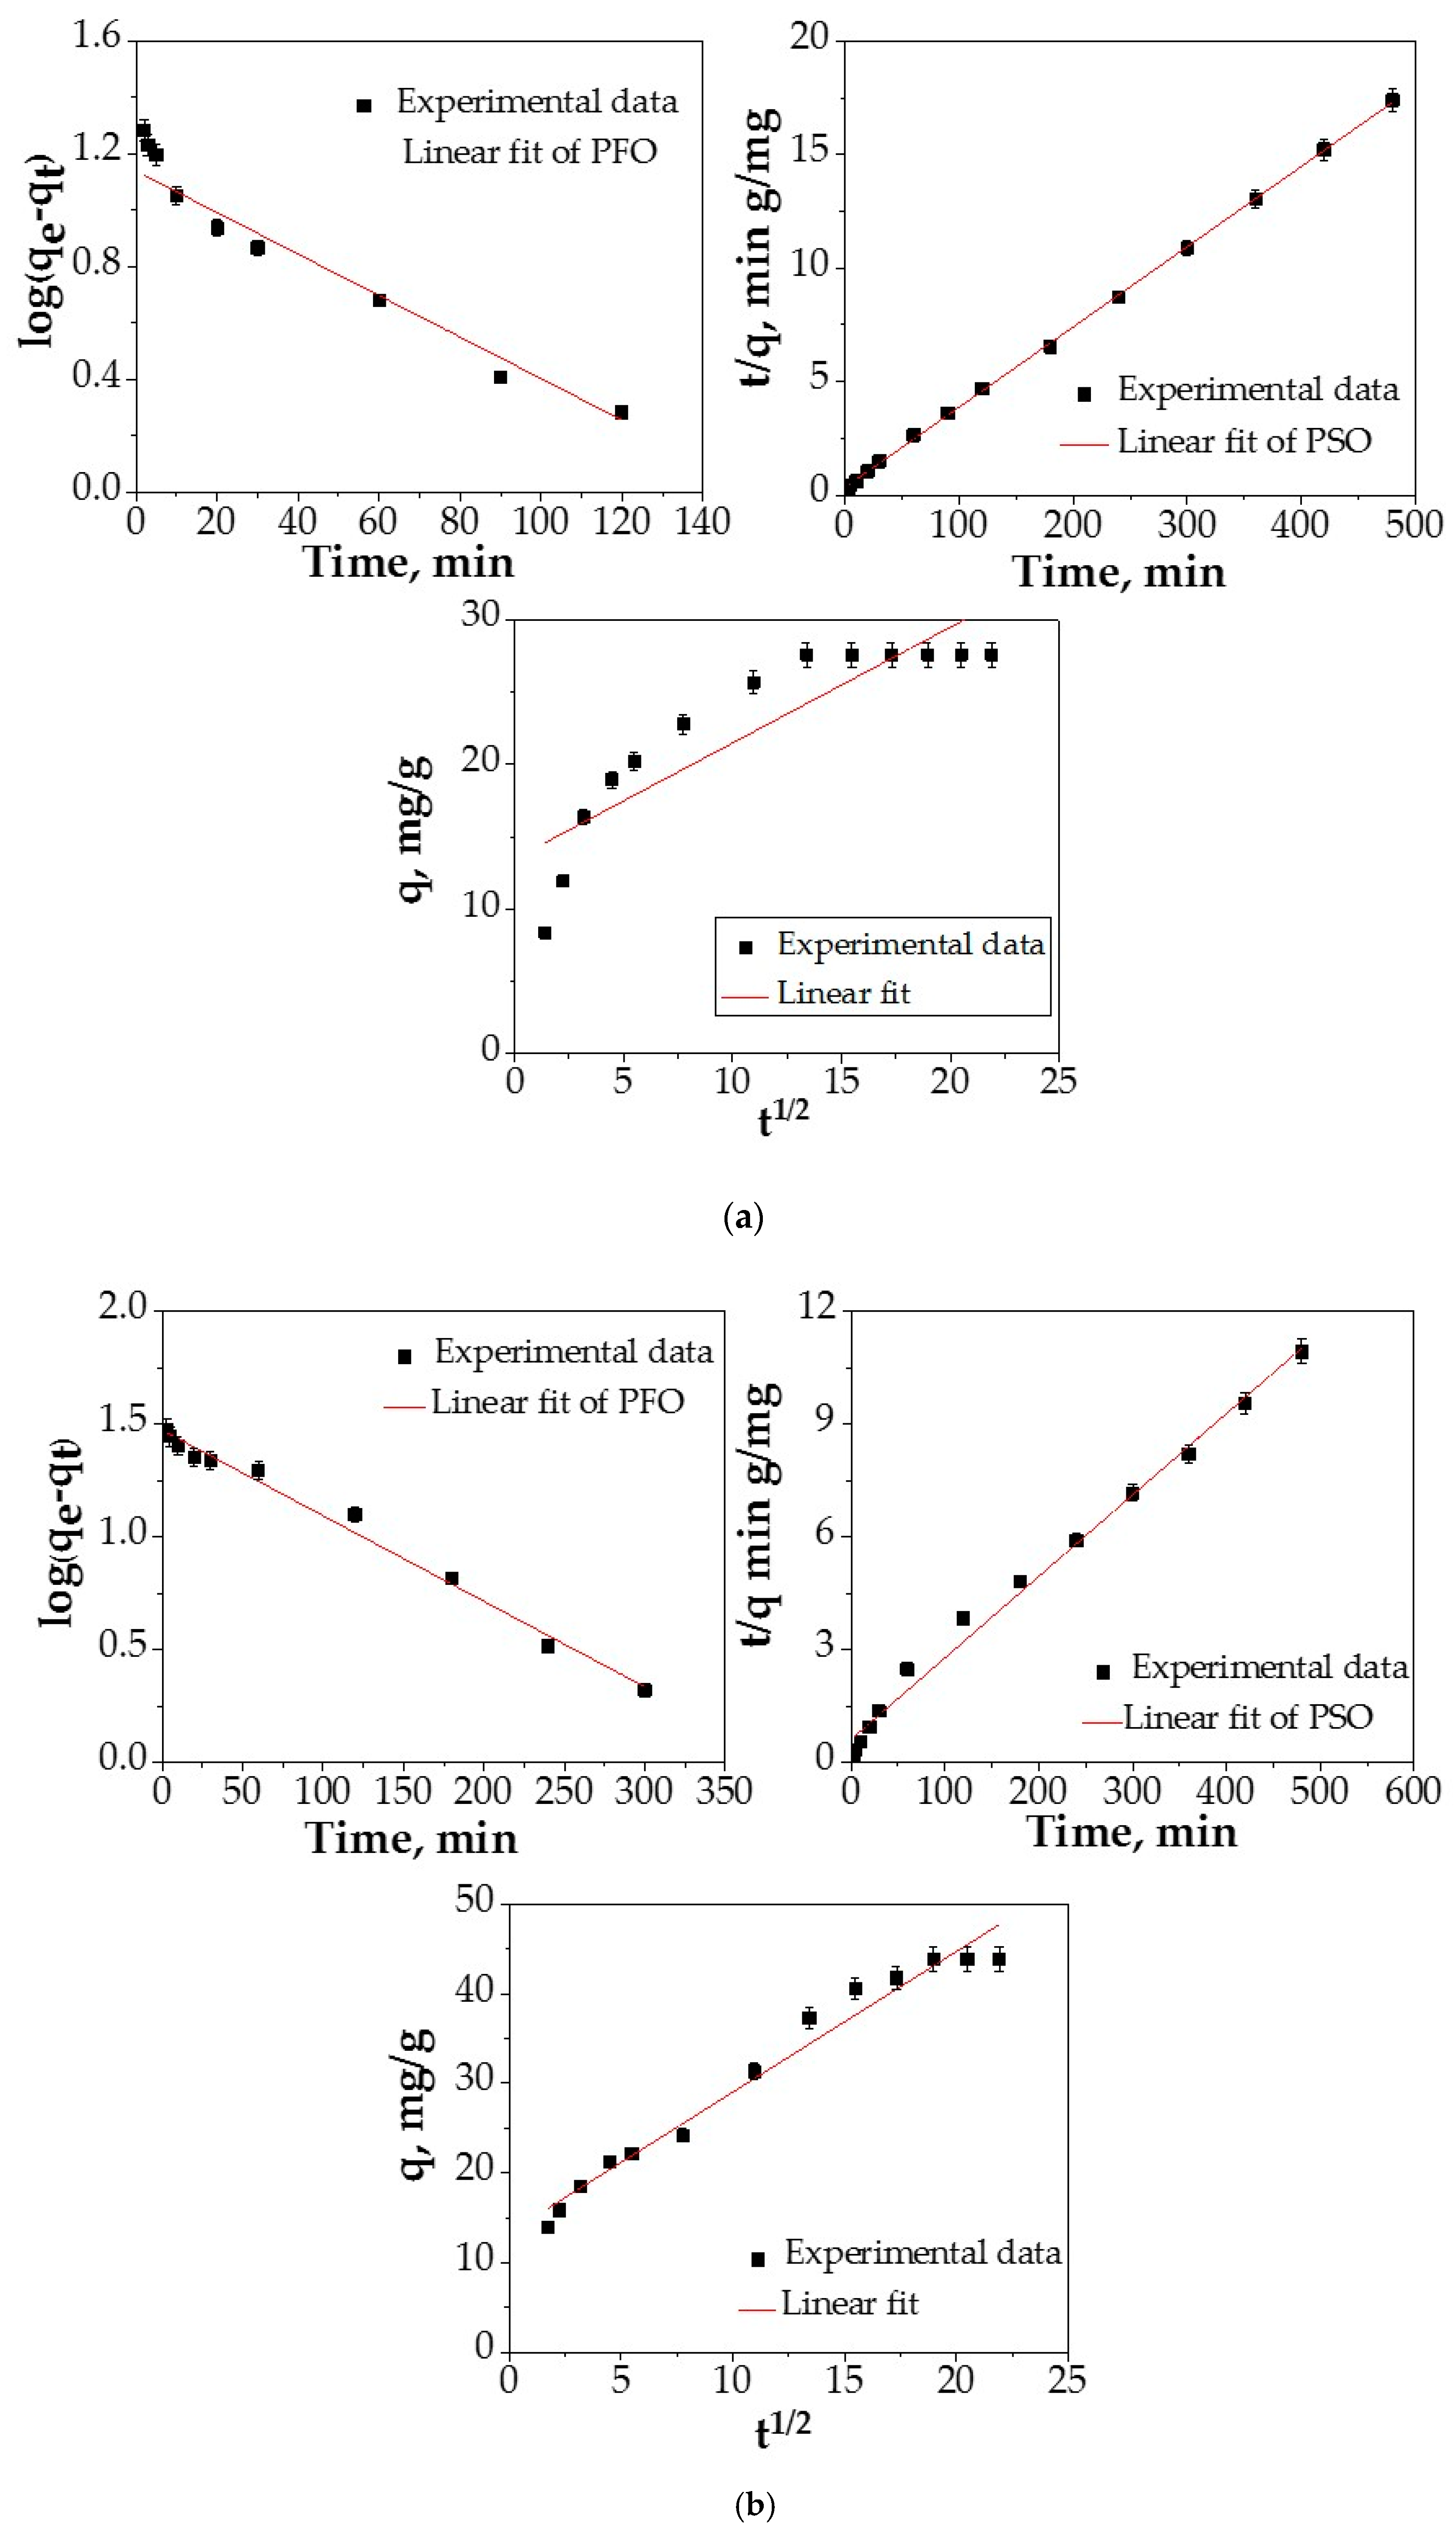
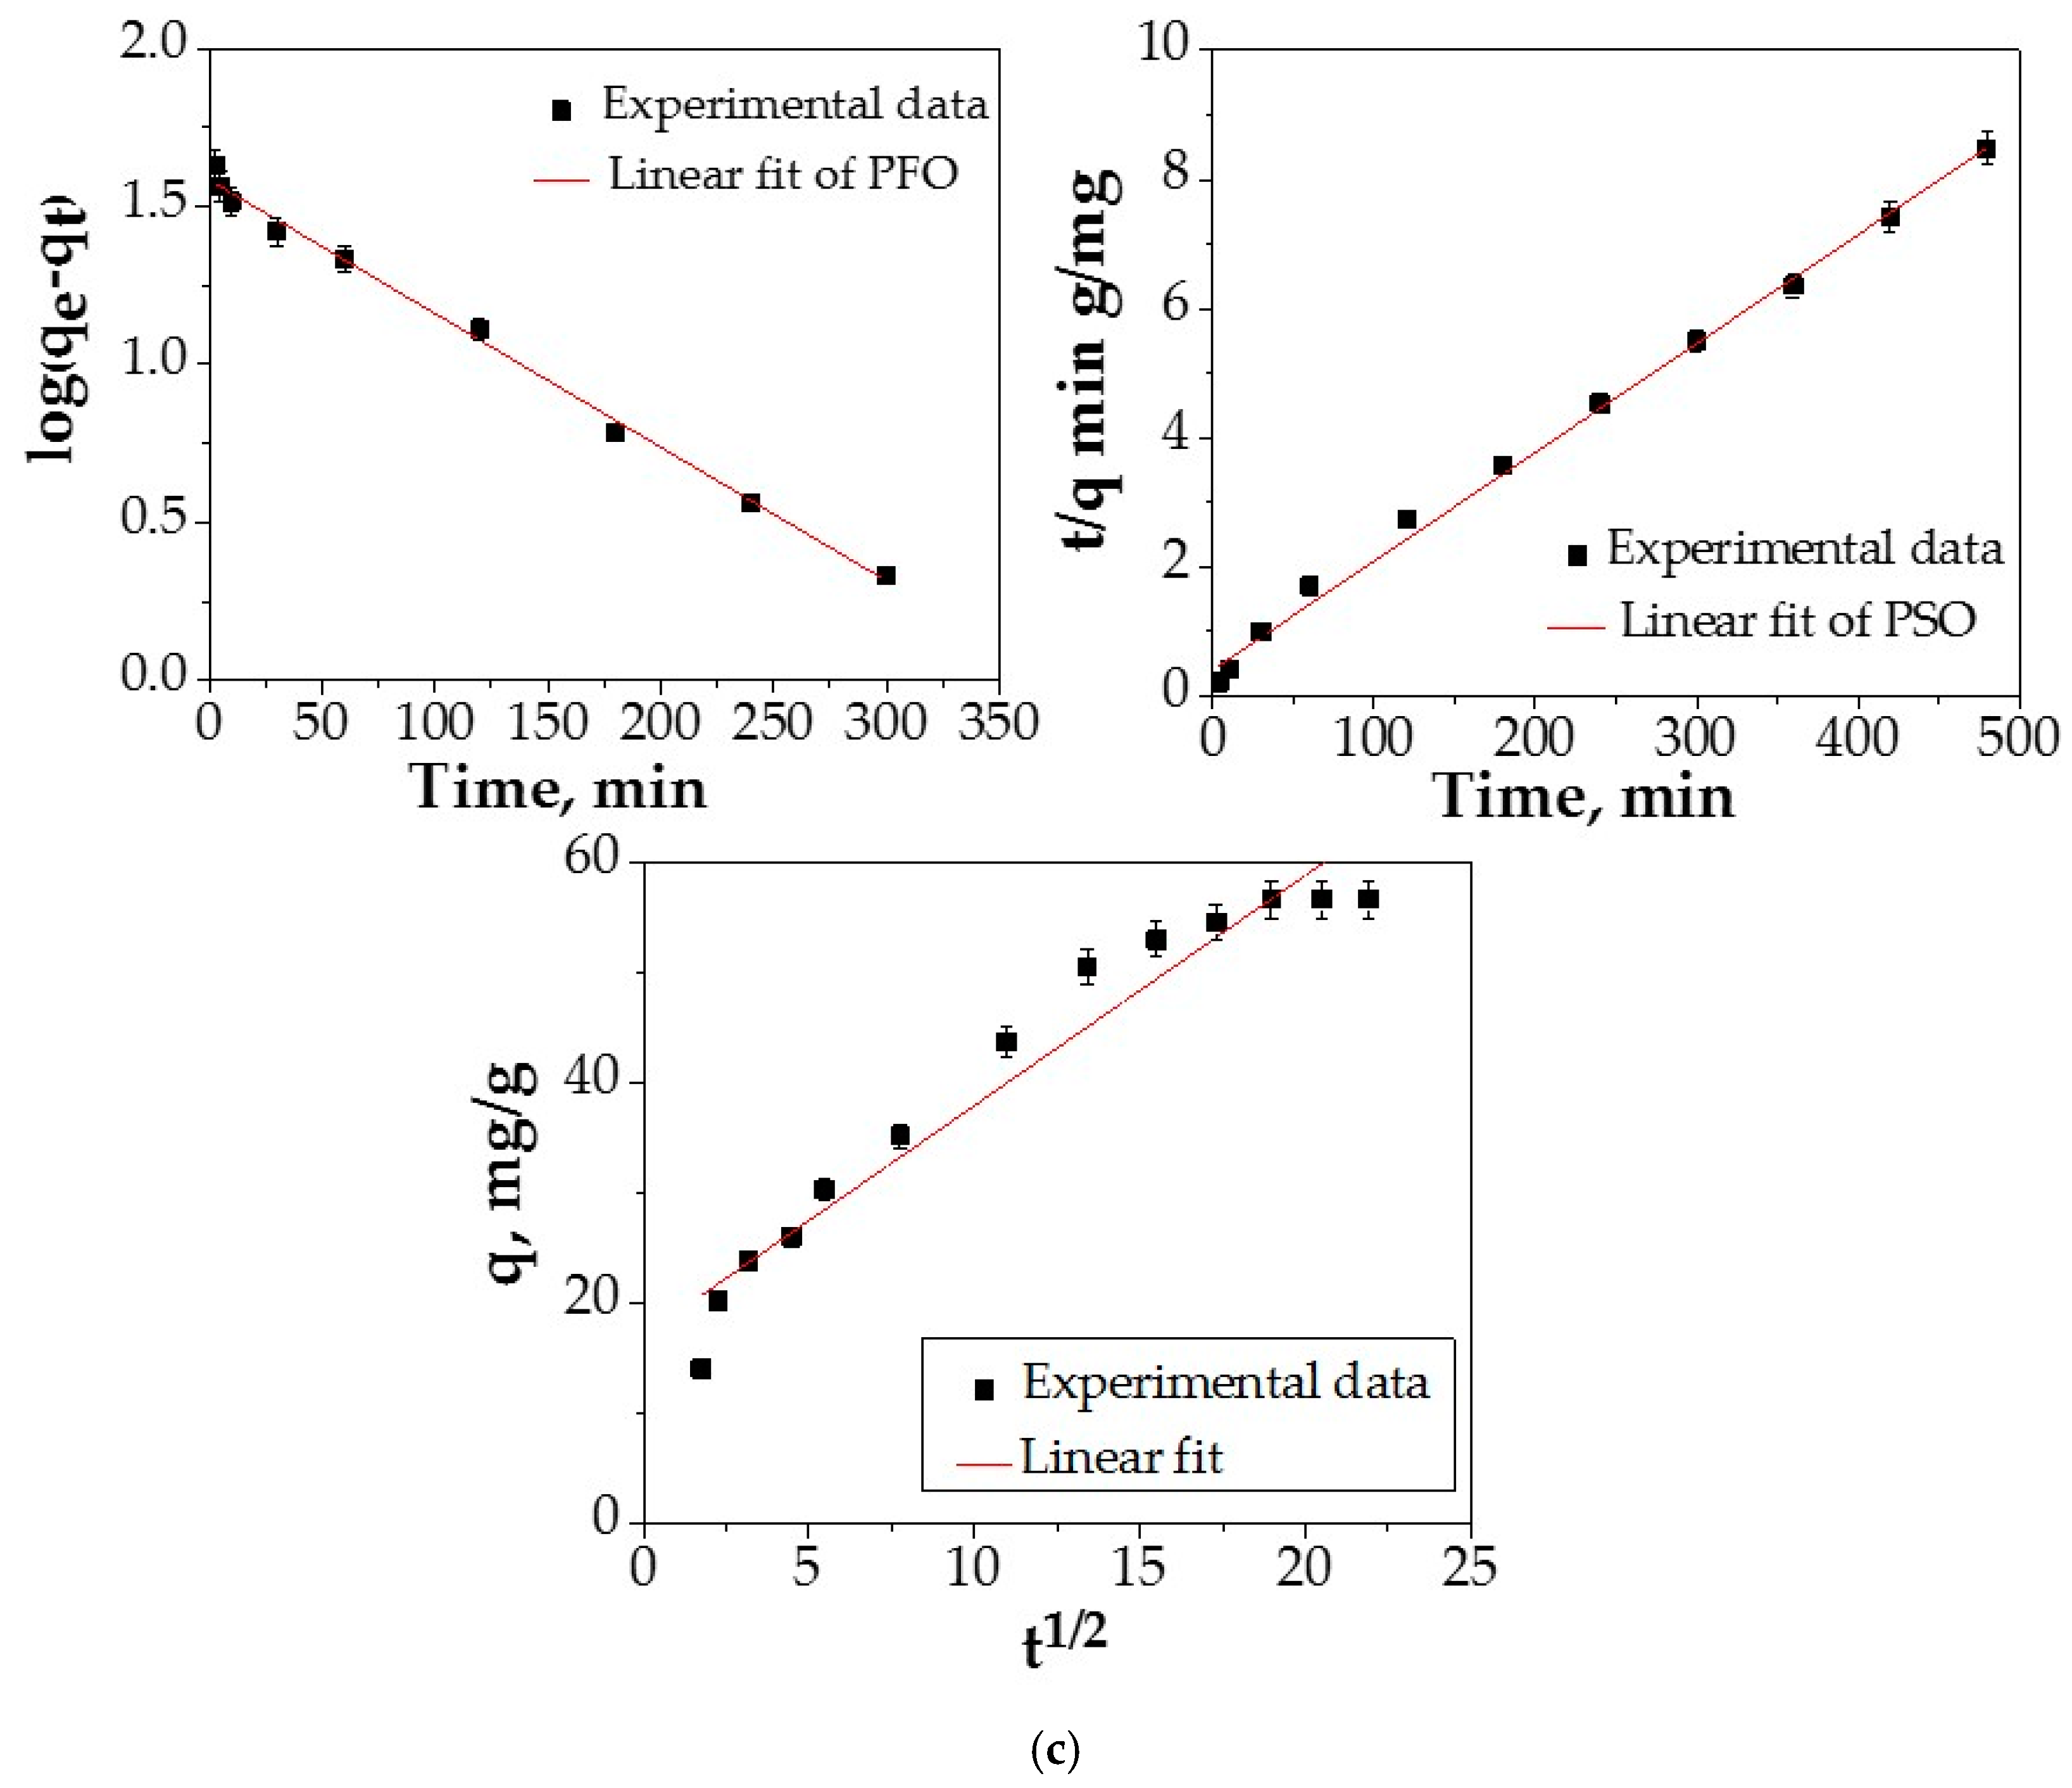
3.3. Adsorption Kinetic Study
- The transport of adsorbate from the bulk solution to the outer surface of the adsorbent is by molecular diffusion;
- Internal diffusion, the transport of adsorbate from the particle’s surface into an interior site, takes place;
- The adsorption of the solute particles from the active sites into the interior surface of the pores occurs.
4. Conclusions
Author Contributions
Funding
Institutional Review Board Statement
Informed Consent Statement
Data Availability Statement
Conflicts of Interest
References
- He, Y.; Zhang, L.; An, X.; Han, C.; Luo, Y. Microwave assistant rapid synthesis MCM-41-NH2 from fly ash and Cr(VI) removal performance. Environ. Sci. Pollut. Res. 2019, 26, 31463–31477. [Google Scholar] [CrossRef] [PubMed]
- Harja, M.; Cimpeanu, S.M.; Dirja, M.; Bucur, D. Synthesis of zeolites from fly ash and their use as soil amendment. In Zeolites—Useful Minerals; Intech Open: London, UK, 2016. [Google Scholar]
- Franus, W.; Wdowin, M.; Franus, M. Synthesis and characterization of zeolites prepared from industrial fly ash. Environ. Monit. Assess. 2014, 186, 5721–5729. [Google Scholar] [CrossRef] [PubMed]
- Favier, L.; Harja, M. TiO2/Fly ash nanocomposite for photodegradation of persistent organic pollutant, In Handbook of Nanomaterials and Nanocomposites for Energy and Environmental Applications; Kharissova, O., Martínez, L., Kharisov, B., Eds.; Springer: Cham, Switzerland, 2020. [Google Scholar] [CrossRef]
- Brostow, W.; Chetuya, N.; Gencel, O.; Hong, H.J.; Menard, N.; Sayana, S. Durability of portland concrete containing polymeric fillers and fly ash. Mater. Sci. 2020, 26, 103–108. [Google Scholar] [CrossRef]
- Sutcu, M.; Erdogmus, E.; Gencel, O.; Gholampour, A.; Atan, E.; Ozbakkaloglu, T. Recycling of bottom ash and fly ash wastes in eco-friendly clay brick production. J. Clean. Prod. 2019, 233, 753–764. [Google Scholar] [CrossRef]
- You, S.; Ho, S.W.; Li, T.; Maneerung, T.; Wang, C.H. Techno-economic analysis of geopolymer production from the coal fly ash with high iron oxide and calcium oxide contents. J. Hazard. Mater. 2019, 361, 237–244. [Google Scholar] [CrossRef]
- Buema, G.; Noli, F.; Misaelides, P.; Sutiman, D.M.; Cretescu, I.; Harja, M. Uranium removal from aqueous solutions by raw and modified thermal power plant ash. J. Radioanal. Nucl. Chem. 2014, 299, 381–386. [Google Scholar] [CrossRef]
- Noli, F.; Buema, G.; Misaelides, P.; Harja, M. New materials synthesized from ash under moderate conditions for removal of toxic and radioactive metals. J. Radioanal. Nucl. Chem. 2015, 303, 2303–2311. [Google Scholar] [CrossRef]
- Samiullah, M.; Aslam, Z.; Rana, A.G.; Abbas, A.; Ahmad, W. Alkali-activated boiler fly ash for Ni (II) removal: Characterization and parametric study. Water Air Soil Pollut. 2018, 229, 113. [Google Scholar] [CrossRef]
- Silliková, V.; Dulanská, S.; Horník, M.; Jakubčinová, J.; Ľubomír, M. Impregnated fly ash sorbent for Cesium-137 removal from water samples. J. Radioanal. Nucl. Chem. 2020, 324, 1225–1236. [Google Scholar] [CrossRef]
- Aydin, T. Development of lightweight ceramic construction materials based on fly ash. J. Aust. Ceram. Soc. 2017, 53, 109–115. [Google Scholar] [CrossRef]
- Kotova, O.B.; Ignatiev, G.V.; Shushkov, D.A.; Harja, M.; Broekmans, M.A. Preparation and properties of ceramic materials from coal fly ash. In Minerals: Structure, Properties, Methods of Investigation; Springer: Cham, Switzerland, 2020; pp. 101–107. [Google Scholar]
- Asl, S.M.H.; Javadian, H.; Khavarpour, M.; Belviso, C.; Taghavi, M.; Maghsudi, M. Porous adsorbents derived from coal fly ash as cost-effective and environmentally-friendly sources of aluminosilicate for sequestration of aqueous and gaseous pollutants: A review. J. Clean. Prod. 2019, 208, 1131–1147. [Google Scholar]
- Remenárová, L.; Pipíška, M.; Florková, E.; Horník, M.; Rozložník, M.; Augustín, J. Zeolites from coal fly ash as efficient sorbents for cadmium ions. Clean Techn. Environ. Policy 2014, 16, 1551–1564. [Google Scholar] [CrossRef]
- Nguyen, T.C.; Loganathan, P.; Nguyen, T.V.; Jaya Kandasamy, J.; Naidu, R.; Vigneswaran, S. Adsorptive removal of five heavy metals from water using blast furnace slag and fly ash. Environ. Sci. Pollut. Res. 2018, 25, 20430–20438. [Google Scholar] [CrossRef] [PubMed]
- Taylor, A.A.; Tsuji, J.S.; Garry, M.R.; McArdle, M.E.; Goodfellow, W.L.; Adams, W.J.; Menzie, C.A. Critical review of exposure and effects: Implications for setting regulatory health criteria for ingested copper. Environ. Manag. 2020, 65, 131–159. [Google Scholar] [CrossRef] [PubMed]
- Borhade, A.V.; Kshirsagar, T.A.; Dholi, A.G. Eco-Friendly Synthesis of Aluminosilicate Bromo Sodalite from Waste Coal Fly Ash for the Removal of Copper and Methylene Blue Dye. Arab. J. Sci. Eng. 2017, 42, 4479–4491. [Google Scholar] [CrossRef]
- Milićević, S.; Vlahović, M.; Kragović, M.; Martinović, S.; Milošević, V.; Jovanović, I.; Stojmenović, M. Removal of Copper from Mining Wastewater Using Natural Raw Material—Comparative Study between the Synthetic and Natural Wastewater Samples. Minerals 2020, 10, 753. [Google Scholar] [CrossRef]
- Engwa, G.A.; Ferdinand, P.U.; Nwalo, F.N.; Unachukwu, M.N. Mechanism and health effects of heavy metal toxicity in humans. In Poisoning in the Modern World-New Tricks for an Old Dog? Intech Open: London, UK, 2019. [Google Scholar]
- Ojha, K.; Pradhan, N.C.; Samanta, A.N. Zeolite from fly ash: Synthesis and characterization. Bull. Mater. Sci. 2004, 27, 555–564. [Google Scholar] [CrossRef]
- Curteanu, S.; Buema, G.; Piuleac, C.G.; Sutiman, D.M.; Harja, M. Neuro-evolutionary optimization methodology applied to the synthesis process of ash based adsorbents. J. Ind. Eng. Chem. 2014, 20, 597–604. [Google Scholar] [CrossRef]
- Harja, M.; Buema, G.; Sutiman, D.M.; Cretescu, I. Removal of heavy metal ions from aqueous solutions using low-cost sorbents obtained from ash. Chem. Pap. 2013, 67, 497–508. [Google Scholar] [CrossRef]
- Arbabi, M.; Golshani, N. Removal of copper ions Cu (II) from industrial wastewater: A review of removal methods. Int. J. Epidemiol. 2016, 3, 283–293. [Google Scholar]
- Rachmawati, S.D.; Tizaoui, C.; Hilal, N. Manganese Coated Sand for Copper (II) Removal from Water in Batch Mode. Water 2013, 5, 1487–1501. [Google Scholar] [CrossRef]
- Kang, C.D.; Sim, S.J.; Cho, Y.S.; Kim, W.S. Process development for the removal of copper from wastewater using ferric/limestone treatment. Korean J. Chem. Eng. 2003, 20, 482–486. [Google Scholar] [CrossRef]
- Ulatowska, J.; Stala, Ł.; Nowakowska, A.; Polowczyk, I. Use of synthetic zeolite materials from fly ash to remove copper(II) ions from aqueous solutions. Physicochem. Probl. Miner. Process. 2020, 56, 114–124. [Google Scholar] [CrossRef]
- Querol, X.; Moreno, N.; Umaña, J.C.; Alastuey, A.; Hernandez, E.; Lopez-Soler, A.; Plana, F. Synthesis of zeolites from coal fly ash: An overview. Int. J. Coal Geol. 2002, 50, 413–423. [Google Scholar] [CrossRef]
- Wang, Y.; Guo, Y.; Yang, Z.; Cai, H.; Xavier, Q. Synthesis of zeolites using fly ash and their application in removing heavy metals from waters. Sci. China Ser. D-Earth Sci. 2003, 46, 967–976. [Google Scholar] [CrossRef]
- Hui, K.S.; Chao, C.Y.H.; Kot, S.C. Removal of mixed heavy metal ions in wastewater by zeolite 4A and residual products from recycled coal fly ash. J. Hazard. Mater. 2005, B127, 89–101. [Google Scholar] [CrossRef] [PubMed]
- Derkowski, A.; Franus, W.; Beran, E.; Czimerova, A. Properties and potential applications of zeolitic materials produced from fly ash using simple method of synthesis. Powder Technol. 2006, 166, 47–54. [Google Scholar] [CrossRef]
- Apiratikul, R.; Pavasant, P. Sorption of Cu2+, Cd2+, and Pb2+ using modified zeolite from coal fly ash. Chem. Eng. J. 2008, 144, 245–258. [Google Scholar] [CrossRef]
- Hsu, T.C.; Yu, C.C.; Yeh, C.M. Adsorption of Cu2+ from water using raw and modified coal fly ashes. Fuel 2008, 87, 1355–1359. [Google Scholar] [CrossRef]
- Boycheva, S.V.; Zgureva, D.M. Surface studies of fly ash zeolites via adsorption/desorption isotherms. Bulg. Chem. Commun. 2016, 48, 101–107. [Google Scholar]
- Qiu, Q.; Jiang, X.; Lv, G.; Chen, Z.; Lu, S.; Ni, M.; Yan, J.; Lin, X.; Song, H.H.; Cao, J. Adsorption of copper ions by fly ash modified through microwave-assisted hydrothermal process. J. Mater. Cycles. Waste Manag. 2019, 21, 469–477. [Google Scholar] [CrossRef]
- Harja, M.; Buema, G.; Sutiman, D.M.; Munteanu, C.; Bucur, D. Low cost adsorbents obtained from ash for copper removal. Korean J. Chem. Eng. 2012, 29, 1735–1744. [Google Scholar] [CrossRef]
- Treacy, M.M.; Higgins, J.B. Collection of Simulated XRD Powder Patterns for Zeolites, 5th ed.; Elsevier: Amsterdam, The Netherlands, 2007. [Google Scholar]
- Forminte, L.; Ciobanu, G.; Buema, G.; Lupu, N.; Chiriac, H.; de Castro, C.G.; Harja, M. New materials synthesized by sulfuric acid attack over power plant fly ash. Rev. Chim. 2020, 71, 48–58. [Google Scholar] [CrossRef]
- Cretescu, I.; Harja, M.; Teodosiu, C.; Isopescu, D.N.; Chok, M.F.; Sluser, B.M.; Salleh, M.A.M. Synthesis and characterisation of a binder cement replacement based on alkali activation of fly ash waste. Process Saf. Environ. Protect. 2018, 119, 23–35. [Google Scholar] [CrossRef]
- Buema, G.; Lupu, N.; Chiriac, H.; Roman, T.; Porcescu, M.; Ciobanu, G.; Burghila, D.V.; Harja, M. Eco-Friendly Materials Obtained by Fly Ash Sulphuric Activation for Cadmium Ions Removal. Materials 2020, 13, 3584. [Google Scholar] [CrossRef]
- Buema, G.; Lupu, N.; Chiriac, H.; Ciobanu, G.; Kotova, O.; Harja, M. Modeling of solid-fluid non-catalytic processes for nickel ion removal. Rev. Chim. 2020, 71, 4–15. [Google Scholar] [CrossRef]
- Yang, Y.; Zhang, P.; Jiang, J.; Dai, Y.; Wu, M.; Pan, Y.; Ni, L. Synthesis and properties of magnetic zeolite with good magnetic stability from fly ash. J. Sol-Gel Sci. Technol. 2018, 87, 408–418. [Google Scholar] [CrossRef]
- Yusuff, A.S.; Popoola, L.T.; Babatunde, E.O. Adsorption of cadmium ion from aqueous solutions by copper-based metal organic framework: Equilibrium modeling and kinetic studies. Appl. Water Sci. 2009, 9, 106. [Google Scholar] [CrossRef]
- Yalcin, M.; Gurses, A. The Adsorption Kinetics of Cethyltrimethylammonium Bromide (CTAB) onto Powdered Active Carbon. Adsoprtion 2004, 10, 339–348. [Google Scholar]
- Marcos, C.; Medoro, V.; Adawy, A. Modified Vermiculite as Adsorbent of Hexavalent Chromium in Aqueous Solution. Minerals 2020, 10, 749. [Google Scholar] [CrossRef]
- Hossain, M.A.; Ngo, H.H.; Guo, W.S.; Nguyen, T.V. Removal of Copper from Water by Adsorption onto Banana Peel as Bioadsorbent. Int. J. Geomate. 2012, 2, 227–234. [Google Scholar] [CrossRef]
- Shah, P.U.; Raval, P.N.; Shah, N.K. Adsorption of Copper from an Aqueous Solution by Chemically Modified Cassava Starch. J. Mater. Environ. Sci. 2015, 6, 2573–2582. [Google Scholar]
- Koottatep, T.; Fakkaew, K.; Tajai, N.; Polprasert, C. Isotherm models and kinetics of copper adsorption by using hydrochar produced from hydrothermal carbonization of faecal sludge. J. Water Sanit. Hyg. Dev. 2017, 7, 102–110. [Google Scholar] [CrossRef]
- García-Díaz, I.; López, F.A.; Alguacil, F.J. Carbon Nanofibers: A New Adsorbent for Copper Removal from Wastewater. Metals 2018, 8, 914. [Google Scholar] [CrossRef]
- Darmayanti, L.; Notodarmodjo, S.; Damanhuri, E. Removal of copper (II) ions in aqueous solutions by sorption onto fly ash. J. Eng. Technol. Sci. 2017, 49, 546–559. [Google Scholar] [CrossRef]
- Joseph, I.V.; Tosheva, L.; Doyle, A.M. Simultaneous removal of Cd (II), Co (II), Cu (II), Pb (II), and Zn (II) ions from aqueous solutions via adsorption on fau-type zeolites prepared from coal fly ash. J. Environ. Chem. Eng. 2020, 8, 103895. [Google Scholar] [CrossRef]


| Zeolite | Method of Synthesis | References |
|---|---|---|
| NaP1, Analcime and Chabazite | Hydrothermal method | [29] |
| 4A | Hydrothermal method | [30] |
| Na–X, NaP, Na–S | Hydrothermal method | [31] |
| X | Fusion method | [32] |
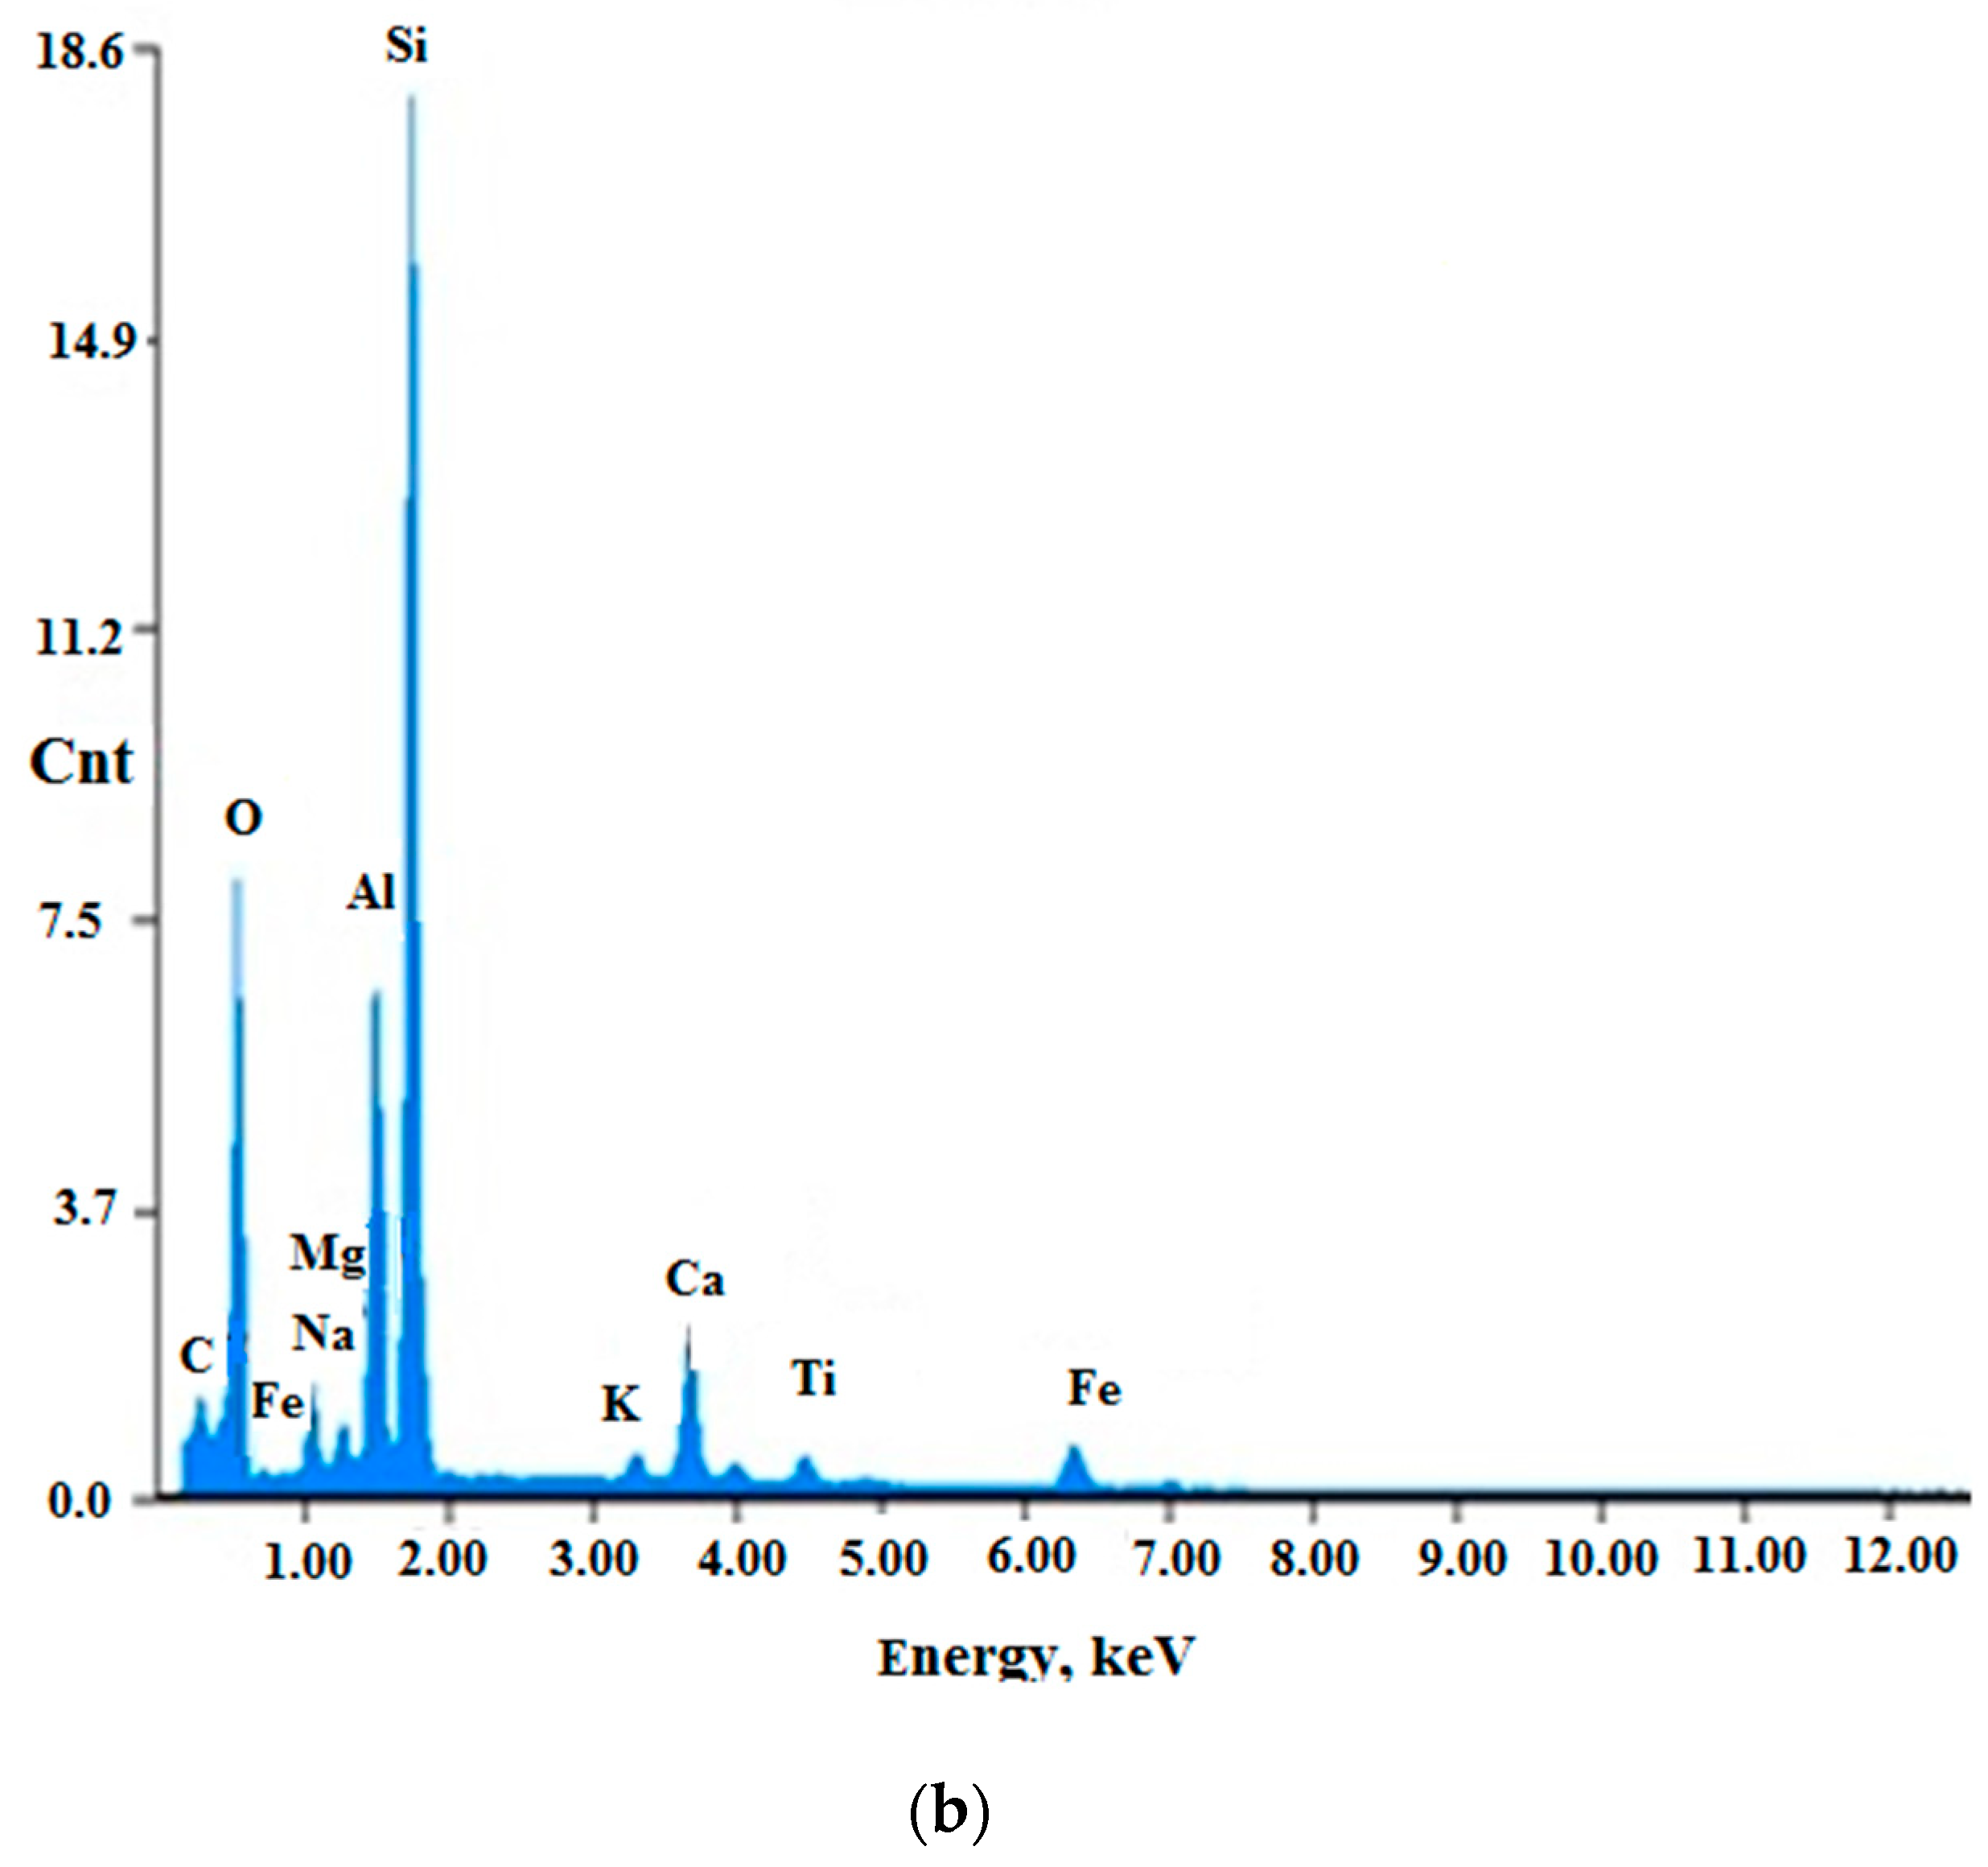
| Adsorbent | O | Na | Mg | Al | Si | K | Ca | Ti | Fe |
|---|---|---|---|---|---|---|---|---|---|
| FA | 43.32 | 0.79 | 0.62 | 19.19 | 30.81 | 1.75 | 1.15 | 1.54 | 3.05 |
| MFA | 33.85 | 3.44 | 0.93 | 18.33 | 28.89 | 0.66 | 1.44 | 0.91 | 4.07 |
| Element | A1 |
|---|---|
| Ni | 1.13 × 10² |
| Cu | 3.09 × 10² |
| As | 14.7 |
| Sr | 1.39 × 10³ |
| Zr | 3.41 × 10² |
| V | 91.9 |
| Cr | 1.36 × 10² |
| Mn | 4.46 ×10² |
| Cs | 3.77 |
| Ba | 2.25 ×10³ |
| Ce | 1.73 × 10² |
| Eu | 2.73 |
| Th | 3.02 |
| U | 7.39 |
| Model | Equation |
|---|---|
| Pseudo-first order kinetic model (PFO) | |
| Pseudo-second order kinetic model (PSO) | |
| Intraparticle diffusion | +c |
| Kinetic Model | Parameters | Values | ||
|---|---|---|---|---|
| 300 mg/L | 500 mg/L | 700 mg/L | ||
| Pseudo-first order | k1, 1/min | 0.0209 | 0.0092 | 0.0101 |
| R2 | 0.9169 | 0.9776 | 0.9844 | |
| Pseudo-second order | qe cal, mg/g | 27.32 | 45.25 | 58.48 |
| k2, g/mg min | 0.0036 | 0.0010 | 0.0009 | |
| R2 | 0.9994 | 0.9909 | 0.9964 | |
| Intraparticle diffusion | ki | 1.0899 | 1.6816 | 2.1269 |
| C | 9.2665 | 11.579 | 15.211 | |
| R2 | 0.7392 | 0.9518 | 0.9286 | |
| Adsorbent | q, mg/g | References |
|---|---|---|
| FA | 14.464 | [36] |
| FA/NaOH (2 M, 70 °C) | 6.976–27.904 | [36] |
| FA/NaOH (2 M, 90 °C) | 7.056–27.904 | [36] |
| FA/NaOH (5 M, 70 °C) | 6.896–27.776 | [36] |
| FA/NaOH (5 M, 90 °C) | 6.896–27.904 | [36] |
| Banana peel | 1.439–71.429 | [46] |
| FA/NaOH (5 M, 70 °C, US) | 23.8 | [23] |
| FA/H2SO4 | 28.09 | [40] |
| CSCMQ copolymer | 28.75 | [47] |
| KOH-hydrochar | 18.6 | [48] |
| Carbon nanofibers | 8.8 | [49] |
| Coal fly ash | 8.54 | [50] |
| FA/NaOH (600 °C, 68 h) | 39.68 | [51] |
| MFA | 27.32–58.48 | This study |
Publisher’s Note: MDPI stays neutral with regard to jurisdictional claims in published maps and institutional affiliations. |
© 2021 by the authors. Licensee MDPI, Basel, Switzerland. This article is an open access article distributed under the terms and conditions of the Creative Commons Attribution (CC BY) license (http://creativecommons.org/licenses/by/4.0/).
Share and Cite
Buema, G.; Harja, M.; Lupu, N.; Chiriac, H.; Forminte, L.; Ciobanu, G.; Bucur, D.; Bucur, R.D. Adsorption Performance of Modified Fly Ash for Copper Ion Removal from Aqueous Solution. Water 2021, 13, 207. https://doi.org/10.3390/w13020207
Buema G, Harja M, Lupu N, Chiriac H, Forminte L, Ciobanu G, Bucur D, Bucur RD. Adsorption Performance of Modified Fly Ash for Copper Ion Removal from Aqueous Solution. Water. 2021; 13(2):207. https://doi.org/10.3390/w13020207
Chicago/Turabian StyleBuema, Gabriela, Maria Harja, Nicoleta Lupu, Horia Chiriac, Loredana Forminte, Gabriela Ciobanu, Daniel Bucur, and Roxana Dana Bucur. 2021. "Adsorption Performance of Modified Fly Ash for Copper Ion Removal from Aqueous Solution" Water 13, no. 2: 207. https://doi.org/10.3390/w13020207
APA StyleBuema, G., Harja, M., Lupu, N., Chiriac, H., Forminte, L., Ciobanu, G., Bucur, D., & Bucur, R. D. (2021). Adsorption Performance of Modified Fly Ash for Copper Ion Removal from Aqueous Solution. Water, 13(2), 207. https://doi.org/10.3390/w13020207