Article

Potential Ecological Risk Assessment of Heavy Metals in Cultivated Land Based on Soil Geochemical Zoning: Yishui County, North China Case Study

1
College of Earth Sciences, Chengdu University of Technology, Chengdu 610059, China
2
Shandong Institute of Geophysical and Geochemical Exploration, Jinan 250013, China
3
Institute of Geophysical & Geochemical Exploration, Chinese Academy of Geological Sciences, Langfang 065000, China
4
College of Earth Science and Engineering, Shandong University of Science and Technology, Qingdao 266590, China
*
Authors to whom correspondence should be addressed.
Water 2021, 13(23), 3322; https://doi.org/10.3390/w13233322
Submission received: 3 November 2021 / Revised: 21 November 2021 / Accepted: 22 November 2021 / Published: 23 November 2021

Abstract

:
Various human production activities have caused tremendous damage to the soil ecological environment of cultivated land. Regional ecological risk assessments and the safe use of cultivated land have received widespread attention. The ecological risk assessment of heavy metals based on soil geochemical zoning has not been reported in the past. Using 14,389 topsoil samples, considering comprehensive geological background information, Yishui County in northern China was divided into three soil geochemical areas and 14 soil geochemical sub-regions by means of principal component factor superposition. The results of environmental quality and risk assessments of eight heavy metals based on soil geochemical zoning show that the single pollution index was greater than 1.0 and the Nemerow pollution index was greater than 0.7 for Ni in a sub-region, indicating that Ni pollution had reached the early warning limit, which demonstrates that Ni has a certain enrichment trend. Meanwhile, the geoaccumulation index of Ni and Cr was greater than zero in some sub-regions, indicating a slight pollution level. In addition, the potential ecological risk factor of the measured heavy metals was greater than 40 in 9 sub-regions, indicating a moderate ecological hazard, and the risk index was greater than 150 in a sub-region, revealing moderate ecological intensity, in which Hg and Cd were leading contributors to potential ecological hazards with a contribution rate between 58% and 76%. This method is suitable for the evaluation of soil environmental quality and safety for medium and large scales, and can provide a scientific basis for further zoning and grading prevention and control of soil pollution in cultivated land.

1. Introduction

According to a report of the National General Survey of Soil Contamination in China (2014), the total excess rate of heavy metals in soil is 16.1%, of which the proportions of slightly, lightly, moderately, and severely polluted sites were 11.2, 2.3, 1.5 and 1.1%, respectively, and the excess rates of Cd, Hg, As, Pb, Cu, Cr, Zn, and Ni were 7.0, 1.6, 2.7, 1.5, 2.1, 1.1, 0.9 and 4.8%, respectively. Soil heavy metal pollution as a result of natural background and anthropogenic factors significantly affects environmental quality [1,2,3,4,5,6,7,8,9,10,11]. Heavy metal pollution can not only cause changes in soil composition, structure and function, but also inhibit crop root growth and photosynthesis, resulting in crop yield reduction or even no harvest. More importantly, As, Cd and other elements, as heavy metal elements with strong toxicity in the soil environment, have strong accumulation and bioaccumulation. They can be transformed into crops through soil crops in the cultivated soil, and endanger human health through the food chain [12,13,14]. China’s Soil Pollution Prevention and Control Action Plan (2016) states that it is necessary to implement classification based grading prevention, control soil pollution with respect to the most stringent farmland protection system, and prioritize protecting the soil environmental quality and safety of agricultural land. Currently, regional ecological risk assessments and the safe utilization of cultivated land are of increasing public concern [15,16,17].
In recent years, significant progress has been made in related fields. In terms of soil pollution evaluation, a variety of evaluation methods based on water and soil ecological risk evaluations have been developed, including the pollution load index method [15,18,19,20,21,22,23], the Nemerow pollution index method [15,20,24,25,26,27,28,29,30,31], the geoaccumulation index method [32,33,34,35,36,37], and the potential ecological hazard index method [10,18,25,26,27,30,38,39]. Based on a geochemical survey of land quality, China has gradually formed a methodical system for conducting cultivated land quality [17,40,41] and geochemical evaluations [42]. However, with the continuous development of regional large-scale land quality geochemical surveys in China, a set of efficient and effective regional assessment methods with high survey accuracy and a large amount of elemental data to evaluate heavy metal ecological risk has not been developed [17,43]. Unlike previous studies, this study is based on the 1:50,000 land quality geochemical survey, and aims to achieve the following objectives: (1) extract the key influencing factors via a principal component analysis (PCA) superimposed with the background for soil geochemical zoning; (2) evaluate the environmental quality status and potential ecological risk of eight heavy metals in soil geochemical zoning; and (3) the relationship between different evaluation methods is discussed. This study selected Yishui County, a typical agricultural county in northern China, as a case study, and will provide pertinent information for zoning risk assessments and controlling heavy metal pollution in agricultural lands.

2. Materials and Methods
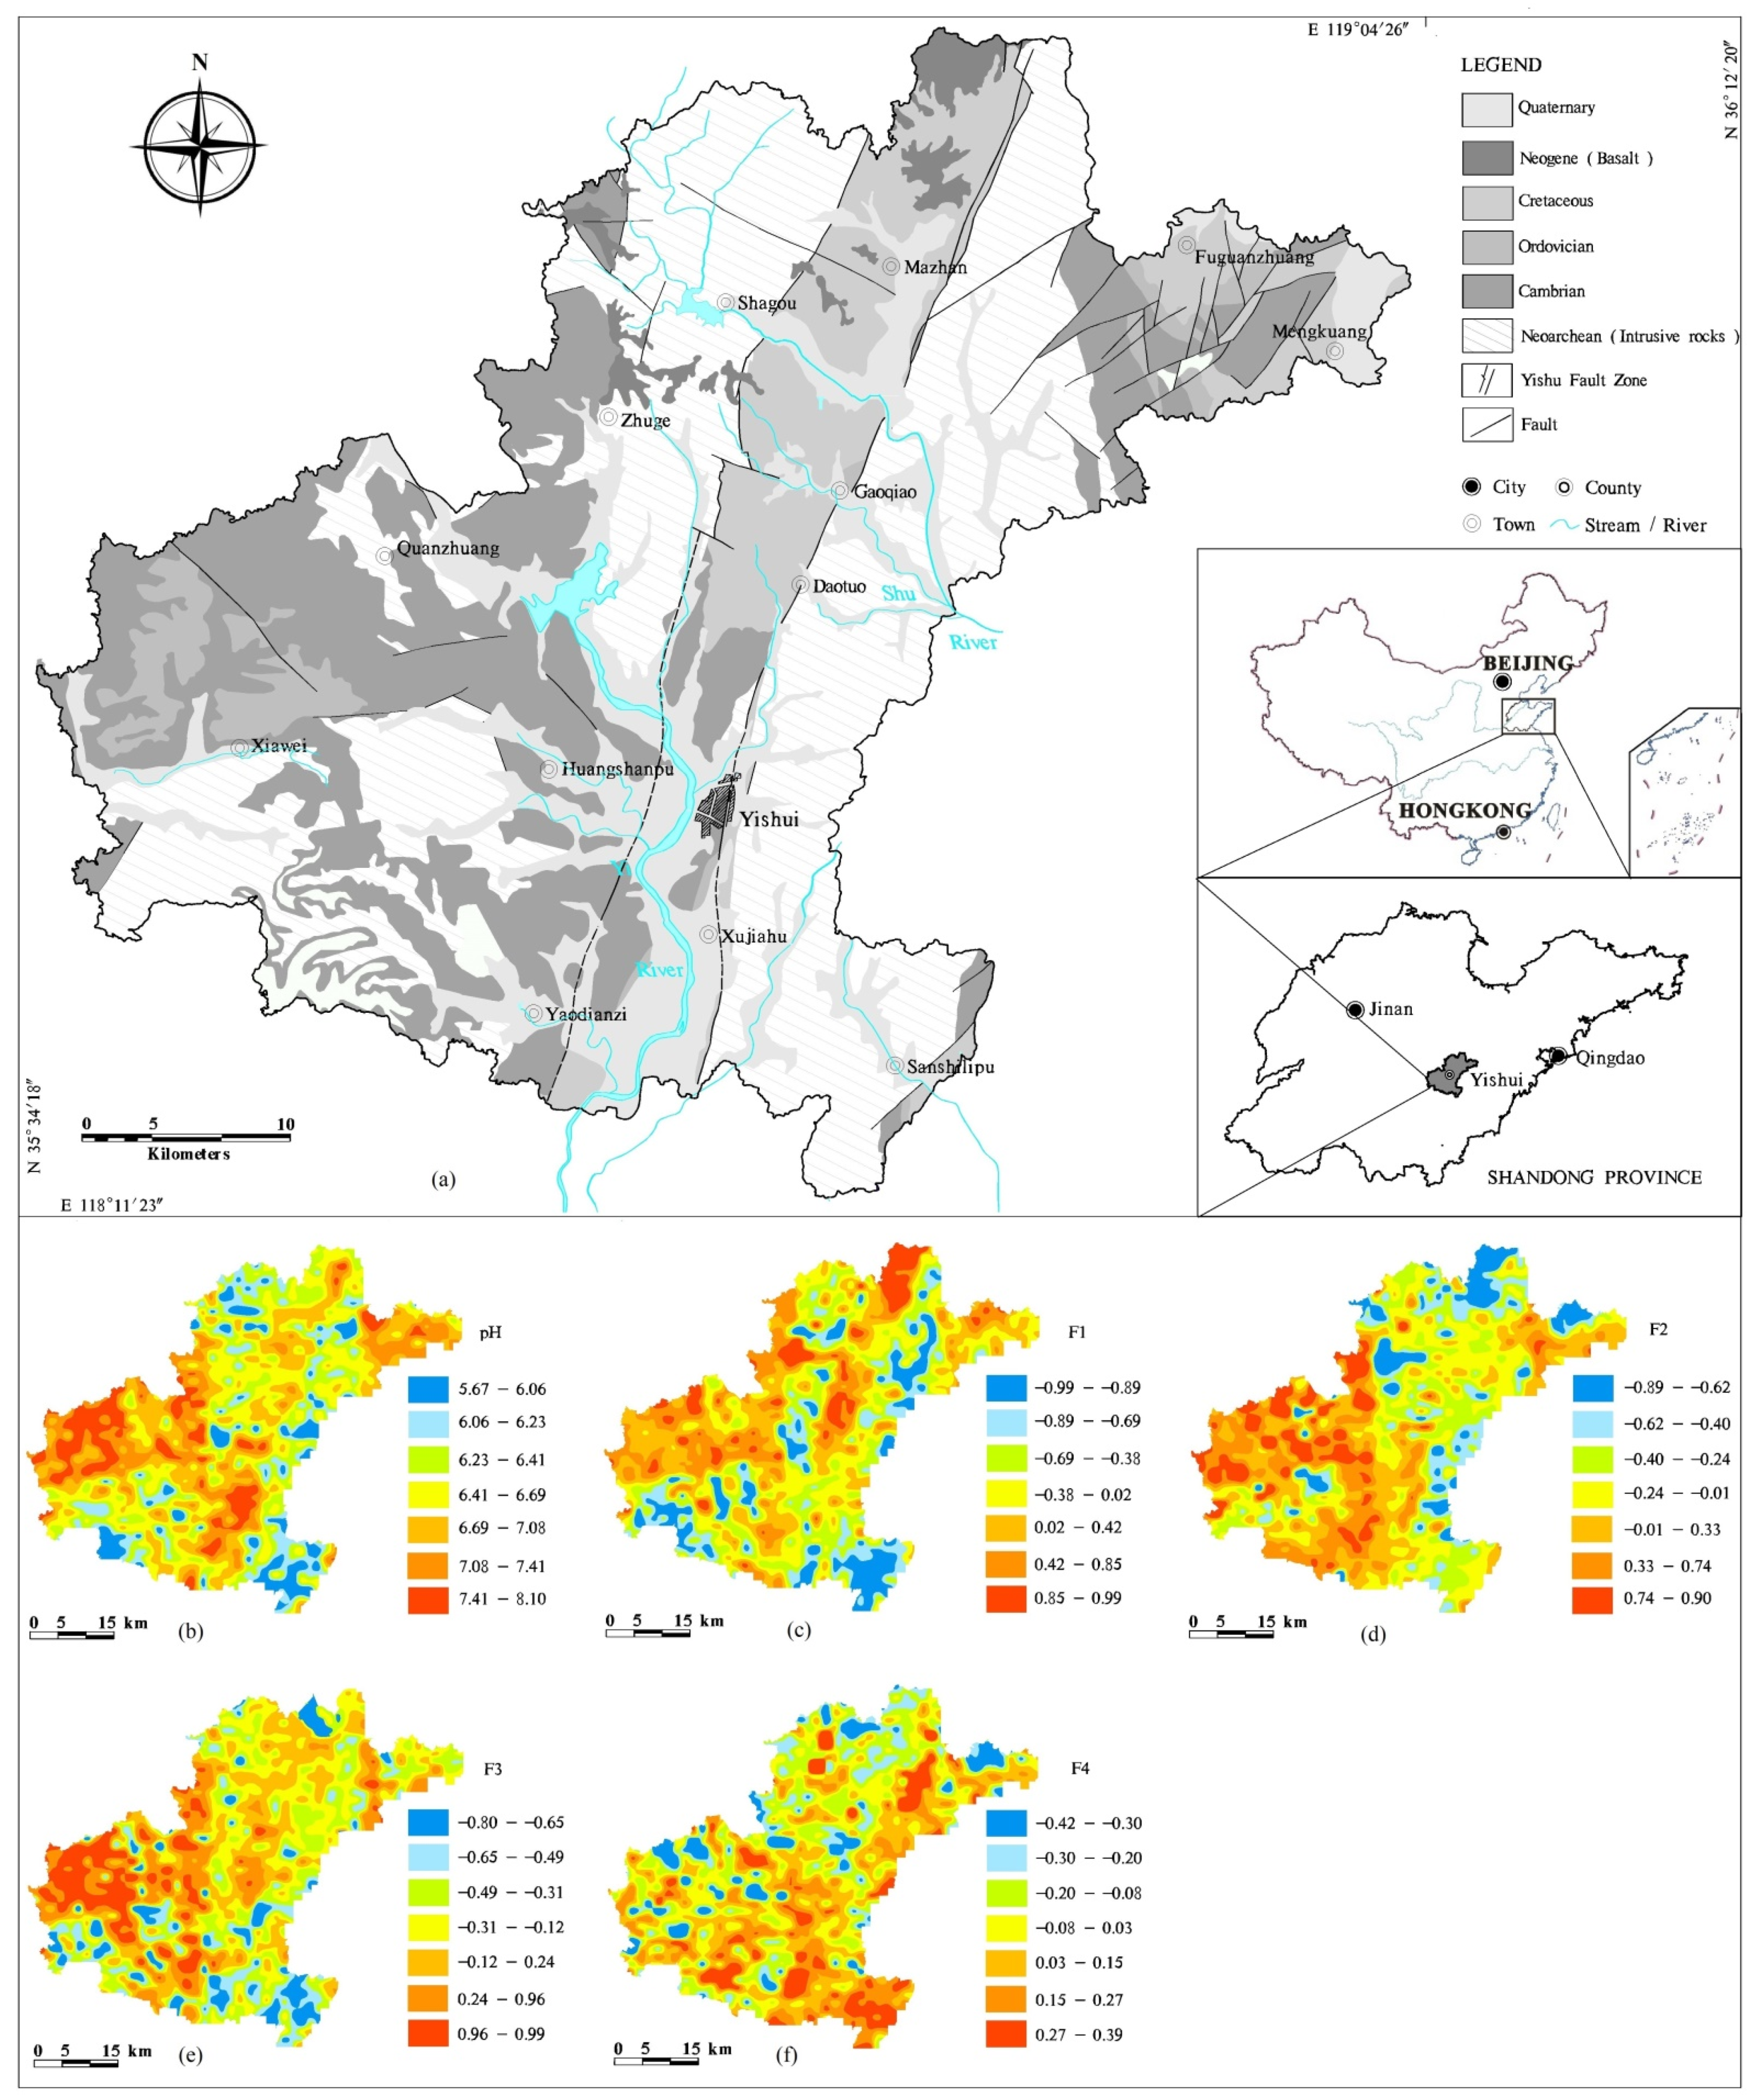
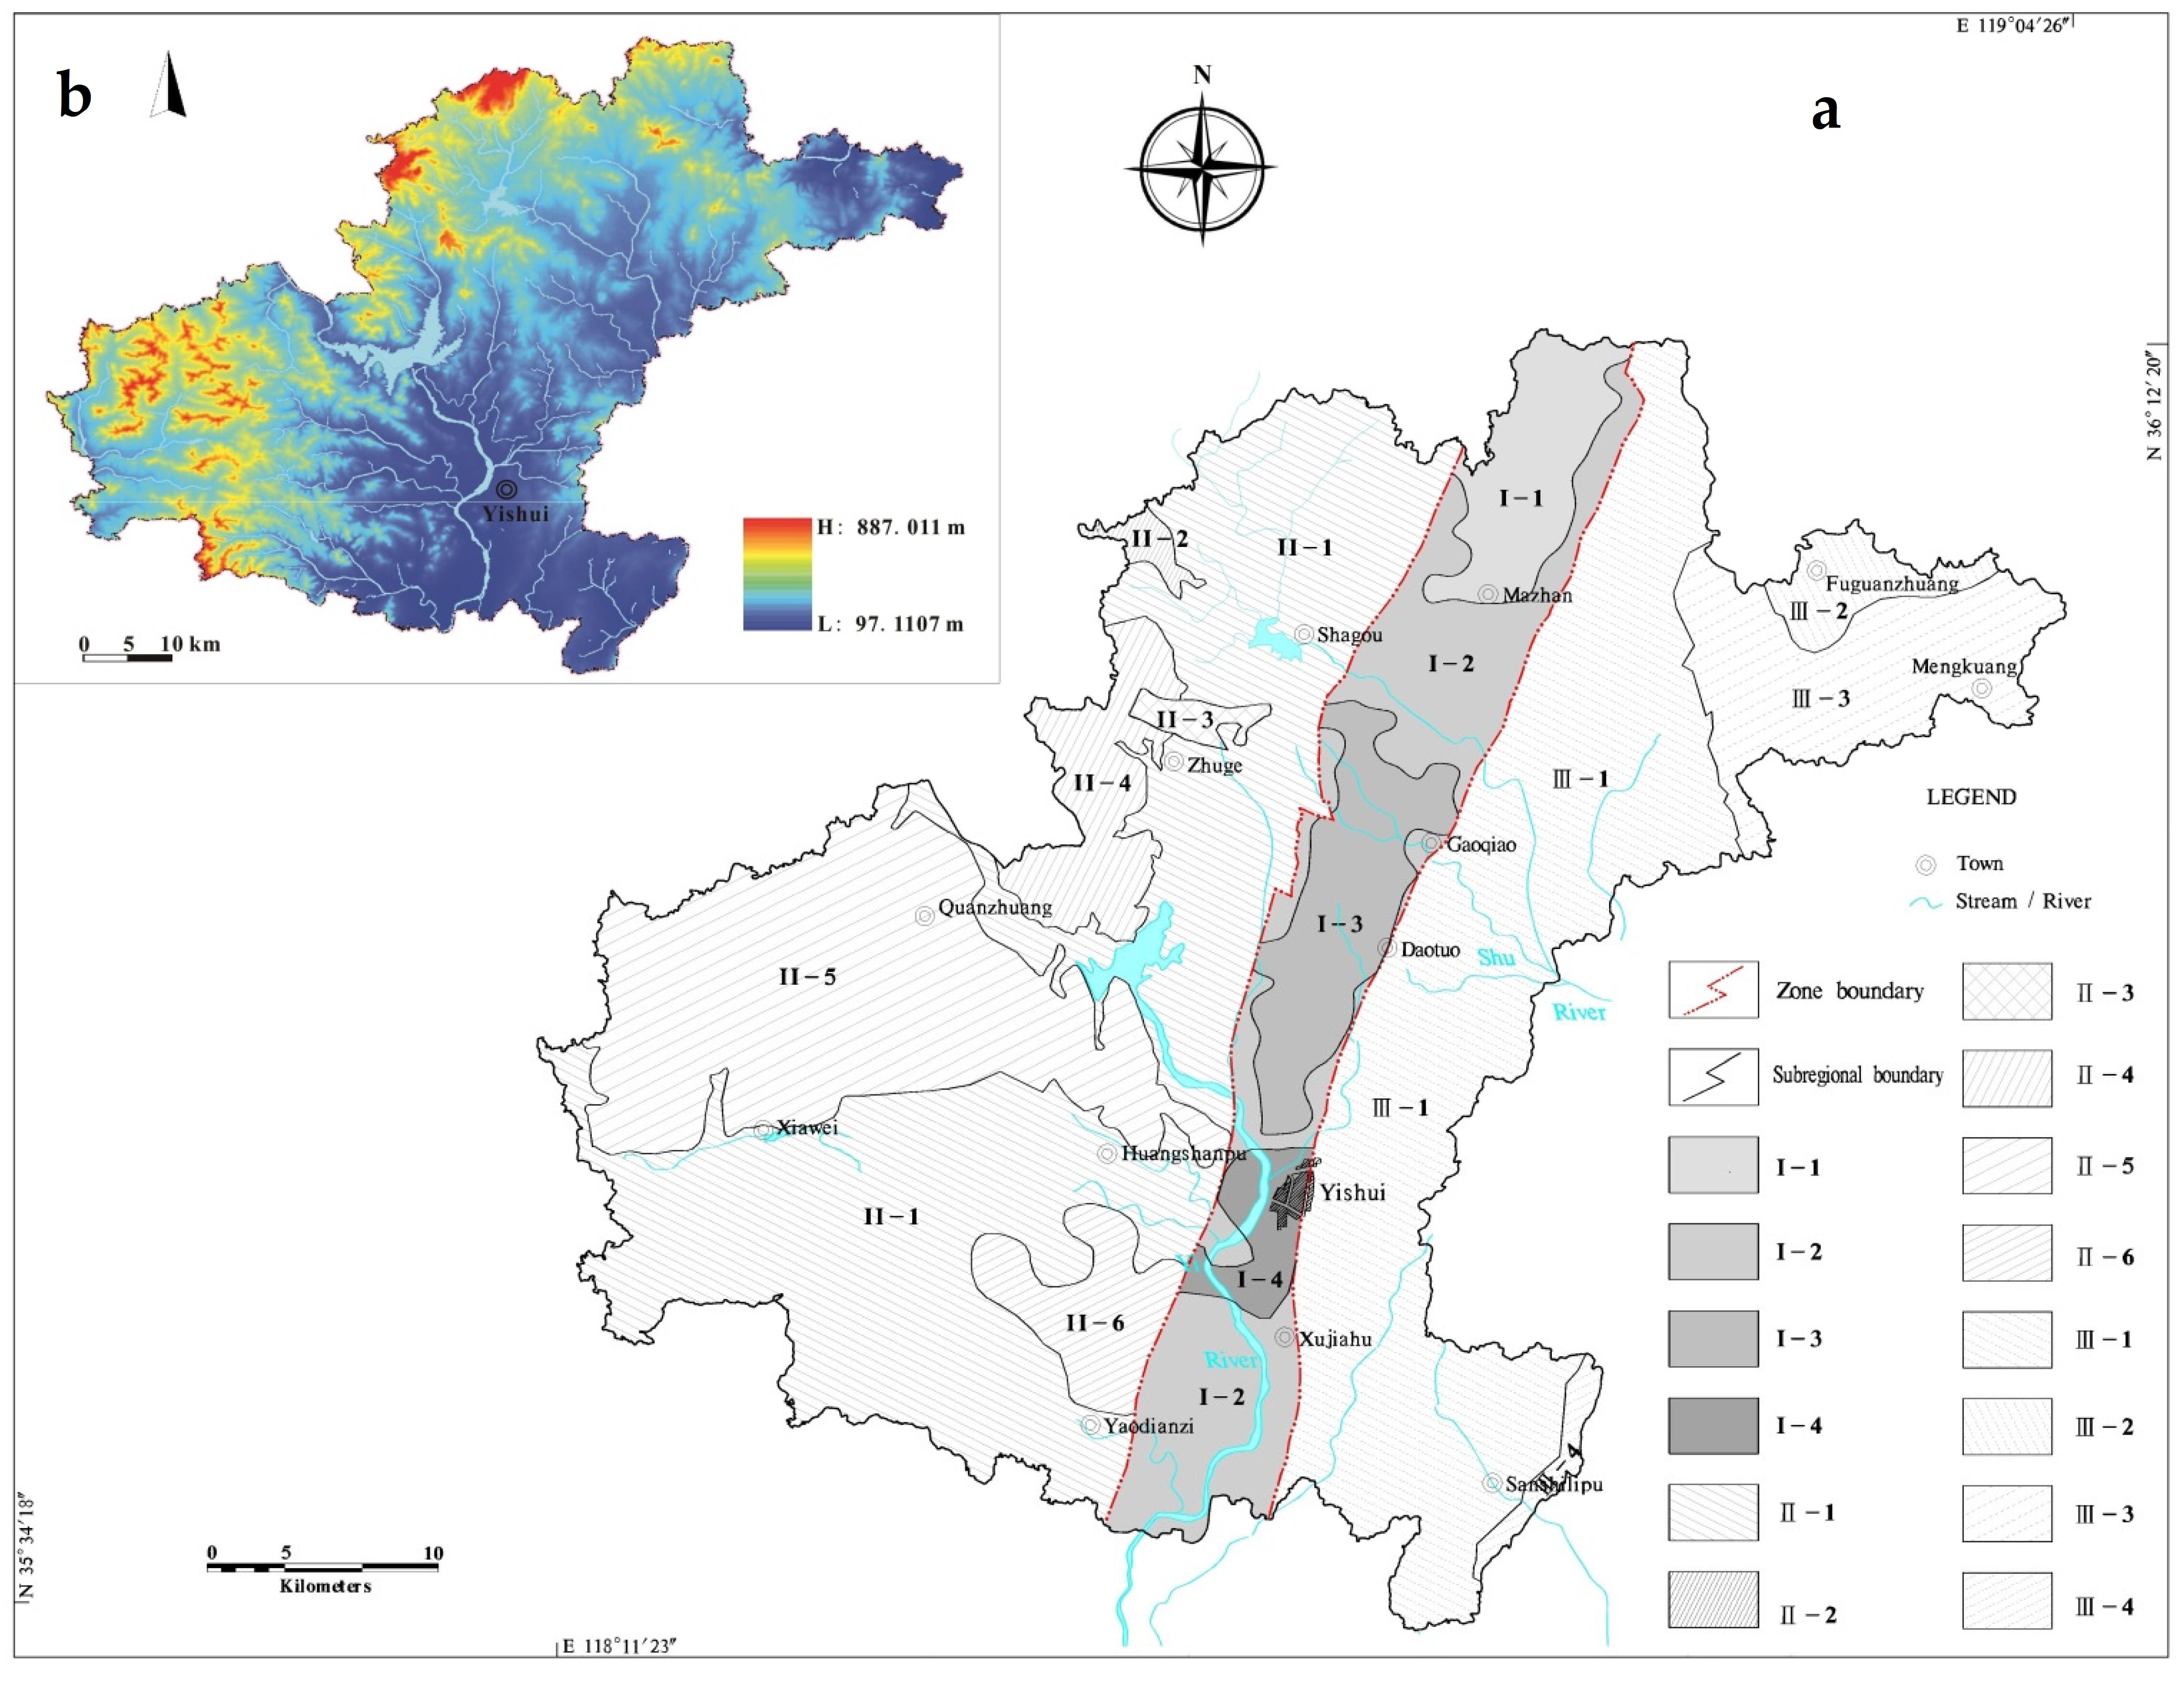
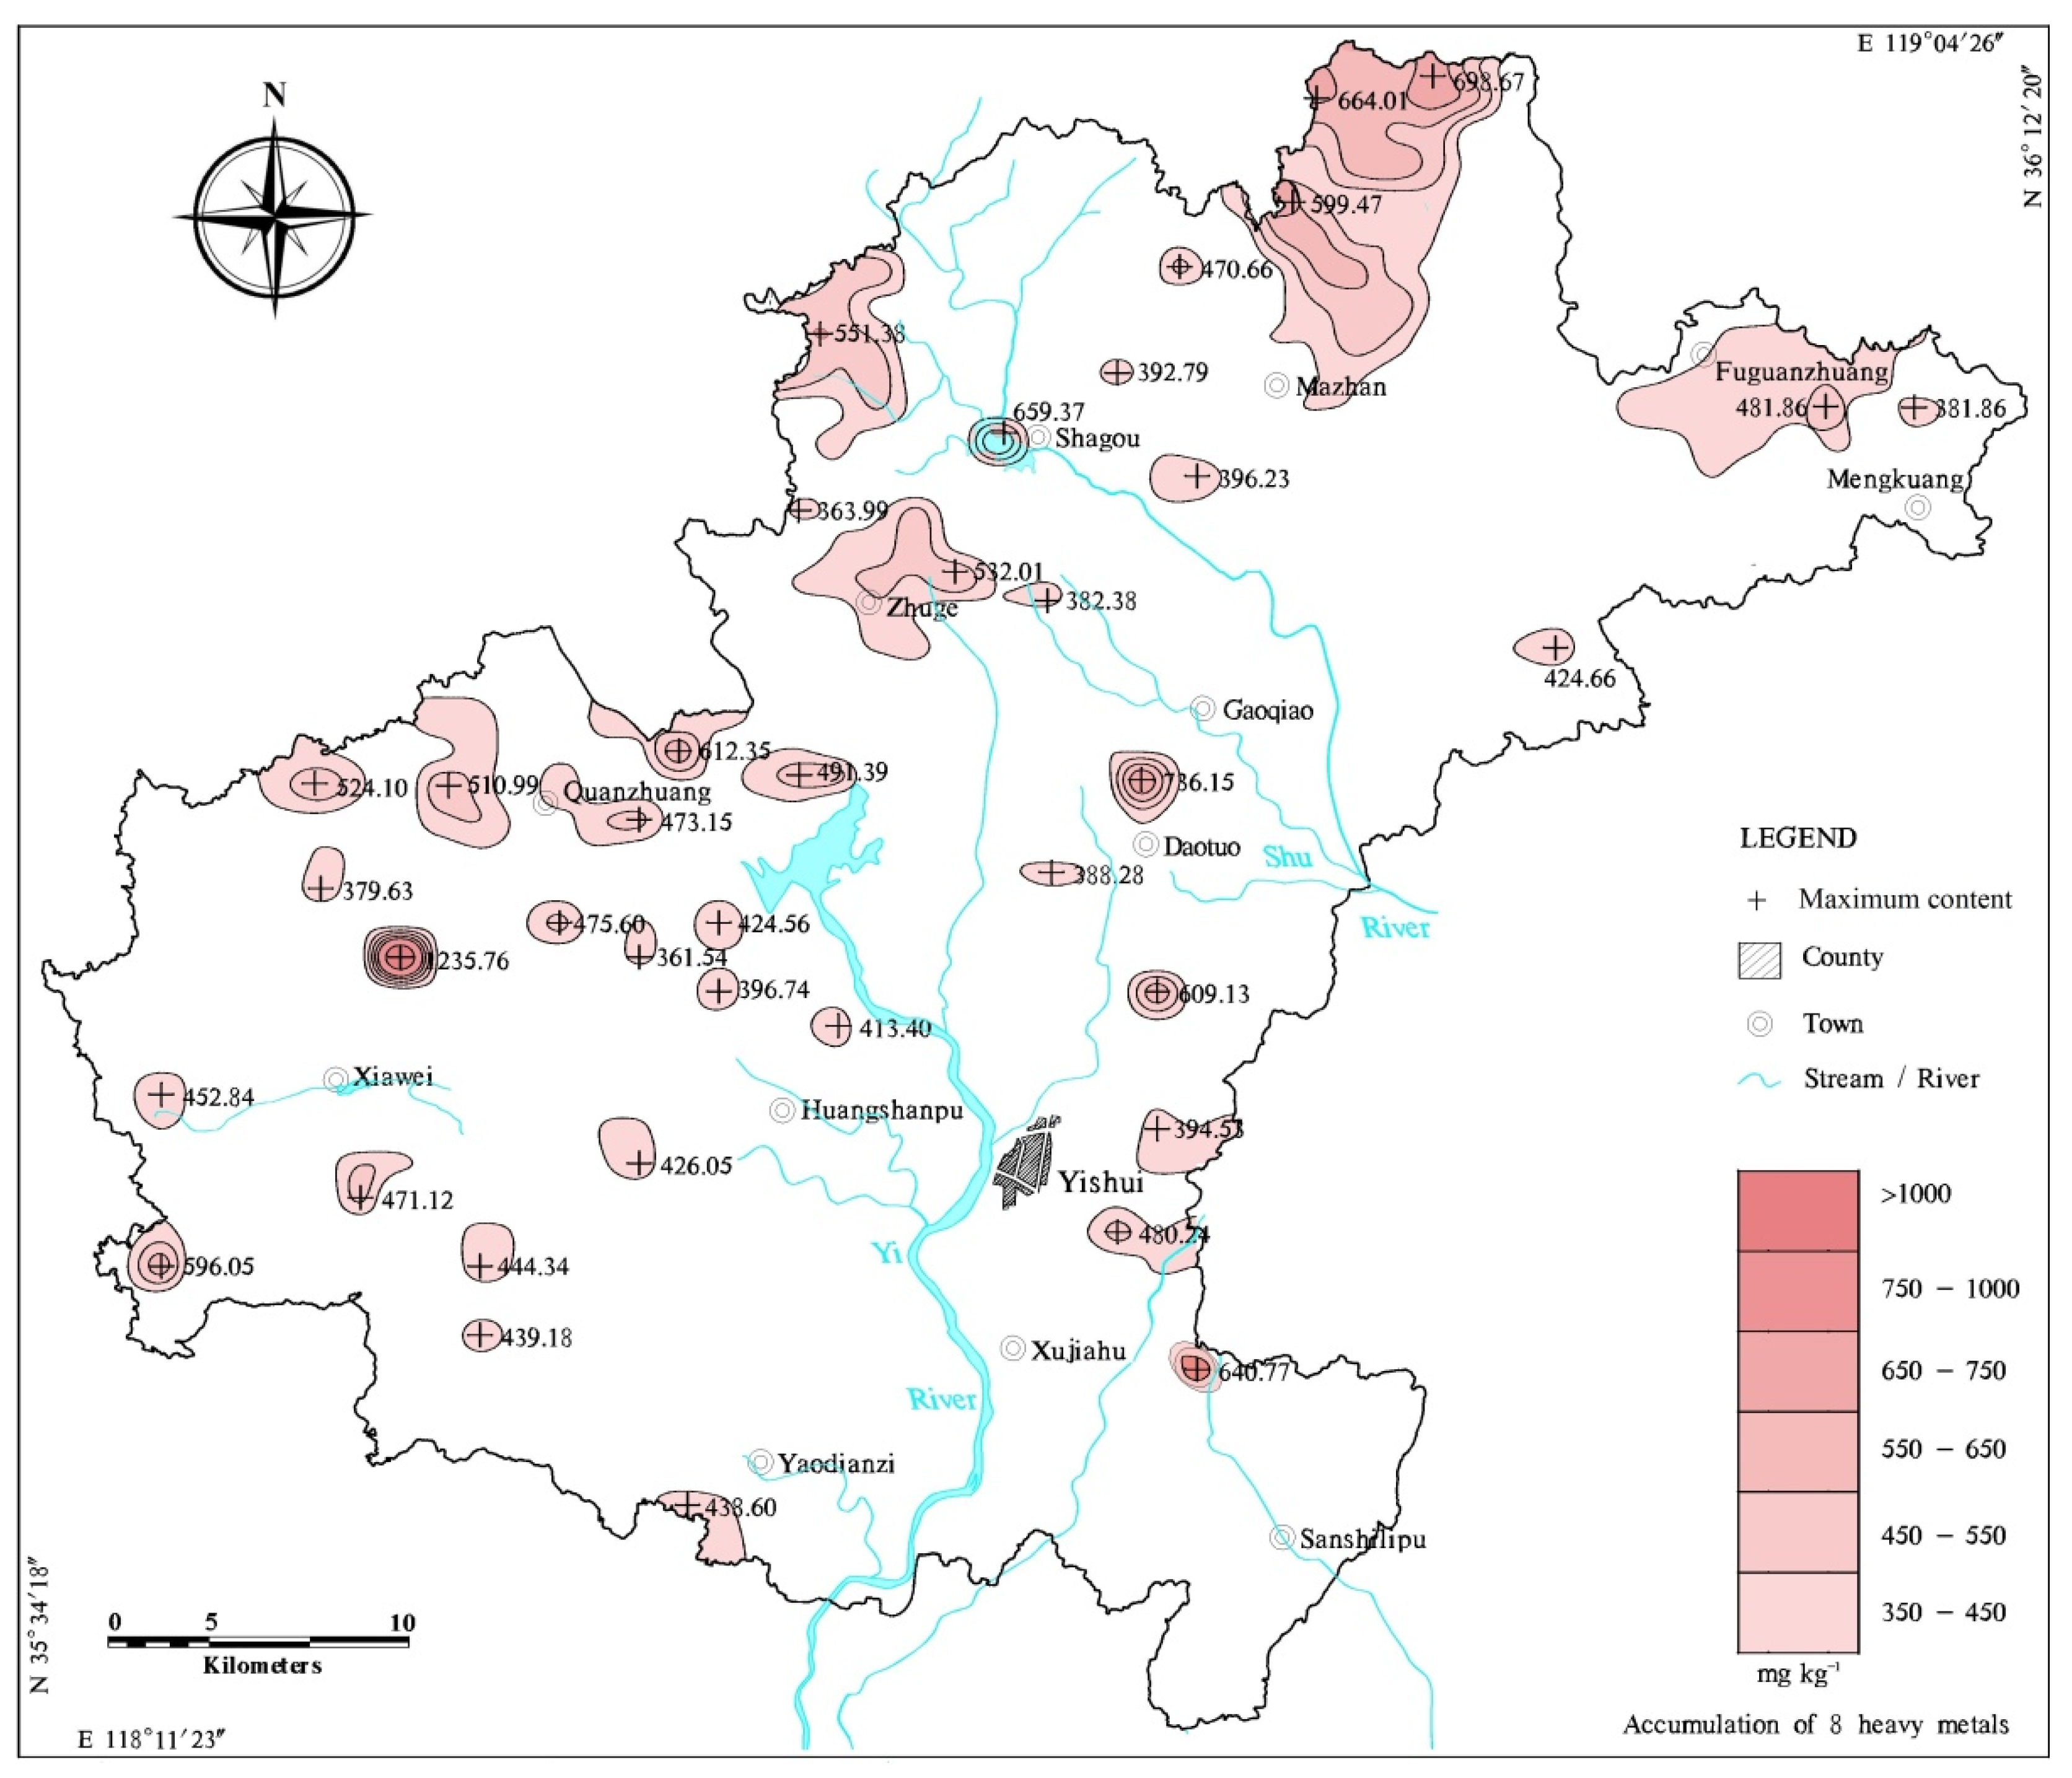
2.1. Study Area

Yishui County is an ecological landscape city in south-central Shandong Province (Figure 1a). The terrain slopes from northwest to southeast, with low mountains and hills in the west and northwest, and plains in the middle and south. Yishui County has a warm temperate monsoon climate zone. The annual average temperature is 12.3 °C, and the annual average precipitation is 784.8 mm. The geotectonic location of the area lies in the Luxi Uplift of the North China Plate. It is divided into two tertiary tectonic units, wherein the Yishu Fault is the boundary. West Yishui County is located in the east of the Luzhong Uplift, while east Yishui County is located in the Yishu fault zone. Its stratum is relatively complete, the geological structure is complex, and intrusions are relatively developed (Figure 1a). The central and southern parts of Yishui County are widely covered by Quaternary material. The soil-forming parent materials are mainly Quaternary Linyi Formation fluvial alluvial facies clastic deposits, Yihe Formation modern fluvial gravel-bearing coarse clastic deposits, and the Heituhu Formation residual slope accumulation on top of low mountains and hills. The Mesozoic and Paleozoic strata are primarily distributed in the west of Yishui County near the Yishu Fault Zone, displaying exposed Cretaceous, Ordovician, and Cambrian strata. There are magmatic rocks in Yishui County (Figure 1a), including predominantly Neoarchean intermediate-acid intrusive rocks distributed in large areas, and a small number of gray-black basalts in the Linqu Group (NL) of Neogene. The soil types include brown, drab, alluvial, and skeleton soils. The distribution of soil types is closely related to the geological background and soil parent material. The area of Yishui County is 2434.8 km2, of which 80% is cultivated land and 75% is hilly land, making it a typical mountainous agricultural county.

2.2. Sampling and Analysis

According to the Specification of Land Quality Geochemical Assessment (DZ/T 0295-2016), the surface soil sampling sites were selected based on the latest land use map. In total, 14,389 surface soil samples (0–20 cm) were collected from the entire county with a grid of 1 km × 1 km, in which the sampling density was 6 points/km2. Each sample was composed of undisturbed soil with three to five points of equal weight, and the original fresh sample weight was not less than 1500 g. Based on the geological background and pollution characteristics, 16 elements were selected for principal component analysis and soil geochemical zoning, and eight heavy metals were considered in the potential ecological risk assessment.
The topsoil samples were dried naturally and passed through a 2 mm diameter nylon sieve. For each sample, 100 g was obtained via a division machine for sample preparation, ground and passed through a 75 μm diameter nylon sieve for analysis. The Pb, Zn, Cu, Ni, Cr, Co, and V concentrations were determined using X-ray fluorescence spectrometry (Axiosmax, Almelo, The Netherlands). The Cd concentration was determined using graphite furnace atomic absorption spectrometry (PerkinElmer AA600, Norwalk, CT, USA). The As, Hg, and Sb concentrations were determined via hydride generation atomic fluorescence spectrometry (AFS-9750, Beijing, China), and the K, Mn, Fe, and Mo concentrations were determined using inductively coupled plasma emission spectroscopy (AVIOtm200, Norwalk, CT, USA). The F concentration was determined using the ion-selective electrode method. During sample testing, one duplicate sample and four soil national reference materials were inserted into every 50 samples as quality control. The qualified rate of the sample repeatability test was 91–96%, and the qualified rate of the abnormal samples repeat test was 93–97%, which met the Specification of multi-purpose regional geochemical survey (DZ/T 0258-2014). The accuracy and relative standard deviation of the national reference materials met the requirements of Specification of Land Quality Geochemical Assessment (DZ/T 0295-2016). The samples were tested at the Central Laboratory of the Shandong Bureau of Geology and Mineral Resources.

2.3. Evaluation Method

2.3.1. Soil Geochemical Zoning

As a result of China’s regional geochemical exploration, a set of optimized exploration methods and technology systems has been developed, instigating remarkable achievements. In exploration geochemistry, geochemical zoning is performed using the information contained in the chemical elements of geochemical exploration samples, which provide a detailed basis for direct and indirect indications of geological, mineral, and environmental information [44]. In recent years, geochemical zoning has been applied in supergene geochemical exploration, agriculture, and environmental investigations [44,45]. Soil geochemical zoning requires the further development of geochemical zoning and the application of related methods and theories. Its premise is to comprehensively understand the distribution of soil element contents in a study area [45]. Currently, soil geochemical surveys are known as the “gene” project of surface geoscience research. Soil geochemical survey data are the basis of soil geochemical zoning, which is performed to analyze the distribution characteristics and combination rules of soil chemical elements based on spatial changes and key influencing factors of the elements present considering the soil parent material, soil (texture) type, geographical and geomorphic differences, and human influence using a unified geochemical standard to separate soil geochemical ranges.

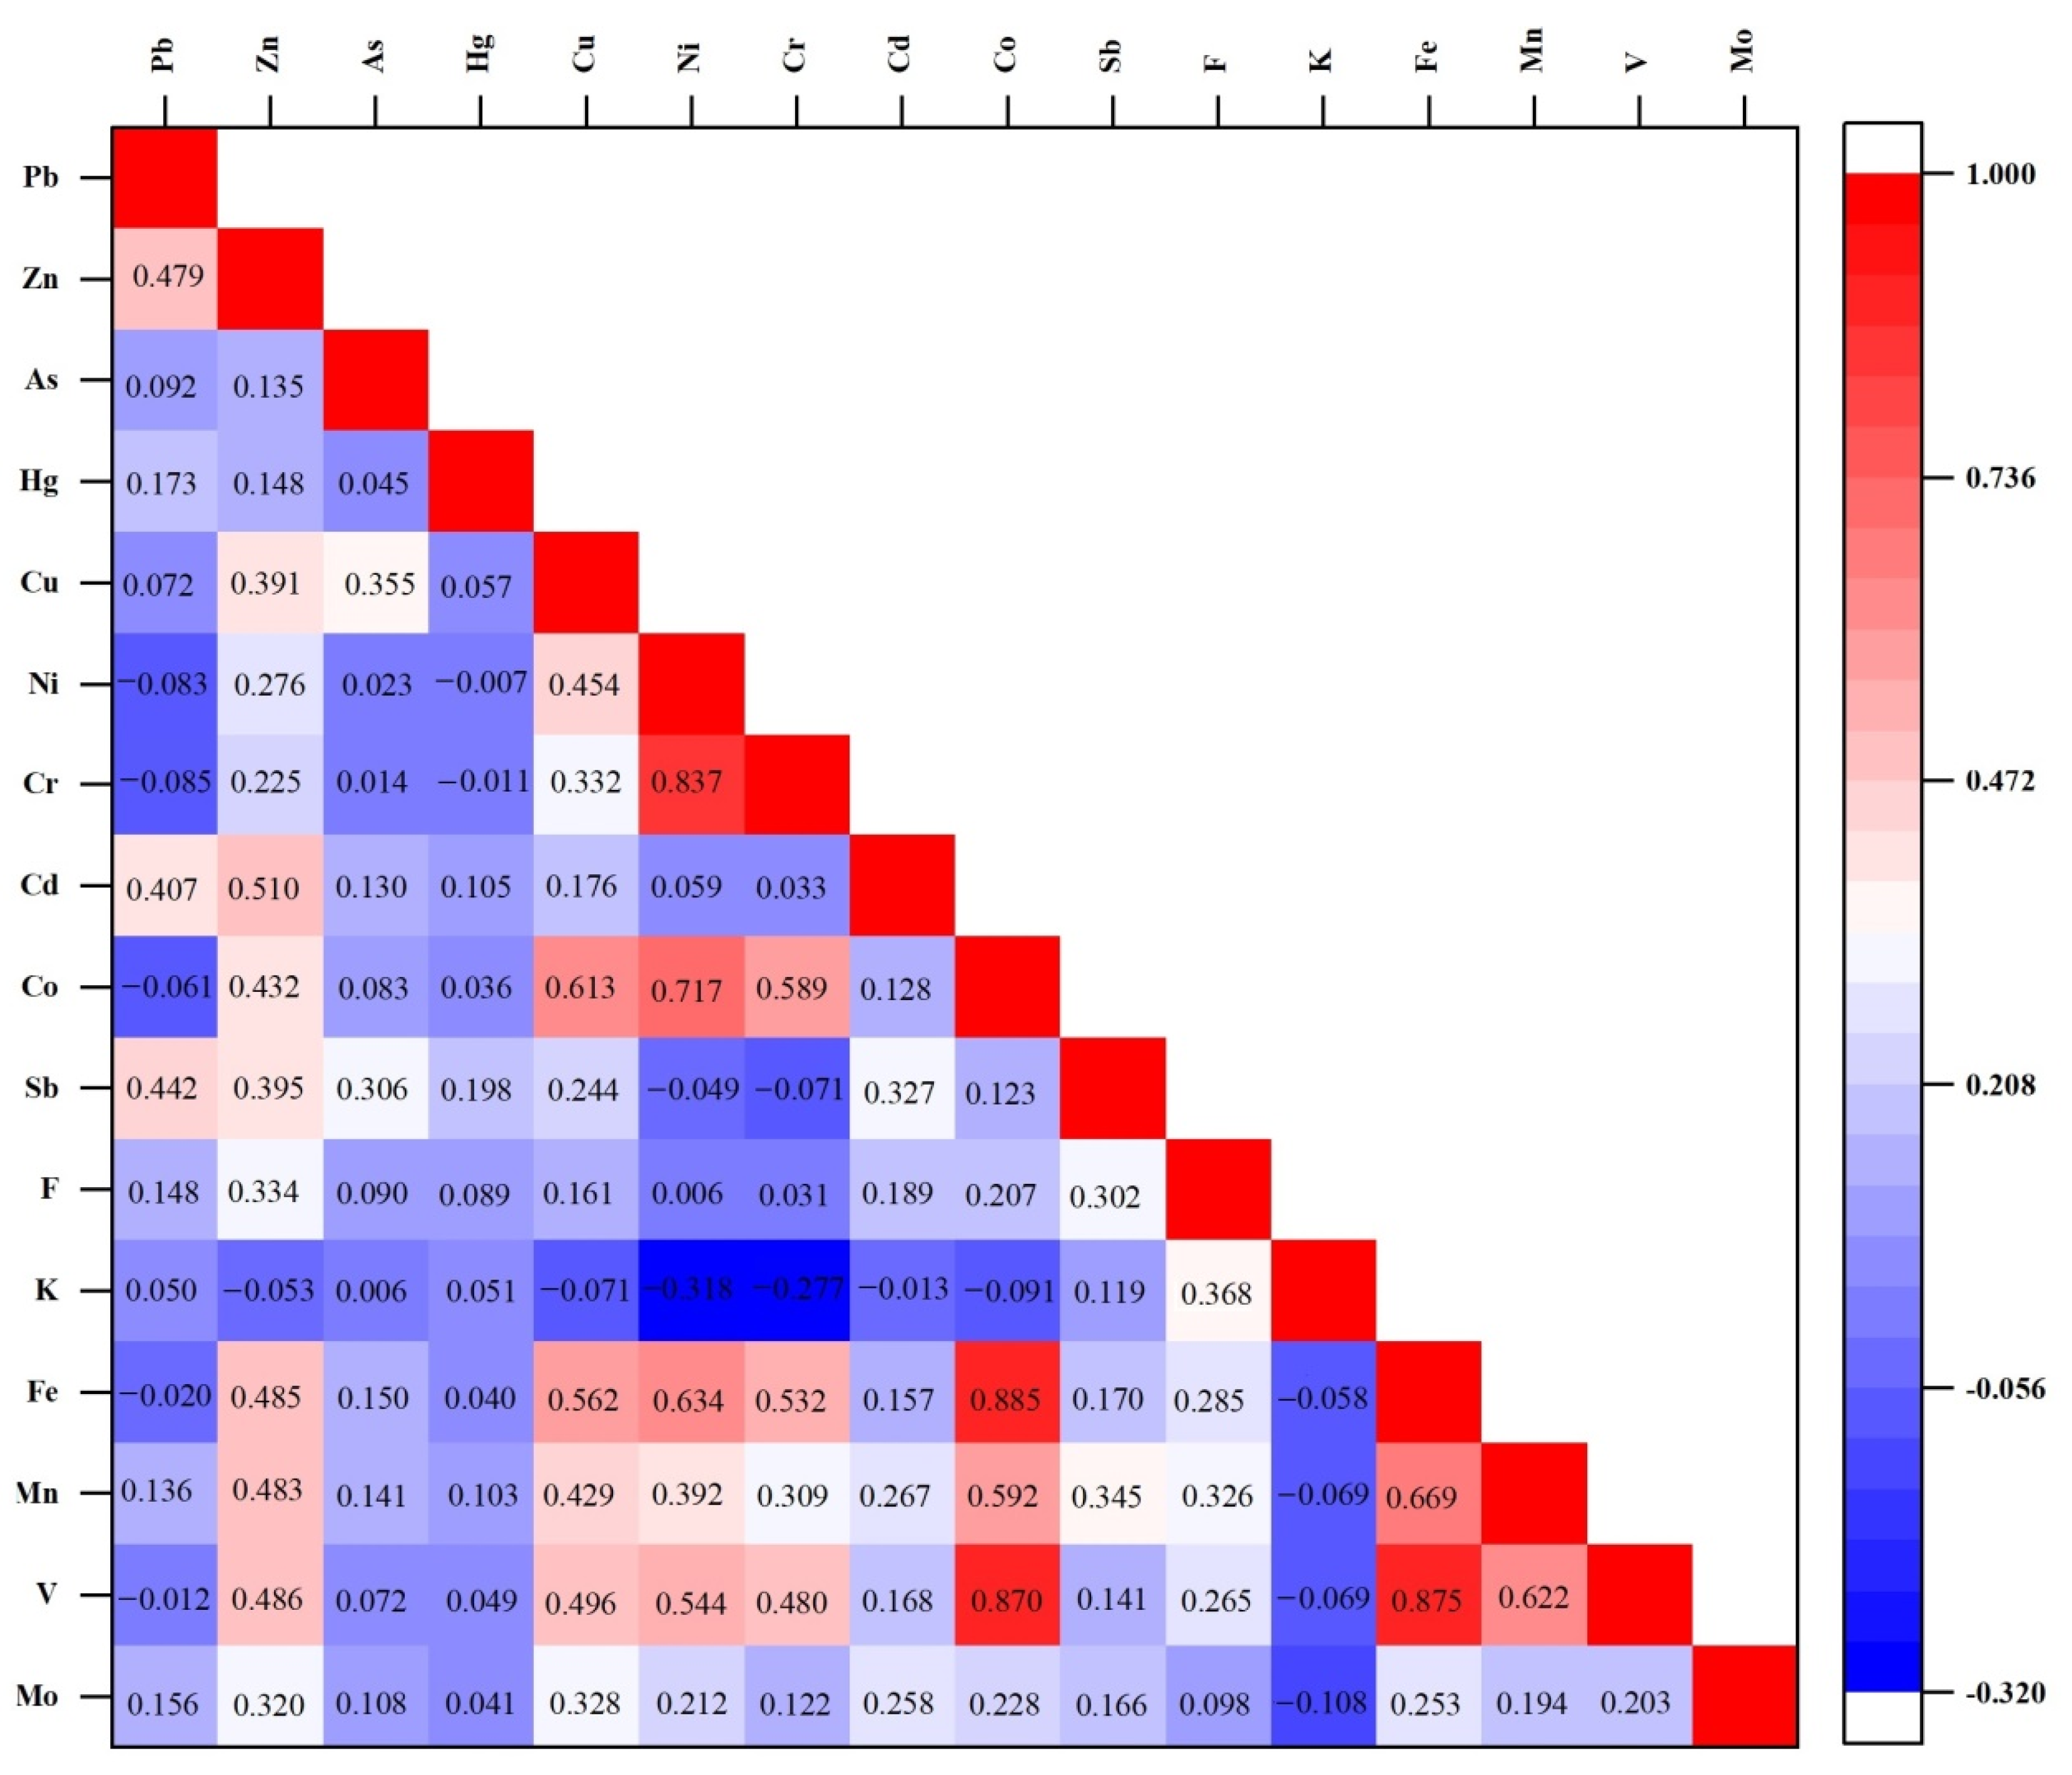
2.3.2. Principal Component Analysis and Its Test

A PCA reduces the dimension of the data while maintaining the maximum contribution of the dataset to variance by analyzing the characteristics of a covariance matrix [46,47,48]. Herein, the statistical package SPSS (version 22.0; IBM, Armonk, New York, NY, USA) was used for the PCA, and 16 elements in the soil samples were transformed into characteristic factors represented by four principal component factors. To exclude the influence of contingency, the Kaiser-Meyer-Olkin (KMO) test and the Bartlett’s test of sphericity were employed to determine whether the soil chemical element data of the survey area were suitable for factor analysis. In this study, the KMO test resulted in 0.826, making it acceptable for a PCA according to the KMO measurement standard. Meanwhile, the p-value of Bartlett’s test of sphericity was small (p < 0.0001), which meant the significance is large. As this is below the significance level α (0.05), the effect of the factor analysis of the variable sample data is considered to be very good, and its analysis results will reflect the genetic relationship between elements well.

2.3.3. Evaluation of Soil Environmental Quality

The soil environmental quality was evaluated using the single heavy metal pollution index (Pi) and the Nemerow pollution index (PN) [26,29,31], which were calculated as follows:
P i = C i S i
P N = P m e a n 2 + P i m a x 2 2
where Pi is the single pollution index of heavy metal i in the soil geochemical sub-region, Ci (mg kg−1) is the average content of heavy metal i in the soil geochemical sub-region, Si (mg kg−1) is the risk screening value of soil pollution in the cultivated land of heavy metal i (GB 15618-2018), PN is the Nemerow pollution index, Pmean is the average Pi of each heavy metal, and Pimax is the maximum Pi of each heavy metal in the soil geochemical sub-region. The pollution levels of the Nemerow index are classified as listed in Table 1.

2.3.4. Geoaccumulation Index

The geoaccumulation index (Igeo) is a quantitative index used to study the degree of heavy metal pollution in soil and sediment [20,33]). It is calculated as follows:
Igeo = log2[Ci/(1.5 × Bi)]
where Ci (mg kg−1) is the average content of heavy metal i in the soil geochemical sub-region, and Bi (mg kg−1) is the geochemical background value of heavy metal i in the Shandong Province [49]. The Igeo pollution levels of soils are listed in Table 2.

2.3.5. Potential Ecological Risk Index

The potential ecological hazard index is used to evaluate heavy metals in soil or sediment from the perspective of sedimentology [25,27,39,50]. It is calculated using the following:
E r i   =   T r i × ( C i C n i )
R I = i = 1 n E r i
where Eir is the individual potential ecological risk factor of heavy metal i in the soil geochemical sub-region, and Tir is the biological toxic factor of heavy metal i. Note that the toxic-response factors for Zn, Cr, Cu, Ni, Pb, As, Cd, and Hg are 1, 2, 5, 5, 5,10, 30 and 40, respectively [27,39,50]. In addition, Ci (mg kg−1) is the average content of heavy metal i in the soil geochemical sub-region, Cin (mg kg−1) is the geochemical background value of heavy metal i in the Shandong Province [49], and RI is the comprehensive potential ecological risk index of heavy metals in the soil geochemical sub-region. The potential ecological risk levels and intensities of heavy metals in soils are summarized in Table 3.

3. Results

3.1. Soil Geochemical Zoning

According to a multipurpose regional geochemical survey, Yishui County belongs to the distribution area of residual slope alluvial medium to acidic soil in the middle and south of the Shandong Province [45,49]. The supergene geochemical spatial distribution of the elements in this area is closely related to its geological background. Based on the soil geochemical investigation in Yishui County, a PCA of 16 elements in surface soil samples was conducted. First, the data standardization process was carried out on all variable data, and the correlation coefficient matrix of the elimination dimension was obtained (Figure 2). Second, based on sampling adequacy measurements and significance tests (KMO and Bartlett’s test of sphericity), the first four factors with initial eigenvalues greater than 1.0 in the total variance extracted via the PCA were selected as the main influencing factors of “significance” (Table 4), wherein the cumulative variance contribution rate was 64.9%. Meanwhile, the variables with values greater than 0.5 in the principal component load coefficient matrix (Table 5) were considered to be the main load element group of corresponding factors, meaning it was a combination of multiple elements with certain genetic relationships. In addition, the main factor structural formula and soil chemical element attributes reflecting the principal component factor group were obtained (Table 4).
pH is often regarded as the main variable of soil [51], as it affects the distribution and migration of soil chemical elements. The pH distribution of topsoil in Yishui County ranges from 6.23 to 7.08 (Figure 1b), indicating it is moderately acidic. The variation coefficient of pH is 9.61%, meaning it is weak, and the data dispersion is small.
The soil geochemical zoning method was implemented as follows. First, based on the tectonic division grade (Figure 1a) of Yishui County, the main acid-alkaline boundary of the pH geochemical map was superimposed to define (Figure 1b) the soil geochemical regions (I, II, and III in Figure 3b). Next, different element combinations represented by four principal component factors were superimposed (e.g., Figure 1c–f) to define the soil geochemical sub-regions (Figure 3b). Using the F1–F4 factor score geochemical map as an example, the contents in the geochemical factor stoichiometry map from top to bottom correspond to geochemical classifications with cumulative frequencies of 10, 20, 35, 55, 75, 90 and 100%. The boundary between the middle and high value areas with a cumulative frequency of more than 75% and low-value areas with a cumulative frequency of less than 20% are set as overlay lines. The overlay lines of the first four main factor scores were extracted to the geological background and pH grading map to divide the soil geochemical zones. Finally, the survey area was divided into three soil geochemical regions and 14 soil geochemical sub-regions (Figure 3b). Each soil geochemical region or sub-region reflects the element combination inferred from the soil chemical attributes of the related factors. Note that there is a geochemical correlation among the elements in each region. Heavy metal content is often the dominant factor affecting the pollution level and ecological risk status of soil geochemical sub-regions. Based on the soil geochemical sub-regions identified, the potential ecological risk of eight heavy metals in cultivated land soil was discussed.

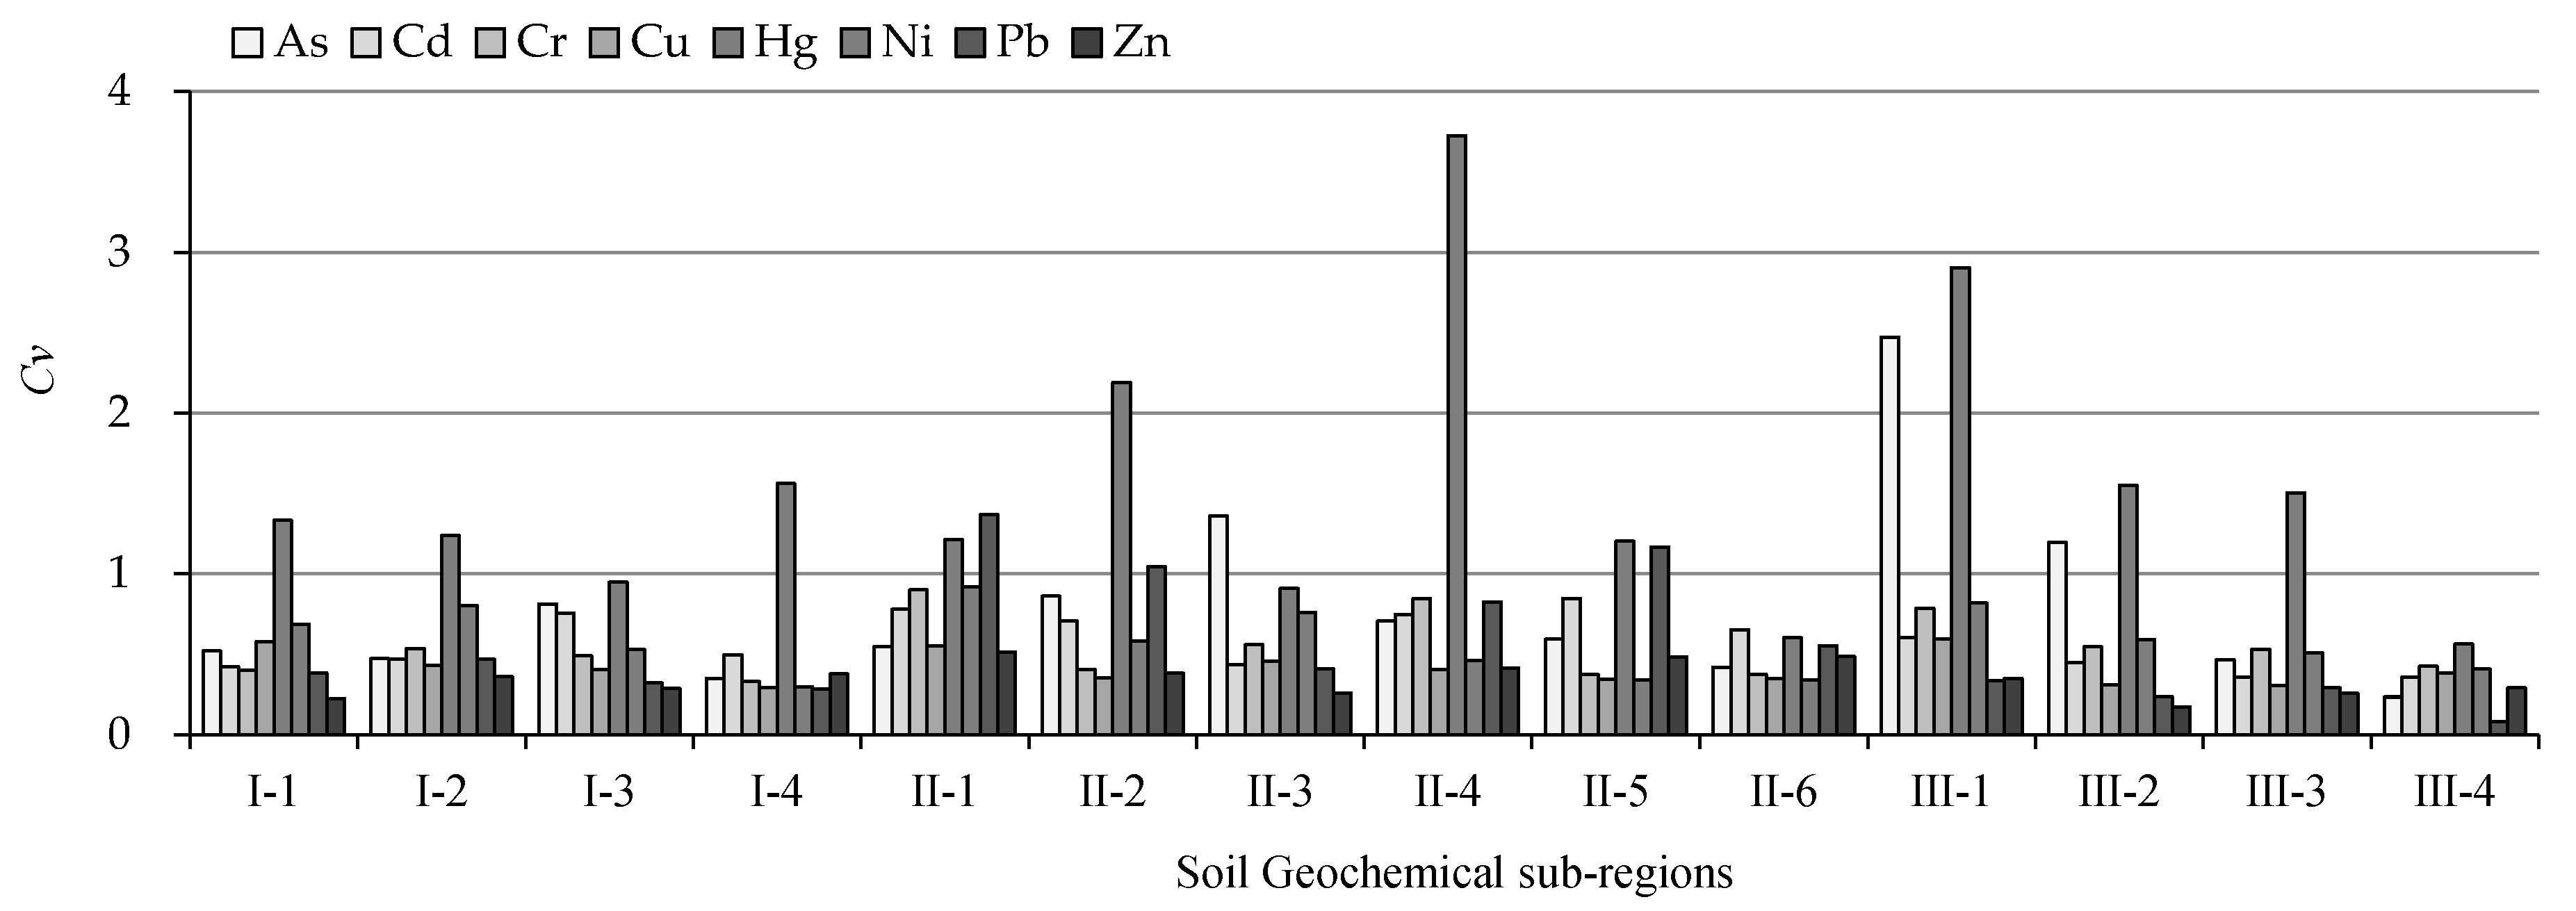
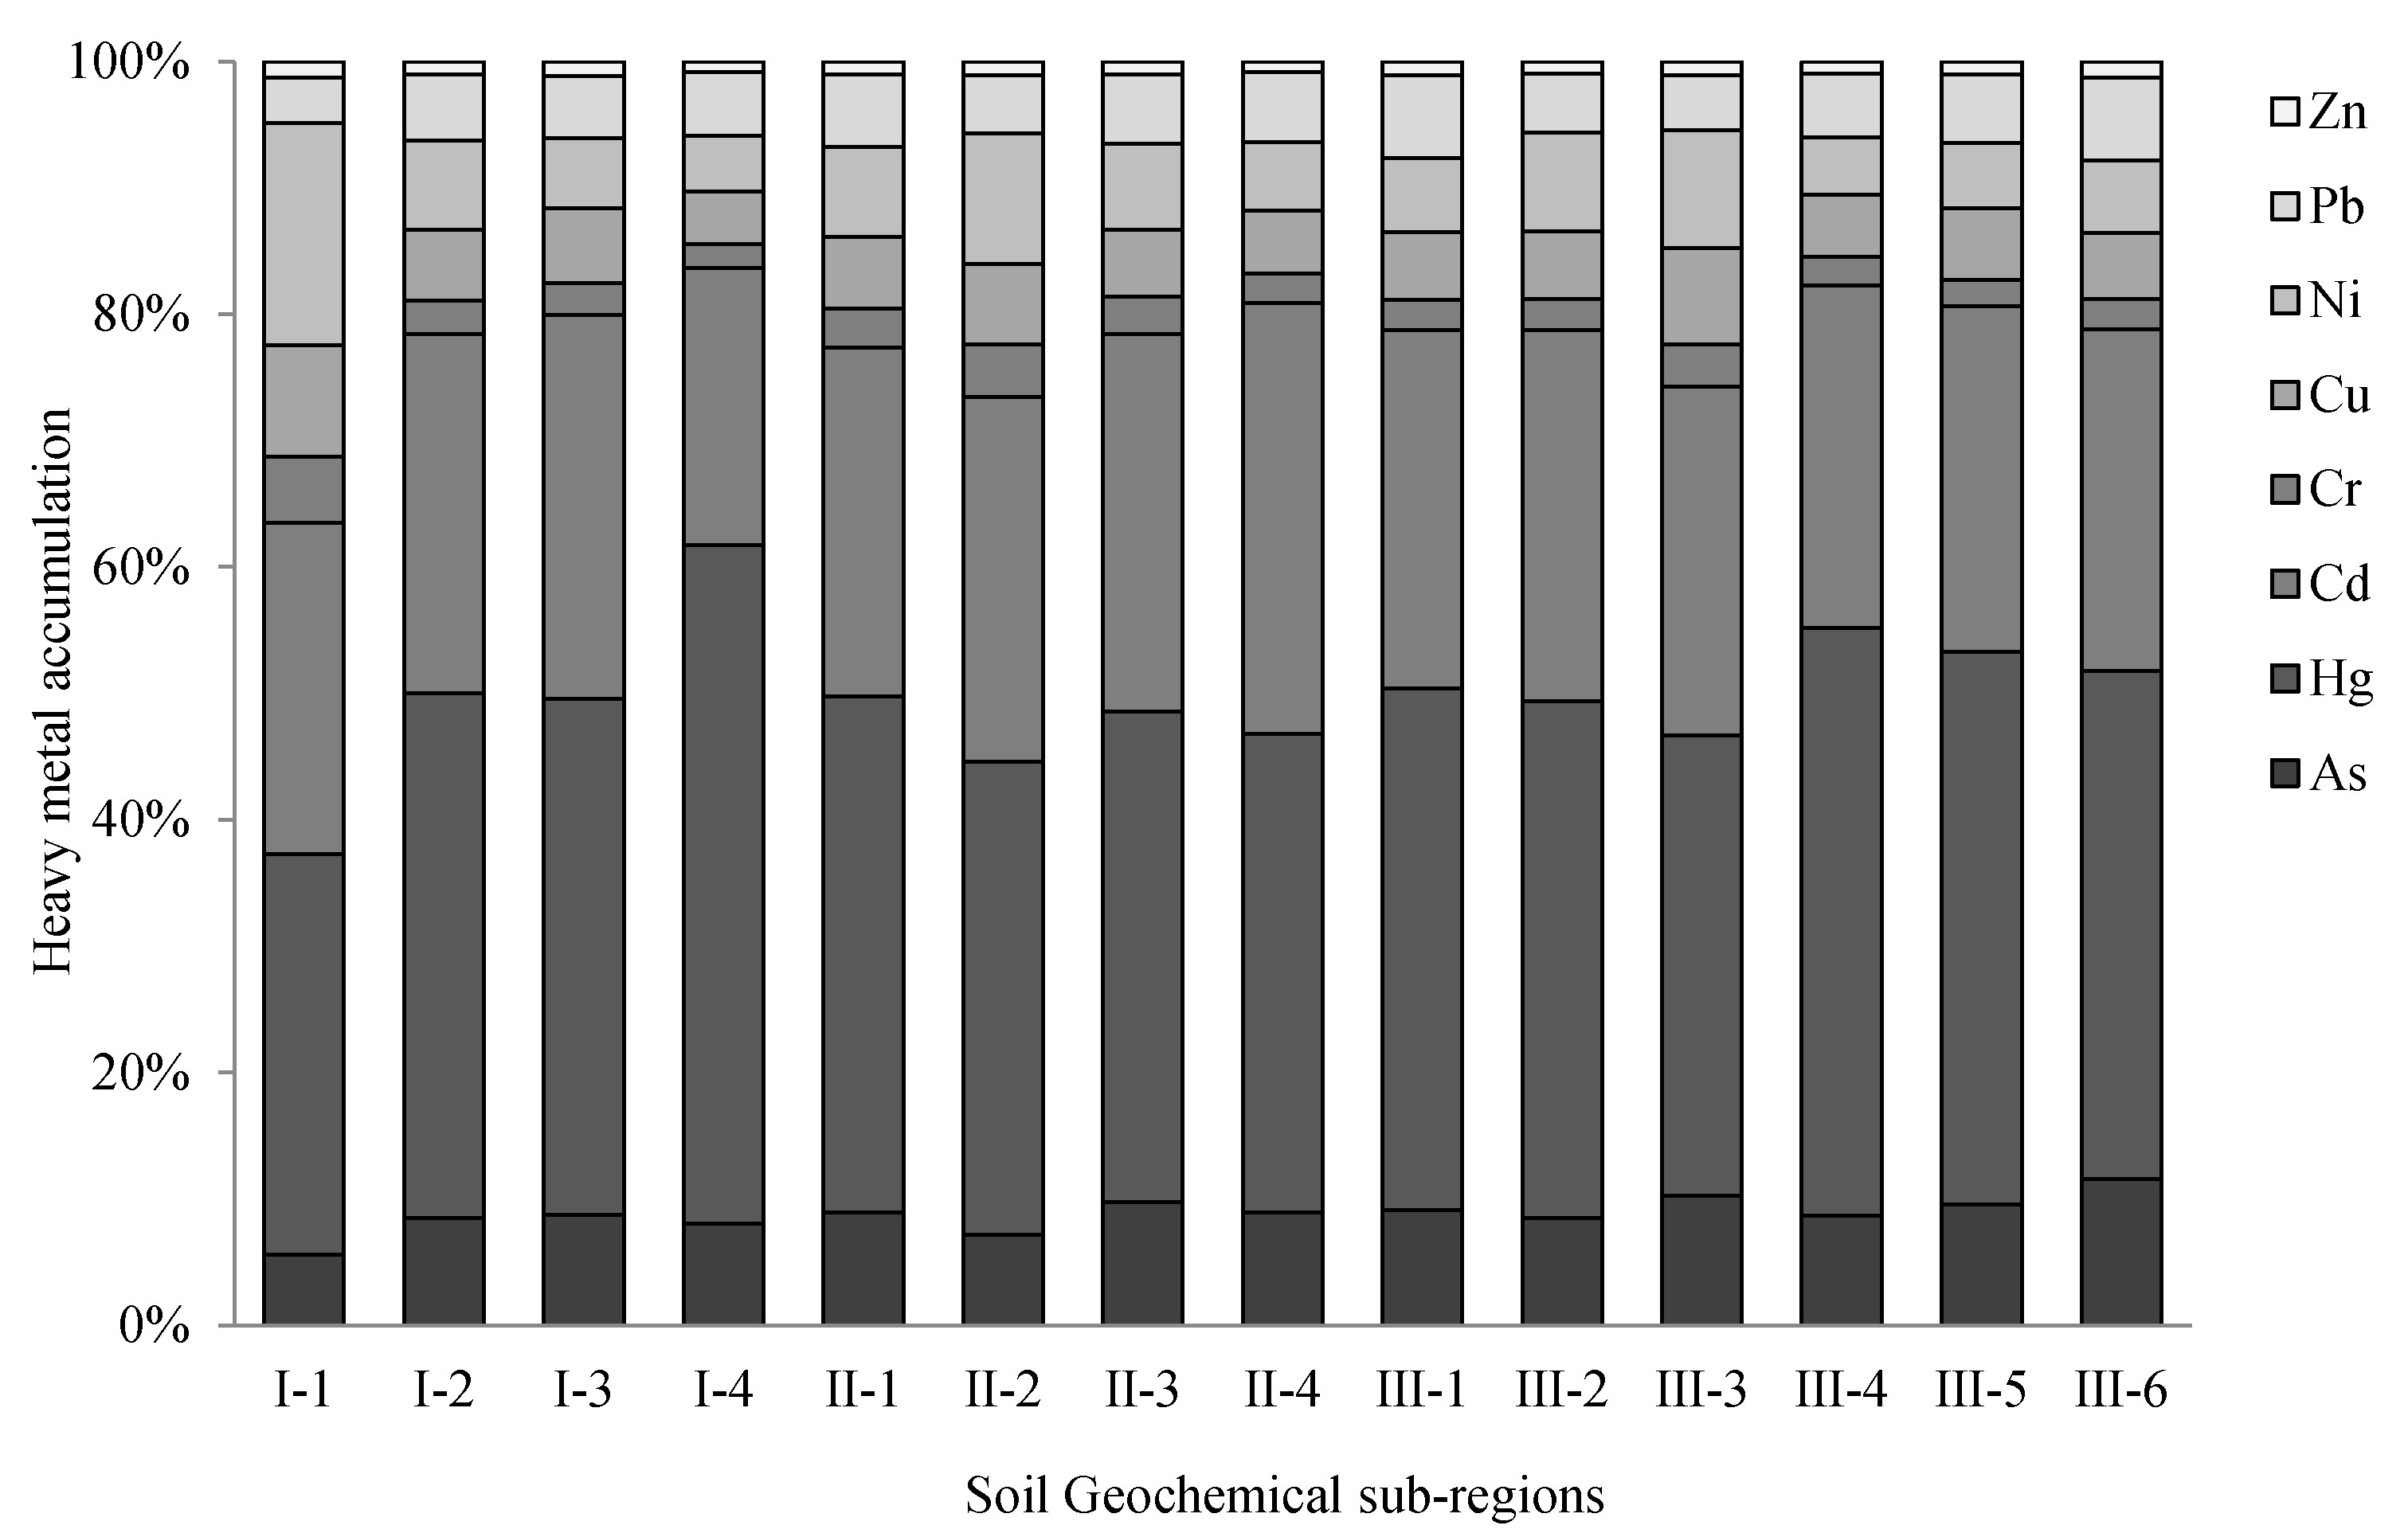
3.2. Content Characteristics of Heavy Metals

The average heavy metal content in each soil geochemical sub-region of Yishui County was statistically analyzed, and the results are summarized in Table 6. As shown in Figure 3 and Table 6, the elemental content in each geochemical sub-region is closely related to the geological background. Specifically, the average contents of Ni and Cr in the I-1, II-2, II-3, III-2, and III-3 sub-regions are higher than those in Yishui County, of which the averages in sub-regions I-1 and II-2 are higher than those in the agricultural land pollution risk screening value. The geological background is a Neogene basalt area (NL). The average contents of Hg, As, and Zn in sub-regions II-2 to II-5 are higher than those in Yishui County, and their geological background is Cambrian and Ordovician limestone area (Є-O). The contents of As, Cd, Cr, Cu, Hg, Ni, and Zn in sub-regions II-1, III-1, and III-4 are less than the average values of Yishui County, and their geological background is the Neoarchean intermediate acid intrusion area. In addition, the contents of As and Cd in Yishui County were lower than the geochemical background values of the surface soil in Shandong Province, and the Cr, Cu, Hg, Ni, Pb, and Zn contents were higher, indicating that these elements presented a certain enrichment trend.
The coefficient of variation (Cv) values of all soil samples in the 14 soil geochemical sub-regions were calculated. The coefficient of variation can be used to indicate the distribution of the sample content in the geochemical sub-region to understand the background information of the average value in each sub-region. According to the distribution of the coefficient of variation (Figure 4), the Cv values of As, Pb, and Hg vary greatly in each sub-region. The maximum values of As, Pb, and Hg were 2.47, 1.36 and 3.72, respectively. The activities of As, Pb, and Hg are relatively strong and are often related to human activities [10,11,18,37,38]. The strong variability in the data may indicate the interference of external factors. The Cv values of Cr, Hg, Cu, Ni, and Zn are between 0.35 and 0.95, which belong to medium and strong variation elements. This indicates that the distribution of these elements is relatively stable and not easily affected by external factors, which may be related to their background.

3.3. Evaluation Results

The heavy metal pollution index (Pi) and Nemerow pollution index (PN) of each soil geochemical sub-region in Yishui County were analyzed using the risk screening value of agricultural land soil pollution as a reference value. As listed in Table 7, Pi > 0.5 for Cd, Cr, Ni, Cu, and Zn, among which Cr, Ni, and Cu are the most significant. The highest Pi values of 1.18 and 1.49 for Cr and Ni, respectively, occurred in sub-region I-1, which further indicates that Cr and Ni are enriched in the soil. The enrichment of Cr and Ni is related to the distribution of basal. According to PN distribution (Table 7), the PN value of sub-region I-1 is 1.14, and the pollution class is grade III, which indicates low-level pollution, wherein the main pollution factors are Ni, Cr, and Cu. The PN values of II-2 and III-2 are 0.83 and 0.72, respectively, and the pollution class is grade II, which belongs to the warning line for pollution. This indicates that the soil environmental quality has reached the warning limit. The corresponding main pollution factors include Ni, Cr, Cu, Cd, and Zn. The rest of the soil geochemical sub-regions, including sub-region I-1, have PN values < 0.7, and pollution classes of I, indicating unpolluted soil. The average contents of Cr and Ni in the soil were 177.65 mg kg−1 and 104.20 mg kg−1, respectively, both of which are more than twice as high as the geochemical background values of the Shandong Province, which are higher than the screening values of soil pollution risk of agricultural land, and the elemental Cv is of medium variability, indicating that the geological background may be dominated by element content anomalies in this sub-region.
The heavy metal geoaccumulation index (Igeo) value of each soil geochemical sub-region was calculated based on the geochemical background value of the surface soil in Shandong Province, as listed in Table 8. According to the barrel principle, the highest heavy metal pollution level listed in Table 8 represents the pollution class of the soil sub-region. Using I-1 as an example, the order of heavy metal Igeo values from high to low is Ni (1.36), Cr (0.93), Cu (0.35), Zn (−0.13), Cd (−0.66), Hg (−0.79), Pb (−0.92), and As (−1.29). The Igeo value of Ni > 1 indicates that Ni is enriched in the soil, and the pollution class is grade III (moderately polluted). Meanwhile, the Igeo values of Cr and Cu are between 0 and 1, indicating that they range from unpolluted to moderately polluted. The Igeo values of the other heavy metals were <0, indicating that they were unpolluted. Based on these findings, this sub-region, according to the highest pollution level, can be defined as moderately polluted. Similarly, in other sub-regions, II-2, II-3, II-4, III-2, III-3, and I-4 have levels ranging from unpolluted to moderately polluted, and the remaining sub-regions have unpolluted levels.
Based on the surface soil geochemical background value in Shandong Province, the potential ecological risk index value of heavy metals of each sub-region was analyzed. As listed in Table 9, the potential ecological risk factor (Eir) value ranges of Hg, Cd, Ni, As, Pb, Cu, Cr, and Zn each soil geochemical sub-region were 30.29–67.64, 24.93–48.53, 4.36–19.23, 6.12–14.01, 3.96–7.96, 3.94–9.59, 1.87–5.73, and 0.656–1.37, respectively. Of these, the Eir values of Hg in the seven sub-regions were >40, the single factor pollution ecological risk was denoted as a moderate ecological hazard, and the Eir values of As, Cr, Cu, Ni, Pb, and Zn were <40, indicating a low ecological hazard level. The potential ecological risk index (RI) values of heavy metals for each sub-region were in the order of: II-2 (165.30) > II-4 (136.77) > II-5 (124.71) > I-4 (116.68) > II-3 (115.33) > I-1 (109.16) > III-2 (105.62) > I-2 (104.45) > III-3 (104.12) > II-1 (99.66) > I-3 (99.23) > III-1 (90.40) > III-4 (80.03). According to the Eir distribution in each sub-region, Hg contributes the most to the soil potential ecological risk value, followed by Cd. Based on the data listed in Table 9, the Eir values of heavy metals in each soil geochemical sub-region were plotted (Figure 5), revealing that the Hg and Cd were leading potential ecological hazards. The total contribution rate of Hg and Cd to the soil comprehensive potential ecological hazard ranged from 58 to 76%, of which the contribution of Hg alone ranged from 32 to 54%, indicating that Hg has a significant impact on soil potential ecological risk.

4. Discussion

4.1. Comprehensive Assessment of Potential Ecological Risks

Different assessment methods were used to assess the risk of heavy metal pollution in the 14 soil geochemical sub-regions of Yishui County. The results of these methods revealed some differences and similarities (Table 10). Specifically, the PN method is based for comparison between the measured value and the soil pollution risk screening value of agricultural land [15,25,26,27,30]. Its advantage is that it targets elements with contents that are greater than the standard value, meaning the pollution degree of Ni was well reflected by the PN method in the study area. Comparing measured values with geochemical background values, the geoaccumulation index method is generally applicable for evaluating the degree of pollution of a single heavy metal that deviates from the background value [20,33], such as the pollution degrees of Cr, Cu, and Ni observed in the I-1 sub-region. Meanwhile, the potential ecological risk index method is based on a multi-factor comparison of the measured value, background value, and toxicity coefficient (it introduces the toxicity coefficient as a correction), and focuses on the toxicity of heavy metals and the comprehensive effects of heavy metal pollution on the ecological environment [10,18,25,27,39], such as Hg and Cd, which are significant potential ecological hazards in the study area.
Despite these differences, all three methods indicated that sub-region II-2 was at slight to moderate risk (PN: warning line of pollution, Igeo: from unpolluted to moderately polluted, IR: moderate risk intensity), and sub-regions I-1, II-3, II-4, and III-2 were at mild and controllable risk. Although the heavy metal risk levels indicated by the three methods were not consistent, they collectively determined the order of pollution degree, indicating that there is comparability among the methods.

4.2. Consistency of Evaluation Results

The geochemical map of multi-elements accumulation is a type of map often used in regional geochemical exploration in China to study the distribution of elements under the dominant conditions of the geological background. It can be seen from Table 10 that there is a synchronous high corresponding relationship between Ni and Cr element combinations and Hg and Cd element combinations in most soil geochemical divisions. The contrast values (Pi) of Cr, Ni, and Cu are dominant in the study area. This shows that the overall distribution characteristics of heavy metals in the study area can be quickly understood through a multi-element cumulative geochemical map. An accumulated geochemical anomaly map of soil heavy metals in Yishui County was created using ArcGIS 10.2 (Figure 6). The figure shows only the abnormal areas with the accumulated value of eight heavy metals greater than 350 mg kg−1. Overall, the areas with accumulated heavy metal values above 550 mg kg−1 are mainly concentrated in sub-regions I-1, I-3, II-2, II-3, and II-5. Among these, sub-regions I-1 and II-2 exhibit significant accumulation trends and have large areas, with extreme values of 698.67 mg kg−1 and 554.38 mg kg−1, respectively. The different evaluation methods in this study indicate that there is a certain risk in sub-regions I-1 and II-2, which is consistent with the information reflected by the heavy metal accumulation anomaly map (Figure 6).

5. Conclusions

In this study, a method based on soil geochemical zoning was employed to assess the potential ecological risk of cultivated soil. Through this novel method, on the basis of a geological structure background, the soil pH of cultivated land in the study area was used as the dominant variable, and three soil geochemical zones with 14 soil geochemical sub-regions were obtained by means of superimposing multi-element combination factors.
On this basis, the environmental quality status and potential ecological risk of heavy metals in soil geochemical zoning were evaluated. The results showed that Yishui County has a slight ecological harmful pollution level, and its potential ecological risk level is low. The results of the soil environmental quality evaluation showed that the Pi (1.49) was greater than 1.0 and the PN (1.14) was greater than 0.7, indicating that Ni had a certain enrichment trend. Meanwhile, the Igeo results showed that both Cr and Ni, as a result of the geological background in some soil sub-regions, reached light to medium pollution levels. Due to the great difference in the geological background of the 10 soil geochemical sub-regions in the study area, the PN and Igeo evaluation are generally in the medium to slight pollution range, which tends to the enrichment characteristics of heavy metals caused by background factors. The evaluation results of Eir showed that Hg and Cd contributed largely to the ecological hazard in this area, of which the Eir values of Hg in nine sub-regions were all more than 40, indicating a moderate ecological hazard. Furthermore, the RI of sub-region II-2 was greater than 150, indicating moderate ecological intensity. The corresponding relationship between different pollution assessment methods and the indications of polluted areas shows that there is a connection between soil heavy metal elements in some areas.
The information reflected in the cumulative geochemical anomaly map of heavy metal content in the surface soil of the study area is consistent with the comprehensive evaluation results of the potential ecological risks obtained via soil geochemical zoning. This indicates that the potential ecological risk assessment of heavy metals based on soil geochemical zoning can provide effective support for the rapid assessment of cultivated land soil environmental quality and the zoning prevention and control of heavy metal pollution in high background areas.

Author Contributions

Conceptualization, L.Y., L.H. and Z.S.; methodology, L.Y. and Z.S.; writing—original draft preparation, L.Y. and L.H.; writing—review and editing, F.Z. and K.Z.; visualization, L.Y. and F.W.; supervision, K.Z., L.H., X.Z. and Z.S.; funding acquisition, H.L. All authors have read and agreed to the published version of the manuscript.

Funding

This study was financially supported by the Shandong Province Ministry-provincial Cooperation Geological Prospecting Project (Grant No. 2019(44) & 2020 (58)) and the Science and technology plan of Jinan (Grant No. 20191007).

Institutional Review Board Statement

Not applicable.

Informed Consent Statement

Not applicable.

Data Availability Statement

The data presented in this study are available on request from the corresponding author. The processed data are not publicly available as the data also forms part of an ongoing study.

Acknowledgments

We would like to thank the editors and reviewers for their valuable comments and suggestions on the manuscript.

Conflicts of Interest

The authors declare no conflict of interest.

References

  1. Kheir, R.B.; Greve, M.H.; Abdallah, C.; Dalgaard, T. Spatial soil zinc content distribution from terrain parameters: A GIS-based decision-tree model in Lebanon. Environ. Pollut. 2010, 158, 520–528. [Google Scholar] [CrossRef]
  2. Dou, L.; Li, T. Regional Geochemical Characteristics and Influence Factors of Soil Elements in the Pearl River Delta Economic Zone, China. Int. J. Geosci. 2015, 6, 593–604. [Google Scholar] [CrossRef] [Green Version]
  3. García-Lorenzo, M.L.; Pérez-Sirvent, C.; Sánchez, M.J.M.; Ruiz, J.M.; Martínez, S.; Arroyo, X.; Martinez, L.B.M.; Bech, J.; Lopez, S.M. Potential bioavailability assessment and distribution of heavy metal(oids) in cores from Portman Bay (SE, Spain). Geochem. Explor. Environ. Anal. 2018, 19, 193–200. [Google Scholar] [CrossRef]
  4. Jennings, A.A. Analysis of worldwide regulatory guidance values for the most commonly regulated elemental surface soil contamination. J. Environ. Manag. 2013, 118, 72–95. [Google Scholar] [CrossRef]
  5. Ahmed, M.; Matsumoto, M.; Ozaki, A.; Thinh, N.; Kurosawa, K. Heavy Metal Contamination of Irrigation Water, Soil, and Vegetables and the Difference between Dry and Wet Seasons Near a Multi-Industry Zone in Bangladesh. Water 2019, 11, 583. [Google Scholar] [CrossRef] [Green Version]
  6. Ma, R.; Zhou, X.; Shi, J. Heavy metal contamination and health risk assessment in Critical Zone of Luan River Catchment in the North China Plain. Geochem. Explor. Environ. Anal. 2017, 18, 47–57. [Google Scholar] [CrossRef]
  7. Ok, Y.S.; Lim, J.E.; Moon, D.H. Stabilization of Pb and Cd contaminated soils and soil quality improvements using waste oyster shells. Environ. Geochem. Health 2010, 33, 83–91. [Google Scholar] [CrossRef] [PubMed]
  8. Parisa, P.; Samad, A.; Soroush, M.; David, C. Application of geochemistry and VNIR spectroscopy in mapping heavy metal pollution of stream sediments in the Takab mining area, NW of Iran. Acta. Geol. Sin. 2021, 92, 2382–2394. [Google Scholar] [CrossRef]
  9. Ren, S.; Li, E.; Deng, Q.; He, H.; Li, S. Analysis of the Impact of Rural Households’ Behaviors on Heavy Metal Pollution of Arable Soil: Taking Lankao County as an Example. Sustainability 2018, 10, 4368. [Google Scholar] [CrossRef] [Green Version]
  10. Sun, Y.; Zhou, Q.; Xie, X.; Liu, R. Spatial, sources and risk assessment of heavy metal contamination of urban soils in typical regions of Shenyang, China. J. Hazard. Mater. 2010, 174, 455–462. [Google Scholar] [CrossRef] [PubMed]
  11. Zhang, Q.; Wang, C. Natural and Human Factors Affect the Distribution of Soil Heavy Metal Pollution: A Review. Water Air Soil Pollut. 2020, 231, 350. [Google Scholar] [CrossRef]
  12. Jahan, I.; Abedin, M.A.; Islam, M.R.; Hossain, M.; Hoque, T.S.; Quadir, Q.F.; Hossain, M.I.; Gaber, A.; Althobaiti, Y.S.; Rahman, M.M. Translocation of Soil Arsenic towards Accumulation in Rice: Magnitude of Water Management to Minimize Health Risk. Water 2021, 13, 2816. [Google Scholar] [CrossRef]
  13. Kamiya, T.; Islam, R.; Duan, G.; Uraguchi, S.; Fujiwara, T. Phosphate deficiency signaling pathway is a target of arsenate and phosphate transporterOsPT1is involved in As accumulation in shoots of rice. Soil Sci. Plant Nutr. 2013, 59, 580–590. [Google Scholar] [CrossRef]
  14. Siddique, A.B.; Rahman, M.M.; Islam, R.; Mondal, D.; Naidu, R. Response of Iron and Cadmium on Yield and Yield Components of Rice and Translocation in Grain: Health Risk Estimation. Front. Environ. Sci. 2021, 9, 716770. [Google Scholar] [CrossRef]
  15. Gu, Q.; Yu, T.; Yang, Z.; Ji, J.; Hou, Q.; Wang, L.; Wei, X.; Zhang, Q. Prediction and risk assessment of five heavy metals in maize and peanut: A case study of Guangxi, China. Environ. Toxicol. Pharmacol. 2019, 70, 103199. [Google Scholar] [CrossRef]
  16. Hu, W.; Huang, B.; Shi, X.; Chen, W.; Zhao, Y.; Jiao, W. Accumulation and health risk of heavy metals in a plot-scale vegetable production system in a peri-urban vegetable farm near Nanjing, China. Ecotoxicol. Environ. Saf. 2013, 98, 303–309. [Google Scholar] [CrossRef]
  17. Li, K.; Peng, M.; Zhao, C.D.; Yang, K.; Zhou, Y.L.; Liu, F. Vicennial implementation of geochemical survey of land quality in China. Earth Sci. Front. 2019, 26, 128–158. [Google Scholar] [CrossRef]
  18. Baran, A.; Wieczorek, J.; Mazurek, R.; Urbański, K.; Klimkowicz-Pawlas, A. Potential ecological risk assessment and predicting zinc accumulation in soils. Environ. Geochem. Health 2018, 40, 435–450. [Google Scholar] [CrossRef] [PubMed] [Green Version]
  19. Guo, W.; Huo, S.; Xi, B.; Zhang, J.; Wu, F. Heavy metal contamination in sediments from typical lakes in the five geographic regions of China: Distribution, bioavailability, and risk. Ecol. Eng. 2015, 81, 243–255. [Google Scholar] [CrossRef]
  20. Kim, B.S.M.; Angeli, J.L.F.; Ferreira, P.A.L.; de Mahiques, M.M.; Figueira, R. Critical evaluation of different methods to calculate the Geoaccumulation Index for environmental studies: A new approach for Baixada Santista—Southeastern Brazil. Mar. Pollut. Bull. 2018, 127, 548–552. [Google Scholar] [CrossRef]
  21. Liu, X.; Jiang, J.; Yan, Y.; Dai, Y.; Deng, B.; Ding, S.; Su, S.; Sun, W.; Li, Z.; Gan, Z. Distribution and risk assessment of metals in water, sediments, and wild fish from Jinjiang River in Chengdu, China. Chemosphere 2018, 196, 45–52. [Google Scholar] [CrossRef]
  22. Kandawire, M.E.; Choongo, K.; Yabe, J.; Mwase, M.; Saasa, N.; Nakayama, S.M.M.; Bortey-Sam, N.; Blindauer, C.A. Sedi-ment metal contamination in the Kafue River of Zambia and ecological risk assessment. Bull. Environ. Contam. Toxicol. 2017, 99, 108–116. [Google Scholar] [CrossRef]
  23. Wang, G.; Zhang, Y.; Wang, J.; Zhu, L.; Wang, J. Spatial Distribution and Ecological Risk Assessment of Heavy Metals in Sediments of a Heavily Polluted Maozhou River, Southern China. Bull. Environ. Contam. Toxicol. 2021, 106, 844–851. [Google Scholar] [CrossRef] [PubMed]
  24. Zhao, H.; Zhao, J.; Yin, C.; Li, X. Index models to evaluate the potential metal pollution contribution from washoff of road-deposited sediment. Water Res. 2014, 59, 71–79. [Google Scholar] [CrossRef] [PubMed]
  25. Chen, Y.; Jiang, X.; Wang, Y.; Zhuang, D. Spatial characteristics of heavy metal pollution and the potential ecological risk of a typical mining area: A case study in China. Process. Saf. Environ. Prot. 2018, 113, 204–219. [Google Scholar] [CrossRef]
  26. Guo, G.; Wu, F.; Xie, F.; Zhang, R. Spatial distribution and pollution assessment of heavy metals in urban soils from southwest China. J. Environ. Sci. 2012, 24, 410–418. [Google Scholar] [CrossRef]
  27. Jiang, X.; Lu, W.X.; Zhao, H.Q.; Yang, Q.C.; Yang, Z.P. Potential ecological risk assessment and prediction of soil heavy-metal pollution around coal gangue dump. Nat. Hazards Earth Syst. Sci. 2014, 14, 1599–1610. [Google Scholar] [CrossRef] [Green Version]
  28. Laidlaw, M.A.; Mohmmad, S.M.; Gulson, B.L.; Taylor, M.P.; Kristensen, L.J.; Birch, G. Estimates of potential childhood lead exposure from contaminated soil using the US EPA IEUBK Model in Sydney, Australia. Environ. Res. 2017, 156, 781–790. [Google Scholar] [CrossRef]
  29. Nicholson, F.A.; Smith, S.R.; Alloway, B.J.; Carlton-Smith, C.; Chambers, B.J. An inventory of heavy metals inputs to agricultural soils in England and Wales. Sci. Total Environ. 2003, 311, 205–219. [Google Scholar] [CrossRef]
  30. Sheng, D.; Wu, J.; Wen, X.; Wu, M.; Zhang, C. Contamination and ecological health risks of heavy metals in groundwater of a typical agricultural area in NW China. Geochem. Explor. Environ. Anal. 2020, 20, 440–450. [Google Scholar] [CrossRef]
  31. Yang, C.L.; Guo, R.P.; Yue, Q.L.; Zhou, K.; Wu, Z.F. Environmental quality assessment and spatial pattern of potentially toxic elements in soils of Guangdong Province, China. Environ. Earth Sci. 2013, 70, 1903–1910. [Google Scholar] [CrossRef]
  32. Yin, S.; Feng, C.; Li, Y.; Yin, L.; Shen, Z. Heavy metal pollution in the surface water of the Yangtze Estuary: A 5-year follow-up study. Chemosphere 2015, 138, 718–725. [Google Scholar] [CrossRef] [PubMed]
  33. Müller, G. Schwermetalle in den sedimenten des Rheins—Veranderungen seit 1971. Umschau 1979, 79, 778–783. [Google Scholar]
  34. Sany, S.B.T.; Salleh, A.; Rezayi, M.; Saadati, N.; Narimany, L.; Tehrani, G.M. Distribution and Contamination of Heavy Metal in the Coastal Sediments of Port Klang, Selangor, Malaysia. Water Air Soil Pollut. 2013, 224, 224. [Google Scholar] [CrossRef]
  35. Nobi, E.; Dilipan, E.; Thangaradjou, T.; Sivakumar, K.; Kannan, L. Geochemical and geo-statistical assessment of heavy metal concentration in the sediments of different coastal ecosystems of Andaman Islands, India. Estuar. Coast. Shelf Sci. 2010, 87, 253–264. [Google Scholar] [CrossRef]
  36. de Vallejuelo, S.F.-O.; Arana, G.; de Diego, A.; Madariaga, J.M. Risk assessment of trace elements in sediments: The case of the estuary of the Nerbioi–Ibaizabal River (Basque Country). J. Hazard. Mater. 2010, 181, 565–573. [Google Scholar] [CrossRef]
  37. Zahra, A.; Hashmi, M.Z.; Malik, R.N.; Ahmed, Z. Enrichment and geo-accumulation of heavy metals and risk assessment of sediments of the Kurang Nallah—Feeding tributary of the Rawal Lake Reservoir, Pakistan. Sci. Total Environ. 2014, 470–471, 925–933. [Google Scholar] [CrossRef] [PubMed]
  38. Alahabadi, A.; Malvandi, H. Contamination and ecological risk assessment of heavy metals and metalloids in surface sediments of the Tajan River, Iran. Mar. Pollut. Bull. 2018, 133, 741–749. [Google Scholar] [CrossRef]
  39. Håkanson, L. An ecological risk index for aquatic pollution control: A sedimentological approach. Water Res. 1980, 14, 975–1001. [Google Scholar] [CrossRef]
  40. Cheng, F.; Wang, H.B.; Yun, W.J. Study on investigation and assessment of cultivated land quality grade in China. China Land Sci. 2014, 28, 75–82. [Google Scholar] [CrossRef]
  41. Liu, L.; Zhou, D.; Chang, X.; Lin, Z. A new grading system for evaluating China’s cultivated land quality. Land Degrad. Dev. 2020, 31, 1482–1501. [Google Scholar] [CrossRef]
  42. Huo, Z.; Tian, J.; Wu, Y.; Ma, F. A Soil Environmental Quality Assessment Model Based on Data Fusion and Its Application in Hebei Province. Sustainability 2020, 12, 6804. [Google Scholar] [CrossRef]
  43. Yang, Z.; Yu, T.; Hou, Q.; Xia, X.; Feng, H.; Huang, C.; Wang, L.; Lv, Y.; Zhang, M. Geochemical evaluation of land quality in China and its applications. J. Geochem. Explor. 2014, 139, 122–135. [Google Scholar] [CrossRef]
  44. Xi, X.H. Ecological geochemistry: From a geochemical survey to an applied theory. Earth Sci. Front. 2008, 15, 1–8. [Google Scholar] [CrossRef]
  45. Liao, Q.L.; Liu, C.; Jin, Y.; Hua, M.; Zheng, L.C.; Pan, Y.M.; Huang, S.S. On geochemical regionalization of soils in Jiangsu, China. J. Geol. 2011, 35, 225–235. [Google Scholar]
  46. Facchinelli, A.; Sacchi, E.; Mallen, L. Multivariate statistical and GIS-based approach to identify heavy metal sources in soils. Environ. Pollut. 2001, 114, 313–324. [Google Scholar] [CrossRef]
  47. Gergen, I.; Harmanescu, M. Application of principal component analysis in the pollution assessment with heavy metals of vegetable food chain in the old mining areas. Chem. Central J. 2012, 6, 156. [Google Scholar] [CrossRef] [Green Version]
  48. Han, L.; Li, Y. Distributions, Source and Pollution Status of Heavy Metals of Urban Soil in Xining, China. IOP Conf. Ser. Earth Environ. Sci. 2020, 555, 012084. [Google Scholar] [CrossRef]
  49. Pang, X.G.; Wang, Z.H.; Zhao, X.Q.; Zeng, X.D.; Ren, W.J.; Dai, J.R. Background values of soil geochemistry in Shandong Province. Shandong Land Resour. 2018, 34, 39–43. [Google Scholar] [CrossRef]
  50. Tian, K.; Huang, B.; Xing, Z.; Hu, W. Geochemical baseline establishment and ecological risk evaluation of heavy metals in greenhouse soils from Dongtai, China. Ecol. Indic. 2017, 72, 510–520. [Google Scholar] [CrossRef]
  51. Sposito, G. The Surface Chemistry of Soil; Oxford University Press: New York, NY, USA, 1984. [Google Scholar]
  52. Yan, M.C.; Gu, T.X.; Chi, Q.H.; Wang, C. Abundance of chemical elements of soils in China and supergenesis geochemistry characteristics. Geophys. Geochem. Explor. 1997, 21, 161–167. [Google Scholar]
Figure 1. (a) Geological sketch of study area and geochemical maps of (b) pH, (c) F1, (d) F2, (e) F3, and (f) F4.
Water 13 03322 g001
Figure 2. Correlation coefficient matrix of 16 elements in cultivated soil of Yishui County.
Water 13 03322 g002
Figure 3. (a) Topographic map and (b) soil geochemical zoning of Yishui County.
Water 13 03322 g003
Figure 4. Coefficient of variation values of heavy metals in soil geochemical sub-regions.
Water 13 03322 g004
Figure 5. Percentage contribution of individual potential ecological risk factor (Eir) in soil geochemical sub-region.
Water 13 03322 g005
Figure 6. Geochemical map of heavy metal accumulation in the study area.
Water 13 03322 g006
Table 1. Pollution levels of Nemerow index (PN) in soils.
ValueClassPollution Level
PN ≤ 0.7IUnpolluted
0.7 < PN ≤ 1.0IIWarning line of pollution
1.0 < PN ≤ 2.0IIILow level polluted
2.0 < PN ≤ 3.0IVModerately polluted
PN > 3.0VHigh level polluted
Table 2. Pollution levels of geoaccumulation index (Igeo) in soils.
ValueClassQuality of Soil
Igeo ≤ 0IUnpolluted
0 < Igeo ≤ 1IIFrom unpolluted to moderately polluted
1 < Igeo ≤ 2IIIModerately polluted
2 < Igeo ≤ 3IVFrom moderately to strongly polluted
3 < Igeo ≤ 4VStrongly polluted
4 < Igeo ≤ 5VIFrom strongly to extremely polluted
Igeo > 5VIIExtremely polluted
Table 3. Ecological risk levels of heavy metals in soils.
Potential Risk FactorSingle Factor Pollution Ecological RiskPotential Ecological Risk IndexRisk Intensity
Eir < 40LowRI < 150Low
40 ≤ Eir < 80Moderate150 ≤ RI < 300Moderate
80 ≤ Eir < 160High300 ≤ RI < 600High
160 ≤ Eir < 320Slightly heavyRI ≥ 600heavy
Eir ≥ 320Heavy
Table 4. Principal component factor eigenvalues and element combination characteristics.
ComponentEigenvalueVariance Contribution
Rate/%
Cumulative Variance Contribution Rate/%Structural Formula of Principal Component Factors
F15.333.333.3Fe0.898 Co0.888 V0.853 Mn0.745 Ni0.719 Cu0.698 Zn0.666 Cr0.624 (Mo0.386)
F22.515.849.1Pb0.684 Sb0.668 Cd0.536 (Hg0.294)
F31.48.857.9K2O0.722 F0.564
F41.17.064.9As0.825
Table 5. Principal component loading coefficient matrix.
ElementComponentElementComponent
F1F2F3F4F1F2F3F4
Fe0.898−0.1680.204−0.004Mo0.3860.179−0.3400.117
Co0.888−0.2700.159−0.016Pb0.1660.684−0.341−0.235
V0.853−0.1600.216−0.096Sb0.3290.668−0.0120.174
Mn0.7450.1260.139−0.056Cd0.3480.536−0.323−0.201
Ni0.719−0.488−0.191−0.069Hg0.1140.294−0.027−0.144
Cu0.6980.018−0.0320.422K2O−0.1370.3670.722−0.020
Zn0.6660.449−0.181−0.229F0.3420.4180.564−0.129
Cr0.624−0.487−0.167−0.118As0.2260.273−0.0590.825
Table 6. Average heavy metal contents in the soil geochemical sub-regions.
The Soil Geochemical Subregion
(N Represents the Number of Samples)
wt/mg kg−1
AsCdCrCuHgNiPbZn
I-1 (N = 447)5.270.126177.6543.340.0268104.2018.6786.62
I-2 (N = 1299)7.640.13185.7426.480.033639.8425.8668.57
I-3 (N = 589)7.450.13377.4526.470.031429.8123.2071.00
I-4 (N = 156)8.090.11368.1722.040.048527.8927.5763.64
II-1 (N = 2102)7.790.12474.1024.120.031931.7430.7869.65
II-2 (N = 52)12.040.214125.7239.870.052470.0936.31103.43
II-3 (N = 73)10.190.140117.6239.900.032658.3223.6479.88
II-4 (N = 467)10.240.16395.1830.410.049233.6532.7783.07
II-5 (N = 1923)10.260.15080.8332.120.042335.1031.7082.06
II-6 (N = 359)9.580.11471.5222.670.029930.0829.6976.94
III-1 (N = 3142)6.950.11087.0023.260.028634.8224.5159.22
III-2 (N = 211)6.460.133135.3430.150.030659.1222.7572.24
III-3 (N = 794)8.700.13794.9425.110.031338.3326.9467.45
III-4 (N = 89)6.150.12057.9217.810.023523.6221.0441.54
Average value of Yishui County (N = 14,389)7.850.12988.3027.050.032338.2527.4169.80
Geochemical background value of topsoil in Shandong Province [49]8.600.13262.0022.600.031027.1023.6063.30
Topsoils in China (Am) [52]11.200.09761.0023.000.065027.0026.0074
Pollution risk screening value of agricultural land (GB15618-2018 1)250.3150500.57090200
Note: 1 GB15618-2018: Risk Control Standard For Soil Contamination of Agricultural Land. Ministry of ecological environment in China.
Table 7. Heavy metal pollution index values in the soil geochemical sub-regions.
The Soil Geochemical Subregion
(N Represents the Number of Samples)
PiPN
AsCdCrCuHgNiPbZn
I-1 (N = 447)0.210.421.180.870.051.490.210.431.14
I-2 (N = 1299)0.310.440.570.530.070.570.290.340.49
I-3 (N = 589)0.300.440.520.530.060.430.260.350.45
I-4 (N = 156)0.320.380.450.440.100.400.310.320.40
II-1 (N = 2102)0.310.410.490.480.060.450.340.350.43
II-2 (N = 52)0.480.710.840.800.101.000.400.520.83
II-3 (N = 73)0.410.470.780.800.070.830.260.400.69
II-4 (N = 467)0.410.540.630.610.100.480.360.420.55
II-5 (N = 1923)0.410.500.540.640.080.500.350.410.55
II-6 (N = 359)0.380.380.480.450.060.430.330.380.42
III-1 (N = 3142)0.280.370.580.470.060.500.270.300.48
III-2 (N = 211)0.260.440.900.600.060.840.250.360.72
III-3 (N = 794)0.350.460.630.500.060.550.300.340.53
III-4 (N = 89)0.250.400.390.360.050.340.230.210.34
Table 8. Heavy metal index values of geoaccumulation in soil geochemical sub-regions.
The Soil Geochemical Sub-Region
(N Represents the Number of Samples)
Igeo
AsCdCrCuHgNiPbZn
I-1 (N = 447)−1.29−0.660.930.35−0.791.36−0.92−0.13
I-2 (N = 1299)−0.76−0.60−0.12−0.36−0.47−0.029−0.45−0.47
I-3 (N = 589)−0.79−0.58−0.26−0.36−0.57−0.45−0.61−0.42
I-4 (N = 156)−0.67−0.81−0.45−0.620.062−0.54−0.36−0.58
II-1 (N = 2102)−0.73−0.67−0.33−0.49−0.54−0.36−0.20−0.45
II-2 (N = 52)−0.100.110.440.230.170.790.0370.12
II-3 (N = 73)−0.34−0.500.340.24−0.510.52−0.58−0.25
II-4 (N = 467)−0.33−0.280.033−0.160.082−0.27−0.11−0.19
II-5 (N = 1923)−0.33−0.40−0.20−0.078−0.14−0.21−0.16−0.21
II-6 (N = 359)−0.43−0.79−0.38−0.58−0.64−0.43−0.25−0.30
III-1 (N = 3142)−0.89−0.85−0.10−0.54−0.70−0.22−0.53−0.68
III-2 (N = 211)−0.99−0.570.54−0.17−0.610.54−0.64−0.39
III-3 (N = 794)−0.57−0.530.030−0.43−0.57−0.085−0.39−0.49
III-4 (N = 89)−1.07−0.72−0.68−0.93−0.99−0.78−0.75−1.19
Table 9. Potential ecological risk index values of soil geochemical zones.
Potential Ecological Risk IndexEirRI
The Soil
Geochemical Subregion
AsHgCdCrCuNiPbZn
I-1 (N = 447)6.1234.6028.575.739.5919.233.961.37109.16
I-2 (N = 1299)8.8943.3529.682.775.867.355.481.08104.45
I-3 (N = 589)8.6640.5730.112.505.865.504.921.1299.23
I-4 (N = 156)9.4062.6225.592.204.885.155.841.01116.69
II-1 (N = 2102)9.0641.1728.232.395.345.866.521.1099.66
II-2 (N = 52)14.0167.6448.524.068.8212.937.691.63165.30
II-3 (N = 73)11.8542.0031.823.798.8310.765.011.26115.33
II-4 (N = 467)11.9163.5137.093.076.736.216.941.31136.77
II-5 (N = 1923)11.9354.5434.052.617.116.486.721.30124.71
II-6 (N = 359)11.1438.5626.002.315.025.556.291.2296.08
III-1 (N = 3142)8.0936.8824.932.815.156.425.190.9490.40
III-2 (N = 211)7.5239.4230.324.376.6710.914.821.14105.17
III-3 (N = 794)10.1240.4431.093.065.567.075.711.07104.16
III-4 (N = 89)7.1630.2927.301.873.944.364.460.65680.03
Table 10. Comparison of different evaluation methods in geochemical sub-regions.
Evaluation
Method
Nemerow Pollution IndexGeoaccumulation IndexPotential Ecological Risk Assessment
The Soil
Geochemical Subregion
PNPollution LevelHeavy MetalSequenceIgeoQuality of SedimentHeavy MetalSequenceEri of HgSingle Factor Pollution Ecological RiskRIRisk IntensityHeavy MetalSequence
I-11.14low level pollutedNi Cr Cu11.36moderately pollutedNi (Cr Cu)134.60low109.16lowHg Cd Ni6
I-20.49unpolluted <0unpolluted 43.35moderate104.45lowHg Cd8
I-30.45unpolluted <0unpolluted 40.57moderate99.23lowHg Cd11
I-40.40unpolluted <0unpolluted 62.62moderate116.68lowHg Cd4
II-10.43unpolluted <0unpolluted 41.17moderate99.66lowHg Cd10
II-20.83warning line of pollutionNi Cr Cu Cd20.786from unpolluted to moderately pollutedNi (Cd Cr Cu Hg Pb Zn)267.64moderate165.30moderateHg Cd As Ni1
II-30.69unpollutedNi Cr Cu40.521from unpolluted to moderately pollutedNi (Cr Cu)442.00moderate115.33lowHg Cd As Ni5
II-40.55unpolluted 50.033from unpolluted to moderately pollutedHg (Cr)563.51moderate136.77lowHg Cd As2
II-50.55unpolluted 5<0unpolluted 54.54moderate124.71lowHg Cd As3
II-60.42unpolluted <0unpolluted 38.56low96.08lowHg Cd As12
III-10.45unpolluted <0unpolluted 36.88low90.40lowHg Cd13
III-20.72warning line of pollutionCr Ni30.541from unpolluted to moderately pollutedCr (Ni)339.42low105.16lowHg Cd Ni7
III-30.53unpolluted 60.030from unpolluted to moderately pollutedCr640.44moderate104.12lowHg Cd As9
III-40.34unpolluted <0unpolluted 30.29low80.03lowHg Cd14
Publisher’s Note: MDPI stays neutral with regard to jurisdictional claims in published maps and institutional affiliations.

