Abstract
The design and operation of reservoirs based on conventional flood-limited water levels (FLWL) implicitly adopts the assumption of hydrological stationarity. As such, historical-record-based FLWL may not be the best choice for flood-control operations due to the inherent non-stationarity of rainfall inputs. With maturing flood forecasts, this study focuses on establishing linkage between FLWL and skill of forecast, thus developing a “dynamic pre-storm level” approach for reservoir flood-control operations. The approach utilizes forecast flood magnitude, forecast skill and exceedance probability of forecast error to determine the pre-storm reservoir storage for each flood event. The exceedance probability of forecast error for each incoming flood is used as the reservoir flood control standard instead of the probability of a static return interval flood. This approach is demonstrated in a hypothetical situation in the Three Gorges Reservoir in China. The results show that under zero-forecast-skill conditions, the proposed dynamic pre-storm level matches well with the Three Gorges Reservoir-designed FLWL; and, as the forecast accuracy/skill increase, the proposed approach can make better use of the increased forecast accuracy, thereby maximizing floodwater utilization and reservoir storage. In this way, coupling the new approach with FLWL allows for more efficient and economic day-to-day reservoir operations without adding any flood risk. This study validates the usefulness of dynamic water level control during flood season, considering the improvement of flood forecast accuracy.
1. Introduction
Most large reservoirs are built for multiple purposes, including flood control, economic benefits and environmental protection. During the flood season, when flood control is the primary objective, reservoir levels are kept low for the entire season to ensure that there is sufficient storage to cater to extreme flood events. This usually static low reservoir level, known as the flood storage level or flood-limited water level (FLWL), is predetermined by reservoir routing of the design flood hydrograph using some given operating strategies and constraints [1,2]. The choice of traditional design flood, as well as FLWL, relies on the historical hydrological conditions (e.g., flood frequency distribution, flood peak) during the flood season. Given the growing non-stationarity of hydrology [3,4] and the rapid progress made in the hydrological forecast, it is imperative to seek new ways for reservoir flood-control operation.
Knowledge of future inflows in terms of streamflow forecasts is undoubtedly valuable for reservoir operation. Streamflow forecasts are greatly improved with the advances of hydrological modeling, weather forecasting, and hydro-climatic teleconnections [5,6,7]. The long-term forecasts (monthly to yearly periods), usually produced by hydro-climatic teleconnections (i.e., statistical relationships between local streamflow and global climatic factors), are widely used for long-term operational objectives such as water supply and hydropower scheduling [8,9]. In contrast, short-term forecasts (hourly to weekly periods), obtained from hydrological modeling and weather forecasting, are more valuable for short-term operation purposes such as flood control [10,11]. As short-term forecasts are much more reliable and stable than long-term forecasts [12,13,14], it offers promising initiatives to enhance the efficiency of reservoir flood control.
Contemporary research on reservoir flood control is beginning to emphasize the role of forecasts to produce higher economic benefits from floodwater and reservoir water level [5,11,15]. Most studies used either deterministic, probabilistic, or ensemble streamflow forecasts as inputs for reservoir operation. Reservoir optimal release or operation rules are therefore derived through simulation-based optimization method [11,16]. In recent years, increasing attention has been focused on the influences and risks associated with inflow forecast uncertainty. Faber [17] and Chou and Wu [18] proposed a volume-based pre-release strategy for small reservoirs by vacating flood storage in advance to be below the designed FLWL. Focusing on large reservoirs with adequate flood protection measures, dynamic control of FLWL (DC-FLWL) allows water level to fluctuate within specified bound but should conservatively drop to the designed FLWL when a large flood event is forecasted [19,20]. Zhao et al. [21] derived a flood hedging principle within the flood event, in which it is assumed that both initial reservoir level and final level are set to the designed FLWL. Following that, Hui et al. [22] developed an optimization model for pre-storm flood hedging releases considering engineering uncertainty; Ding et al. [23,24] established a real-time DC-FLWL optimization model balancing the water conservation loss for the non-flood season use and flood risk for downstream damage. An implied consensus in all these flood control studies is that no excess volume of water beyond the FLWL is allowed to be stored when inflow is relatively large. Little research has challenged this implicit rationality of the designed FLWL in the context of advanced flood forecasts.
With further advancement of flood forecasts and growth of social and economic water demands, understanding the impact of forecast uncertainty as well as incorporating flood forecasts into the appropriate setting of FLWL is imperative for floodwater utilization and reservoir conservation. Many studies have highlighted that the performance of reservoir operation depends on the skill of forecast products [25,26,27], yet only a few have investigated the short-term operation effect. An index of forecast skill, which is a key metric for forecast evaluation, has been proposed for a long time [28]. This study aims to derive a forecast-skill-based dynamic pre-storm level (D-PSL) approach for maximizing the excess reservoir storage during the flood season for economic benefits as well as ensure flood control safety by suitably relaxing the FLWL.
The rest of this paper is organized as follows: Section 2 compares some typical reservoir flood-control operation strategies and presents the derivation of forecast-skill-based dynamic pre-storm level for single flood events. Section 3 demonstrates a hypothetical application of the D-PSL to the Three Gorges Reservoir (TGR) in China and illustrates the effects of some physical characteristics on D-PSL chosen. Section 4 provides some related discussion, and, lastly, conclusions are drawn in Section 5.
2. Derivation of Forecast-Skill-Based Dynamic Pre-Storm Level
Most flood-control operation rules aim at reducing the peak flow of flood events [29]. However, reservoirs with large storage pools are able to mitigate the water level impact of peak flows. Hence it is not the peak flow rate but the flood volume that directly determines reservoir release and downstream risk. Apart from consecutive floods, the high flood volumes for most single flood events occur over a short period of time. The high flows occur mostly in a period of one day to a few days. We denote by the maximum n day flood volume of an incoming flood event. The forecast of the maximum period flood volume is thus denoted as “period flood forecast”. The use of period flood forecasts would result in quick decisions for reservoir operation and the avoidance of frequent opening and closing of sluice gates.
Focusing on large reservoirs that are unaffected by intraday (e.g., hourly) peak flow fluctuations, this study explores the possibility of flood-control operation based on the forecasts of maximum period flood volume.
2.1. Typical Reservoir Flood Control Operation Strategies
At present, reservoir representative water levels include design flood level, normal pool level, flood-limited water level, and dead water level, respectively, from top to bottom. The storage between the normal pool level and the dead water level is the active storage used for water supply, while that between design flood level and flood-limited water level (FLWL) is required for flood control. The engineers designed dams/reservoirs to protect against floods under a particular magnitude. The corresponding frequencies of flood occurrence, or risk level, are known as flood control standards determined by the Ministry of Water Resources of China. Both the probability of exceedance and return interval (in years), where , reflect the cumulative probability of a design magnitude flood being equaled or exceeded (i.e., the so-called flood control standard). The conventional procedure for flood-control operation relies mainly on FLWL. That is, starting from this level, the reservoir could hold any incoming floods below the design magnitude.
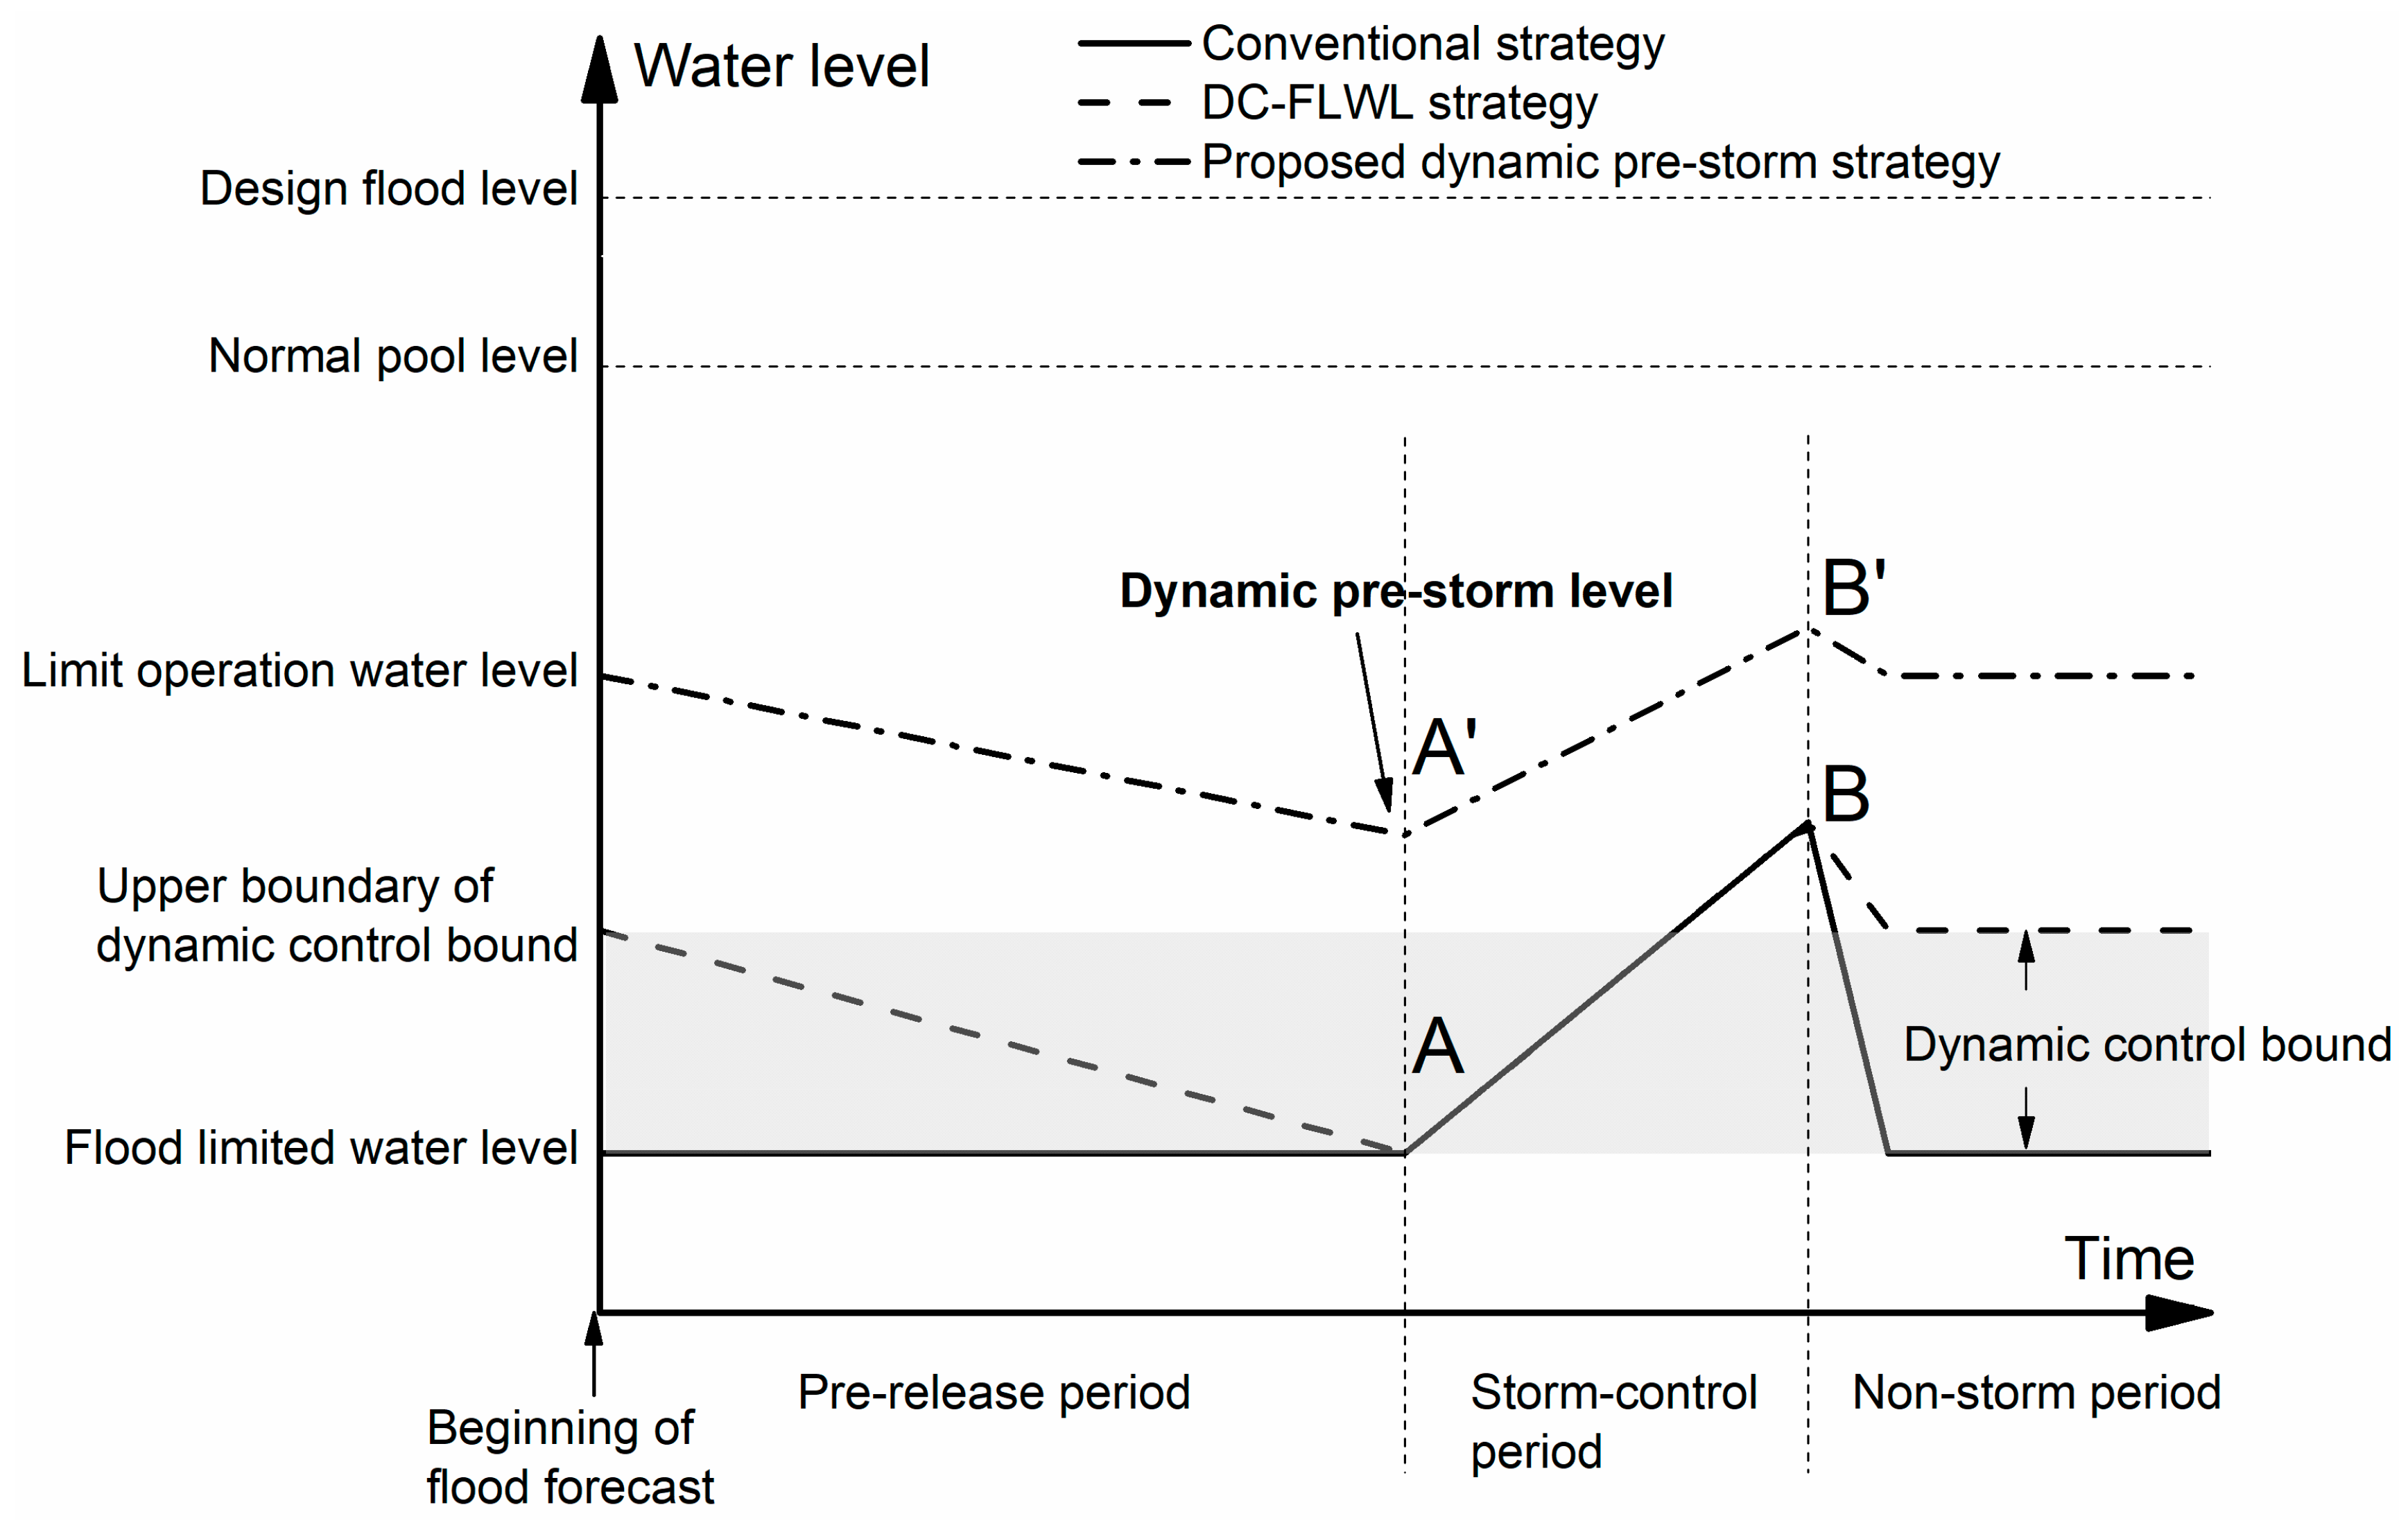
The general reservoir flood-control operation trajectories consist of two types of reservoir operation strategies, conventional strategy and DC-FLWL strategy, as shown in Figure 1. The flood-control operation can be split into three periods depending on the occurrence of the flood event: pre-release period, storm-control period, non-storm period. For the conventional flood-control operation strategy (solid line in Figure 1), reservoir water levels are generally operated at FLWL during the pre-release period and non-storm period. When a flood event occurs, the reservoir is permitted to retain floodwater; hence the water level will rise above FLWL (i.e., from level A to some level B based on the reservoir operational practice). Once the flood has subsided, the reservoir water level should return to FLWL. However, this conventional operation does not consider the influences of flood forecasts and often results in uneconomic reservoir operation due to the limitation of low water level. Therefore, Li et al. [19] and follow-up researchers, e.g., [30,31], adopted a range of higher water levels than FLWL during the non-storm period (known as dynamic control of FLWL, DC-FLWL), that allows reservoir water level to fluctuate within the dynamic control bound. When the forecast flood is relatively small, the reservoir is operated with forecast information; when a large flood is forecasted, the water level should be reduced to FLWL at the start of the storm-control period and allowed to rise following the conventional strategy (i.e., from level A to level B). After the storm, the reservoir water level will return to the upper boundary of the dynamic control bound (dashed line in Figure 1).
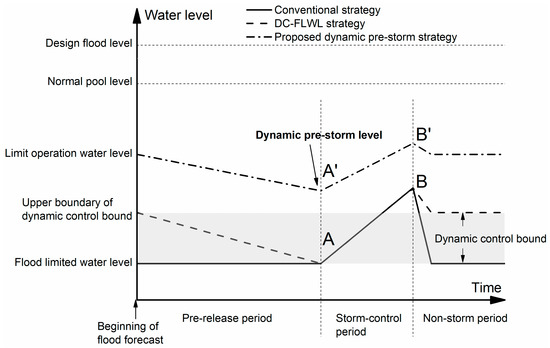
Figure 1.
Schematic diagram of reservoir water level operation trajectories under three different flood-control operation strategies.
The method of DC-FLWL has successfully utilized excess reservoir storage capacity during the pre-release period and non-storm period thus increases the hydropower production and floodwater utilization rate without decreasing flood control standard. However, always be ready to lower reservoir level to FLWL can severely constrain the set of DC-FLWL in flood season. Since the FLWL is obtained based on the design flood, it may be pretty low if the design flood is set to a very low probability of occurrence; this is especially the case for some key projects. Nevertheless, most real-world flood events are significantly smaller than the design magnitude; fixing the pre-storm regulating water level at FLWL may be too conservative. Furthermore, the design return interval may not be well-defined because of uncertainty factors such as the sampling amount of flood records and the choice of flood series distribution [32]. These factors can severely affect the precision of return interval prediction.
From the above analysis, the DC-FLWL strategy does not give full consideration to the forecasts regarding the magnitude of incoming floods. Instead of employing the probability of a static return interval flood (i.e., design flood) as a reservoir flood control standard, this study proposes a dynamic design-flood probability, indicated by the exceedance probability of forecast error for each incoming flood. A new dynamic pre-storm flood-control operation strategy based on this criterion is then proposed (double dashed line in Figure 1) in this study.
The proposed new strategy consists of three key elements:
- The reservoir water level at the beginning of flood forecasts should be allowed to operate below a limit operation water level;
- The water level at the start of the storm-control period should be set to a lower water level as compared to the beginning of flood forecasts. This water level (hereinafter referred to as dynamic pre-storm level, D-PSL, i.e., level A’ in Figure 1) is related to the magnitude and accuracy of forecasts for the incoming flood. Then reservoir regulates the flood from this level to some level B’ based on the difference between flood volume and reservoir release;
- After the storm-control period, the reservoir should be allowed to return to the limited operation water level.
These elements of the proposed strategy enable the reservoir operators to make full use of the excess reservoir capacity and information provided by the flood forecasts, not just during floods but throughout the flood season. In this study, our analyses focus on the derivation of the dynamic pre-storm level.
2.2. Forecast-Skill-Based Dynamic Pre-Storm Level Derivation
2.2.1. Forecast-Skill-Based Period Flood Forecasts
Flood forecasts are generally associated with some uncertainty because of the stochastic nature of storms and the range of forecast models/products used. We denote by and the forecasting and actual maximum flood volume, respectively, within time period. Forecast uncertainty can be indicated by the differences between the two and represented by forecast error , with:
Forecast skill represents the magnitude of forecast uncertainty. One of the commonly adopted methods to evaluate forecast skill is the coefficient of prediction proposed by Lettenmaier [28], with:
where MSE and are the mean squared error and statistical variance, respectively. Using multiple linear regression techniques, is numerically equal to the square of the correlation coefficient between observed and forecasted period floods [33]. In practice, long-term historical forecasts and observations can be used to estimate [34,35]. Consider the fact that hydrologic conditions in more regions have been changed due to the disturbance of intensive human activities and climate change and are expected to continue to change [3,36,37], the non-stationary patterns in streamflow (and precipitation) have brought challenges for flood risk predictions, and thus forecast skill determination. One possible solution is to derive the streamflow statistics on the basis of climate change projections of hydrologic conditions rather than just historical case following, e.g., [9] or [38], which helps mitigate some effects of changes in hydrological variability.
Denoting the variance of forecast error by , the coefficient of prediction can be the connection for a fraction of streamflow variability and forecasts [8,39], with:
For a given forecast skill , the forecast uncertainty level, , can be therefore derived from Equation (3). ranges from zero to one, with 1.0 for a perfect forecast skill ( becomes zero), and 0.0 for a forecast containing no information other than the mean of historical statistics or projections ( equals to unconditional variability of , ). Thus, an effective flood forecast error variance cannot be greater than flood variance, i.e., . Otherwise, having no forecast would be a better option [39]. Clearly, as forecast skill increases, the losses of forecast accuracy improves, and the economic and societal benefits associated with a real-time operating policy should approach the minimum.
For any hydrologic forecast model, the forecast error may be expressed using a specified distribution obtained via regression or parameter estimation with past forecast error. Knowledge from stochastic hydrology and forecasting studies suggests flood forecast error follows a bounded biased distribution [40]. In practice, is usually assumed to follow a priori Gaussian, Student’s t, or gamma distribution. For the sake of simplicity, the non-Gaussian distributed forecast errors may be transformed and mapped onto Gaussian space by applying the normal quantile transform (NQT) method [41,42], with known transformed variance, , that is, , following Ding et al. [23,24] and Zhao et al. [25].
2.2.2. Derivation of Dynamic Pre-Storm Level
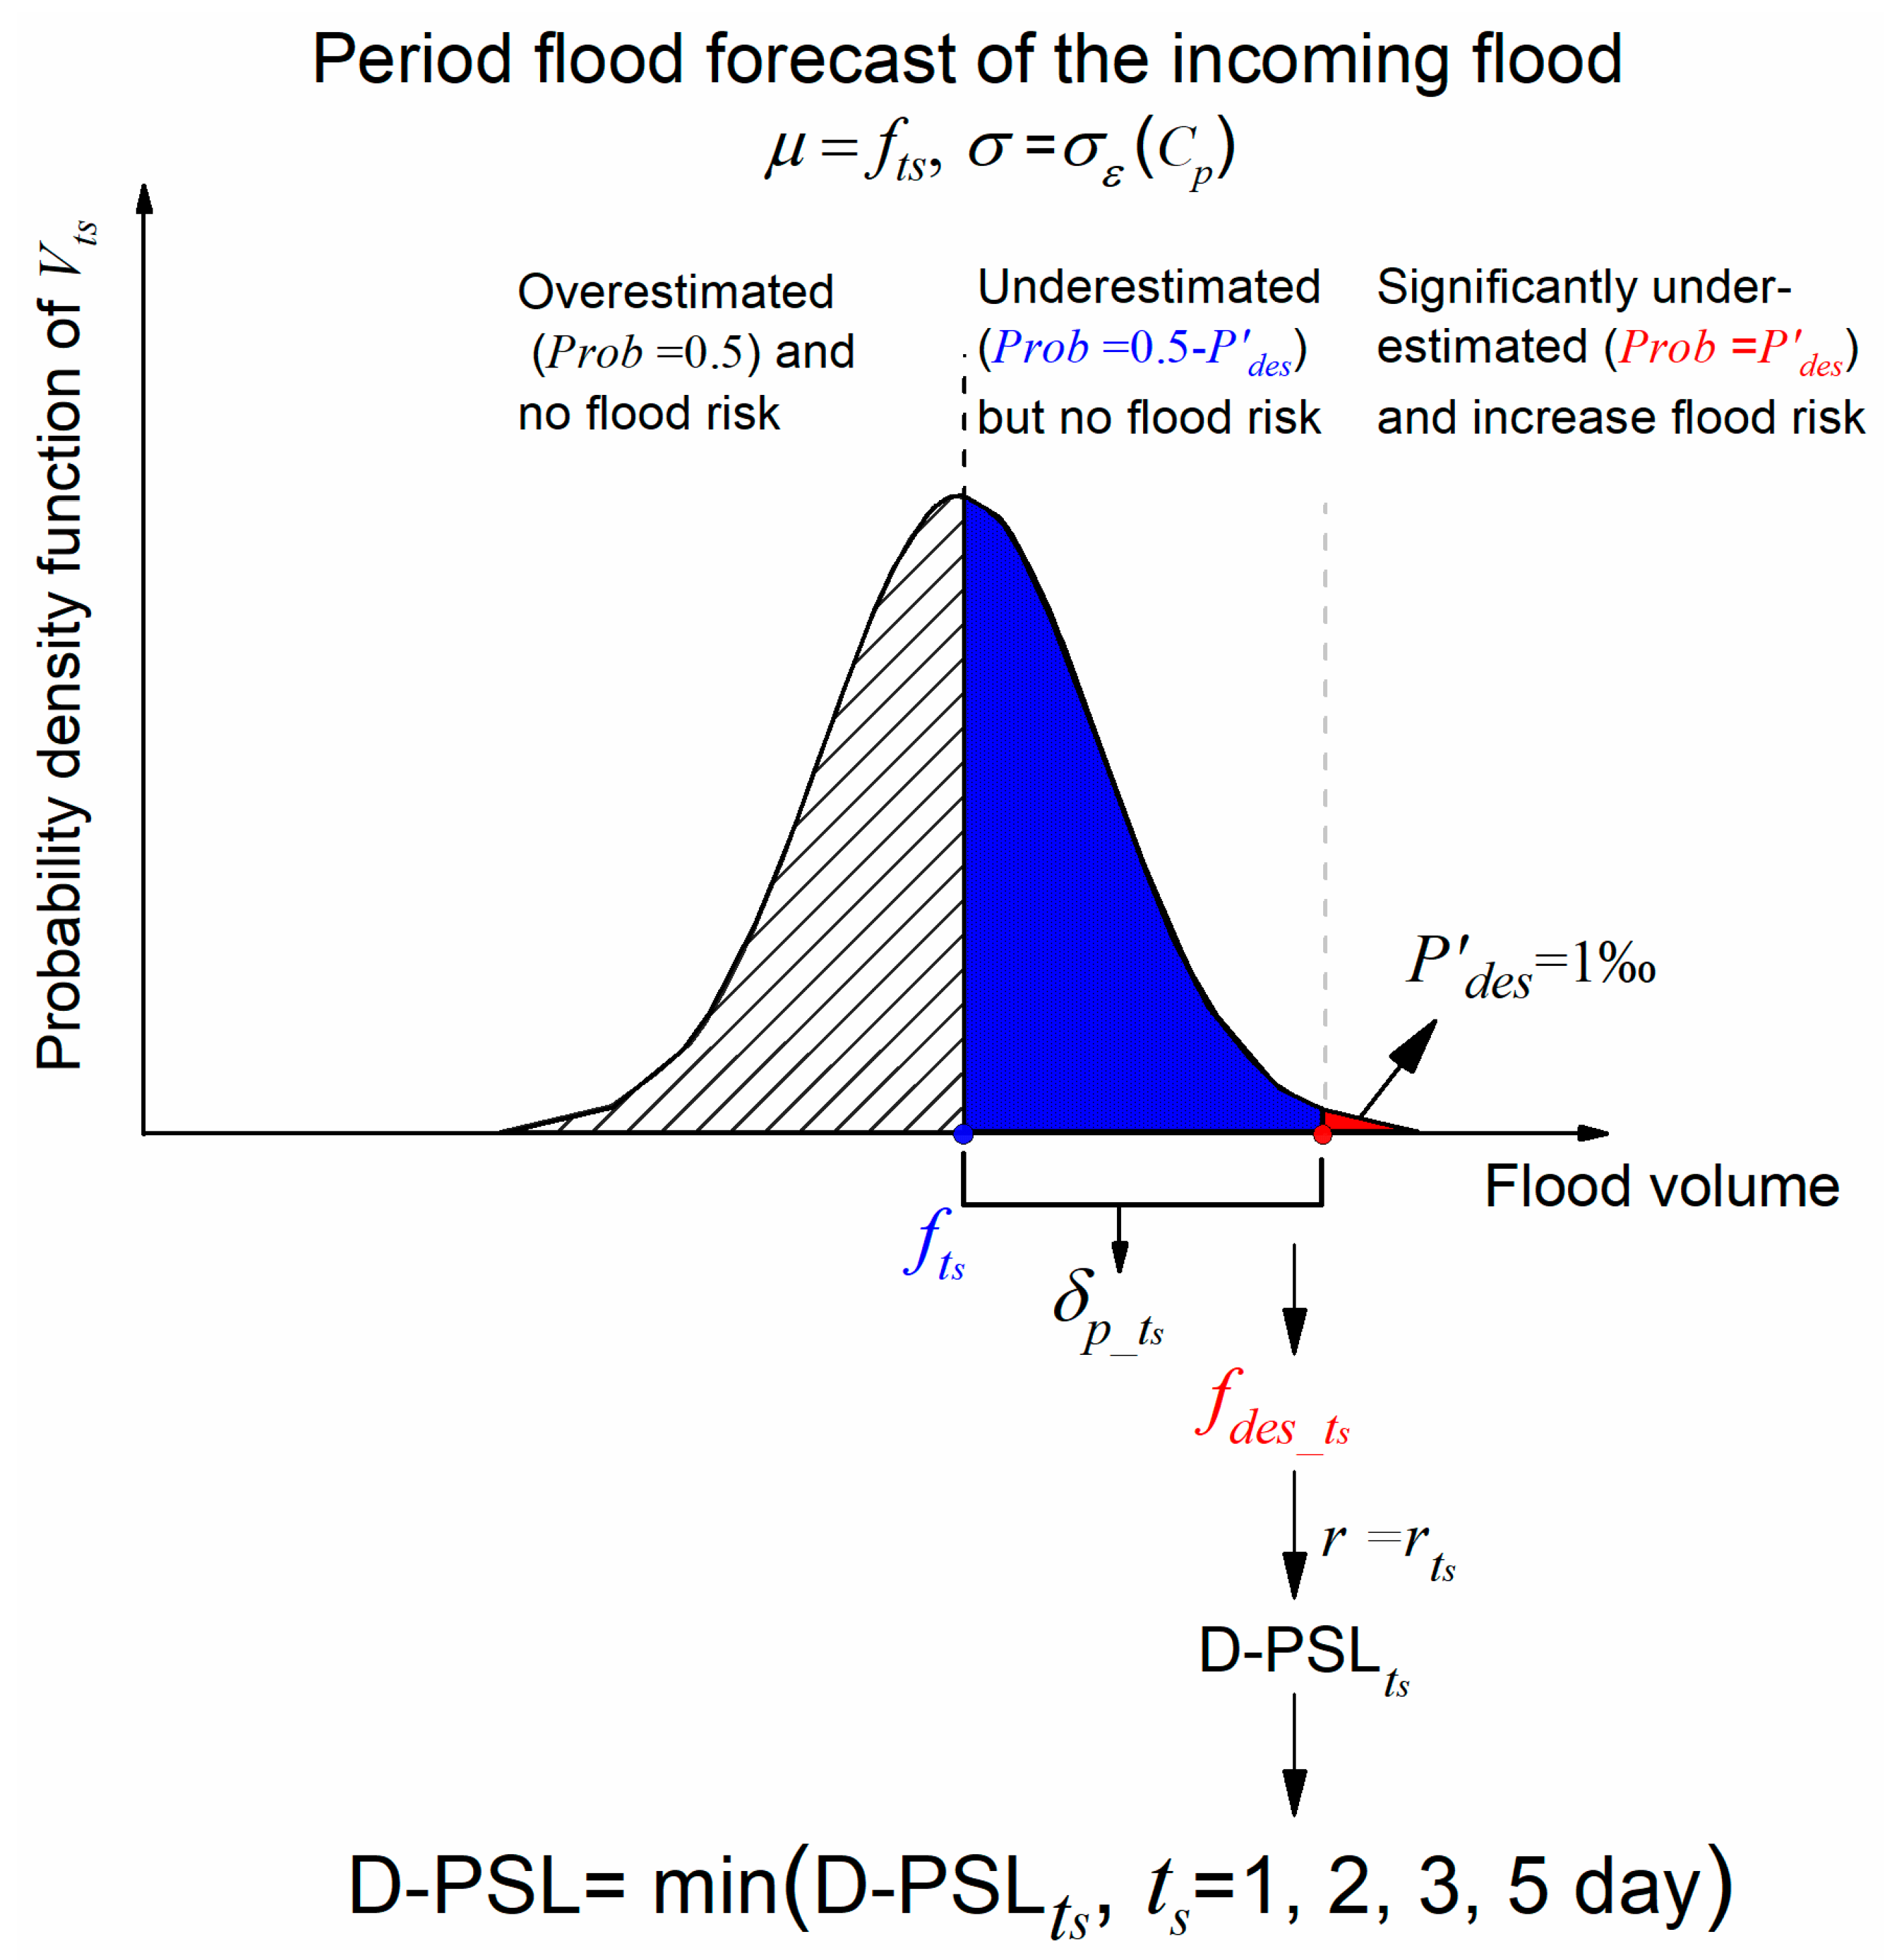
Section 2.1 has mentioned that reservoir flood control standard relies mainly on the static design flood with a predefined return interval (, event exceeds once in T years). In practice, since the design flood is often far greater than what actually occurs, the design-flood-based water level often tends to be unnecessarily low. Along with maturing flood forecasts, the uncertainty in forecasts for the incoming flood has been considerably decreased. Therefore, we may define a dynamic design-flood probability (in terms of exceedance probability of forecast error for each incoming flood) as a new flood control standard, thereby spreading the tiny flood control risk to each flood. The should numerically be equal to the primary standard, , and be represented by the integral function of forecast error for each incoming flood being beyond a limit under a given (as shown in Figure 2), with:
where is the inverse of the cumulative probability function of forecast error. For the normal distribution, a higher/better forecast skill (i.e., larger value) would bring a decrease in forecast uncertainty level, , and thus limit forecast error, .
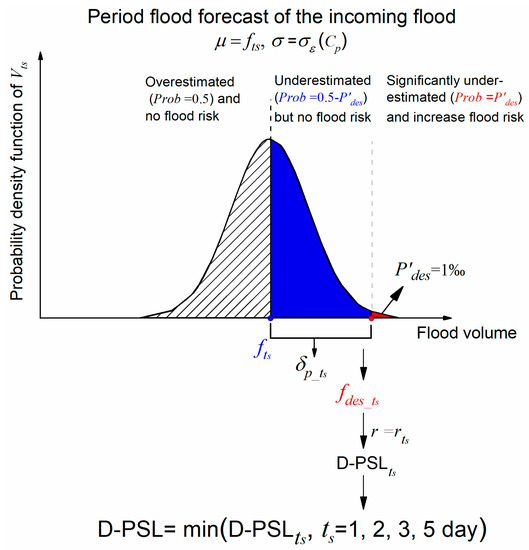
Figure 2.
Schematic diagram for deriving the dynamic pre-storm level (D-PSL) based on the forecast of an incoming flood event.
According to the definition of dynamic design-flood probability, the dynamic design period flood, , that could cause damage to the reservoir should be the sum of forecast value and limit forecast error, as shown in Figure 2. Note that the dynamic design period flood changes in magnitude with each incoming flood rather than a constant value, with:
Both upstream flood and downstream channel capacity influence reservoir flood-control operation. Like the common operational practice, we assume the reservoir stores all incoming floodwater while releases according to downstream conveyance capacity (, converted into cumulative volume in day). The dynamic pre-storm level D- (i.e., the associated pre-storm reservoir storage ) can be expressed as:
To ensure flood control safety, reservoir pre-storm regulating water level should not be higher than this D-PSLts, which is the sum of reservoir capacity and maximum day release volume minus the dynamic design period flood .
From the above derivation, the critical pre-storm water level (or storage) for a certain time period can be obtained. Herein, four sets of forecast periods are considered, including maximum 1, 2, 3 and 5 day flood volumes, which bracket the range of useful forecasts. Therefore, the chosen D-PSL for each incoming flood should be the minimum of the multiple time period D-, with:
D-PSL = min(D-PSL1 d, D-PSL2 d, D-PSL3 d, D-PSL5 d)
The specific calculation steps are as follows:
- Step 1.
- Estimate the flood variance, , for multiple periods from historical/projected annual maximum flood series (AM) [43];
- Step 2.
- Evaluate the forecast skill ( of any applicable hydrological forecast model based on long term retroactive forecasts and observations following hydrological forecasts related research, e.g., [35];
- Step 3.
- Produce the maximum day flood volume forecast of an incoming flood using the forecast model, where the forecast is in the form of mean and variance ;
- Step 4.
- Calculate the dynamic design period flood, , according to the reservoir dynamic design-flood probability, , indicated by the exceedance probability of forecast error (e.g., 1% shown in Figure 2);
- Step 5.
- Carry out the reservoir flood-control operation according to Equation (7) based on dynamic design period flood, , and then obtain the dynamic pre-storm level, D-;
- Step 6.
- Repeat step 3 to step 5 with the time period varying from 1 day to 2 days, 3 days, and 5 days, and obtain the corresponding D-;
- Step 7.
- Define the minimum value in {D-PSL1 d, D-PSL2 d, D-PSL3 d, D-PSL5 d} as the chosen D-PSL.
When 1.0, the flood volume forecasts with full accuracy, i.e., . Hence, the limit forecast error obtained from Equation (5) is zero; hence Equation (7) becomes
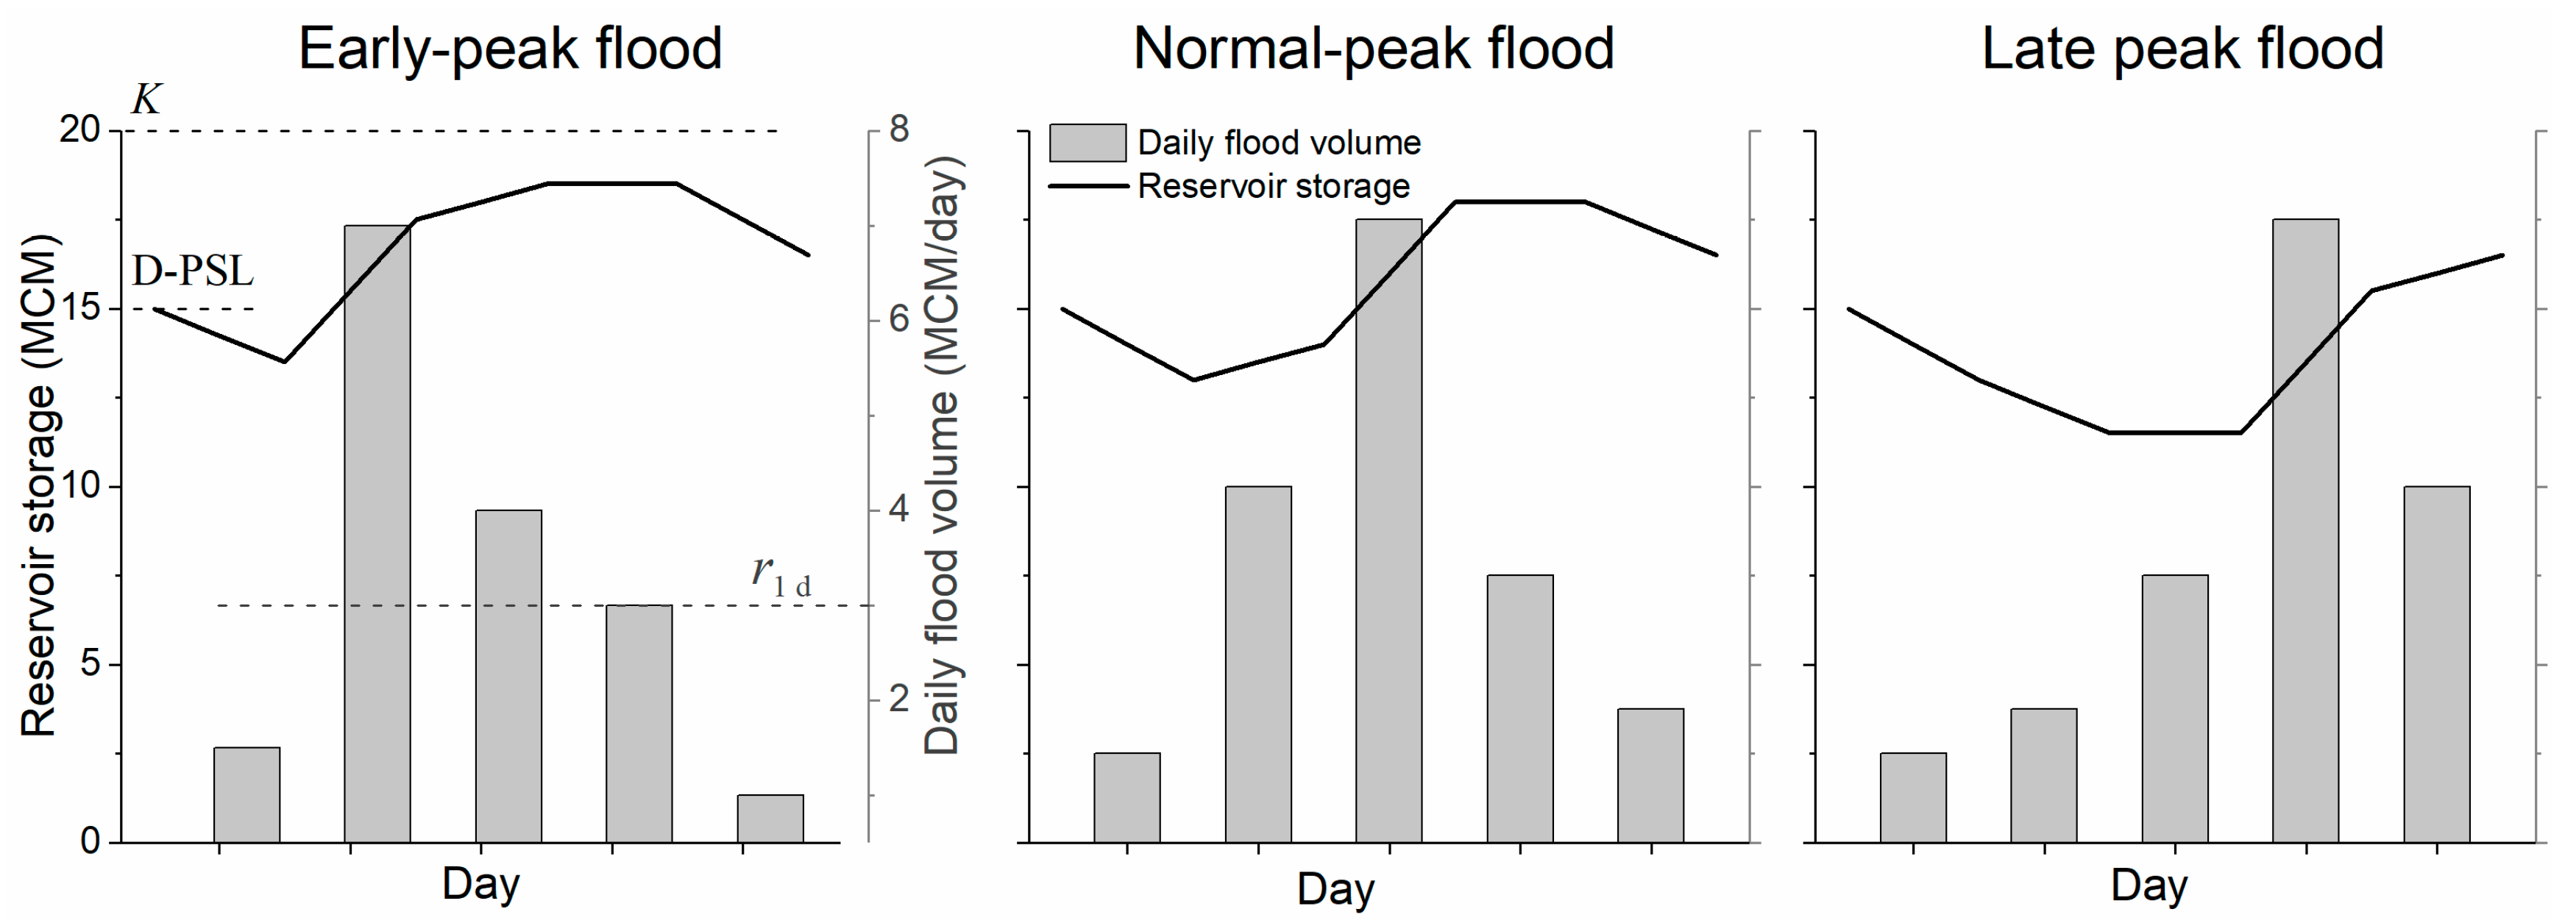
Before proceeding with further analysis, let us consider a special example to illustrate the determination of D-PSL and the regulation process. Let , 20 MCM (million cubic meter), = 3 MCM/day. Assume three different types of flood shapes, but with the same period flood volumes to be 7 MCM/day, = 7 + 4 = 11 MCM/day, = 7 + 4 + 3 = 14 MCM/day, and 7 + 4 + 3 + 1.5 + 1 = 16.5 MCM/day (gray bars in Figure 3). Then we have D-PSL1 d = 16 MCM, D-PSL2 d = D-PSL3 d =15 MCM, D-PSL5 d = 18.5 MCM according to Equation (9). Following Equation (8), we have the chosen D-PSL = 15 MCM, which should be the initial storage before the flood. Regulating flood with the maximum safety release, the solid lines in Figure 3 show the reservoir storage processes within the storm-control period under three flood shape types. The result shows although the determination of D-PSL is simply based on the flood volume, it is still capable of coping with the daily scale uneven distributed flood hydrograph.
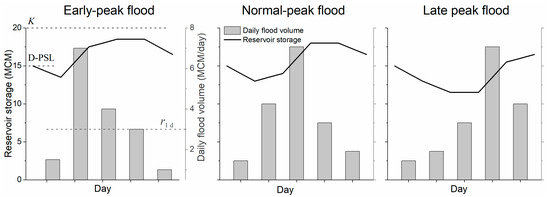
Figure 3.
The flood regulation process under three different types of flood shapes.
2.2.3. The Relationship between Forecast Error and Flood Risk
Considering the fact that most reservoir operators are more conservatives than risk-takers, it is necessary to analyze the corresponding flood risks. Using this chosen D-PSL as pre-storm regulating water level, the relation between forecast and actual flood volume (regardless of the time period ) can be divided into three cases (see Figure 2):
- Overestimated flood volume—the probability of such case . The reservoir will not be filled to its capacity; thus, the outflow can be reduced according to the flood volume difference between the dynamic design period flood and actual flood volume. Compared to the static FLWL method, the D-PSL-based operation will definitely not increase flood risk, and this conclusion is irrelevant to the magnitude of a flood;
- Underestimated, but within limit forecast error—the probability of such case . This seems alert condition actually will not face flood risk. This is because the D-PSL is derived from rather than the forecast value itself. This means the proposed policy did provide an adequate margin of safety. Indeed, the result is the same as case 1;
- Significantly underestimated flood volume—the probability of such case . The actual flood is significantly larger than the forecasts. The reservoir storage reserved is insufficient to capture all excess flood. To avoid catastrophic flood damage induced by a dam failure, the reservoir must release water equals to the inflow, thus increase downstream flood risk. However, this kind of probability for each flood event is less than , which is usually as small as 1% to 0.01%.
3. Case Study
The proposed methodology for deriving D-PSL is implemented in a case study. Note that this method is only applicable to reservoirs whose sizes are large enough to retain flood-peaks. It is based on the implicit condition that the wave travel time in those reservoirs should be long so that any sudden increase in peak inflow does not adversely affect the water level at the outlet of the reservoir.
3.1. The Three Gorges Reservoir
The Three Gorges Reservoir (TGR, 30°49′ N; 111°00′ E), one of the largest water resource projects in the world, is selected as a case study in a hypothetical situation. The TGR dam, located in Yichang City of Hubei Province, China, controls the streamflow of the upper Yangtze River. It drains an area of 1.0 million km2. The mean annual streamflow at the dam site is 4510 × 108 m3. The TGR dam is mainly operated for flood control, hydropower generation and navigation improvement. In particular, the flood control target is to protect the downstream areas from frequent and disastrous flood threats in the flood season from June to September.
The designed FLWL of TGR is fixed at 145 m MSL (171.5 × 10⁸ m3), which is also the dead water level. The total reservoir storage at the normal pool level (also design flood level) 175 m is 393 × 108 m3. The current flood-control operation in the flood season is when the flood comes, the release of TGR is hierarchically controlled not to exceed the downstream safety discharge of 56,700 m3/s (i.e., ). The flood control storage (storage between FLWL and design flood level) is 221.5 × 10⁸ m3, which takes up more than half the total storage.
The current flood forecast product for TGR is the Yangtze River real-time flood forecasting system (Yangtze FFS) [44,45]. With the development of weather monitoring and forecasting techniques, reliable flood forecast horizon (i.e., effective forecast lead time) of Yangtze FFS has reaches 3–5 days. Currently, the forecast skill of Yangtze FFS at a three day lead time is roughly estimated at 0.8. Despite such high forecast skill, the current flood-control operation still follows the FLWL, making little use of flood forecasts.
3.2. Evaluation of Dynamic Pre-Storm Level
The methodology of deriving the D-PSL from a sequence of simulated forecasts (i.e., expected floods) under a given may be summarized in the following steps:
- Estimate the period flood variance by reviewing the historical flow using the annual maximum series method;
- Simulate flood volume for multiple time periods using the autoregressive model and Gaussian random number generator, and use them as period flood forecasts ;
- Verify the simulation model by comparing the results between historical observations and simulated forecasts;
- Compute the limit forecast error for multiple time periods under a given forecast skill using Equations (1) to (5);
- Calculate the D-PSLts based on forecast floods for multiple time periods and obtain the chosen D-PSL using Equations (6) to (9).
Since the detailed forecast information of Yangtze FFS is hard to find, we could not obtain the historical flood forecasts. Moreover, to investigate the relationship between forecast skill and the proposed dynamic pre-storm level, the analysis is based on the simulated forecasts. Using the observed daily inflow records from the year 1882 to 2007 at Yichang hydrologic station, four sets of statistics for maximum daily flow (m3/s) and maximum 1, 2, 3 and 5 day flood volumes (108 m3) were calculated. Table 1 presents the statistic parameters of design flood volumes for TGR.

Table 1.
The statistic parameters of the design maximum flood volumes within multiple time periods for Three Gorges Reservoir (TGR), where the means and variances of period flood volume are derived from historical daily flow series over the period 1882 to 2007.
3.2.1. Flood Simulation based on Historical Records Using Autoregressive Model
Hydrological stochastic simulation is widely used in reservoir operation to reduce the impact of hydrological uncertainty [46,47]. Although the TGR flood series of 126 years of observations are long enough for statistical analysis, the observations cannot provide floods of higher magnitude, like 1000 year recurrence events. In addition, because of the intercorrelation between flood volumes of various time periods, stochastic simulation can obtain more combinations that are possible for each incoming flood. Hence there was a need to simulate events of any return interval.
Since the maximum period floods happen in different years are independent, the linear autoregressive order 1 (AR1) model, based on historical records, can be used to simulate floods and take them as forecast floods (i.e., ) [48,49]. The general form of AR1 is:
where is a vector of the variables of interest, namely Pearson’s type III (P3) distributed period floods at year ; is lag 1 autoregressive coefficient; is the independent standardized P3 distributed stochastic sequence, expressed as:
where is a Gaussian variate with mean zero and standard deviation one; , the skewness coefficient of , is related to that of by:
The simulated flood now preserves the mean , variance , lag 1 correlation which is assumed as zero, and skewness of each historical flood.
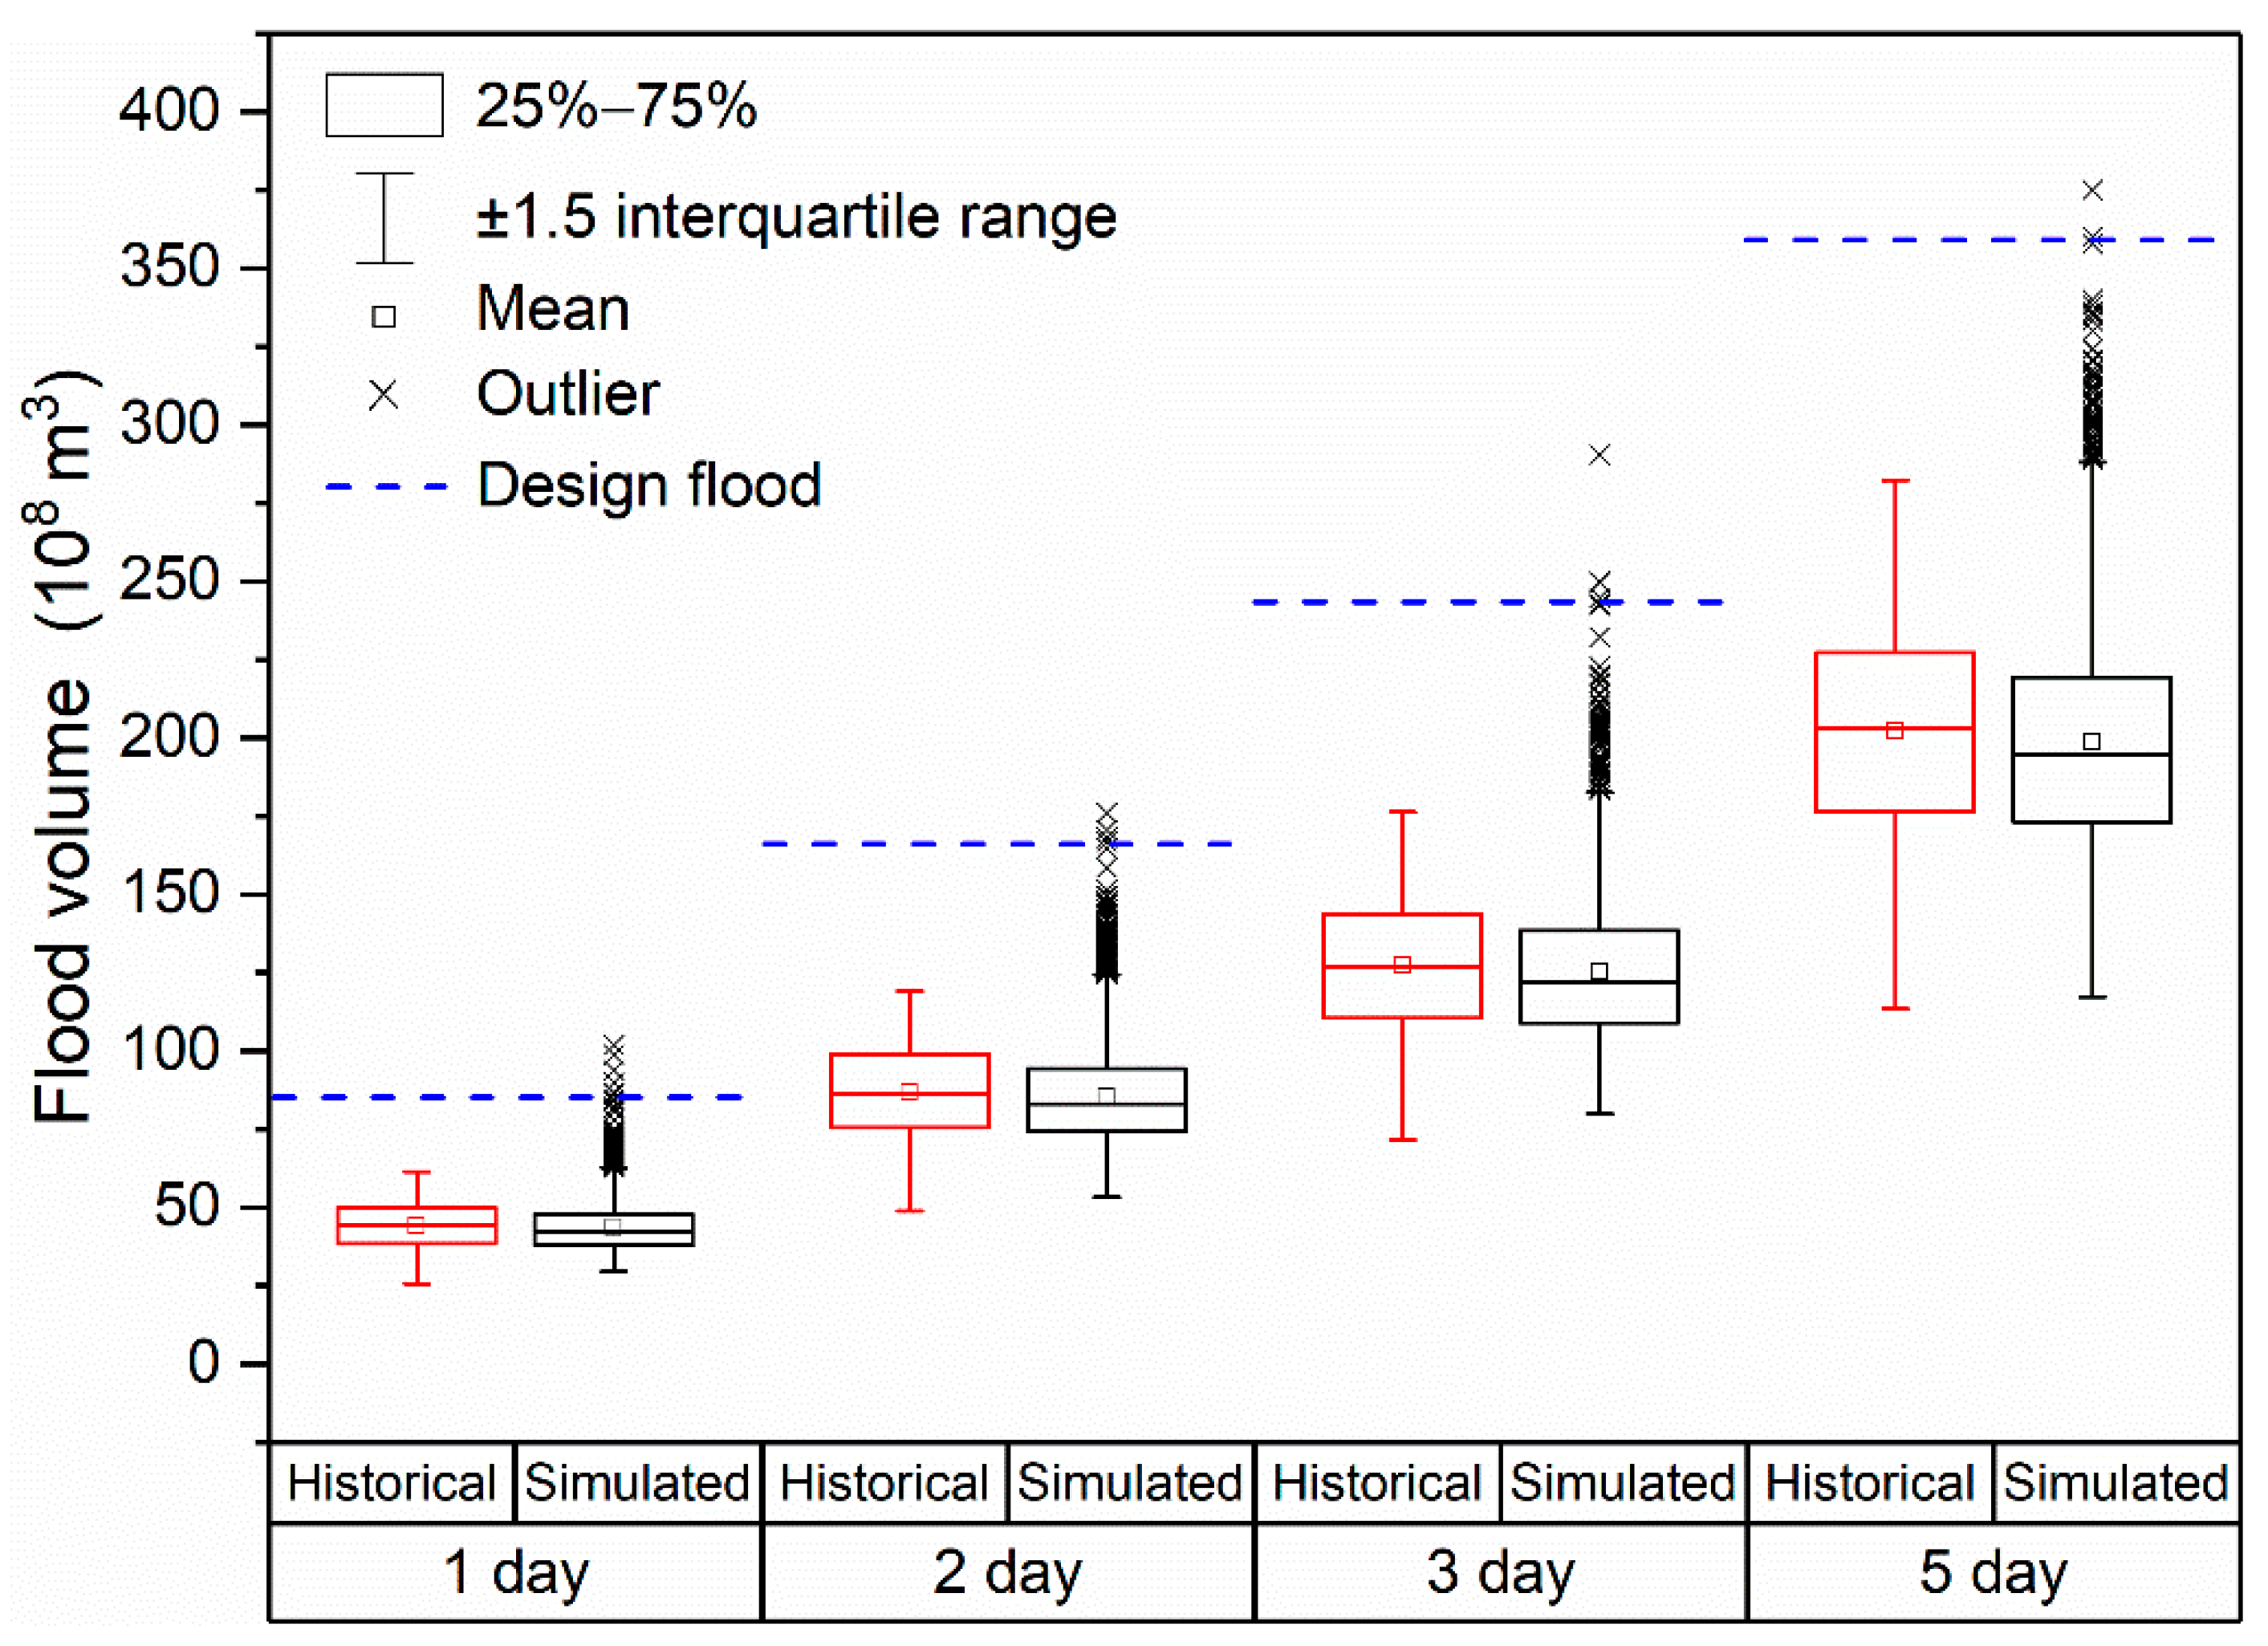
After simulation with 40,000 repetitions (10,000 times each period flow, i.e., maximum 1 day, 2 day, 3 day, and 5 day flood volumes), we have 10,000 sets of simulated floods by randomly grouping the four types of period flows. The boxplots of simulated (forecast) floods and historical period floods are plotted in Figure 4. Compared to the historic daily inflow records from 1882 to 2007, the mean, coefficients of variation and skewness of simulated period flood are calculated and proved to be close to the records. The largest difference in mean, CV and CS are within 2%, 10%, and 6%.
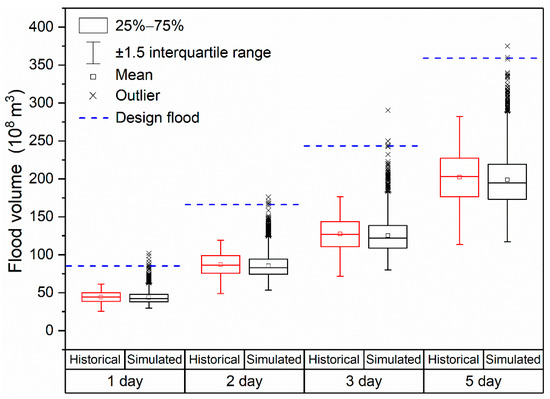
Figure 4.
Boxplots of (red) 126 historical annual maximum period flows (1 day, 2 day, 3 day, 5 day) and (black) 10,000 simulated forecast floods, the blue line marks the designed 1000 year return interval flood.
The flood frequency classification of the 10,000 simulated forecast floods is presented in Table 2. Among these simulations, 9 of them predict maximum 1 day flood volumes exceeding the magnitude of 1000 year design flood derived from historical series. Similarly, there are 5 times for maximum 2 day flood volume, 6 times for maximum 3 day flood volume and 3 times for maximum 5 day flood volume. As for the low magnitude flood, more than half of the total simulated forecast floods belong to the 2 year flood recurrence or even more frequent. All these comparisons represent the effectiveness of the above flood simulation model, with good reflecting of history and coverage of different magnitude floods.

Table 2.
Classification of simulated 10,000 forecast floods based on design flood frequency statistics, represented by the number of flood events that occur of different magnitude.
3.2.2. Forecast-Skill-Based Dynamic Pre-Storm Level
Based on the forecast floods simulated by the AR1 model, this section presents the results of D-PSLts and chosen D-PSL for each flood event under different levels of forecast skills. The return interval of TGR dam design flood is one in 1000 years (i.e., ) with a conveyance capacity of 56,700 m3/s (i.e., ) for the downstream flood control gauging station Shashi (a once-in-100-year design flood of downstream Jingjiang River reach). The design reservoir storage at the normal level 175 m is 393 × 108 m3 (i.e., K).
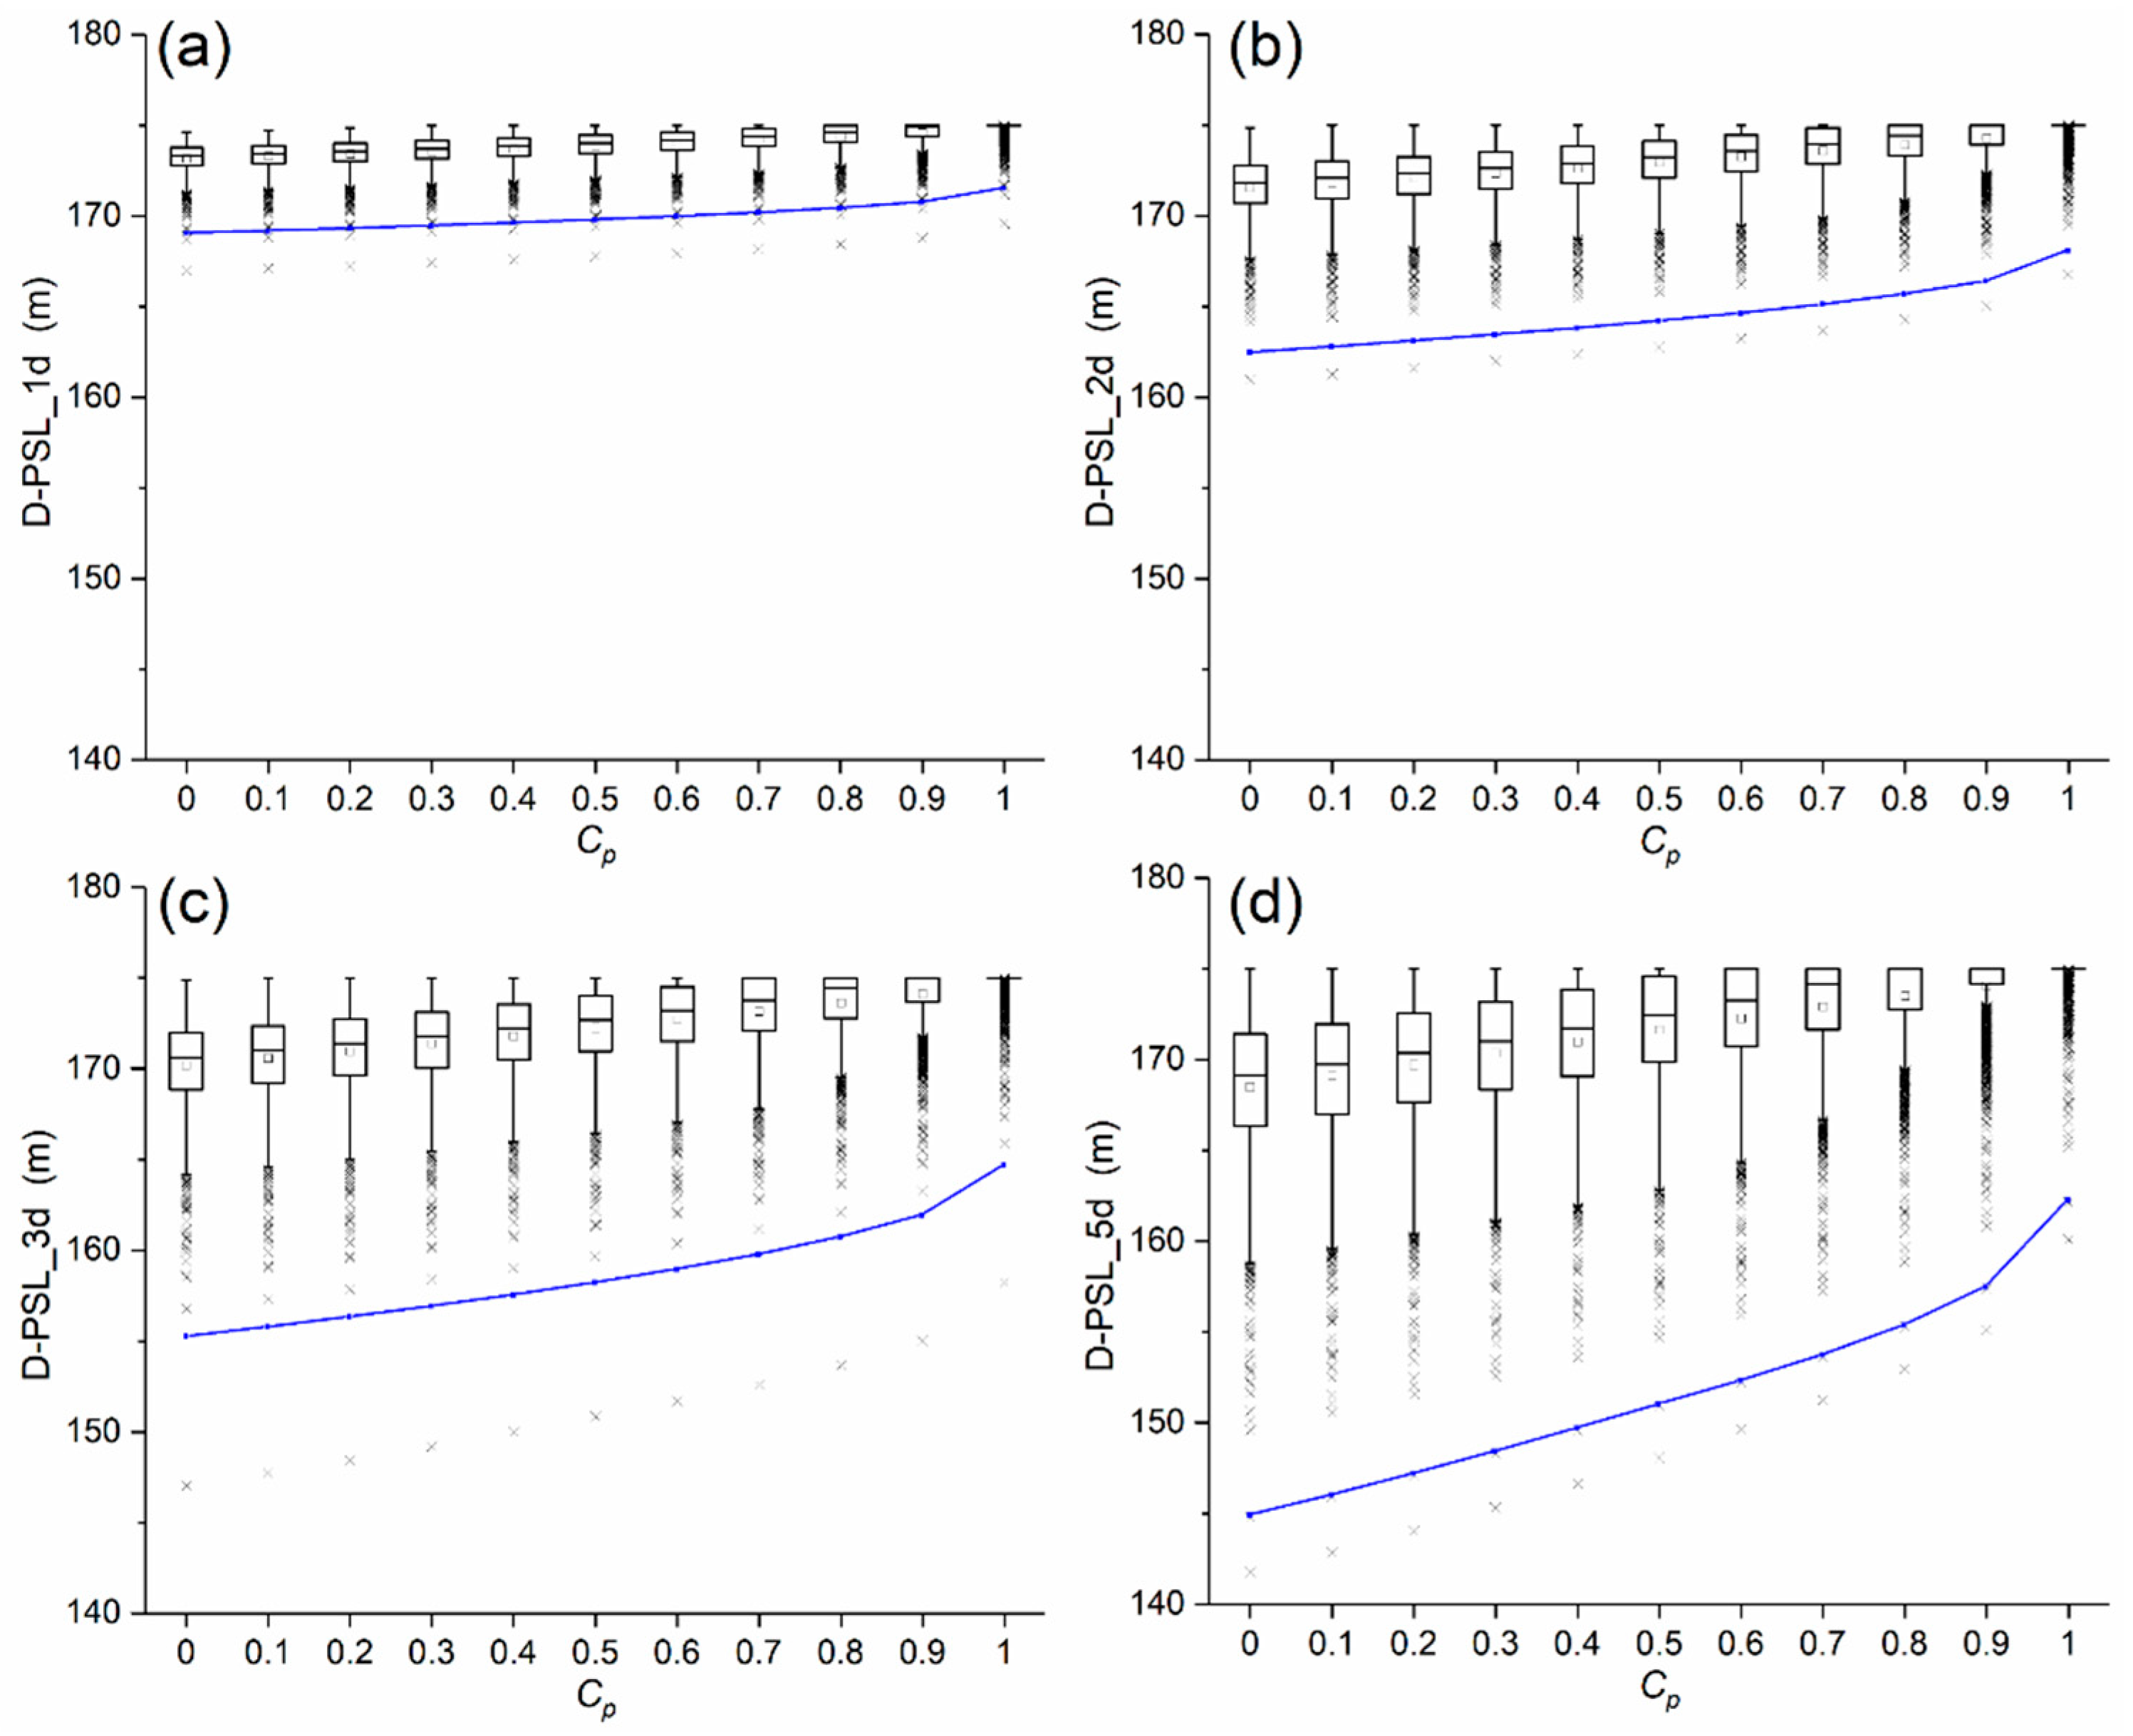
Recall from Equation (4) that the reservoir dynamic design-flood probability equals the forecast error exceedance probability, i.e., . Under a given forecast skill, the variance of forecast error for each incoming flood is given by Equation (3), i.e., . According to Equations (5) to (9), the D-PSLts for different period flood forecasts, with the forecast skill varying from zero to perfect, can be obtained (Figure 5).
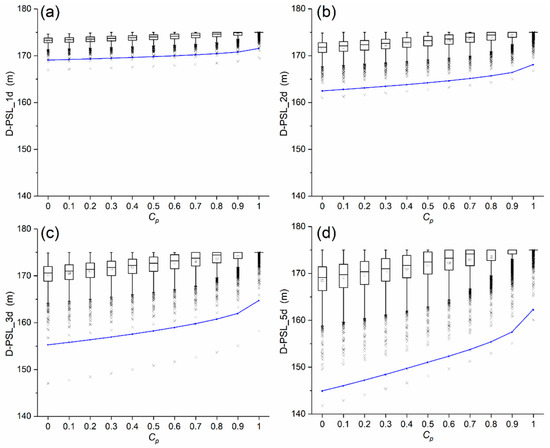
Figure 5.
(a–d) The D-PSL1 d, D-PSL2 d, D-PSL3 d, and D-PSL5 d obtained from the forecasted maximum 1 day, 2 day, 3 day, and 5 day flood volumns for the 10,000 simulated floods. The blue line marked the D-PSLtss obtained from the forecast flood with a 1000 year design return interval, as listed in Table 1, with the change of forecast skill.
Focusing only on the result of one certain period (e.g., Figure 5a), the D-PSL1 d of 10,000 forecast floods ranges from 167 m to 175 m. The water level cannot be higher than 175 m since it is the highest water level permitted. Some D-PSL1 d obtained from the 10,000 forecast floods (outlier cross sign in Figure 5a) are found to be lower than the D-PSL1 d obtained from forecasted design flood (blue line in Figure 5a). This is because that some forecast floods are simulated with magnitudes larger than the design flood (see Figure 4). The dispersion of D-PSLtss reduces with the increase of forecast skill (X-axis). For the perfect forecast condition (i.e., ), there is no need to vacant any storage for more than 75% of flood events. When comparing the results of multiple periods (e.g., Figure 5a–d), the range of D-PSLtss becomes wider. Both phenomena are due to the variance of forecast error. For one certain flood event, with the increase of forecast period from maximum 1 day to maximum 5 day, or the decrease of forecast skill from one to zero, the uncertainty of forecast (reflected by the variance of forecast error) will increase significantly (Table 1 or Equation (3)). This means a larger limit forecast error () is found from the platykurtic distribution consistently (Equation (5)), and thus, results in a larger dynamic design period flood and lower D-PSLts. Therefore, the chosen D-PSL for one certain flood event, according to Equation (7), obtained from different forecast skill models or different forecast periods can be different.
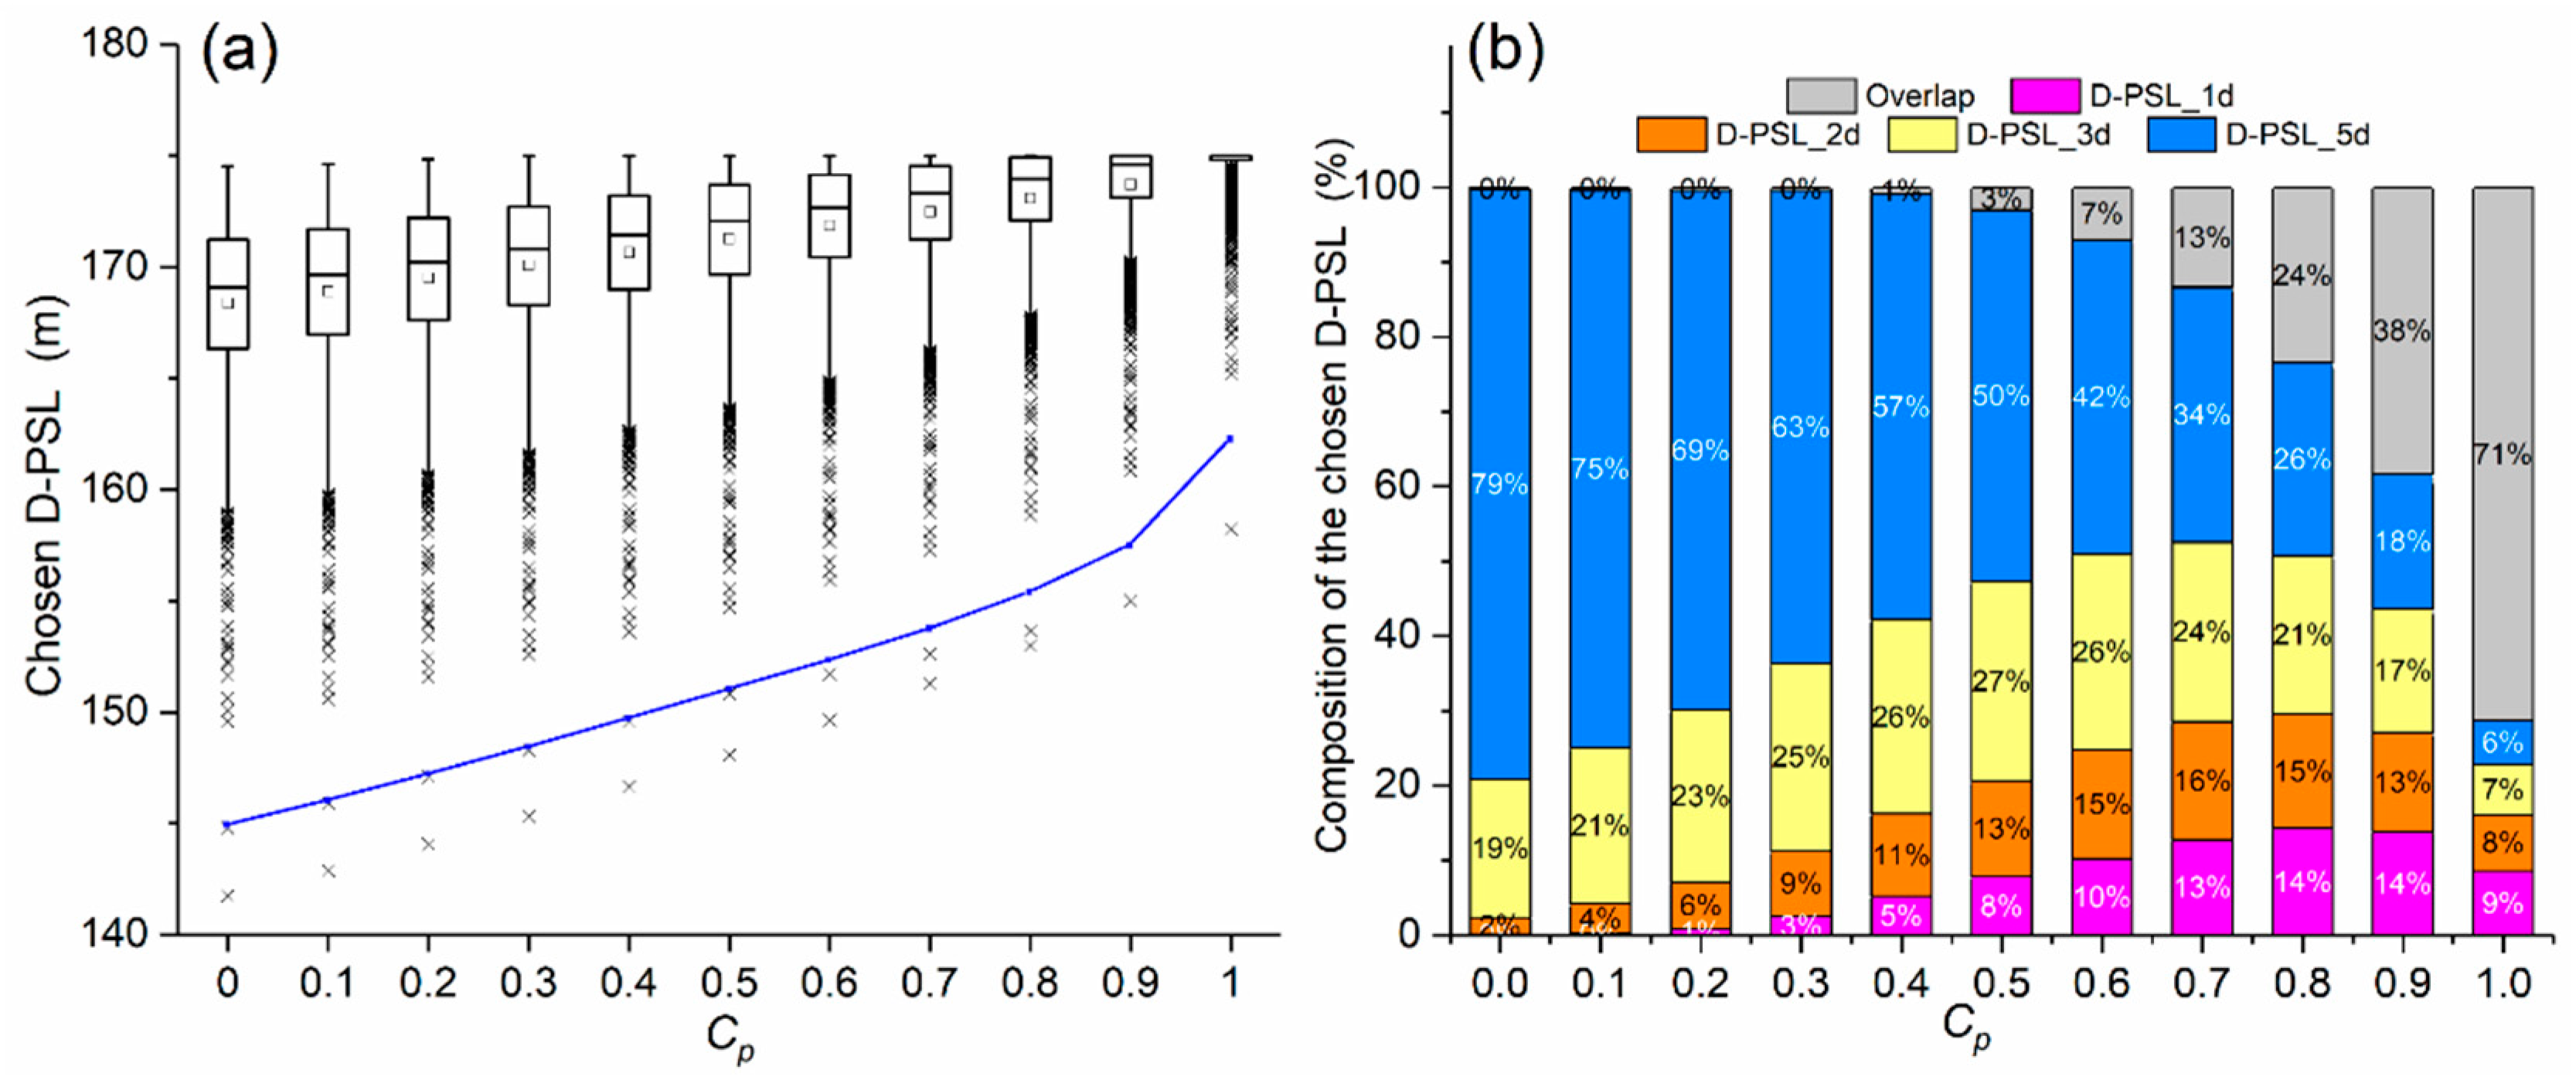
From Figure 5, it seems that the D-PSL5 d derived from the forecasted maximum 5 d flood volume is always the lowest compared to other shorter period results. However, the chosen D-PSL for any particular flood event may not always be D-PSL5 d. For each flood event, we can obtain D-PSL1 d, D-PSL2 d, D-PSL3 d, and D-PSL5 d from step 5 in Section 3.2. Figure 6a shows the chosen D-PSL, which is the minimum value among D-PSL1 d, D-PSL2 d, D-PSL3 d, and D-PSL5 d for each flood event. From Figure 6b, the chosen D-PSL is apparently a composition of D-PSLts from different periods. For results with low to medium forecast skill (), the chosen D-PSLs shown in Figure 6a look similar to the 5 day results shown in Figure 5d. As the forecast skill increases, the differences between chosen D-PSL and D-PSL5 d gradually emerge. For example, the first quantile under for D-PSL and D-PSL5 d are 174.15 m and 175.0 m, respectively. When comparing the percentage contribution of the choice of D-PSL from different periods for the 10,000 simulated forecast floods (Figure 6b), the difference is even clearer. When the forecast skill is low, values from D-PSL1 d are rarely chosen, and most of the values are from D-PSL5 d. Take for example, the D-PSL1 d contribution is only 3%, and this percentage is increased to 13% when . For a near-perfect forecast skill condition (), four different period D-PSLts share almost the same proportion, around 15%. In addition, 38% of the values are obtained from more than one period result (denoted as overlap in Figure 6b).
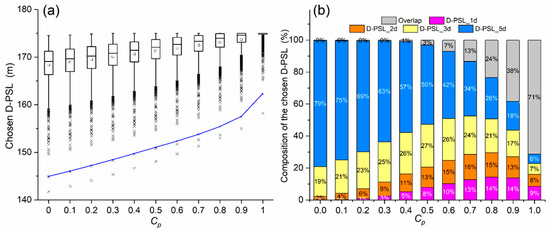
Figure 6.
(a) The chosen D-PSLs for 10,000 simulated forecast floods and (b) the percentage contribution of chosen D-PSL among D-PSL1 d, D-PSL2 d, D-PSL3 d, and D-PSL5 d for each flood event. The gray bar represents the proportion that there are at least two different period D- obtain the same D-PSL.
An interesting and important observation from Figure 6a is that when a design flood is expected, the chosen D-PSL under zero-forecast-skill conditions is 144.89 m, which is fairly close to the TGR designed FLWL 145 m. This suggests that the result obtained using the proposed methodology conforms to the primary TGR design flood control standard. However, as the forecast skill improves, this chosen D-PSL increases considerably. This water level can be as high as 162.21 m under perfect forecast conditions, indicating the necessity of dynamic water level control during the flood season, depending on the improvement of flood forecast accuracy. As compared to the previous research on TGR, Liu et al. [50] obtained a seasonal FLWL in the pre-flood season of 152.6 m, which is close to a medium forecast skill ; however, in the main flood season of lower than 145 m because the deviation of seasonal FLWL, in fact, does not consider real-time forecast information. Incorporating a 2 day inflow forecast and considering uncertainty, an upper boundary of DC-FLWL was 2.4 m higher than 145 m [19]; this is equivalent to a forecast skill of 3.5 (see blue line in Figure 6a).
3.3. Impact of Downstream Conveyance Capacity
The previous section assumes that reservoir release varies according to the downstream conveyance capacity. However, it is well-known that reservoir release has a direct impact on downstream safety. When reservoir release exceeds the downstream capacity, levee failure may occur. An increase or decrease in conveyance capacity usually originates from the enhancement or decaying of the downstream levee. Therefore, it is necessary to investigate the impact of downstream conveyance capacity on the choice of D-PSL. In this section, this effect is presented and analyzed.
To reduce the disturbance of forecast uncertainty, a moderate forecast skill () is employed. Twelve representative forecast flood groups were selected from 10,000 simulated floods at constant increment between flood volumes of 30.63 × 10⁸ m3 (F12) and 84.72 × 10⁸ m3 (F1) from the maximum 1 day flood volume forecast (Table 3). The maximum flood volume forecasted for the 2 day, 3 day and 5 day periods was subsequently determined.

Table 3.
Twelve selected representative forecast flood groups.
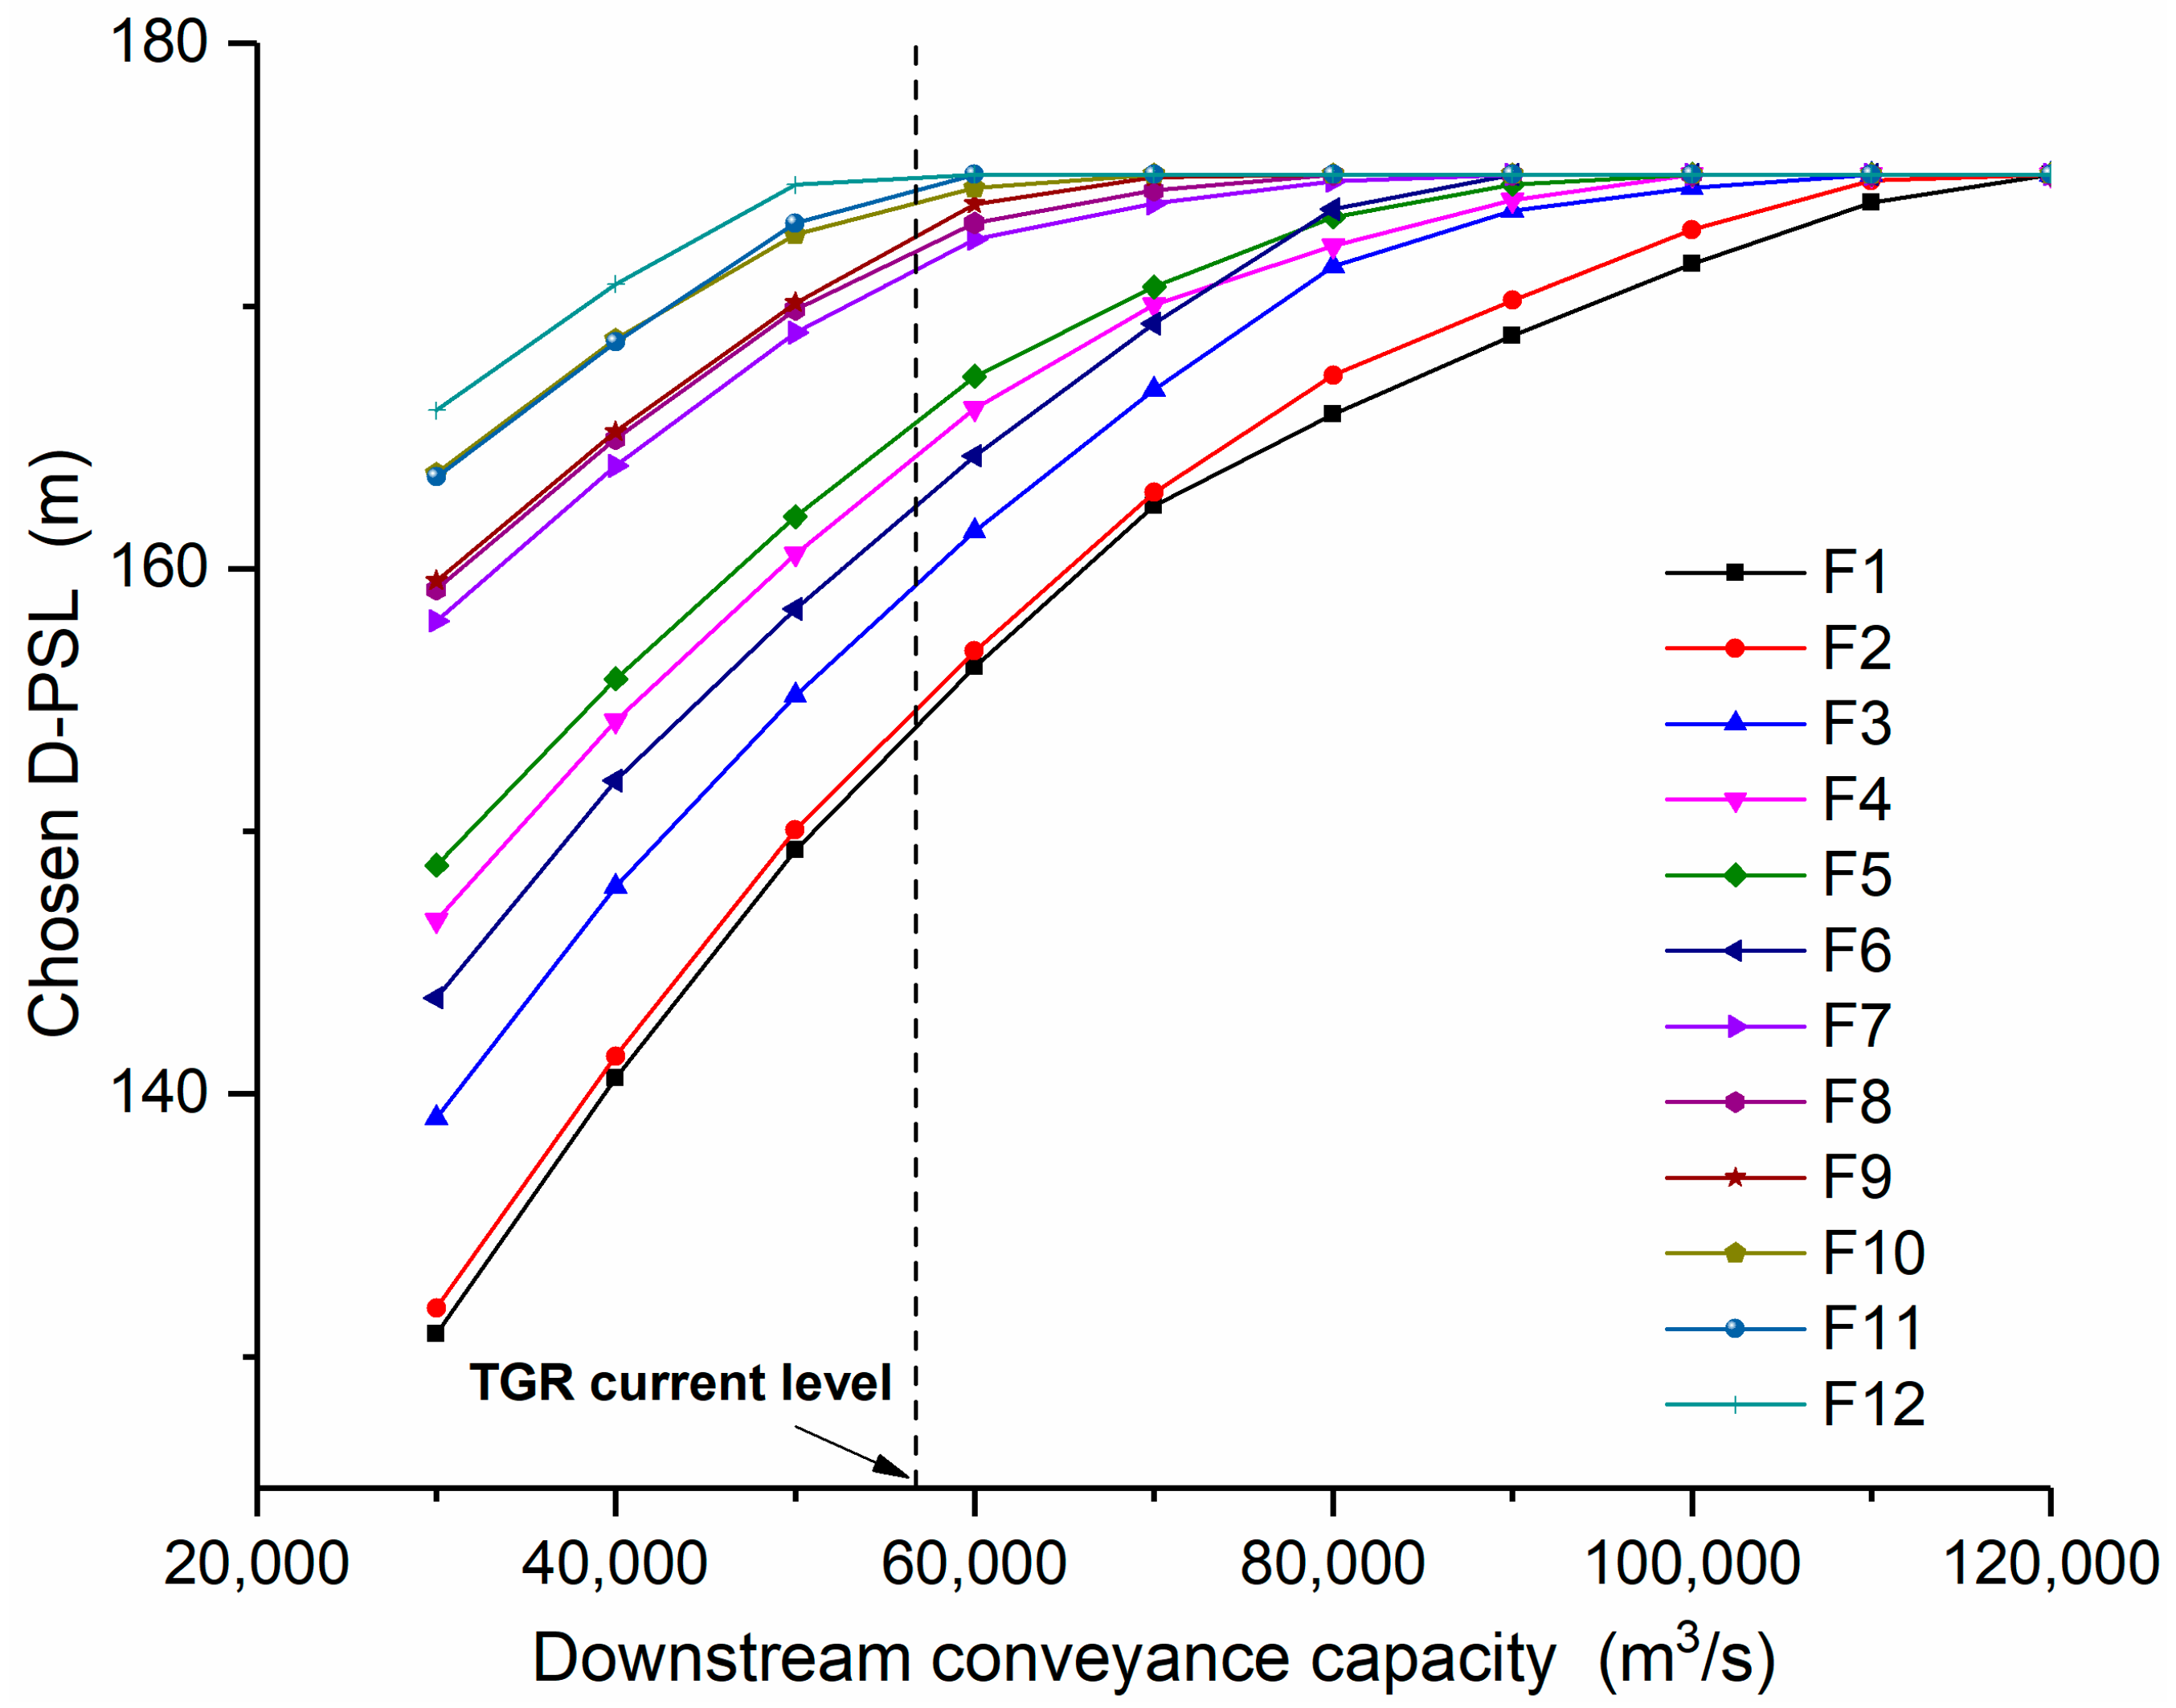
The D-PSLs results computed under the changing downstream conveyance capacity are shown in Figure 7. Here, the capacity is adjusted in the range (30,000, 120,000) m3/s, varying from half of primary as the minimum and twice as the maximum. Clearly, D-PSL tends to increase with the enlargement of downstream conveyance capacity. The convex relationship is determined by the nonlinear reservoir elevation-storage relationship. Although the 12 flood events are selected at a regular interval, the resultant D-PSLs do not increase by the same proportion as indicated by the gap between each of the lines shown in Figure 7. This is mainly due to the varying range among the maximum 5 day flood volume forecasts. For example, the water level for F1 almost coincides with that for F2 due to the small difference in the 5 day forecasts between these two (340.02 for F1 and 335.99 for F2); and, conversely, a large gap is found between F1-F6 and F7-F12 due to the large difference in 5 day forecasts among these two groups (minimum in F1-F6 is 256.68 and maximum in F7-F12 is 198.59). Furthermore, if focusing on the results between F4 and F6, we can find the D-PSL for F6 is lower than that for F4 when the downstream conveyance capacity is less than 70,000 m3/s, but when release exceeds this critical value, the opposite trend occurs. Generally, from Equation (7), it can be concluded that the capacity will only force linear changes of D-PSL. However, the intersection between the lines of F4 and F6 in Figure 7 suggests the downstream conveyance capacity can also “work” in other ways.
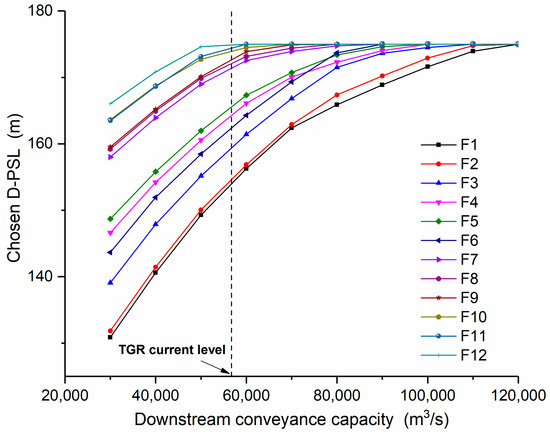
Figure 7.
The relationship between chosen D-PSL and downstream conveyance capacity () for 12 selected forecast floods under moderate forecast skill, the vertical dashed line represents the current TGR conveyance capacity of 56,700 m3/s.
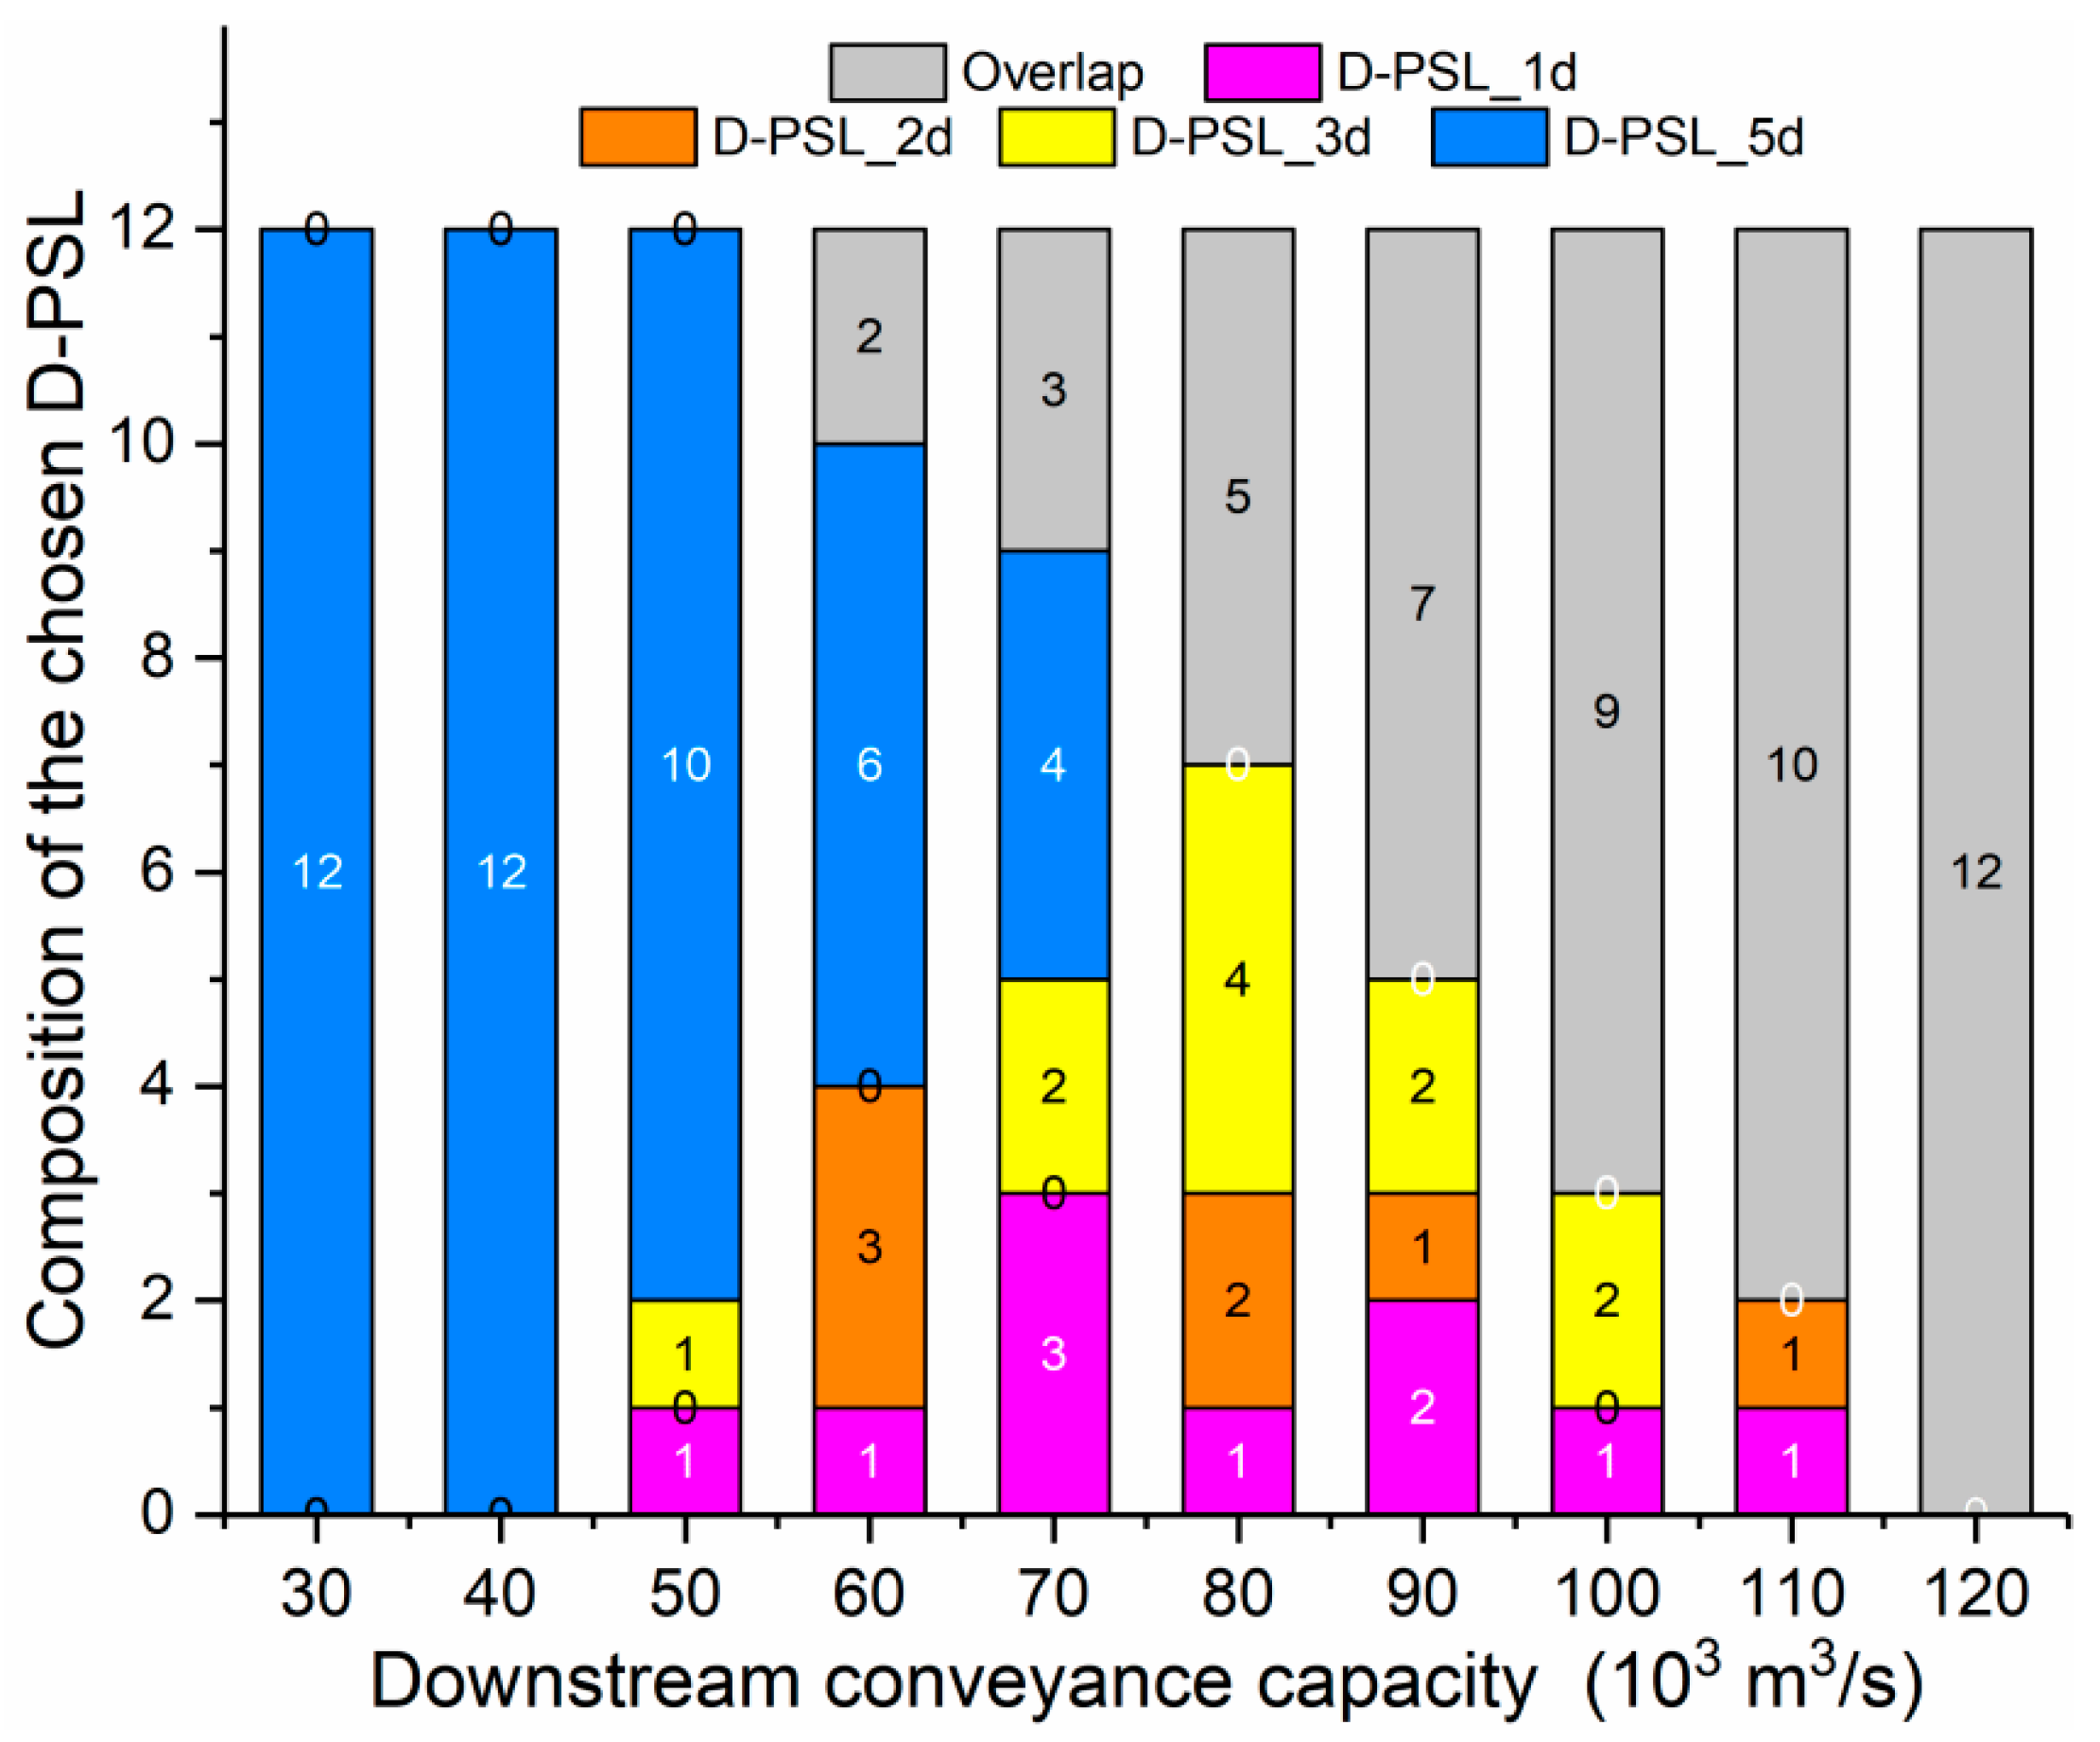
Section 3.2.2 has revealed that forecast skill can be one major factor that influences the choice of D-PSL from four different periods result. A similar plot under the impact of downstream conveyance capacity for the 12 selected floods is shown in Figure 8. When the capacity is less than 40,000 m3/s, all chosen D-PSLs for the 12 floods are equal to D-PSL5 d, which are the minimums compared to the results from the other three periods. However, with the increase of conveyance capacity, the proportion of D-PSL5 d reduces. If the reservoir release is large enough (≥120,000 m3/s), there is no need to empty any reservoir storage for flood control. Combining results from Figure 7, we could conclude that downstream conveyance capacity not only nearly linearly affects the calculation of D-PSL but also influences the choice of D-PSL among different periods result.
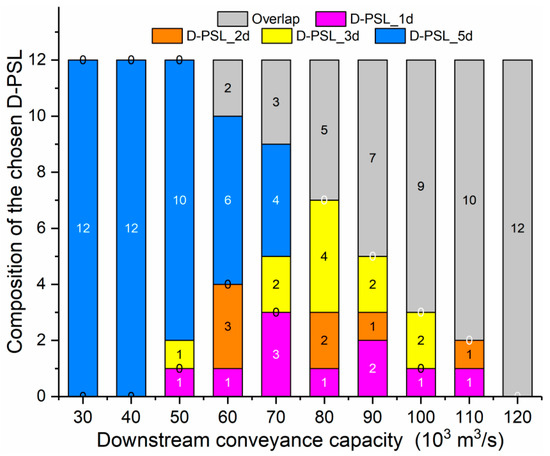
Figure 8.
The contribution, as notified by the numbers on the pillars, of chosen D-PSL from four different periods D-PSLts of 12 selected floods.
3.4. Impact of Reservoir Size
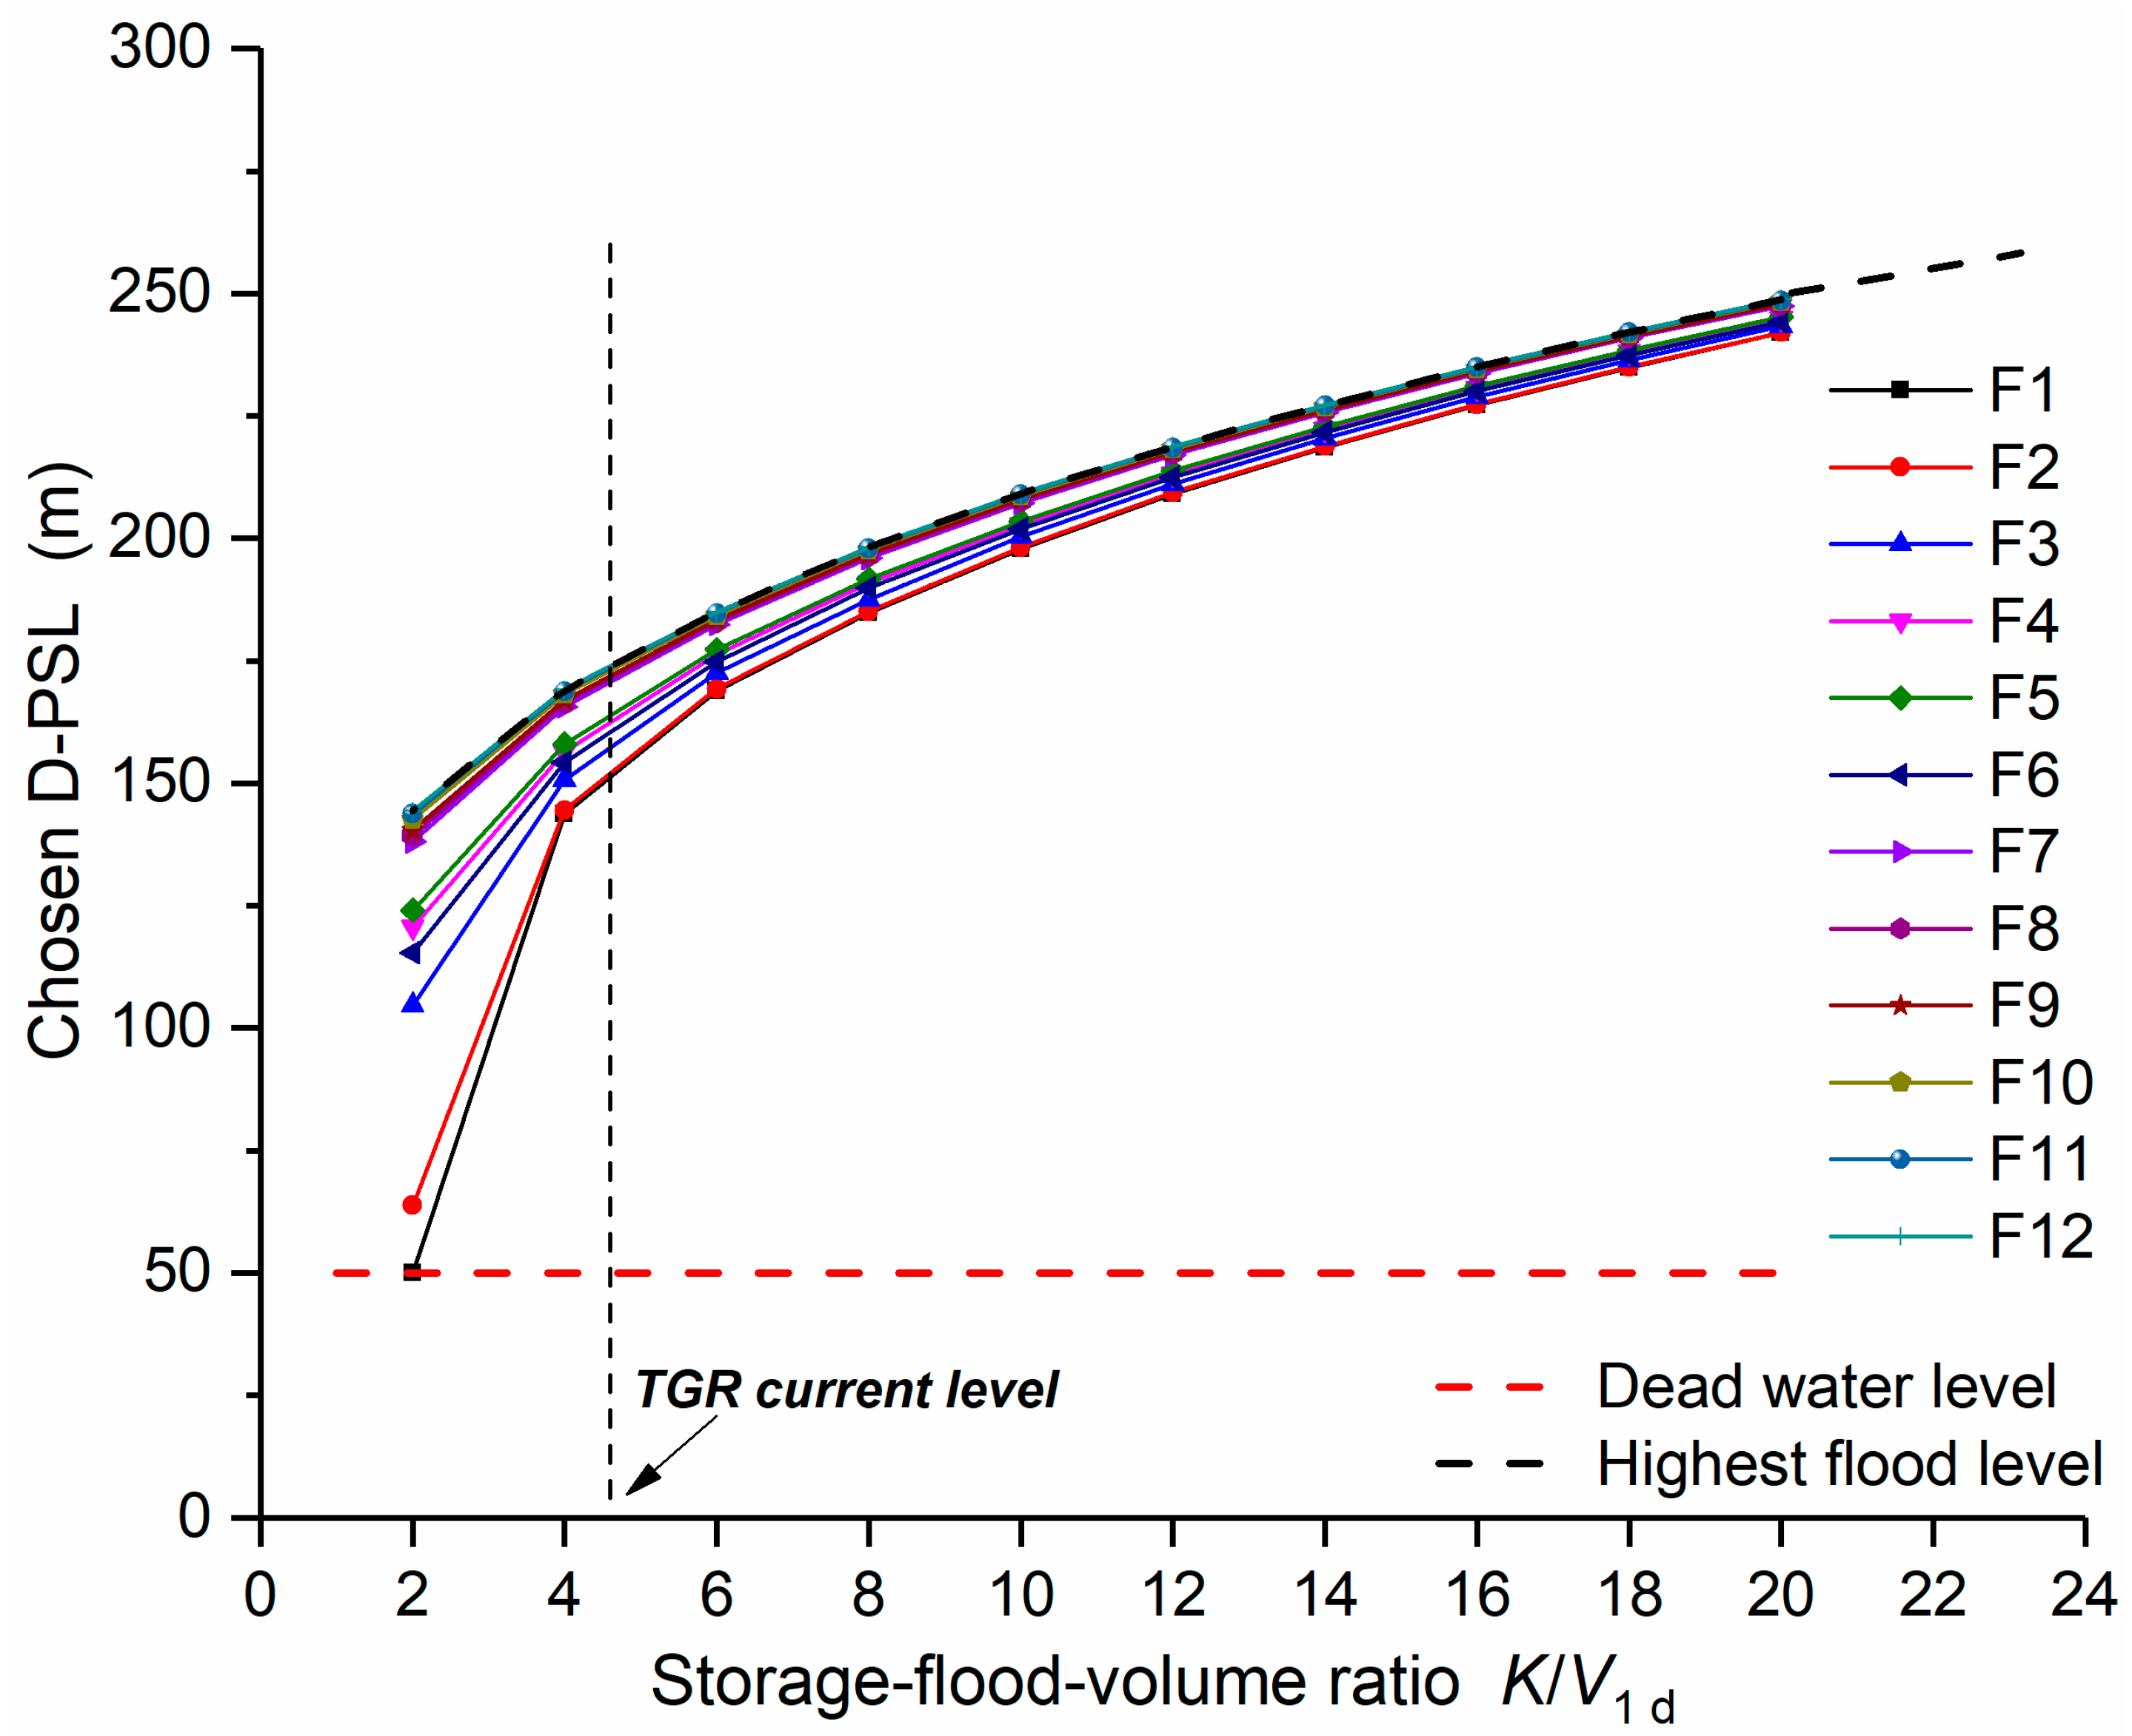
Focusing on reservoirs whose active storages are adequate to regulate flood peaks, this section discussed the impact of reservoir size on the calculation of forecast-skill-based D-PSL. It is compared using the same 12 forecast flood groups in Section 3.3. This effect can be specified using the capacity–flood-volume ratio, which is the reservoir capacity, , over design maximum 1 day flood volume, .
Figure 9 provides the relation between chosen D-PSL and capacity–flood-volume ratio, with the latter varying from 2 to 20. Increasing ratios of reservoir capacity over flood volume represent the ability of the system to store floodwater. Since is fixed at 83.9 × 10⁸ m3 according to Table 1, an increase in the capacity–flood-volume ratio, , renders larger reservoir storage capacity , namely higher highest flood level (i.e., equivalent to the 175 m in the current TGR design, shown as black dashed line in Figure 9). The reservoir elevation-storage curve is fitted to a three-order polynomial function. This allows for extrapolation of a reservoir level for a given reservoir storage capacity. Typically, the maximum capacity–flood-volume ratio ( = 20) stands for a storage capacity of 1678.0 × 108 m3, which contains a significant extrapolation from the current reservoir magnitude as well as the highest flood level, 248.7 m MSL. The dead water level and minimum level remain at TGR current values, i.e., 145 m and 50 m.
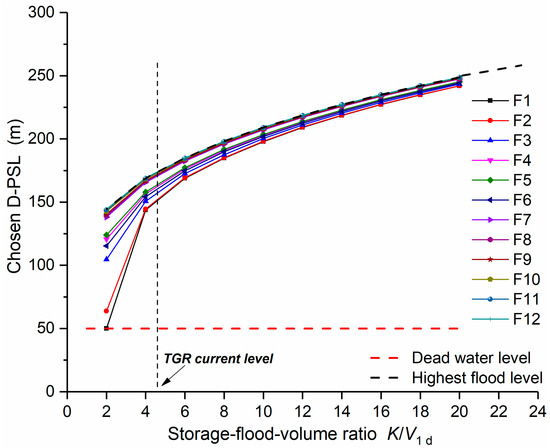
Figure 9.
The relationship between chosen D-PSL and reservoir capacity–flood-volume ratio () for 12 selected forecast floods under moderate forecast skill ( 0.5), the vertical dashed line represents the current TGR capacity–flood-volume ratio.
The results in Figure 9 illustrate that the D-PSLs tend to increase with the capacity–flood-volume ratio, while differences between 12 floods tend to be converged. Recalling Equation (7), these positive correlations and convergent effects are simply due to the change of reservoir storage capacity and nonlinear elevation-storage relationship. Focusing on the case approach of the design flood (F1, black scatter line in Figure 9), the chosen D-PSL is found so high as to be close to the highest flood level (black dashed line) when the capacity–flood-volume ratio is high (e.g., 20). When the capacity–flood-volume ratio decreases to 2, the D-PSL is found as low as a minimum level of 50 m. This means that reservoir should be emptying before the 1000 year design magnitude flood. However, this is unrealistic because of the requirement of reservoir refill and economic benefits. Therefore, this suggests that there is a lower limit of a capacity–flood-volume ratio where the D-PSL volume is no longer applicable. The reservoir size is positively correlated with the ability to cope with floods. The larger the reservoir capacity, the greater the level of flood regulation. If small, the occurrence of large floods would result in reservoir failure, and then the joint flood control of cascade reservoirs becomes especially important.
4. Discussion
4.1. Relationship between D-PSL and Limit Operation Water Level
In practice, D-PSL is affected by the forecast skill and magnitude of the incoming flood, and it, in turn, affects the volume of reservoir pre-release during the pre-release period. Considering the limitation of reservoir pre-release capacity, there should be an upper boundary of reservoir operating water level at the beginning of flood forecast and in the non-storm period, as well (denoted as limit operation water level, shown in Figure 1). The D-PSL is lowest when the forecast skill is zero and highest when the forecast skill is perfect. The D-PSL is high when the magnitude of the forecasted incoming flood is low and vice versa. Therefore, the limit operation water level at the beginning of flood forecasts must be kept sufficiently low to ensure that the water level can be lowered to any required D-PSL at the end of the pre-release period. However, regardless of the magnitude of the forecasted incoming flood, it is of primary importance that there is sufficient reservoir capacity to cope with the design flood. Hence, the limit operation water level is bounded by reservoir pre-release capacity, forecast skill, forecast lead-time for pre-release operation, and the magnitude of the design flood.
4.2. Application of the Dynamic Pre-Storm Flood Control Operation Strategy
Regardless of the forecast lead-time, one simplest and most conservative way is to let the limit operation water level equals to the D-PSL derived from the design flood (i.e., the blue line in Figure 6a). Although it can be set to a higher level considering the forecast lead time for pre-release operation theoretically. In this case, the forecast skill triggers the various option of limit operation water level as well as D-PSL. With a stable forecast skill of the reservoir forecast product, we can keep the reservoir operating at the limit operation water level when no flood is forecasted; otherwise, decrease, if low, to the obtained D-PSL when a flood is about to occur.
In comparison to the typical flood-control operation strategies shown in Figure 1, the limit operation water level coincides with FLWL only when both forecast skill and forecast lead-time are zero (i.e., conventional FLWL strategy). Given the existence of forecast lead-time, the limit operation water level becomes the upper boundary of dynamic control bound if fix D-PSL at FLWL (i.e., DC-FLWL strategy). Yet, in the proposed strategy, the D-PSL is relevant with forecast skill, suggesting an even higher limit operation water level is possible as long as the forecast skill is reliable. This strategy not only provides a degree of freedom of reservoir water level in the flood regulation period by using D-PSL but also allows reservoirs to operate at higher levels in non-storm periods by adopting limited operation water levels. This limited operation water level is obviously beneficial for day-to day hydropower, irrigation and other economic operation while not adding any flooding cost other than the design level.
The calculation of D-PSL is a volume-based method, in which the maximum one, two-, three- and five day flood volumes are considered (Equation (8)). However, the shape of a flood hydrograph is a random event, which usually occurs in various combinations of flood peak, volume, and duration [51,52]. A river may have various patterns that are above critical streamflow for one, two, three, or five or more days. The factors that affect the flood hydrograph include, but are not limited to, drainage shape and area, slope and density of stream, soil moisture, type of precipitation, amount of upstream regulation [53,54]. Flood forecast longer than five days would no doubt be operationally useful. We adopted maximum flood volumes within five days because the progressively worse regression fits for longer duration [55] and the relatively small flood volume for rest days.
In case of a significant overestimation in forecast skill, a rolling evaluation of forecast skill is recommended. The skill of forecast a product is first determined from its historical performance and then kept reevaluating in the real-time flood forecasts. The proposed flood-control operation strategy is only adopted if the forecast skill stays consistent throughout the operation. Once the forecast product performs abnormally, this strategy should be terminated immediately, and reservoir water level must be lowered to the designed FLWL on safety grounds. Here, the utilization of the forecast skill stability as triggers for starting or ending the proposed dynamic flood-control operation strategy, but the information used for real-time forecast skill evaluation as well as triggering mechanisms remains a subject for further research.
5. Conclusions
Contemporary reservoir operations often must balance the risk of downstream flooding, environmental impacts and economic benefits. During flood seasons, the effectiveness of flood-control operation often relies on the accurate determination of the annual static flood-limited water level (FLWL) or improved dynamic control of FLWL. The current state-of-the-art method dictates that the designed FLWL should not be exceeded unless a relatively large flood is forecasted. This approach ignores the flood forecast skill and flood exceedance probability of such event. In this study, a new concept of dynamic FLWL (dynamic pre-storm level, D-PSL) is proposed and critically evaluated using the Three Gorges Reservoir as an example. The D-PSL is based on the forecast flood magnitude, the skill of forecast, and reservoir dynamic design-flood probability represented by the exceedance probability of forecast error.
The results show that D-PSL performs the same as traditional FLWL when the forecast skill is unknown or poor and increases considerably with increasing forecast skill. This demonstrates that D-PSL can be used in conjunction with FLWL without increasing the risk of flooding. By suitably relaxing the pre-storm release, D-PSL maximizes the excess reservoir storage, ensuring that the flood-control operation is both effective and economical. Moreover, for a particular flood event, D-PSL can be determined by flood forecasts of multiple time periods. That is, when forecast skill is low, most of the chosen D-PSL are from D-PSL5 d; with the increase of forecast skill, the contribution of different period D-PSLts becomes a lot closer. In addition, an important parameter to consider when using this method is the reservoir size. A lower limit of capacity-flood-volume ratio is the governing criteria in smaller reservoirs. It must be stressed that the application of the dynamic pre-storm flood-control operation strategy leads to a closer linkage with the current flood-control operation strategies. When both forecast skill and forecast lead-time are zero, the conventional FLWL strategy is adopted but reverted to DC-FLWL strategy when fixing D-PSL at FLWL. Thus, the proposed strategy not just provides a degree of freedom of reservoir water level in the storm-control period but also allows reservoir operating at higher levels in non-storm period by adopting limited operation water level. It is expected that such a strategy is beneficial for day-to-day economic reservoir operations.
Author Contributions
Conceptualization, W.W. and J.Z.; methodology and formal analysis, W.W. and M.W; data resources, X.L. and C.W.; Writing—Original draft preparation, W.W., M.W. and S.-T.K. All authors provided critical feedback and helped shape the manuscript. All authors have read and agreed to the published version of the manuscript.
Funding
This research was funded by the National Key Research and Development Program of China (2017YFC0404403), the National Natural Science Foundation of China (51909035, U2040206, 91747208, and 51861125102), and the State Key Laboratory of Hydroscience and Engineering-Tsinghua (grant number 2019-KY-01).
Institutional Review Board Statement
Not applicable.
Informed Consent Statement
Not applicable.
Data Availability Statement
The data used in this study are partly available for non-commercial use at https://doi.org/10.6084/m9.figshare.13440095.
Conflicts of Interest
The authors declare no conflict of interest.
References
- Stedinger, J.R. Expected Probability and Annual Damage Estimators. J. Water Res. Plan. Manag. 1997, 123, 125–135. [Google Scholar] [CrossRef]
- Loucks, D.P.; Van Beek, E.; Stedinger, J.R.; Dijkman, J.P.; Villars, M.T. Water Resources Systems Planning and Management: An Introduction to Methods, Models and Applications; UNESCO: Paris, France, 2005. [Google Scholar]
- Hirsch, R.M. A Perspective on Nonstationarity and Water Management. J. Am. Water Resour. Assoc. 2011, 47, 436–446. [Google Scholar] [CrossRef]
- Milly, P.; Betancourt, J.; Falkenmark, M.; Hirsch, R.M.; Kundzewicz, Z.W.; Lettenmaier, D.P.; Stouffer, R.J. Stationarity Is Dead: Whither Water Management? Science 2008, 4, 20. [Google Scholar] [CrossRef] [PubMed]
- Zhao, T.; Zhao, J. Joint and respective effects of long- and short-term forecast uncertainties on reservoir operations. J. Hydrol. 2014, 517, 83–94. [Google Scholar] [CrossRef]
- García-Pintado, J.; Mason, D.C.; Dance, S.L.; Cloke, H.L.; Neal, J.C.; Freer, J.; Bates, P.D. Satellite-supported flood forecasting in river networks: A real case study. J. Hydrol. 2015, 523, 706–724. [Google Scholar] [CrossRef]
- Shiri, J.; KïSï, O. Short-term and long-term streamflow forecasting using a wavelet and neuro-fuzzy conjunction model. J. Hydrol. 2010, 394, 486–493. [Google Scholar] [CrossRef]
- Maurer, E.P.; Lettenmaier, D.P. Potential Effects of Long-Lead Hydrologic Predictability on Missouri River Main-Stem Reservoirs. J. Clim. 2004, 17, 174–186. [Google Scholar] [CrossRef]
- Anghileri, D.; Voisin, N.; Castelletti, A.; Pianosi, F.; Nijssen, B.; Lettenmaier, D.P. Value of long-term streamflow forecasts to reservoir operations for water supply in snow-dominated river catchments. Water Resour. Res. 2016, 52, 4209–4225. [Google Scholar] [CrossRef]
- Raso, L.; Schwanenberg, D.; Giesen, N.C.V.D.; Overloop, P.J.V. Short-term optimal operation of water systems using ensemble forecasts. Adv. Water Resour. 2014, 71, 200–208. [Google Scholar] [CrossRef]
- Valeriano, O.C.S.; Koike, T.; Yang, K.; Graf, T.; Xin, L.; Lei, W.; Han, X. Decision support for dam release during floods using a distributed biosphere hydrological model driven by quantitative precipitation forecasts. Water Resour. Res. 2010, 46, W10544. [Google Scholar]
- Georgakakos, A.P.; Yao, H.; Kistenmacher, M.; Georgakakos, K.P.; Graham, N.E.; Cheng, F.Y.; Spencer, C.; Shamir, E. Value of adaptive water resources management in Northern California under climatic variability and change: Reservoir management. J. Hydrol. 2012, 412, 34–46. [Google Scholar] [CrossRef]
- Schwanenberg, D.; Fan, F.M.; Naumann, S.; Kuwajima, J.I.; Montero, R.A.; Dos Reis, A.A. Short-term reservoir optimization for flood mitigation under meteorological and hydrological forecast uncertainty. Water Resour. Manag. 2015, 29, 1635–1651. [Google Scholar] [CrossRef]
- Pianosi, F.; Soncini Sessa, R. Real-time management of a multipurpose water reservoir with a heteroscedastic inflow model. Water Resour. Res. 2009, 45. [Google Scholar] [CrossRef]
- Hsu, N.S.; Wei, C.C. A multipurpose reservoir real-time operation model for flood control during typhoon invasion. J. Hydrol. 2007, 336, 282–293. [Google Scholar] [CrossRef]
- Yan, B.; Guo, S.; Chen, L. Estimation of reservoir flood control operation risks with considering inflow forecasting errors. Stoch. Environ. Res. Risk Assess. 2014, 28, 359–368. [Google Scholar] [CrossRef]
- Faber, B. Forecast-based flood control operation at Folsom reservoir using advance release. In Proceedings of the Using Precipitation and Pineapple Express Forecasts to Operate Folsom Dam and Reservoir, Rocklin, CA, USA, 22 June 2001. [Google Scholar]
- Chou, N.F.; Wu, C.W. Expected shortage based pre-release strategy for reservoir flood control. J. Hydrol. 2013, 497, 1–14. [Google Scholar] [CrossRef]
- Li, X.; Guo, S.; Liu, P.; Chen, G. Dynamic control of flood limited water level for reservoir operation by considering inflow uncertainty. J. Hydrol. 2010, 391, 124–132. [Google Scholar] [CrossRef]
- Zhou, Y.; Guo, S.; Liu, P.; Xu, C. Joint operation and dynamic control of flood limiting water levels for mixed cascade reservoir systems. J. Hydrol. 2014, 519, 248–257. [Google Scholar] [CrossRef]
- Zhao, T.; Zhao, J.; Lund, J.R.; Yang, D. Optimal Hedging Rules for Reservoir Flood Operation from Forecast Uncertainties. J. Water Res. Plan. Manag. 2014, 140, 4014041. [Google Scholar] [CrossRef]
- Hui, R.; Lund, J.; Zhao, J.; Zhao, T. Optimal Pre-storm Flood Hedging Releases for a Single Reservoir. Water Resour. Manag. 2016, 30, 5113–5129. [Google Scholar] [CrossRef]
- Ding, W.; Zhang, C.; Peng, Y.; Zeng, R.; Zhou, H.; Cai, X. An analytical framework for flood water conservation considering forecast uncertainty and acceptable risk. Water Resour. Res. 2015, 51, 4702–4726. [Google Scholar] [CrossRef]
- Ding, W.; Zhang, C.; Cai, X.; Li, Y.; Zhou, H. Multiobjective hedging rules for flood water conservation. Water Resour. Res. 2017, 53, 1963–1981. [Google Scholar] [CrossRef]
- Zhao, T.; Cai, X.; Yang, D. Effect of streamflow forecast uncertainty on real-time reservoir operation. Adv. Water Resour. 2011, 34, 495–504. [Google Scholar] [CrossRef]
- Boucher, M.A.; Tremblay, D.; Delorme, L.; Perreault, L.; Anctil, F. Hydro-economic assessment of hydrological forecasting systems. J. Hydrol. 2012, 416, 133–144. [Google Scholar] [CrossRef]
- Galelli, S.; Goedbloed, A.; Schwanenberg, D.; Overloop, P.J.V. Optimal Real-Time Operation of Multipurpose Urban Reservoirs: Case Study in Singapore. J. Water Res. Plan. Manag. 2014, 140, 511–523. [Google Scholar] [CrossRef]
- Lettenmaier, D.P. Synthetic Streamflow Forecast Generation. J. Hydraul. Eng. 1984, 110, 277–289. [Google Scholar] [CrossRef]
- Connaughton, J.; King, N.; Dong, L.; Ji, P.; Lund, J. Comparing Simple Flood Reservoir Operation Rules. Water 2014, 6, 2717–2731. [Google Scholar] [CrossRef]
- Jiang, Z.; Sun, P.; Ji, C.; Zhou, J. Credibility theory based dynamic control bound optimization for reservoir flood limited water level. J. Hydrol. 2015, 529, 928–939. [Google Scholar] [CrossRef]
- Tan, Q.; Wang, X.; Liu, P.; Lei, X.; Cai, S.; Wang, H.; Ji, Y. The dynamic control bound of flood limited water level considering capacity compensation regulation and flood spatial pattern uncertainty. Water Resour. Manag. 2017, 31, 143–158. [Google Scholar] [CrossRef]
- Bobée, B.; Cavadias, G.; Ashkar, F.; Bernier, J.; Rasmussen, P. Towards a systematic approach to comparing distributions used in flood frequency analysis. J. Hydrol. 1993, 142, 121–136. [Google Scholar] [CrossRef]
- Maurer, E.P. Predictability of seasonal runoff in the Mississippi River basin. J. Geophys. Res. Atmos. 2003, 108, D16. [Google Scholar] [CrossRef]
- Shukla, S.; Lettenmaier, D.P. Seasonal hydrologic prediction in the United States: Understanding the role of initial hydrologic conditions and seasonal climate forecast skill. Hydrol. Earth Syst. Sci. 2011, 15, 3529–3538. [Google Scholar] [CrossRef]
- Shi, X.; Wood, A.W.; Lettenmaier, D.P. How Essential is Hydrologic Model Calibration to Seasonal Streamflow Forecasting? J. Hydrometeorol. 2008, 9, 1350–1363. [Google Scholar] [CrossRef]
- Khaliq, M.N.; Ouarda, T.B.M.J.; Ondo, J.C.; Gachon, P.; Bobée, B. Frequency analysis of a sequence of dependent and/or non-stationary hydro-meteorological observations: A review. J. Hydrol. 2006, 329, 534–552. [Google Scholar] [CrossRef]
- Romanescu, G.; Stoleriu, C.; Romanescu, A.M. Water reservoirs and the risk of accidental flood occurrence. Case study: Stanca-Costesti reservoir and the historical floods of the Prut river in the period July–August 2008, Romania. Hydrol. Process. 2011, 25, 2056–2070. [Google Scholar] [CrossRef]
- Vicuna, S.; Dracup, J.A.; Lund, J.R.; Dale, L.L.; Maurer, E.P. Basin-scale water system operations with uncertain future climate conditions: Methodology and case studies. Water Resour. Res. 2010, 46. [Google Scholar] [CrossRef]
- Zhao, T.; Zhao, J. Forecast-skill-based simulation of streamflow forecasts. Adv. Water Resour. 2014, 71, 55–64. [Google Scholar] [CrossRef]
- Jiang, S.H.; Fan, Z.W. Risk analysis for flood control operation of reservoir. J. Hydraul. Eng. 2004, 35, 102–107. [Google Scholar]
- Kelly, K.S.; Krzysztofowicz, R. A bivariate meta-Gaussian density for use in hydrology. Stoch. Hydrol. Hydraul. 1997, 11, 17–31. [Google Scholar] [CrossRef]
- Montanari, A. Deseasonalisation of hydrological time series through the normal quantile transform. J. Hydrol. 2005, 313, 274–282. [Google Scholar] [CrossRef]
- Singh, V.P.; Chow, V.T. Handbook of Applied Hydrology, 2nd ed.; Mcgraw-Hill Education: New York, NY, USA, 2016. [Google Scholar]
- Markar, M.S.; Clark, S.Q.; Min, Y.; Jing, Z. Evaluation of hydrologic and hydraulic models for real-time flood forecasting use in the Yangtze River catchment. Australas. J. Water Resour. 2006, 10, 93–102. [Google Scholar] [CrossRef]
- Guo, S.; Li, X.; Liu, X.; Dai, M. Key Technologies for the Dyamic Control of the Flood Limited Water Level of Three Gorges Reservoir; China Water and Power Press: Beijing, China, 2011. [Google Scholar]
- Wang, Y.C.; Yoshitani, J.; Fukami, K. Stochastic multiobjective optimization of reservoirs in parallel. Hydrol. Process. 2005, 19, 3551–3567. [Google Scholar] [CrossRef]
- Turgeon, A. Solving a stochastic reservoir management problem with multilag autocorrelated inflows. Water Resour. Res. 2005, 41. [Google Scholar] [CrossRef]
- Sharma, A.; Tarboton, D.G.; Lall, U. Streamflow simulation: A nonparametric approach. Water Resour. Res. 1997, 2, 291–308. [Google Scholar] [CrossRef]
- Chiu, C. Stochastic methods in hydraulics and hydrology of streamflow. Geophys. Surv. 1972, 1, 61–84. [Google Scholar] [CrossRef]
- Liu, P.; Li, L.; Guo, S.; Xiong, L.; Zhang, W.; Zhang, J.; Xu, C. Optimal design of seasonal flood limited water levels and its application for the Three Gorges Reservoir. J. Hydrol. 2015, 527, 1045–1053. [Google Scholar] [CrossRef]
- Grimaldi, S.; Serinaldi, F. Asymmetric copula in multivariate flood frequency analysis. Adv. Water Resour. 2006, 29, 1155–1167. [Google Scholar] [CrossRef]
- Yue, S.; Ouarda, T.B.; Bobée, B.; Legendre, P.; Bruneau, P. Approach for describing statistical properties of flood hydrograph. J. Hydrol. Eng. 2002, 7, 147–153. [Google Scholar] [CrossRef]
- Dingman, S.L. Drainage density and streamflow: A closer look. Water Resour. Res. 1978, 14, 1183–1187. [Google Scholar] [CrossRef]
- Nash, J.E. Systematic determination of unit hydrograph parameters. J. Geophys. Res. Atmos. 1959, 64, 111–115. [Google Scholar] [CrossRef]
- Swain, R.E.; England, J.F.; Bullard, K.L.; Raff, D.A. Guidelines for Evaluating Hydrologic Hazards; US Department of the Interior, Bureau of Reclamation: Washington, DC, USA, 2006. [Google Scholar]
Publisher’s Note: MDPI stays neutral with regard to jurisdictional claims in published maps and institutional affiliations. |
© 2021 by the authors. Licensee MDPI, Basel, Switzerland. This article is an open access article distributed under the terms and conditions of the Creative Commons Attribution (CC BY) license (http://creativecommons.org/licenses/by/4.0/).

