Abstract
To study the temporal and spatial variations of the groundwater quantity and quality in response to intensive groundwater exploitation from the Quaternary aquifer in UAE, a water budget model with a cell size of one km2 was developed. The available historical records of groundwater levels and salinity have been used to develop the water table and salinity maps of UAE for the years 1969, 2005, 2010, and 2015. The available water resources and soil information system was used to facilitate validity, cogency, and consistency of the groundwater analysis. The spatial analysis module of GIS was used to define the aquifer setting, saturated thickness, aquifer base elevation, effective porosity, and groundwater salinity at each grid cell. The obtained results indicated that the volume of fresh groundwater resources in the Quaternary aquifer in UAE has decreased from 238 km3 in 1969 to around 10 km3 in 2015. A major part of these depleted fresh groundwater resources was replaced by brackish water, and, therefore, the total groundwater storage in this aquifer has only decreased from 977 in 1969 to 922 km3 in 2015, respectively. If the same groundwater exploitation continues, the freshwater storage in the surficial aquifer might be totally depleted in agricultural areas. Most probably, the brackish groundwater resources will be exploited. In such areas, more attention should be devoted to the management of brackish water resources to avoid the exacerbation of the saltwater intrusion problem. Despite the fact that the obtained results indicate the negative impacts of the improper water resources management in a small part of the arid area, the learned lessons are valid for other arid countries, in particular, using the proper steady state boundary conditions for the initial conditions in modeling the available future management alternatives.
1. Introduction
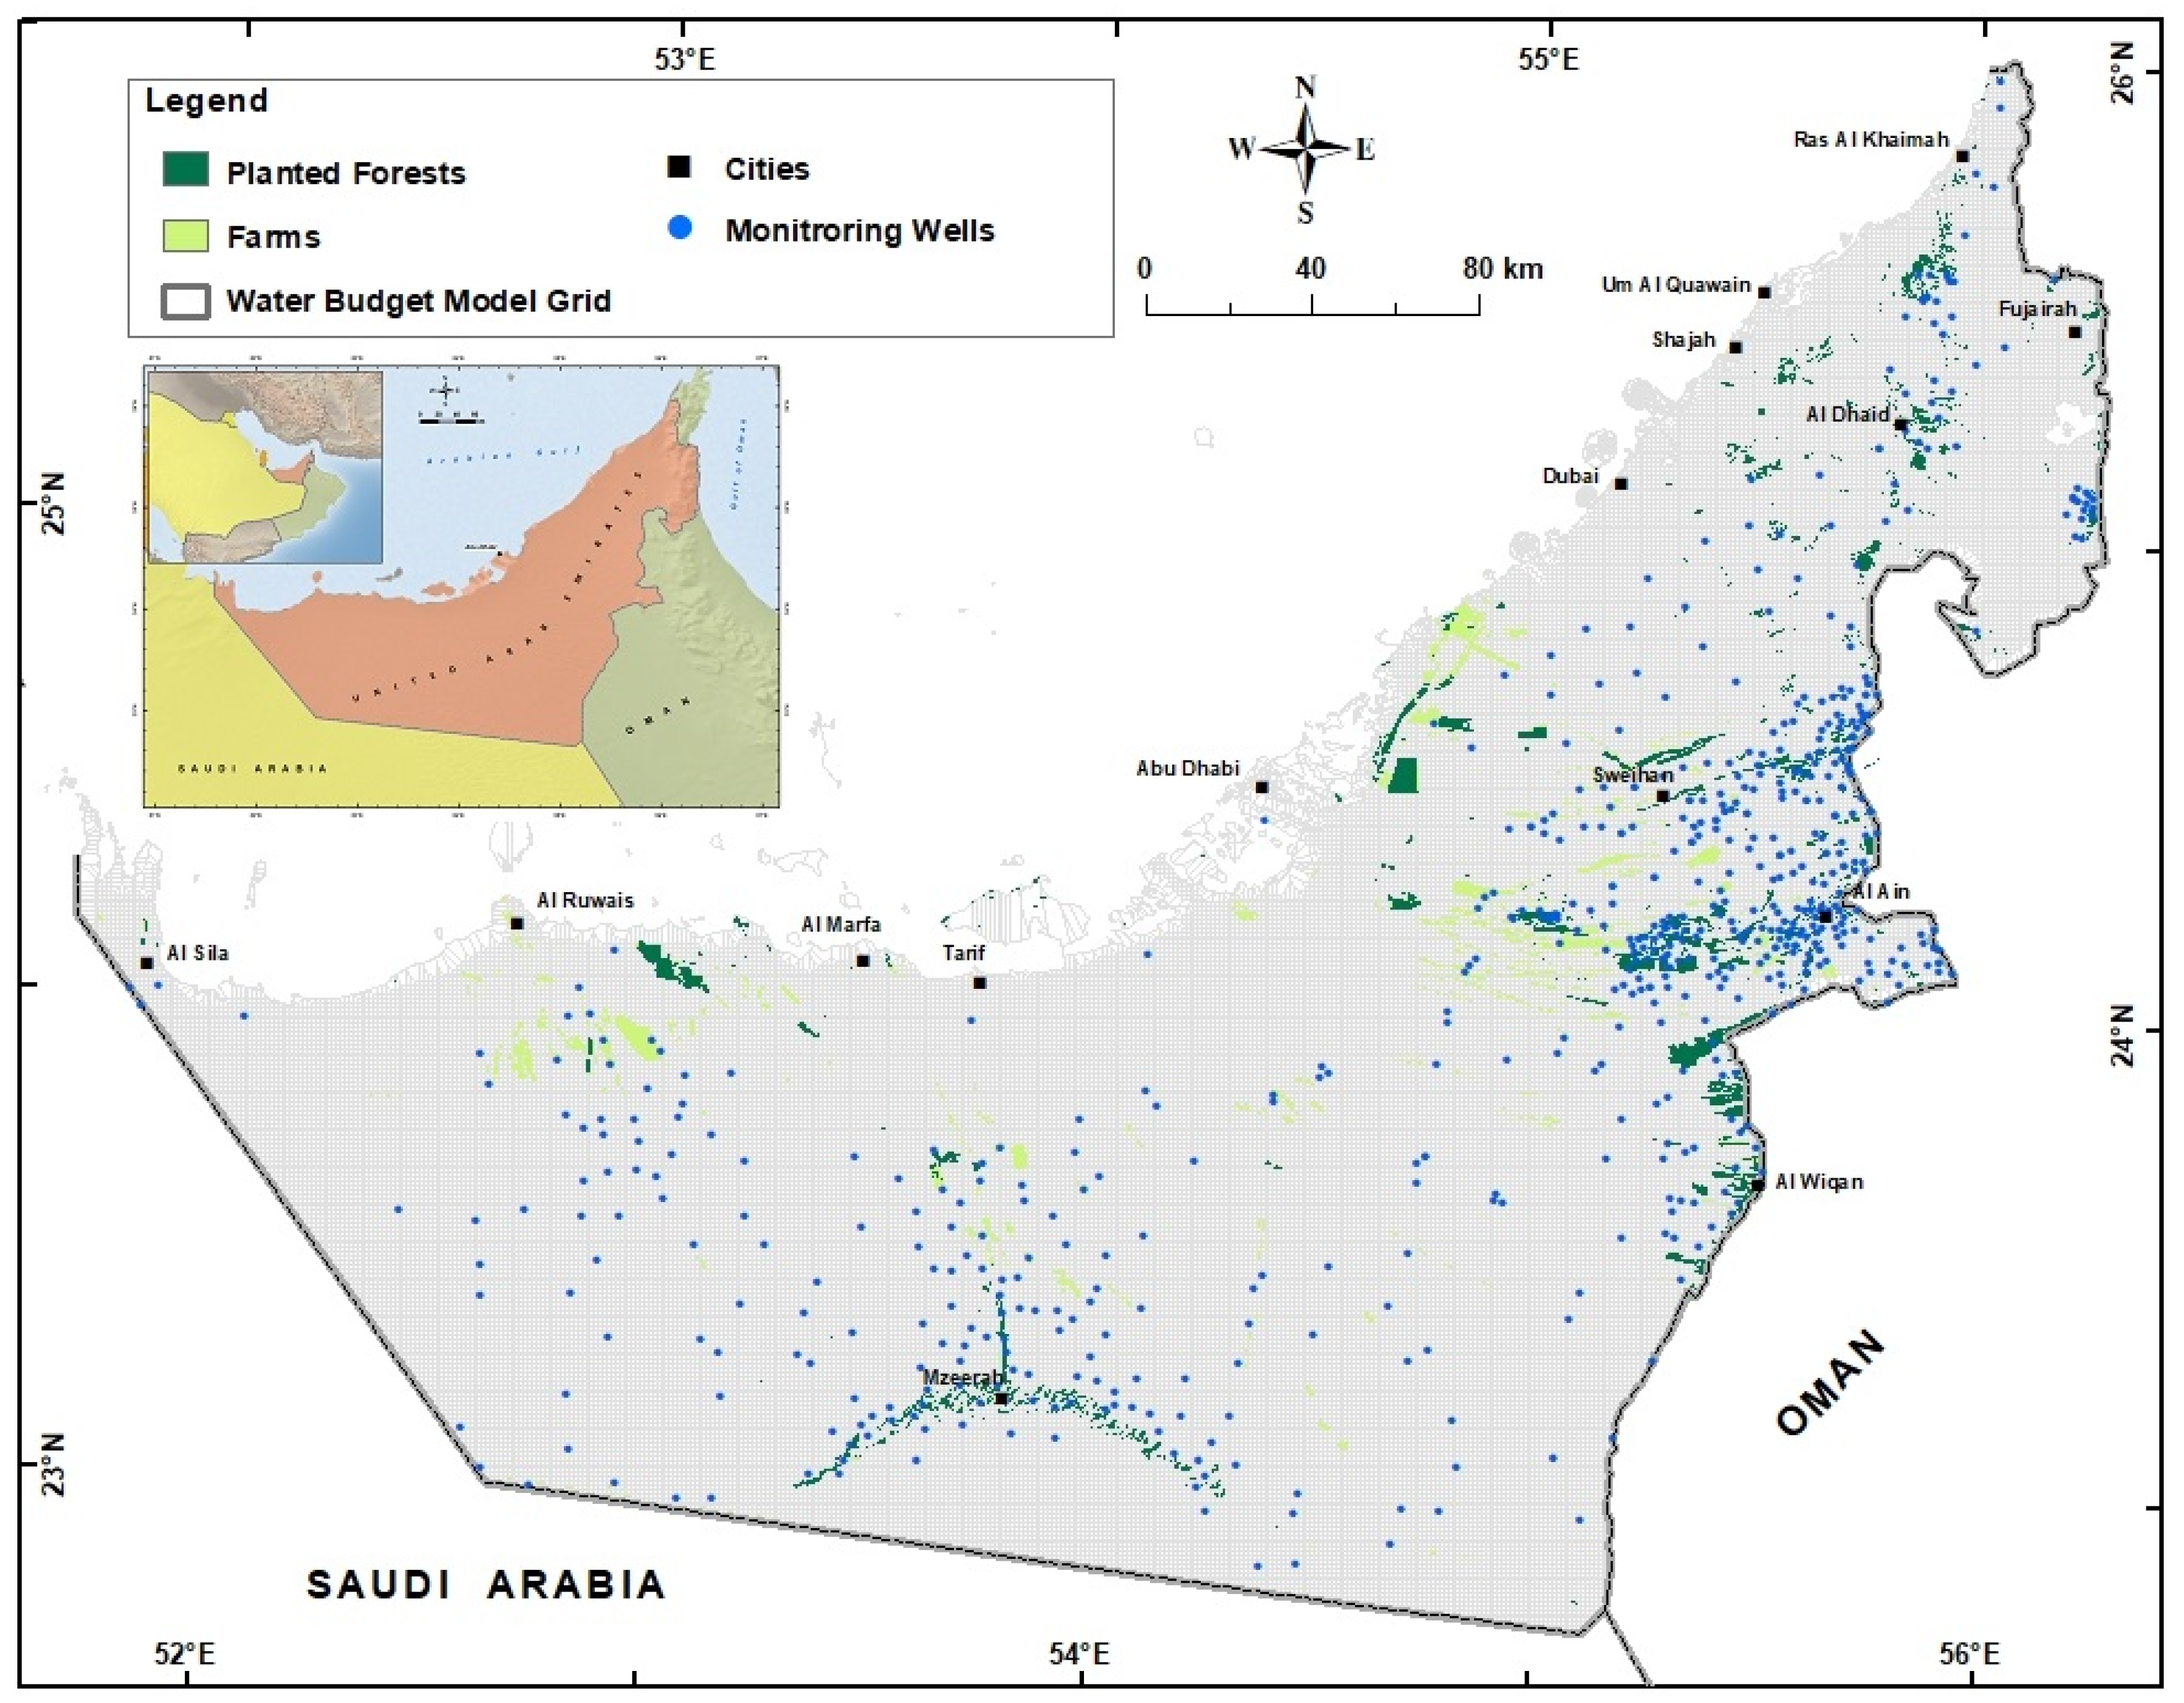
The natural renewable water resources in the United Arab Emirates (UAE) are limited. Geographically, the UAE is a part of the arid climate zone of the Arabian Peninsula [1] and shares transboundary water resources along common borders with Saudi Arabia and the Sultanate of Oman, 350 km and 280 km in length, respectively (Figure 1). Fresh water in UAE is obtained from four main sources:
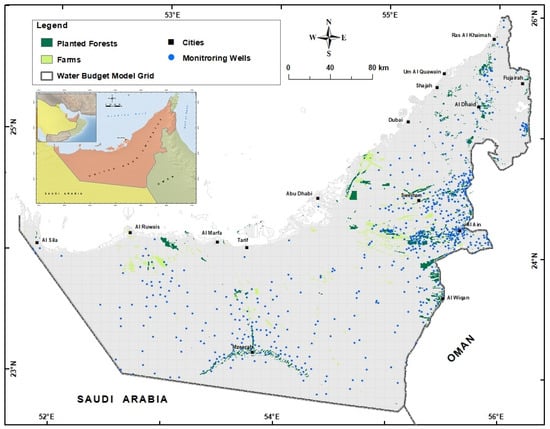
Figure 1.
Location map of UAE. The locations of monitoring wells, farms, planted forests, and water budget model grid are also shown.
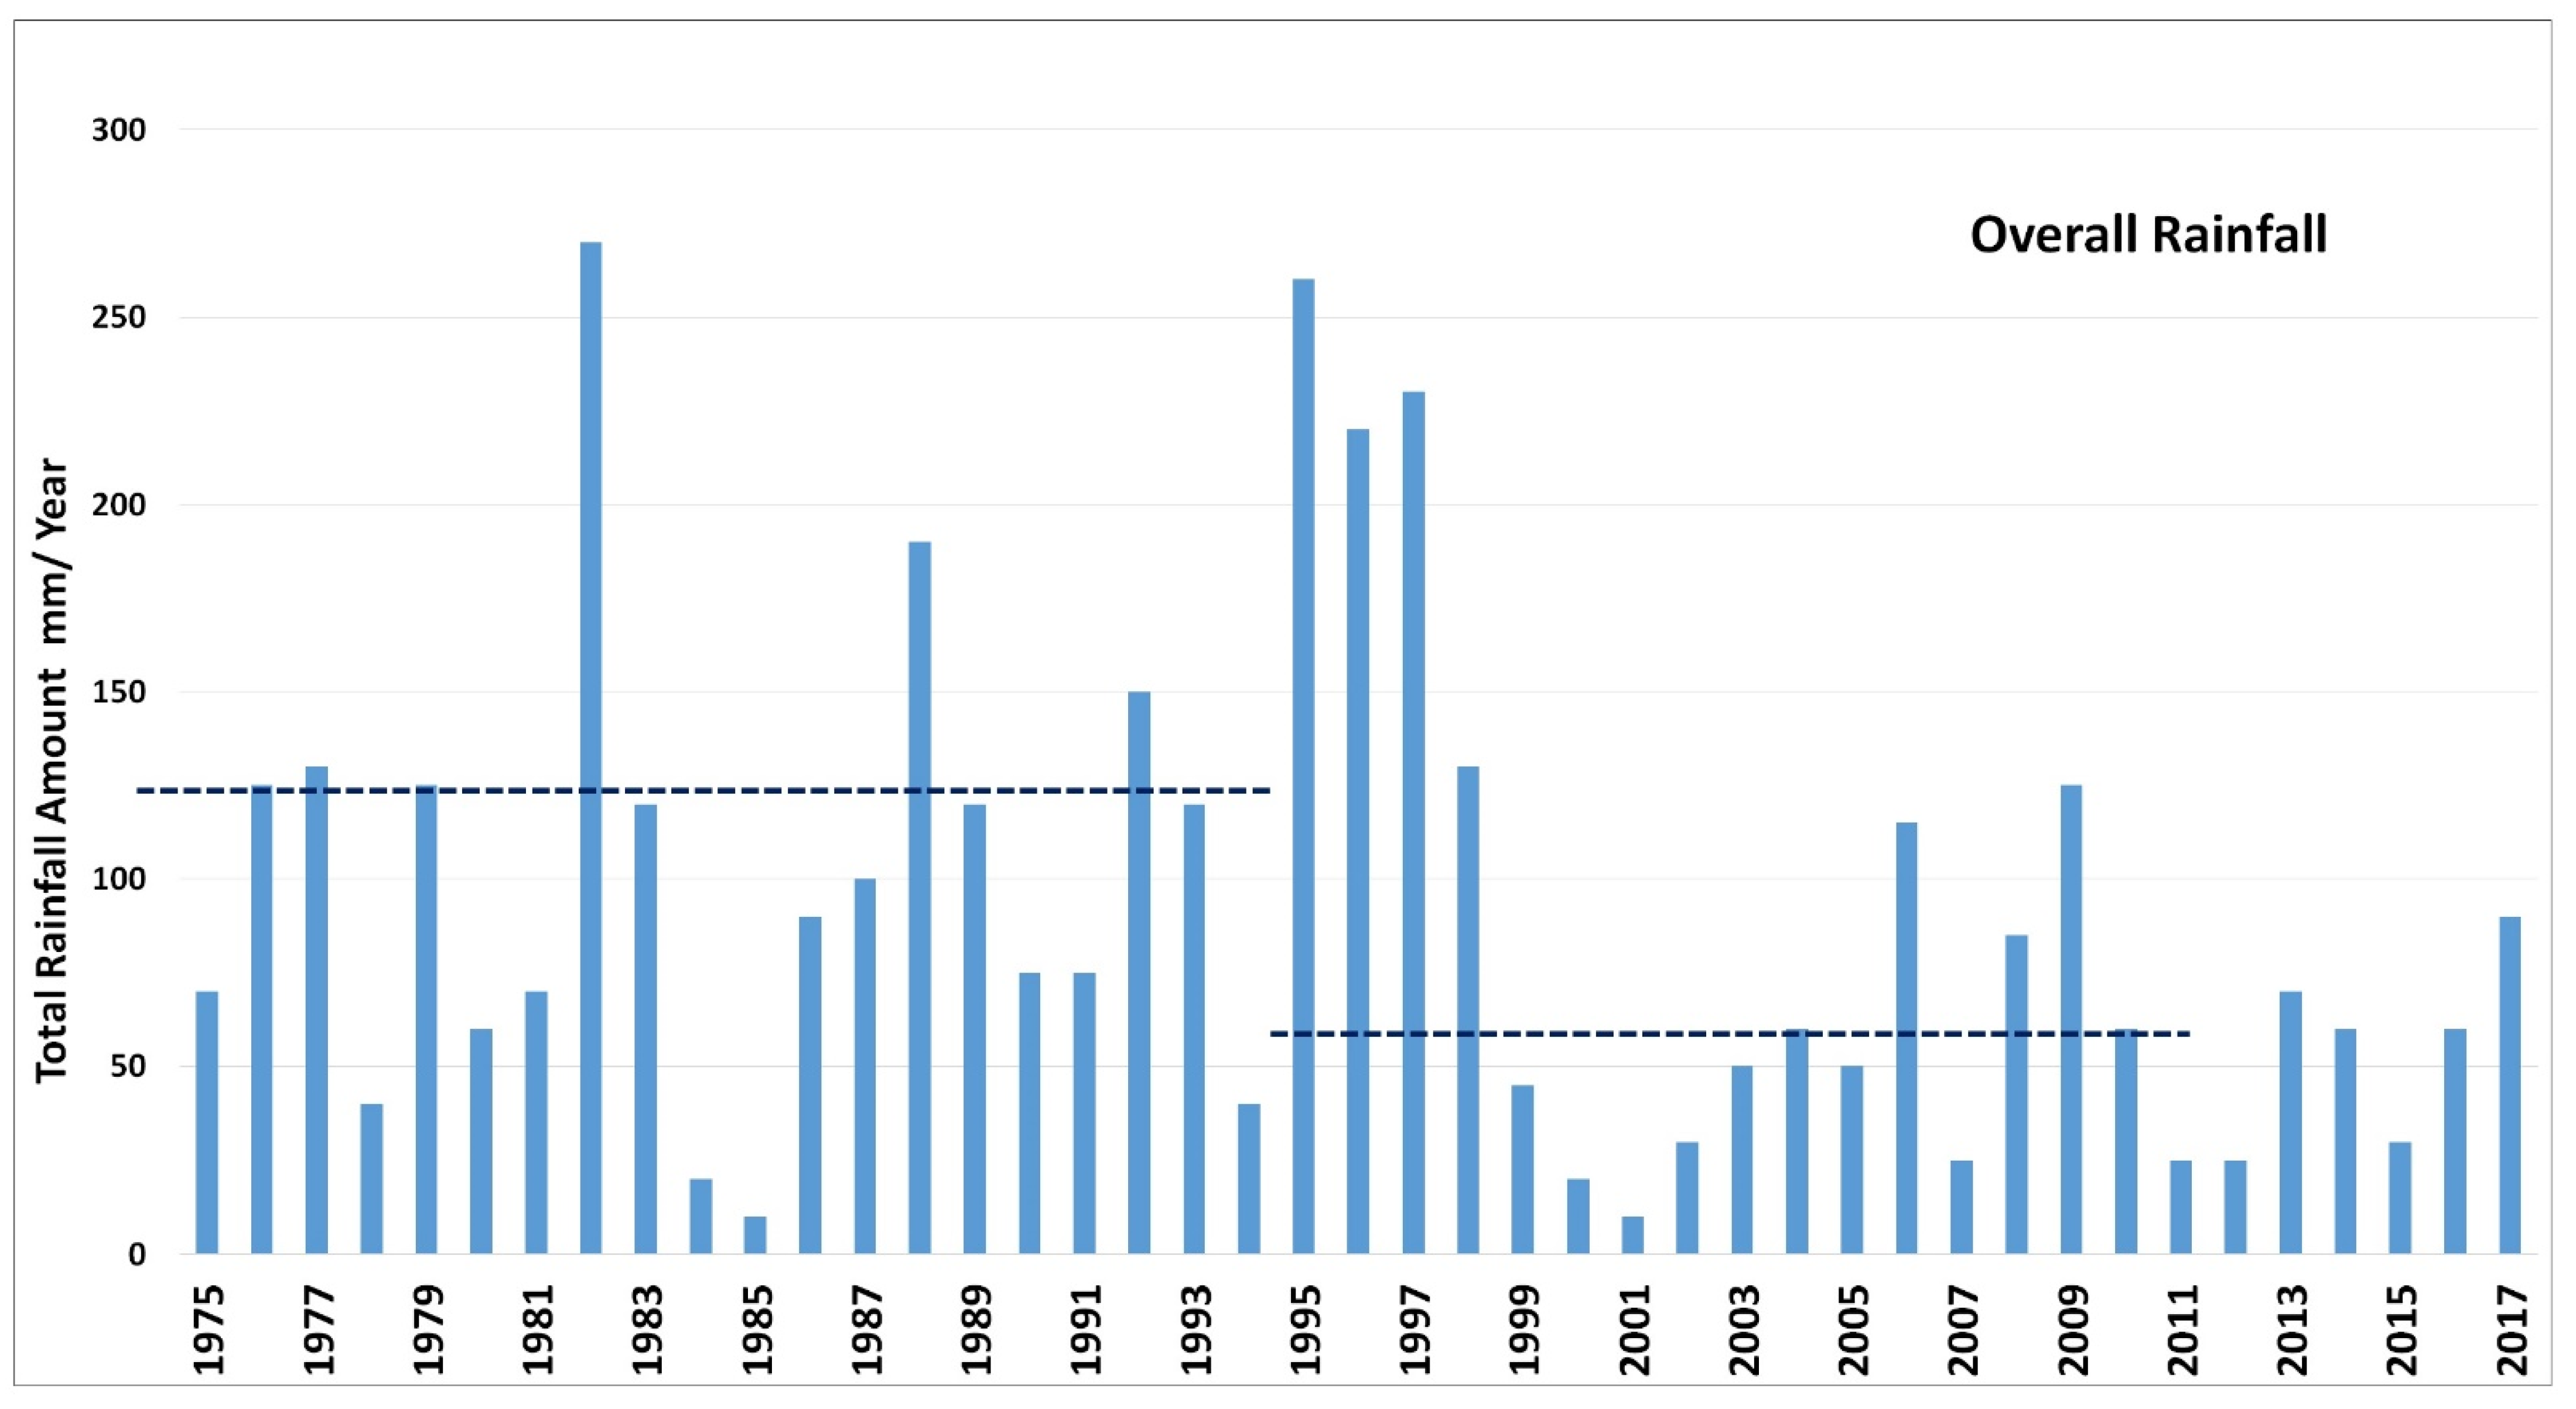
- Surface Water: UAE is known for its arid conditions. The entire region is mostly dry throughout the year, but surface water runoff may be generated during rainy seasons/days. Precipitation varies geographically, temporally, and seasonally. Precipitation varies spatially, and data from several representative gauges are being used to estimate the average precipitation for the area and to evaluate its reliability (Figure 2).
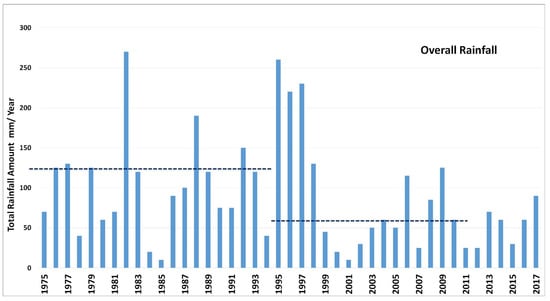 Figure 2. Total and average annual rainfall.
 - Groundwater: The groundwater system in UAE consists of five main aquifers: Quaternary aquifer, Sand dune aquifer, Juweiza aquifer, Carbonate aquifer, and Fractured Ophiolite. The Quaternary aquifer system is the main aquifer in UAE and the main concern in the present paper. The present annual groundwater abstraction for different purposes is 2.854 billion cubic meters (BCM), as will be discussed in detail later.
- Desalinated seawater: It is supplied via modern, high-tech desalination stations. UAE relies heavily on non-conventional water resources, such as desalination, to meet the increasing demand for water. UAE is now a world leader in the application of desalination technology, brought about by a rapid and very comprehensive program of construction of new plants and a detailed research and development campaign.
- Recycled water: It has been introduced recently and is obtained via wastewater and sewage treatment plants that supply water for agricultural purposes only. UAE has also resorted to recycling wastewater from sewage systems and from industrial and agricultural operations.
Depleted groundwater causes soil to become saline and unable to support growth due to saltwater intrusion in the coastal areas and upward coning of the saline water from the deep aquifers in the inland areas. For example, the water table has dropped 80 m in 25 years in the Al Khazna agricultural area, which is located 40 km west of Al Ain City. Groundwater depletion and soil salinization lead to the abandonment of several farms across the UAE and represent a major sustainability challenge of agricultural activities in the country. On the other side, all the desalination plants in UAE use both thermal distillation and membrane technologies [2]. There is an unavoidable environmental impact of the almost complete dependency of UAE on desalination for domestic water supply. The hot and hypersaline rejected water, which is sometimes a toxic mix, can cause irreparable extreme local and regional ecosystem damage, particularly critical habitats such as corals and seagrass. The environmental impacts of brine upon the marine environment may also be intensified through the effects of climate change [3]. In addition, dependence on desalination has placed a severe strain on the national budgets of the GCC countries, including the UAE [4].
The reservation of fresh groundwater resources is crucial for water security in UAE. Therefore, there is a need for managing the scarce groundwater resources efficiently. Successful management of this precious resource cannot be achieved without the knowledge of the available groundwater resources from each water category (fresh/brackish/slightly saline) and its spatial and temporal variations. In this study, the groundwater data from 652 monitoring wells was used with sophisticated statistical methods to develop a simple water budget model to determine the available groundwater resources.
2. Geological Setting
Detailed knowledge about geology, including geologic structure, stratigraphy, and lithology, is necessary to define the extent, hydraulic characteristics, and patterns of groundwater flow within local and regional aquifers. Furthermore, the mineral composition of the bedrock and unconsolidated shallow deposits largely influences the chemical composition, accordingly, the quality of the groundwater. Previous geological studies [5,6,7,8,9,10,11] reported intensively on:
- (a)
- The lithologic composition, texture, stratigraphy, thickness, and extent of geological units that build up the main aquifers in UAE, and
- (b)
- How structural deformation, geomorphology, and stratigraphy influence groundwater flow regime and recharge.
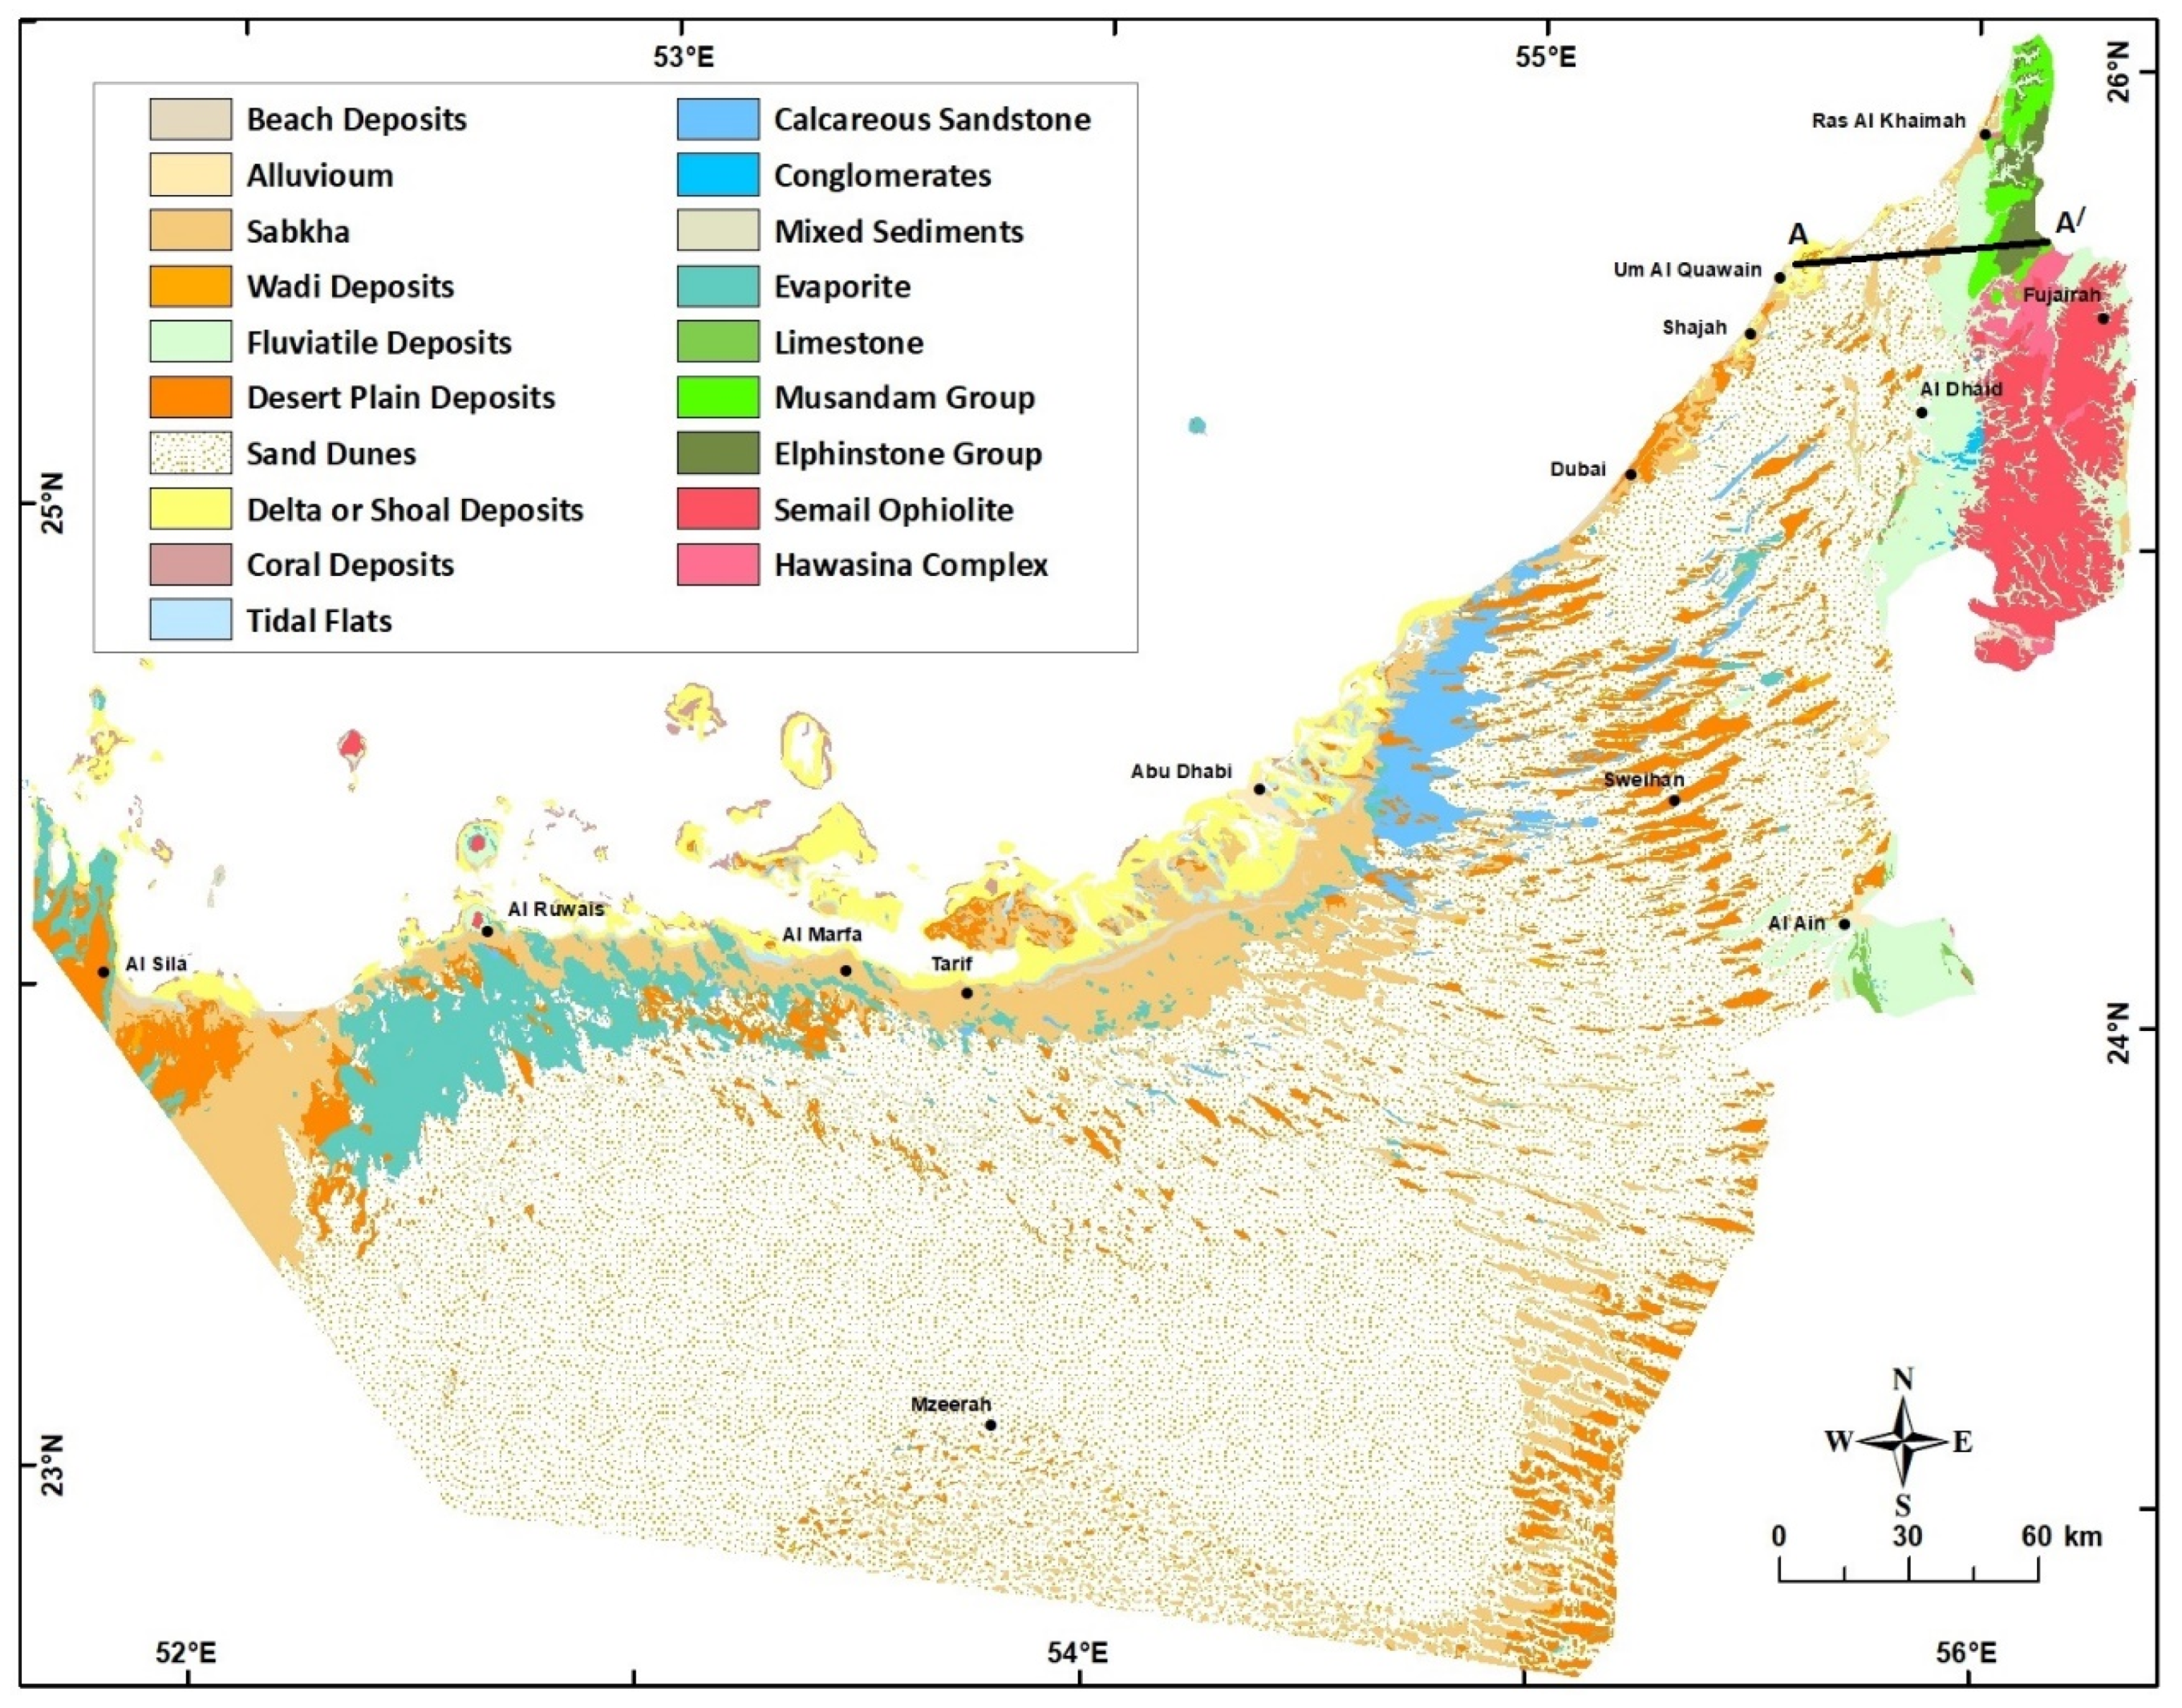
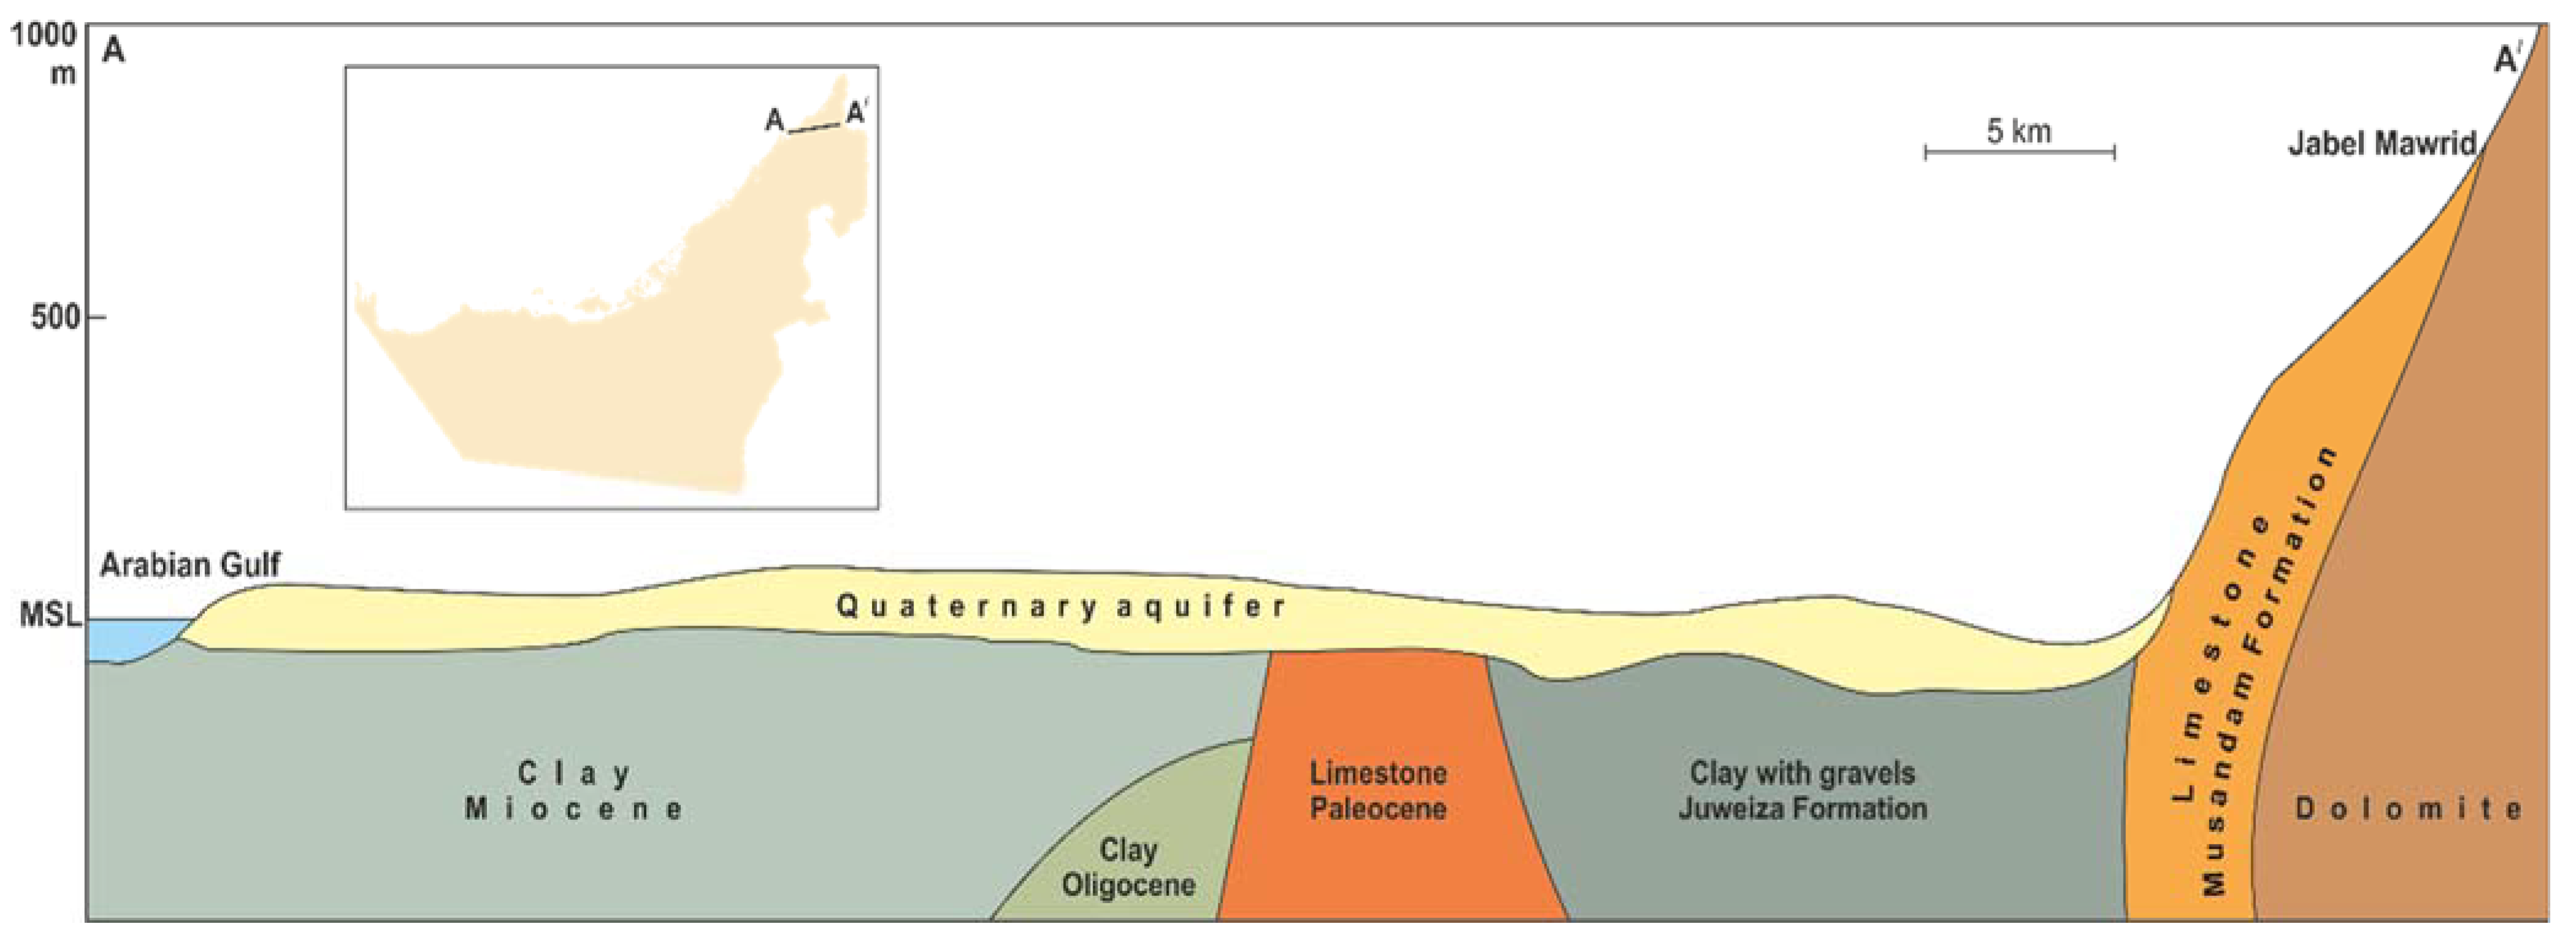
Lithology in the UAE can be divided into two major components: (a) Unconsolidated lithological units and (b) consolidated lithological units [12,13]. Figure 3, along with the next sections, presents a brief description of the characteristics of these geological units. The drilling information of the available water wells was used to construct several geological cross-sections along different directions to illustrate the physical setting of these units. An example of these cross-sections is shown in Figure 4.
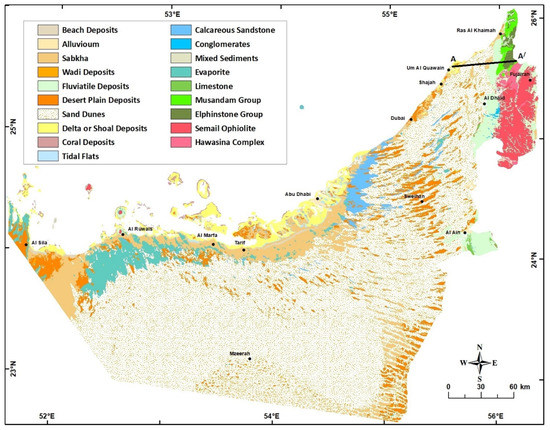
Figure 3.
Geological Map of UAE. Modified after [1].
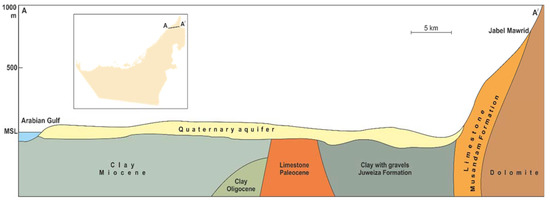
Figure 4.
Geological cross-section A-A/ in the east-west direction showing the Quaternary aquifer. Modified after [12].
2.1. The Unconsolidated Lithological Units
The unconsolidated lithological units can be classified into the following three major units: (1) Fluvial or Alluvial, (2) Eolian, and (3) Sabkha deposits. These units give rise to the distinct existing landform features (as shown in Figure 3), but also, in their different ways, play an important part in the hydrological regime of the area (Table 1) [10,11,14]. These superficial deposits have a Pleistocene to Recent age, and their thickness and occurrence vary widely over the UAE. They may be best considered in the context of the condition of their formation (Figure 3 and Figure 4, and Table 1).

Table 1.
Types of superficial deposits in UAE [11].
2.2. Consolidated Lithological Units
Due to the lack of monitoring wells and detailed subsurface information, this study focuses on the shallow aquifer (Quaternary aquifer) in the UAE. Based on their occurrence, the consolidated lithological units can be subdivided into seven regions: (1) The Rus Al Jabal massif, (2) Hawasina Series and Metasediments, (3) Semail Ophiolite Complex, (4) Upper Cretaceous limestone, (5) Dammam Formation, (6) Oligo-Miocene Clastics, and (7) Fars Formations (Figure 4 and Figure 5). The characteristics of these units are discussed in detail in [5,8,10,11,13].
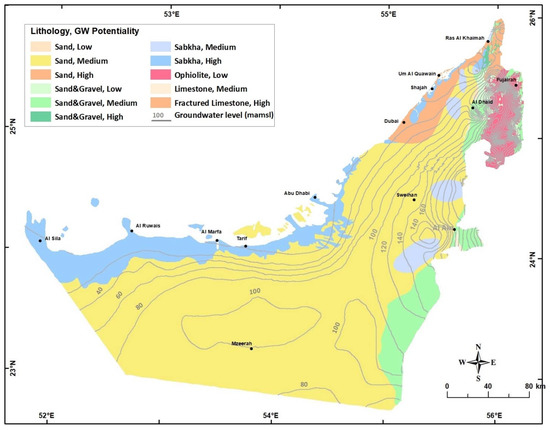
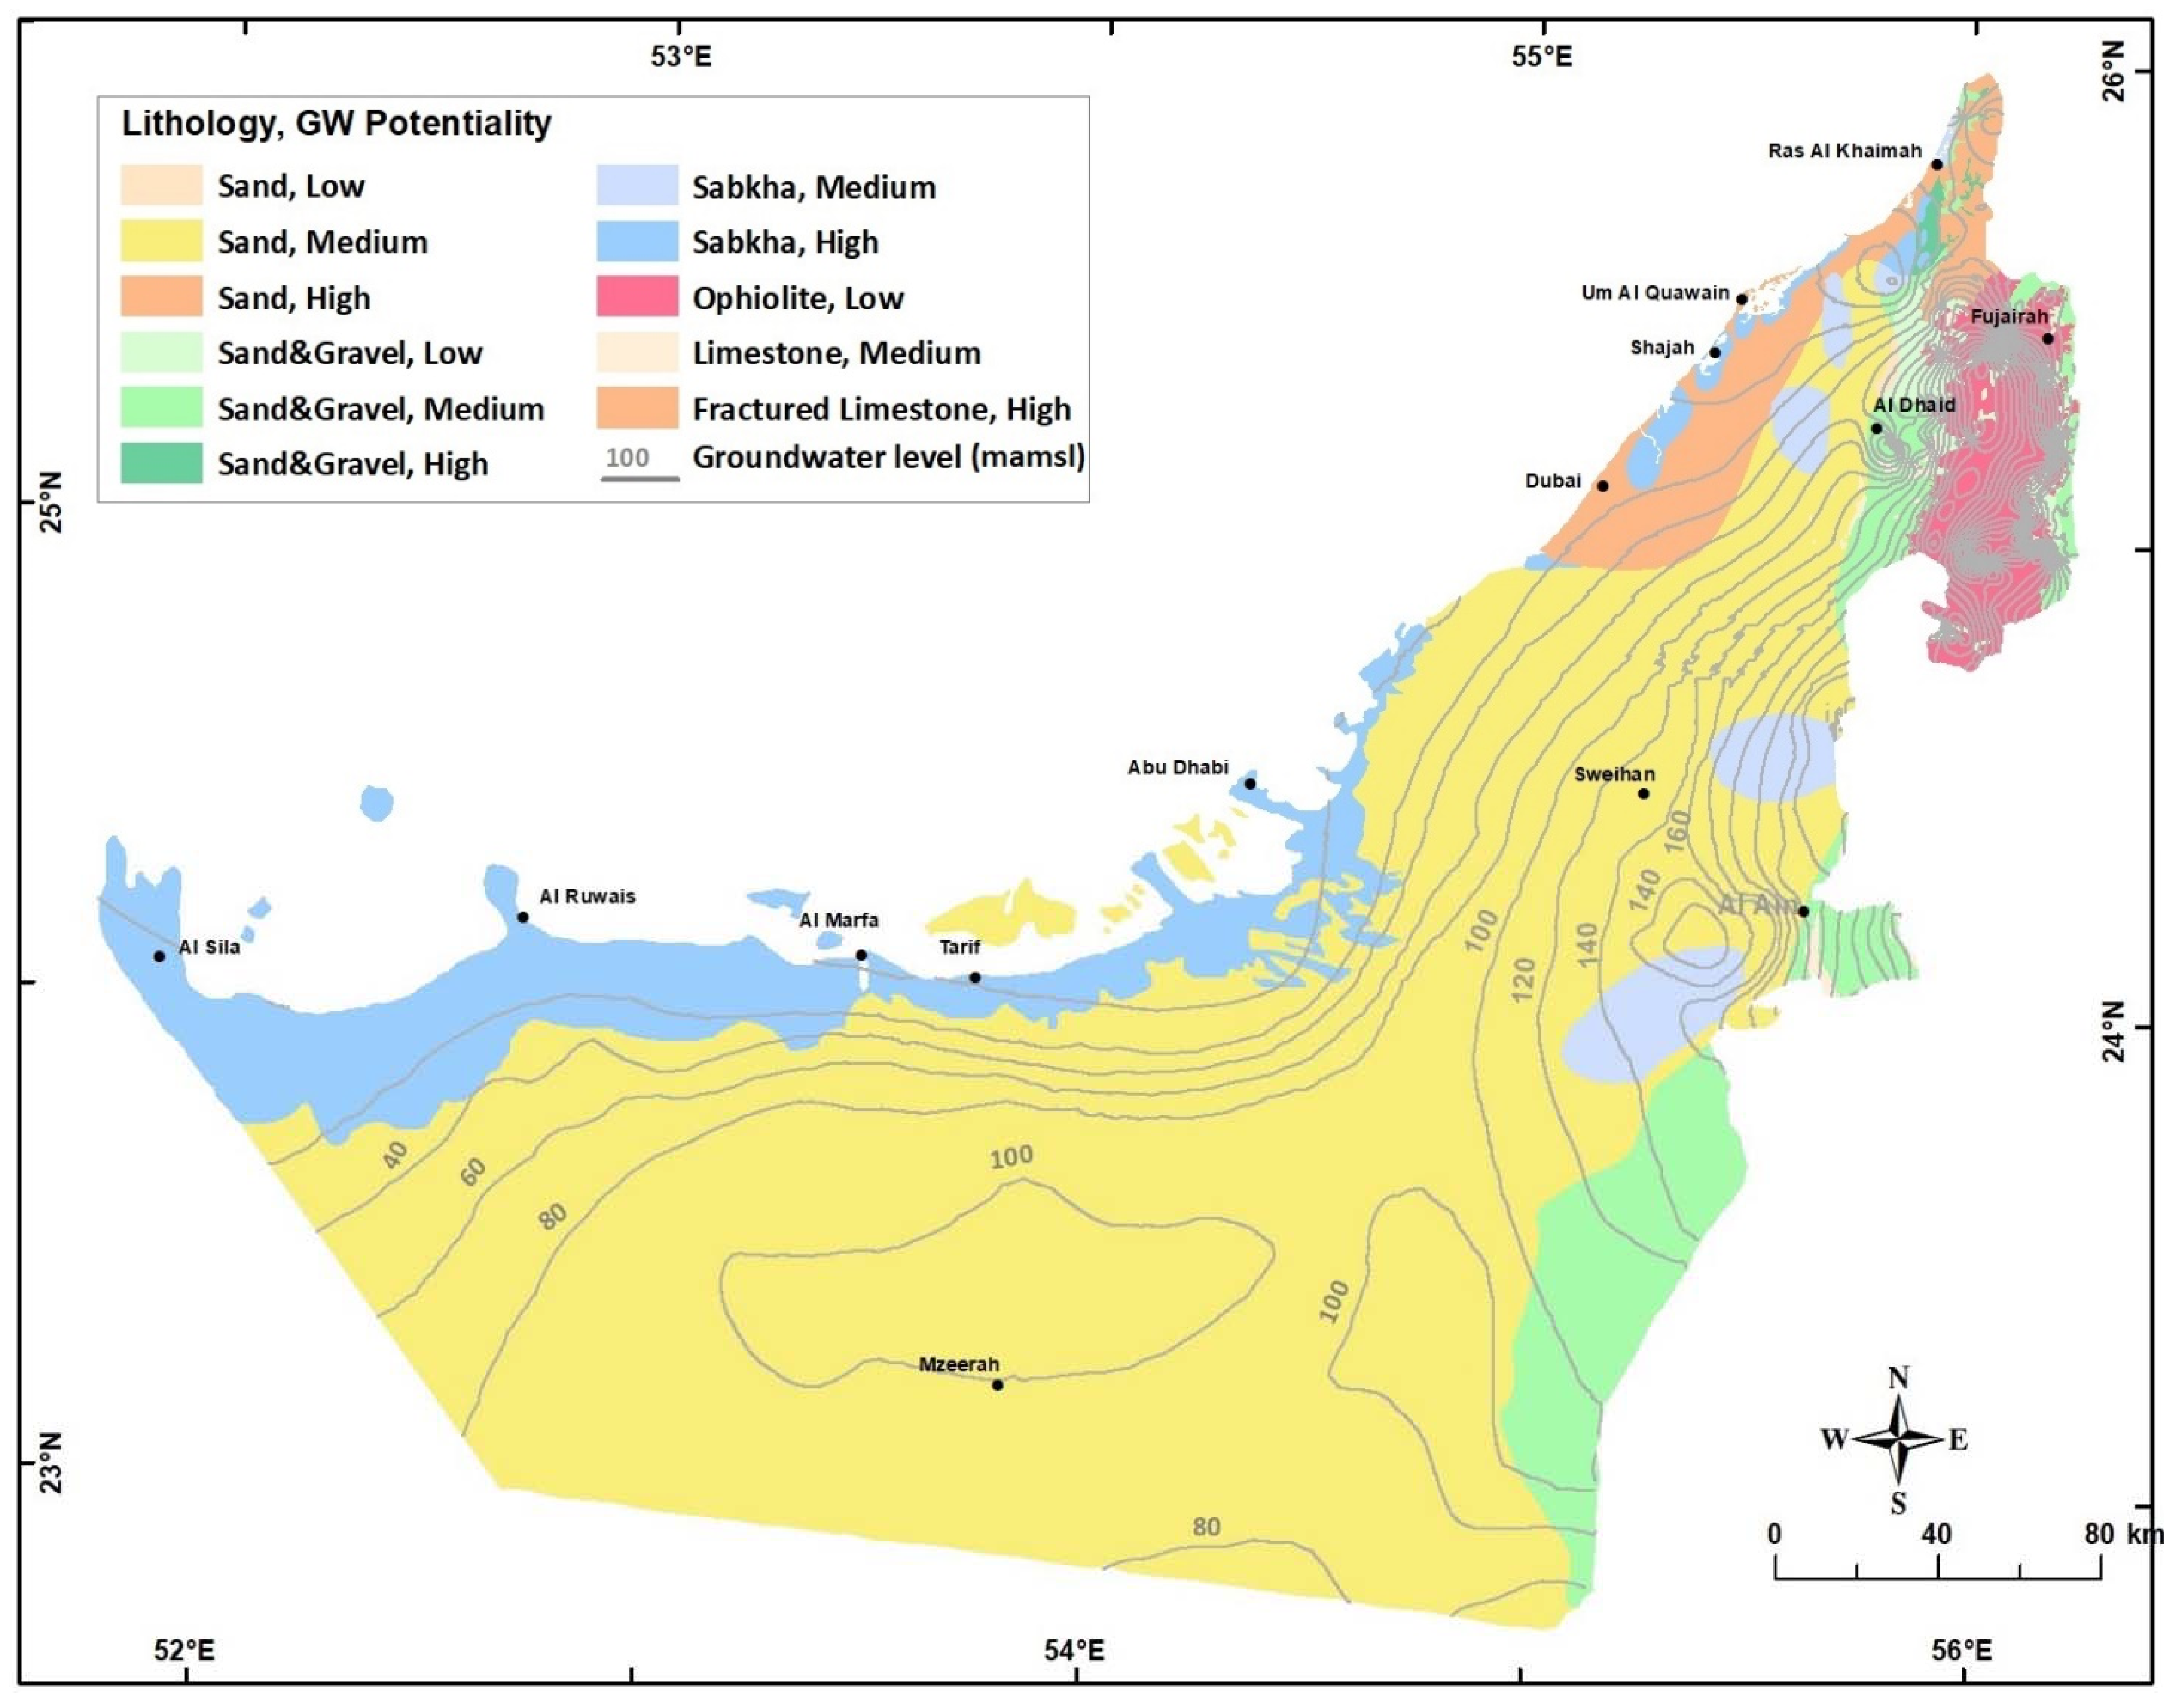
Figure 5.
Hydrogeological Map of UAE (modified after [2]). Groundwater contours of 2015 are also shown.
3. Hydrogeological Setting
The groundwater systems in UAE consist of five aquifers listed below according to their physical setting (surficial or deep) and geographic location from north to south (Figure 5):
- Quaternary aquifer
- Sand dune aquifer
- Juweiza aquifer
- Carbonate aquifers
- Fractured Ophiolite aquifer
The Quaternary and Juweiza aquifers are hydraulically connected and represent the main groundwater system in UAE. The aquifer comprises alluvial gravels and sand on both sides of the Northern Oman Mountains. In the Abu Dhabi Emirate, it is an unconfined aquifer made up of sandstone and subordinate conglomerates [13,15]. This aquifer encompasses the largest fresh groundwater storage in UAE [16]. The flow system in the surficial aquifer depends on local topography, aquifer boundary and extent, groundwater abstraction, and recharge rates. The hydraulic conductivity of this aquifer system ranges from 10 to 150 m/day, and the TDS ranges from 500 to more than 150,000 mg/L in the sabkha areas [2]. Field measurements indicated that the depth to groundwater ranges from 5 to more than 100 m (below ground level). Excessive groundwater abstraction from this aquifer system has developed local cones of water depression due to the limited annual replenishment [12,17,18,19,20]. The sand dunes form a very good shallow aquifer system, in particular in the Liwa area surrounding Mzeerah village (Figure 5). It covers about 74% of the total area of UAE [21]. This aquifer level increases gradually relative to sea level at the western coast up to 250 m (amsl) near Mzeerah [22].
The Juwiza aquifer extends over a major part of bajada and a minor portion of the structural plain in the Dhayd area, northwestern UAE (Figure 5). The aquifer is made up of a thick layer of clay containing sand lenses of medium groundwater potentiality. These low permeable sediments were deposited during the period when nappe folding and faulting in the structural ridge took place. In certain areas, productive gravels are interbedded in the low permeable sediments [12].
Two important carbonate aquifer systems exist in UAE; the northern limestone aquifer in Ras Al Khaima Emirate and Jabal Hafit carbonate aquifer south of Al Ain City in Abu Dhabi Emirate (Figure 5 and Figure 6). The northern limestone aquifer (which is also named Bih or Hajar aquifer) with fresh to brackish groundwater storage is cropping out in an area of 640 Km2 in the northern part of UAE with an average saturated thickness of 150 m. The northern limestone aquifer is mostly unconfined, which primarily comprised fractured limestone and dolomite [23,24]. The hydrologic budget of the northern limestone aquifer indicated that the total fresh groundwater reserve in this aquifer is 14 km3 [25]. The total estimated annual recharge is about 9.6 MCM [25], and the annual discharge is 14 MCM in addition to losses to the sea of about 1.47 MCM [12,26]. Thus, the deficit between the annual recharge and discharge was about 6 MCM before 1998. After 1998, the domestic water supply for Ras Al Khaimah City is met from the desalinated seawater resulting in a reduction of annual groundwater withdrawal to be about 10 MCM. Therefore, presently, there is a very slow groundwater deletion storage with a percentage of 0.014% of its present freshwater reserve, thus this aquifer could be sustainably developed for the water security of the northern part of UAE. On the other hand, the carbonate aquifer in Abu Dhabi Emirate covers an area of 63,000 km2 and is made of around 1500 m thick limestone and marl interbedded with gypsum and dolomite and evaporates Formations of Lower Eocene to Miocene age. This aquifer is mainly confined and overlying of a confining impermeable layer (e.g., clay or anhydrite) that delimits its water level. The total groundwater reserve in this aquifer in Abu Dhabi Emirate is around 360 km3, with total salinity ranging from less than 10,000 to more than 250,000 mg/L, depending on the physiographic setting and the geographic location. Despite its potentiality, the limestone aquifer is not yet fully studied as the Quaternary aquifer and needs further investigations.

Figure 6.
Hydrogeological Cross Sections A-A/ (not to scale, modified after [27]).
The Ophiolite aquifer is dominated by joints and fractures. The main fault system runs in a northwest-southeast direction [6,11]. The groundwater flow in this system occurs only in connected cracks and fissures, hence, this aquifer has a limited potentiality.
4. Methodology
There are different sources of groundwater inflow (recharge) and outflow (discharge) to/from the Quaternary aquifer. Each of the inflow and outflow components can be classified into 2 main categories, natural and man-made, and both should be assessed before the calculation of the annual water budget.
4.1. Water Balance (Demand-Supply) Model
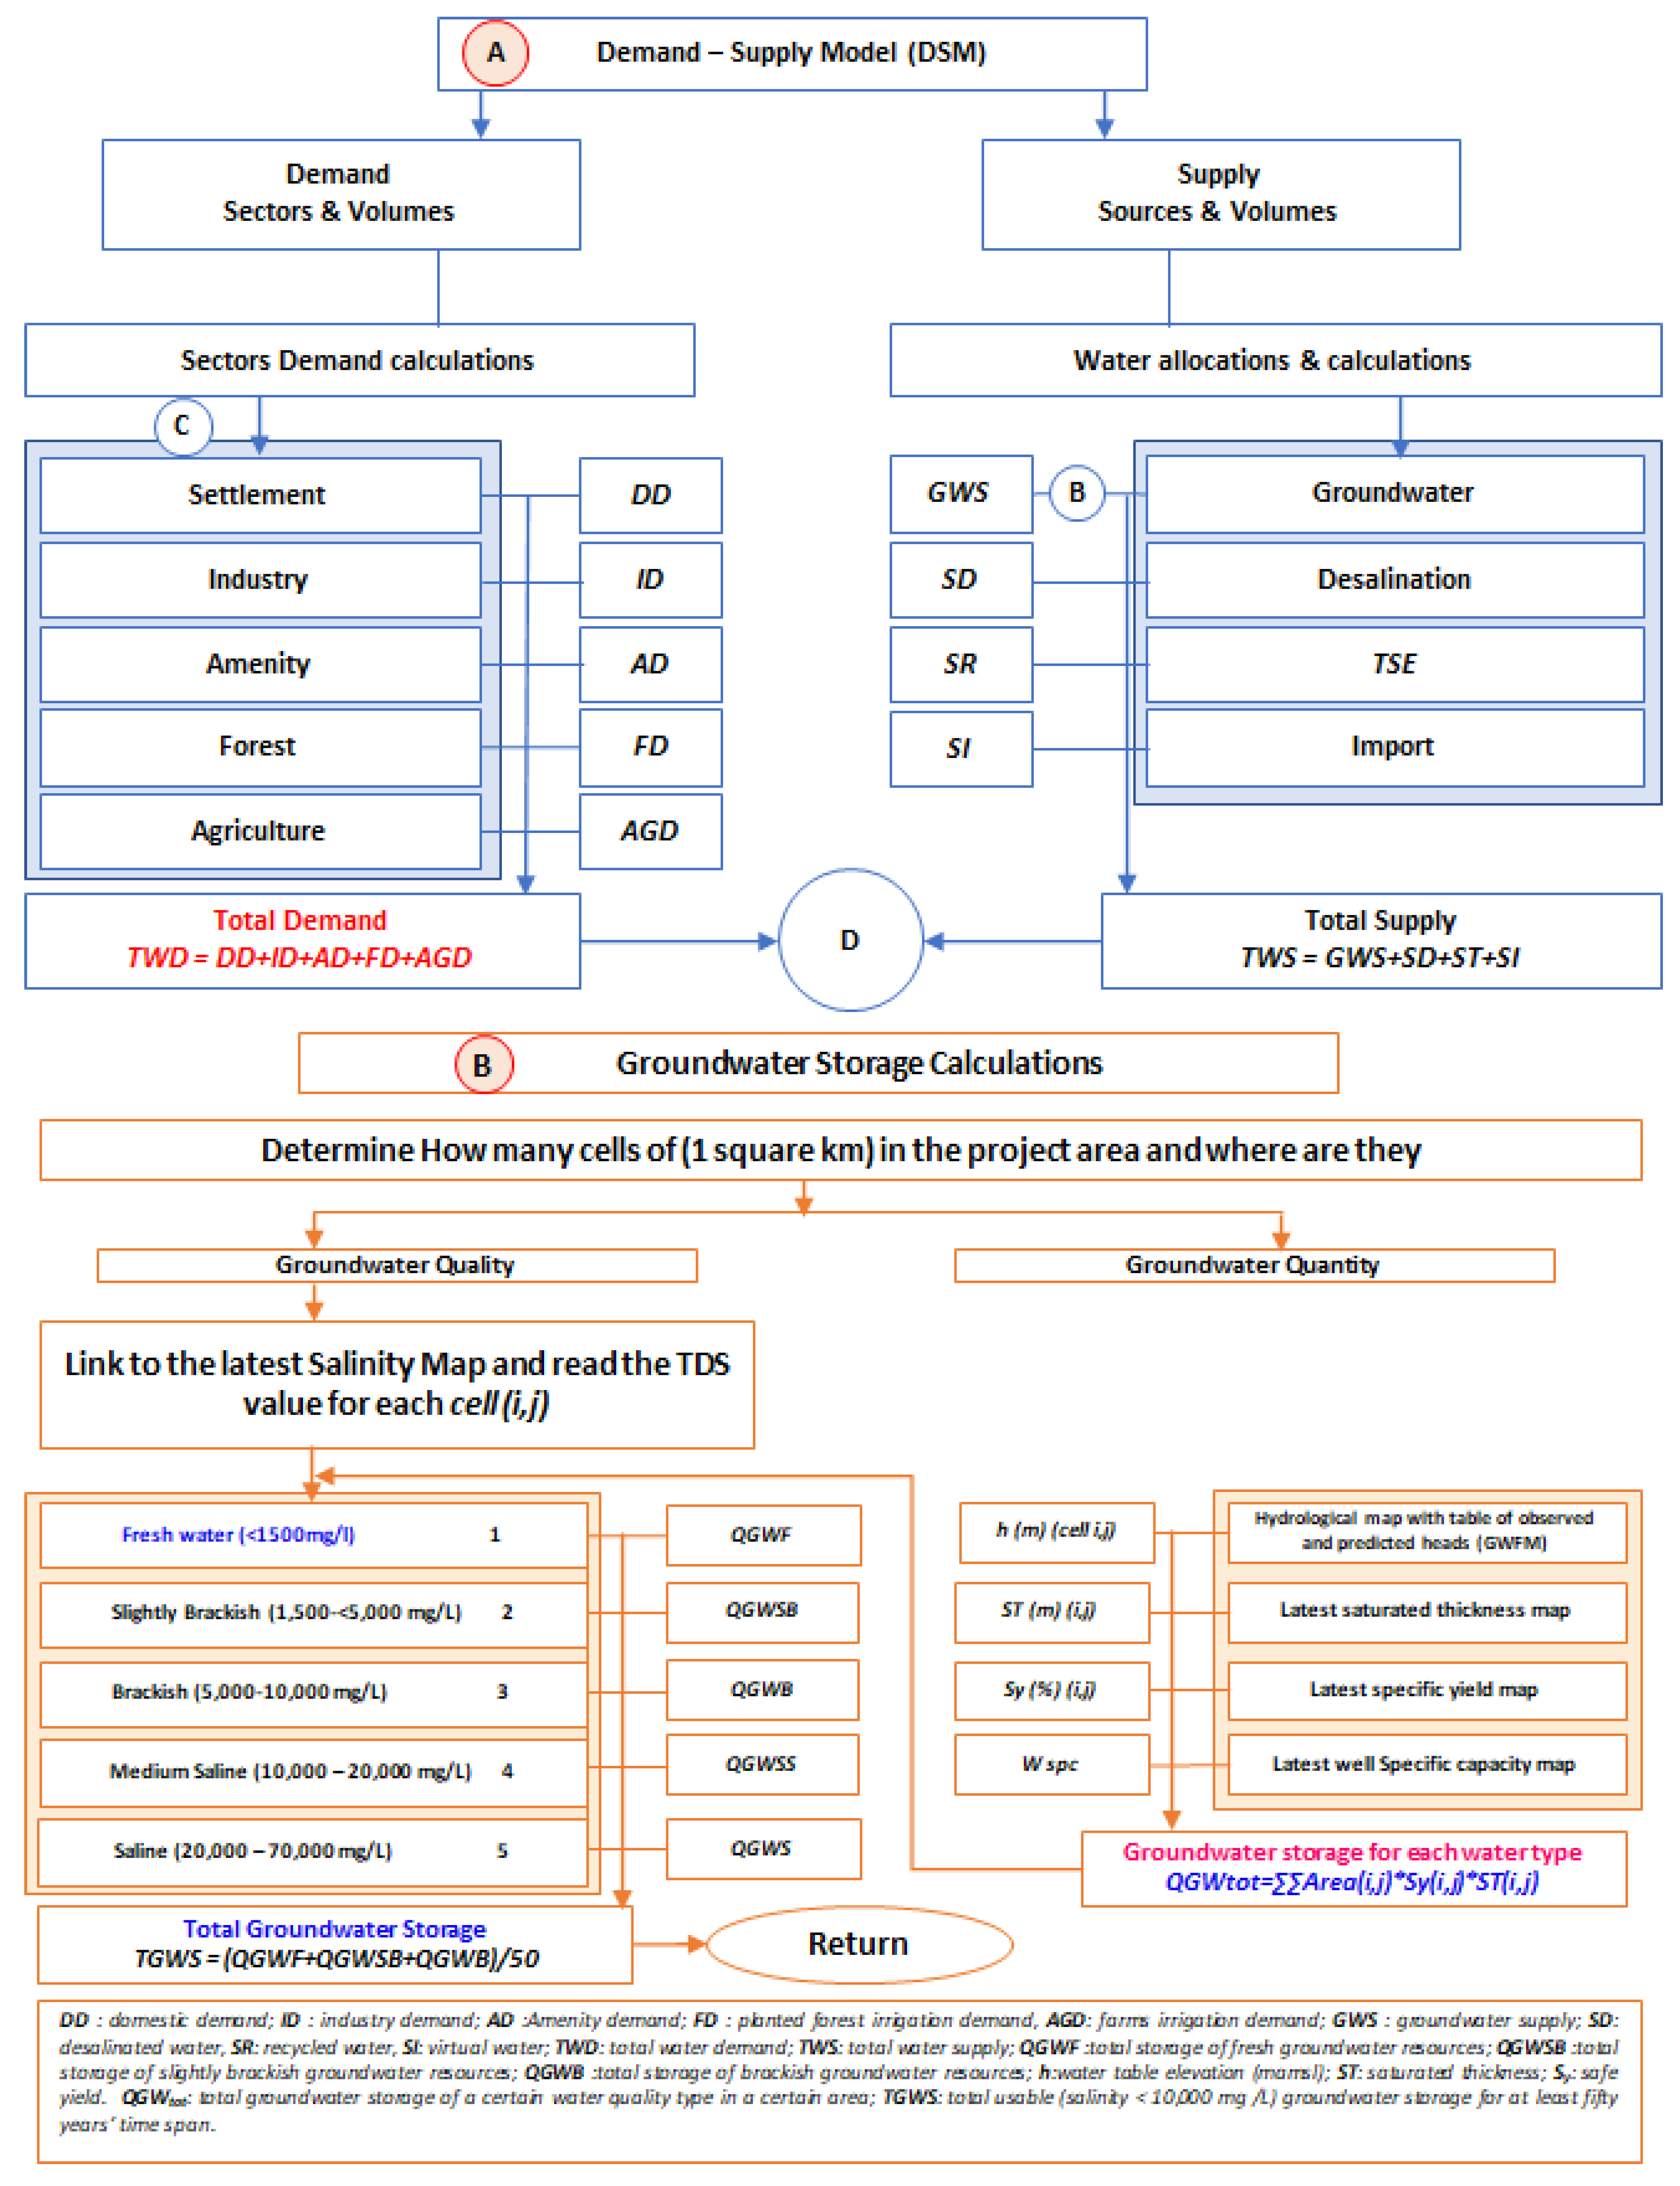
Water balance models are three-dimensional mathematical models, in general. They represent the physical environment that links all components of water resources from source to use (Figure 7). A water balance model requires a clear definition of each water-using activity and extensive empirical data to define input, process, and output quantities. For example, the hydrogeological settings of the aquifers and their properties should be well defined to be able to estimate the available groundwater supply and its sustainability [28]. Information held in the GIS and/or water resources database was employed within the groundwater budget model (GWBM) whose structure is shown in Figure 7 (Module B). The function of water availability includes 4 main components, groundwater, desalinated water, and treated wastewater.
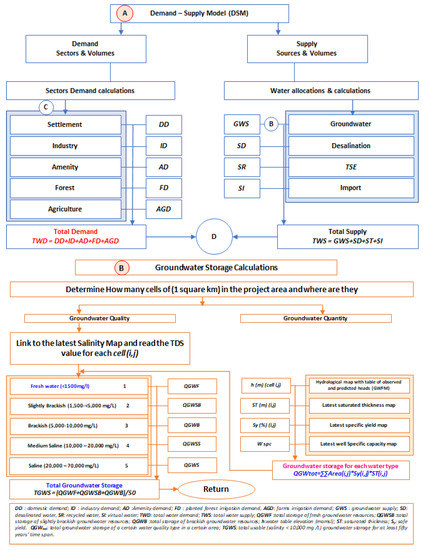
Figure 7.
Water Balance Model for the UAE (Source: [28]).
The objectives of water demand and supply balance modeling are twofold, namely:
- (a)
- Assess the current status of supply sources and demand centers, in terms of their current capacity to supply water (sources) and their current requirements for water (demand centers) and,
- (b)
- Provide a planning tool to allow rapid judgment of the future impacts of changes in supplies and demands (Figure 7).
4.2. Water Resources Demand
In the WBM, supply to demand links were defined, generally on the basis of the existing or planned conveyance systems. The demand in the UAE was categorized into (1): Domestic demand, (2) agriculture demand, (3) amenity demand, and (4) planted forestry demand. Calculation of each demand was done by using an appropriate mathematical model as described briefly below:
4.3. Domestic Demand
Domestic demand was determined from population and per-capita water consumption, both specified for individual years of the simulation period adopted in the SDM. Per capita demand was specified in l/d, and domestic demand is thus derived from:
where: DD1 is the desired demand for water supply [cmd; cubic meters per day]; POP stands for population; PCD stands for per capita daily gross water need [l/d]; and BULK is the bulk demand [cmd].
4.3.1. Amenity
Amenity areas included parks, golf courses, road verges, and central reservations. They comprise a mixture of trees and groundcover vegetation (grasses and flowers). In many cases, these areas were irrigated with tertiary treated sewage effluent supplied from sewage treatment works. The amenity demand is calculated as follows [28]:
where: AD represents the demand for amenity area [m3/d]; NAA is the net irrigated area [ha]; PT is the percentage of net area covered by trees; CUT is the net water requirement for trees [mm/d]; CUG represents the net water requirement for groundcover vegetation [mm/d]; and eff stands for the irrigation efficiency.
4.3.2. Agriculture
The water requirements for Agricultural Demand Centers were calculated in a similar manner to forest areas, except that more crops were considered). From net crop consumptive use of individual crops, percentages of the crops within a crop mix, and irrigation efficiency, the gross water requirement follows from:
where: AGD is the demand for agricultural, which is the sum of the demands of individual farm units [m3/d]; Qnet represents the net irrigation requirement for individual crop [mm/d]; p is the percentage of crop within crop mix (ranges from 1 to 100); Area is the area of farm [ha]; and eff is the irrigation efficiency (ranges from 1 to 1000). Up to 3 crops were allowed for each crop mix, with percentages of individual crops defined for each crop mix.
4.3.3. Forestry
The water requirement for forests depends on the following:
- Area of trees cover (digitized from Landsat imagery)
- Net consumptive use of trees, depending on climatic factors, species, and maturity of trees
- Gross irrigation requirement, which depends on:
Net consumptive use
Irrigation efficiency, which is a function of irrigation technique, frequency of irrigation, soil properties, leaching requirements, etc.
The net crop water requirement is specified as a function of maturity as follows:
where: n is the number of forests; F is the demand of forestry as the sum of individual forest unit or plantation [cmd]; AC is the area of shade per hectare at noon ranges between 0 and 1; Qfmax is the net irrigation requirement for mature forest [mm/d]; year i is the year for which gross water requirement was calculated; year0 represents the year when forest was planted; N stands for the number of years when maturity is reached; Area represents the area of forest unit [ha]; eff is the irrigation efficiency [ranges between 1 and 100]; AC is the area of shade per hectare, expressed in decimals. Tree aged older than 6 years were considered as a mature bearing orchard, and the value of AC equaled 1. Tree aged from 1 to 5 years were considered as a non-bearing orchard. The following equation for AC was used:
where: dx is the distance between rows; dt is the distance between trees; and DS is the diameter (m) of shade cast by tree at noon.
4.4. Water Resources Supply
4.4.1. Surface Water Supply
There were no perennial streams in UAE, and the contribution of surface water to the water resources balance was almost 0. All the constructed dams in UAE were with the purpose of augmenting groundwater recharge in the Quaternary Aquifer.
4.4.2. Groundwater Supply
The available groundwater supply was a function of the available groundwater storage, quality, and the recharge sources/renewability rate. As discussed in the hydrogeological setting section, fresh groundwater resources were only present in the Quaternary and the karstified limestone aquifers. The available monitoring data for the karstified limestone aquifer were insufficient to develop the water budget model, and thus, the groundwater storage and recharge sources were only estimated for the Quaternary aquifer.
4.4.3. Groundwater Storage and Recharge
In order to calculate groundwater quantity and quality in the Quaternary aquifer, the following steps were followed:
- Step1: Data Migration and Storing
Several Detailed Hydrogeological studies were conducted in the 70s and 80s (e.g., [12,29]). These old studies produced very well documented data (e.g., lithological and geophysical logs, subsurface geological cross-sections, aquifer types, geometric settings of the aquifers, hydrogeochemical data, water table elevation record, and pumping tests analyses). These data were georeferenced with the appropriate coordinate system, reviewed, converted to digital formats, and stored. The developed database was updated with the recent drilling information reported in recent studies [13,17,30,31], the historical water table elevation records and the available historical water chemistry records for years 2005, 2010, and 2015. There were 648 monitoring wells, mostly with drilling information and lithological logs. These wells covered most of the area of UAE (Figure 1), and some of them have been continuously used to monitor water table levels and groundwater quality since the early 80s. The monitoring wells data were also used to update the preliminary database developed from the previous studies’ results.
- Step2: Data interpolation
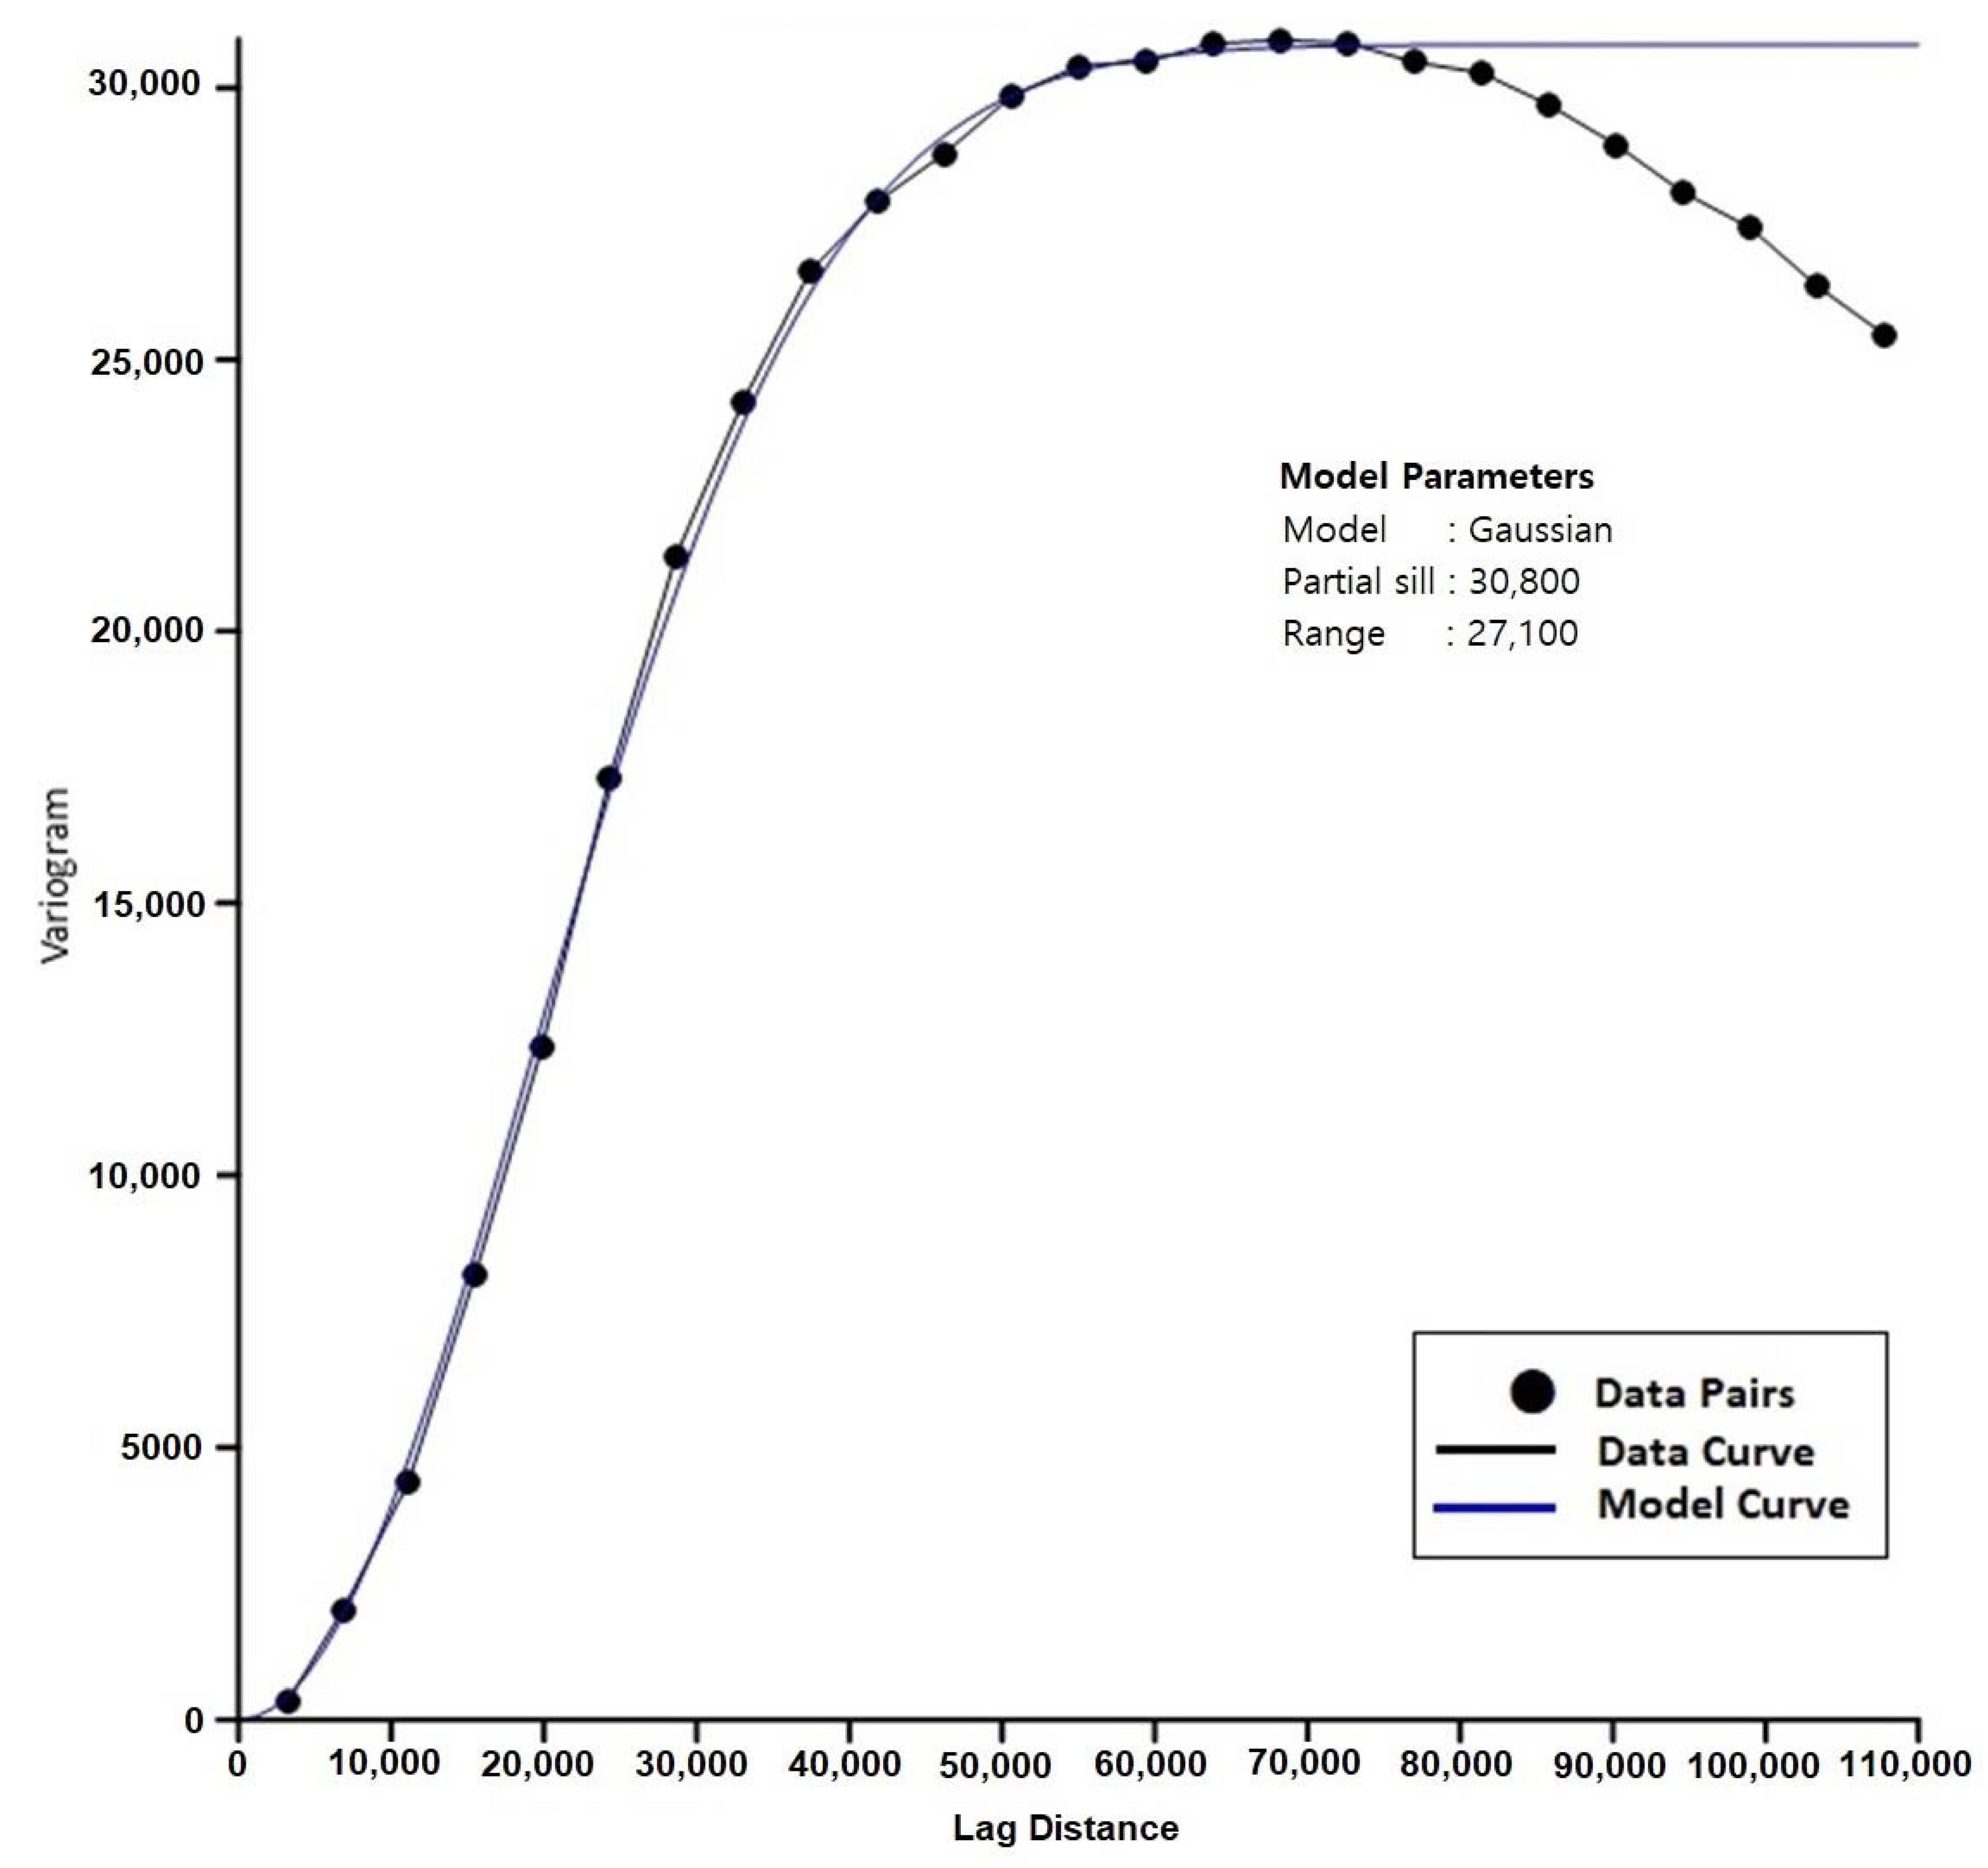
The whole area of UAE was divided into a grid of equal squares with an area of 1 km2. The kriging technique with the appropriate variogram models was used to assign the values of aquifer base elevation (mamsl; meters above mean sea level), water table elevation, and saturated thickness (in years 1969, 2005, 2010, and 2015), safe yield (sy), groundwater salinity for years 1969, 2005, 2015 for each of the 71,572 grid squares (Figure 1). The gridding techniques may adopt either an exact or an approximate interpolator according to the adjustments and objectives of the user. Kriging can be fitted to a data set by specifying an appropriate variogram model, which was used to match a model of the spatial correlation of the observed variables. The variogram (an example is shown in Figure 8) was a measure of how quickly variables change on average. This step will guarantee that none of the above parameters will be over or under-estimated at any cell, in particular, using the appropriate control points (e.g., points with constant head and salinity in the Arabian Gulf and Oman Sea). The procedure for stochastic modeling and variogram testing was repeatedly used with each parameter to avoid the need for sensitivity analysis, which might not be possible for some parameters.
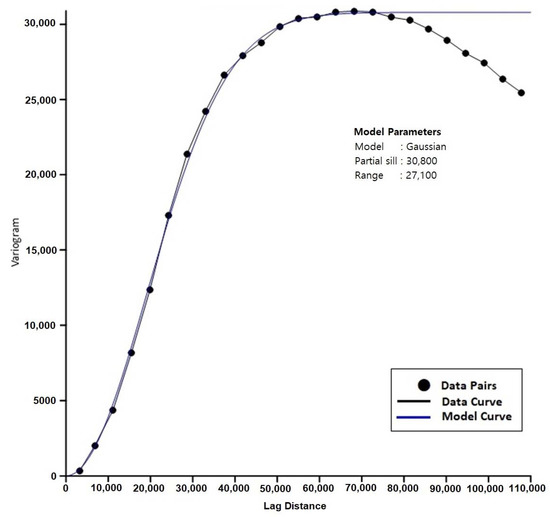
Figure 8.
An example of a spherical variogram model for the hydraulic conductivity data of the shallow or upper aquifer.
- Step3: Generation of Geopotential Maps
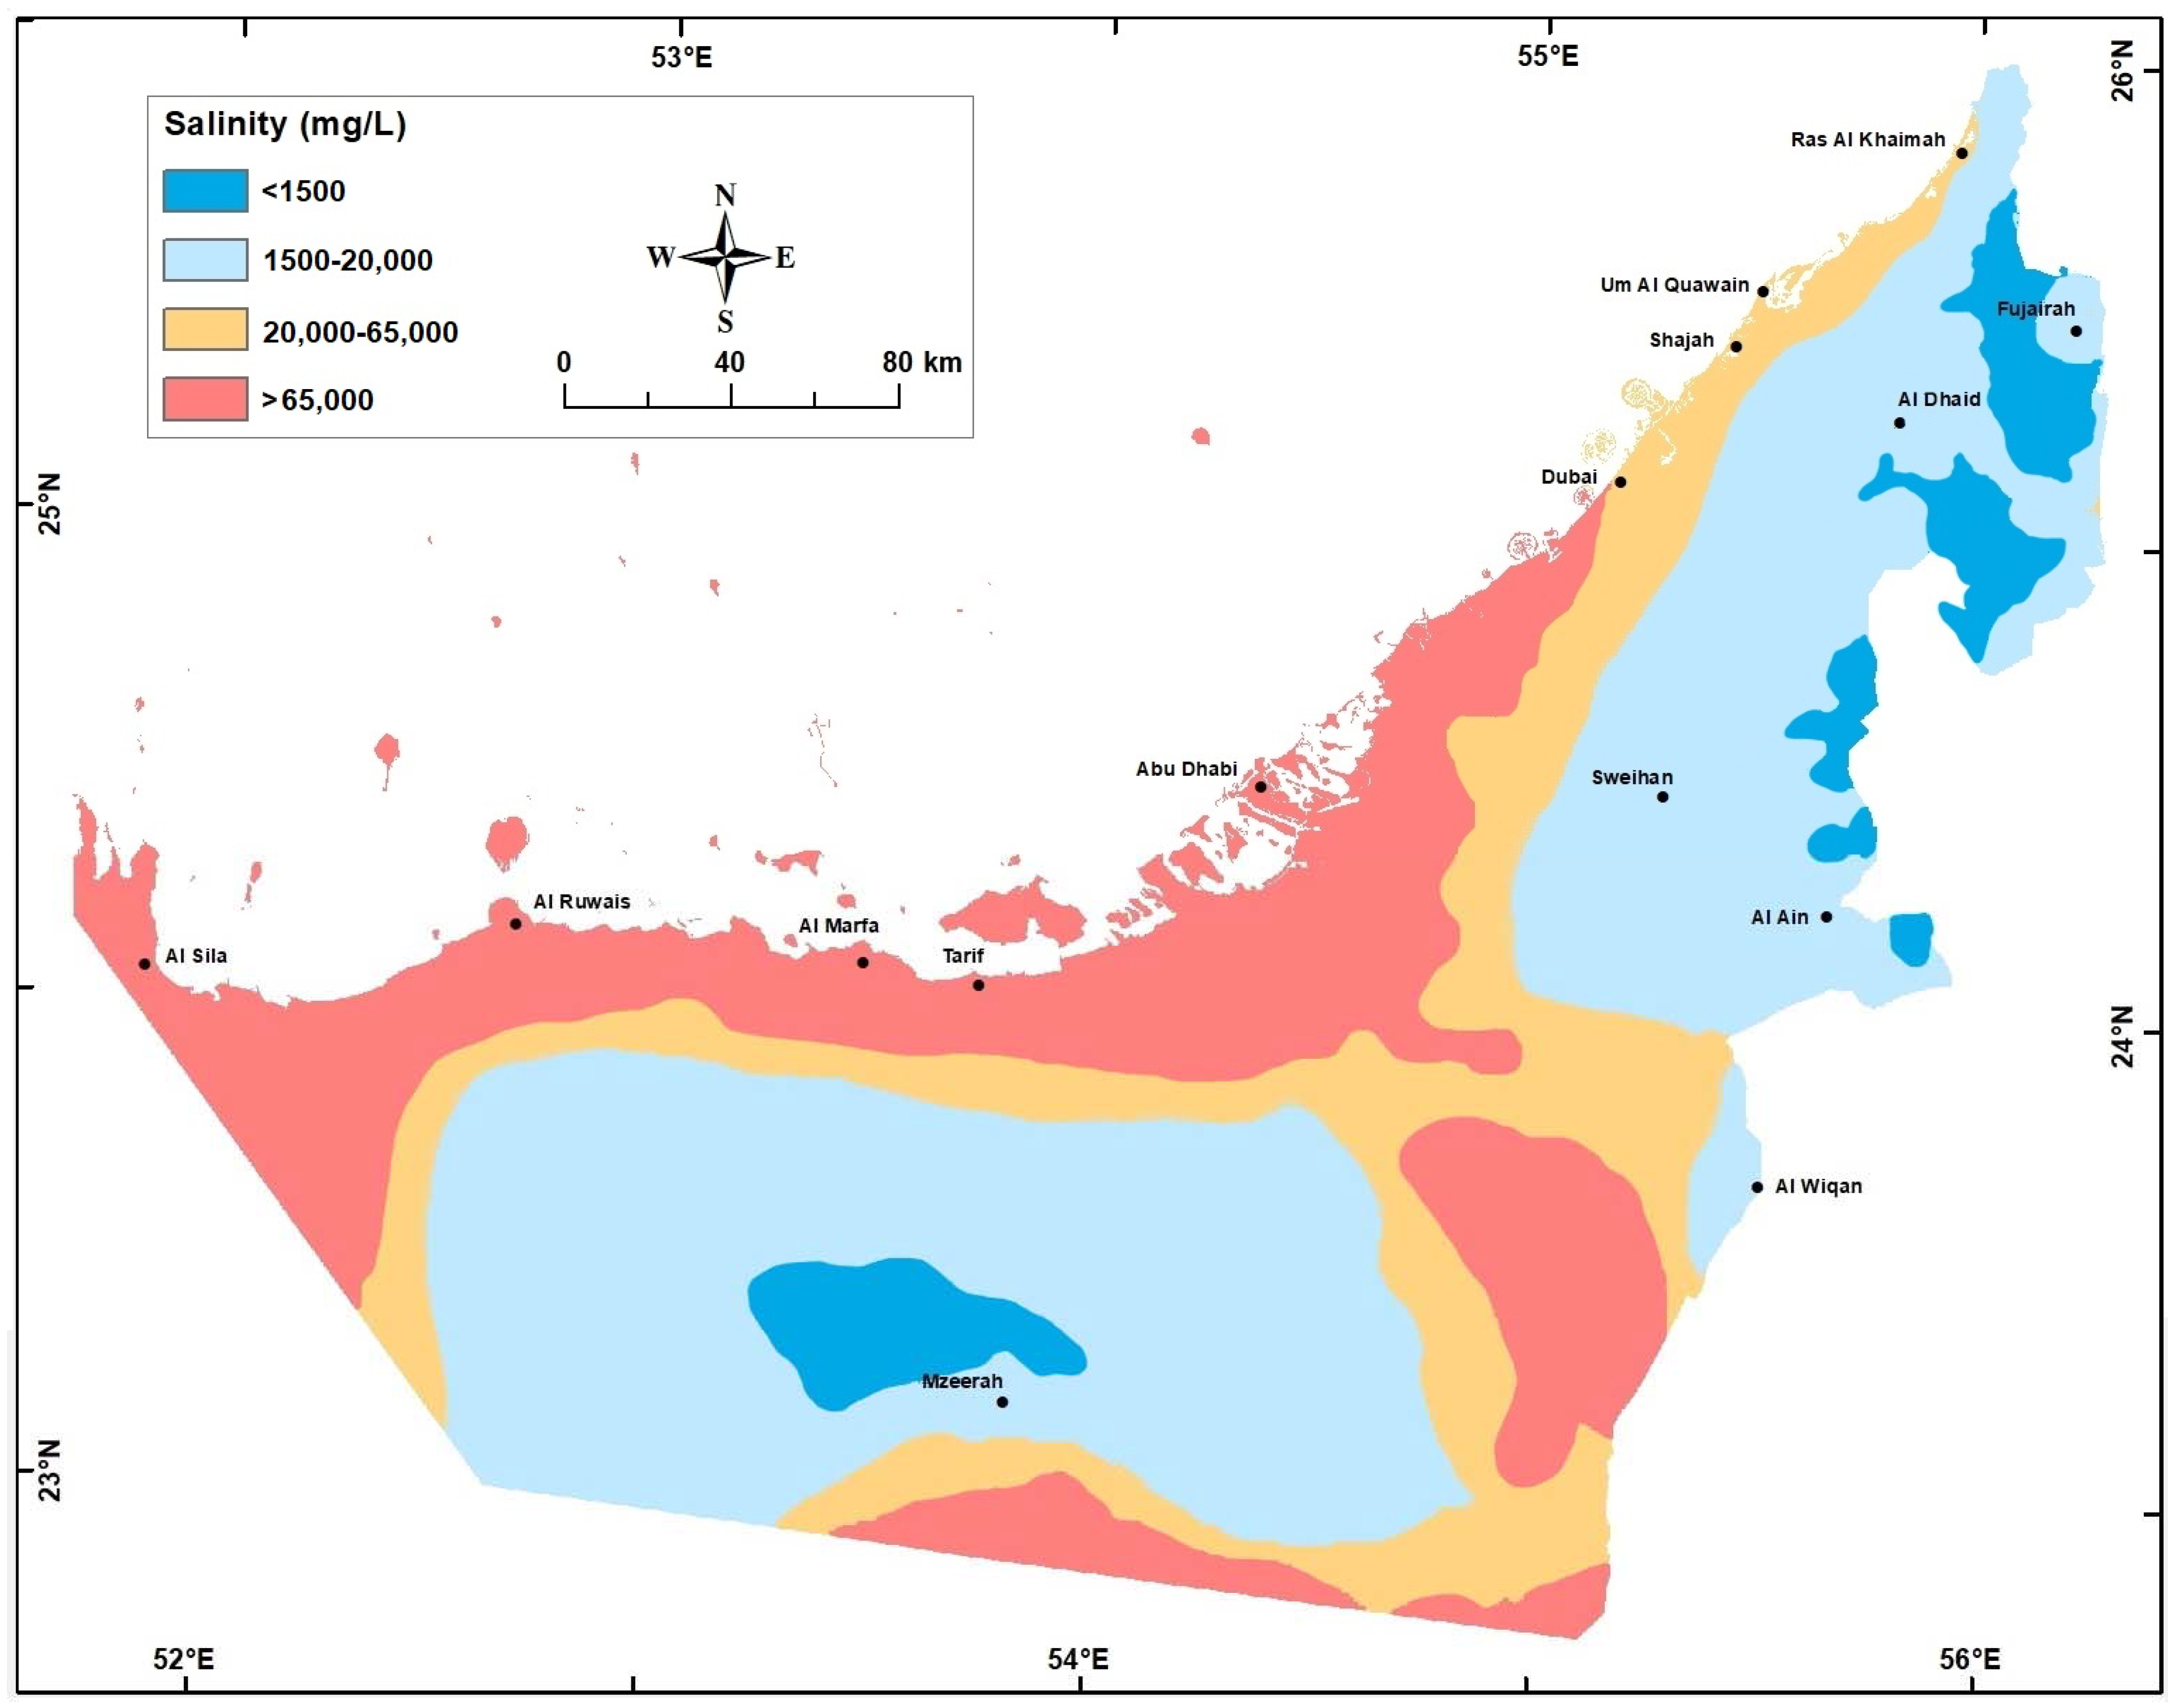
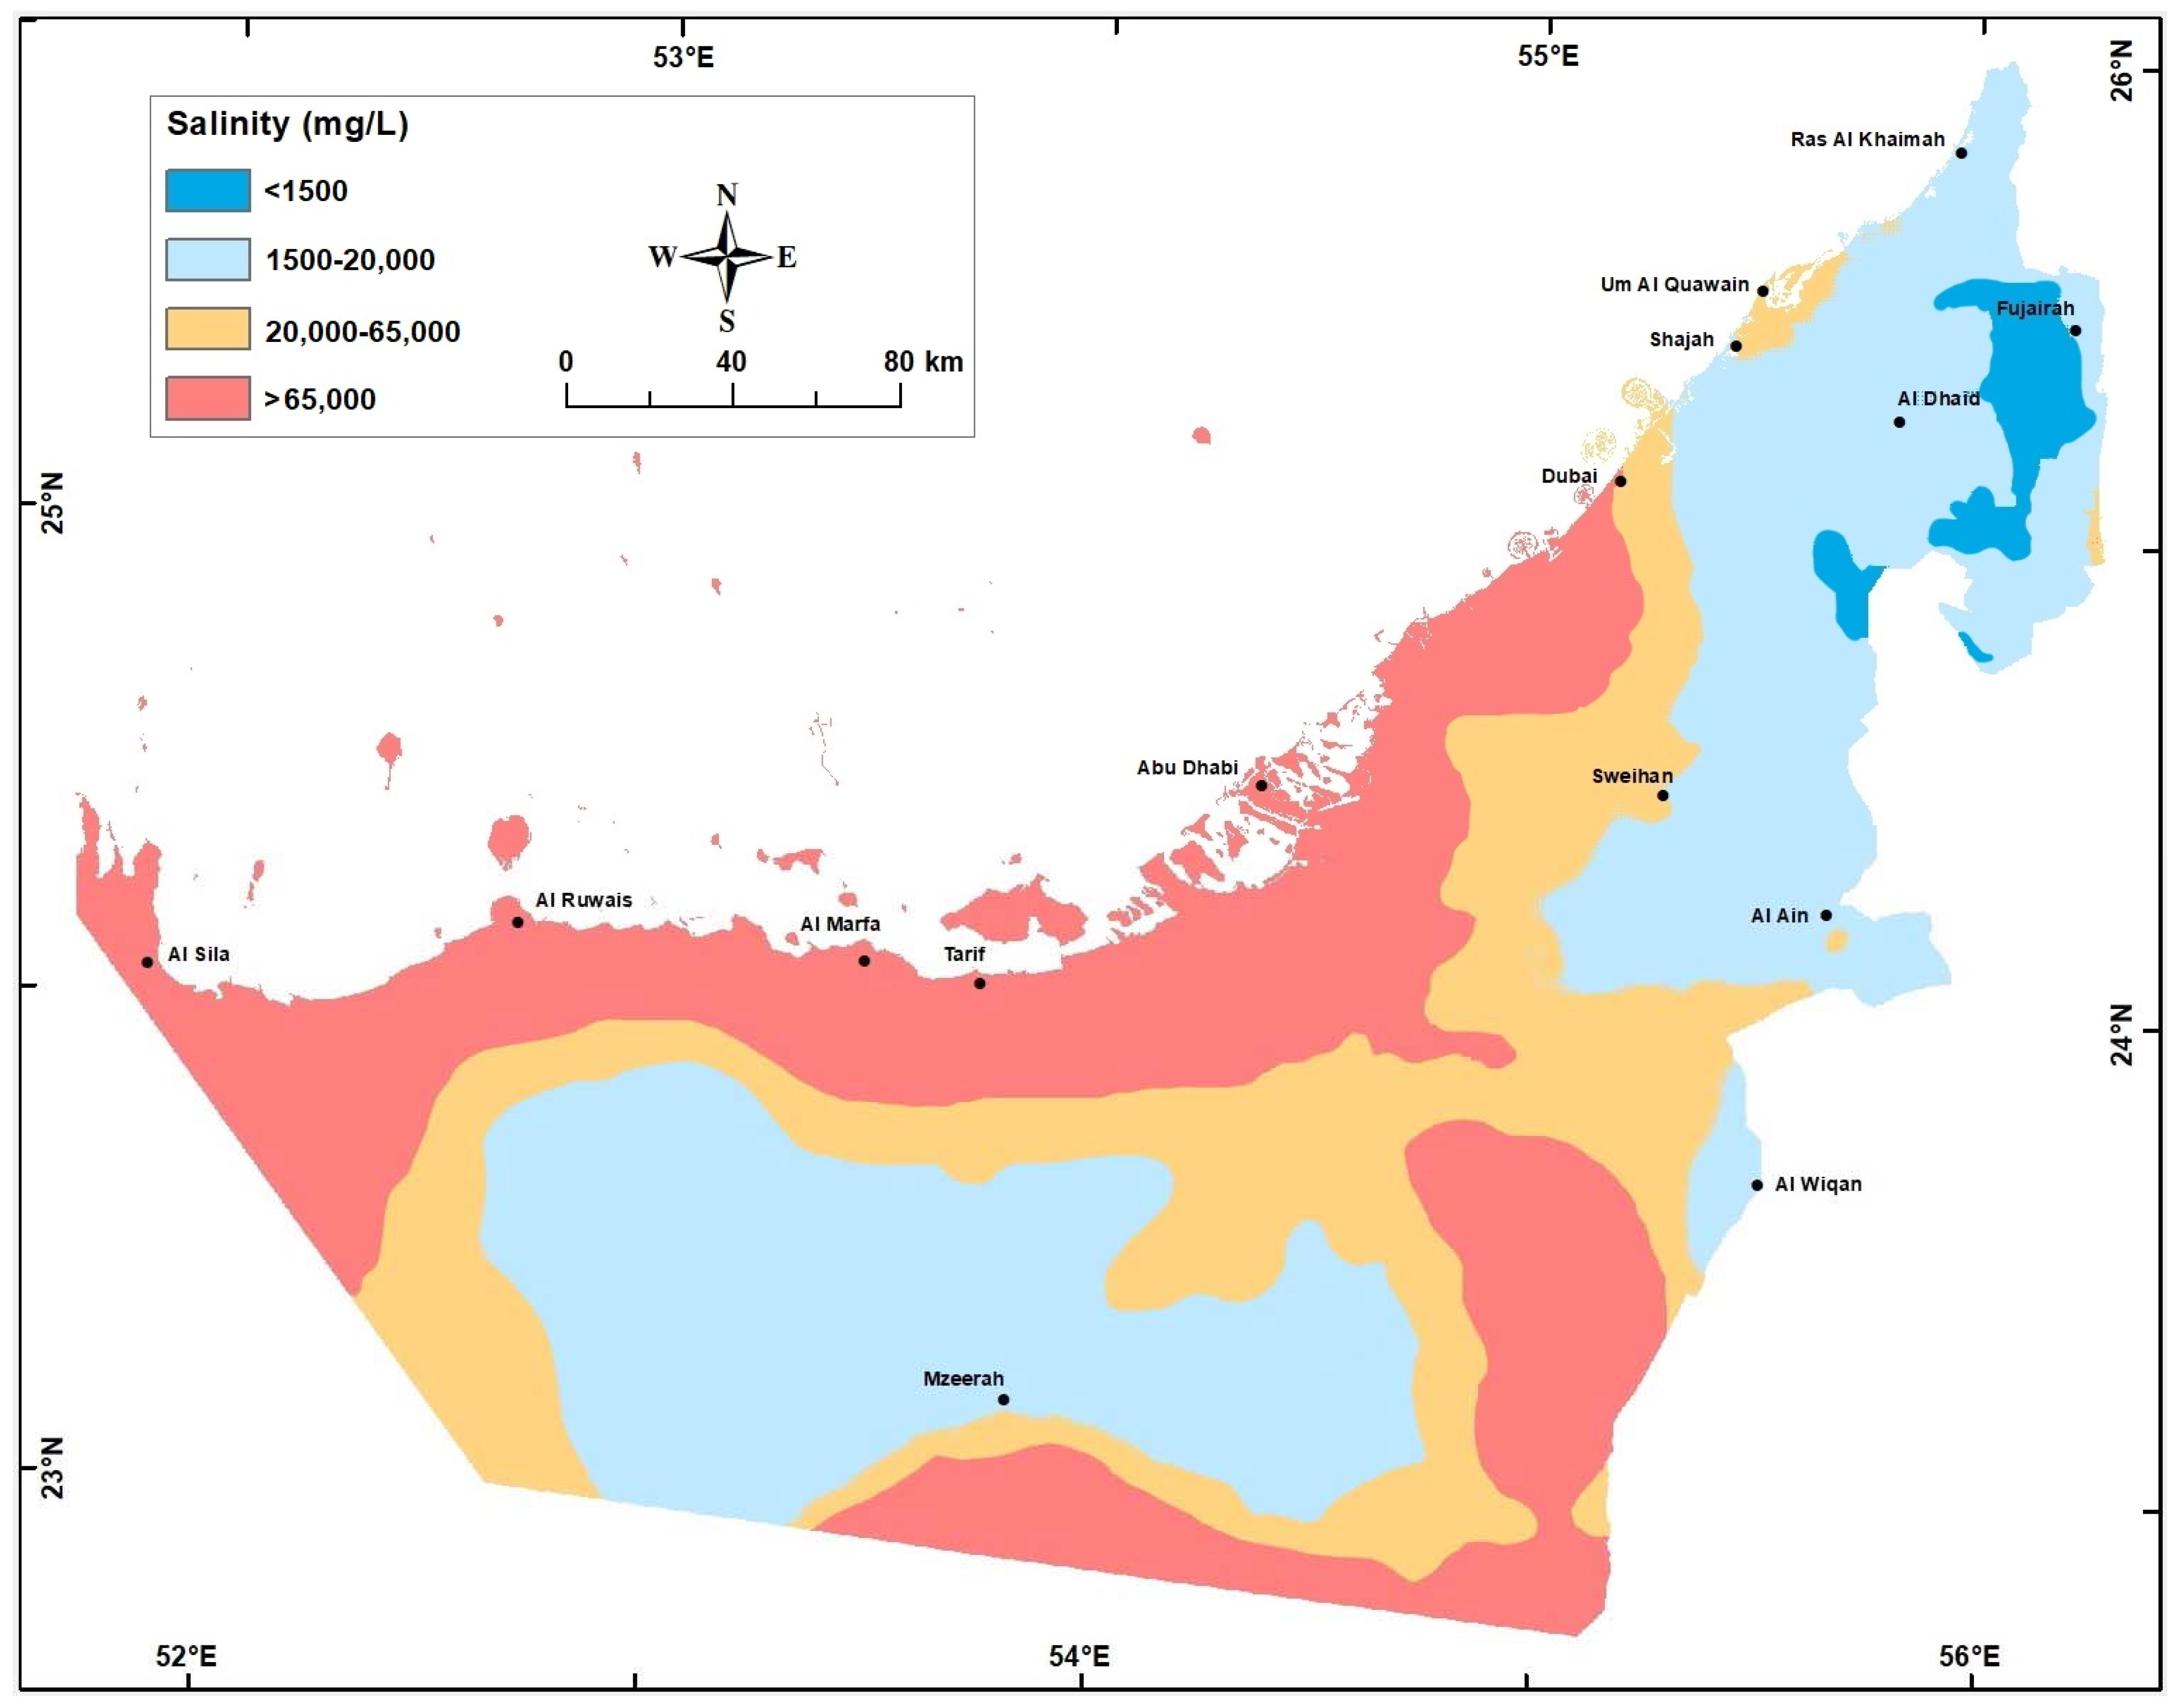
After updating the water resources data for the whole UAE, it was stored in a GIS database. The database included a thematic layer for each parameter (e.g., topographic elevation (mamsl); average annual total precipitation (mm); head (mamsl); water table depth (mbgl); Sy (%); K(m/d); aquifer base elevation (mamsl); soil type; land use; water infrastructure; geological units and structure; groundwater potentiality; aquifer type; TDS of 1969, 2005, 2010, and 2015 (mg/L); etc). Based on the spatial location, all these layers were related and joined into a single layer with one table of attribute (with one column for each parameter). Additional columns were added for saturated thickness and groundwater storage (in 1969, 2005, 2010, and 2015) to enable the calculation of groundwater storage of each water type (fresh/brackish/saline) for any area in UAE starting from 1 km2 to the whole area of UAE using the selection and querying modules of GIS. This thematic layer was used to create a thematic layer and/or raster map of each of the above-mentioned parameters for the whole UAE area or an individual area (examples are shown in Figure 9, Figure 10 and Figure 11). These maps were valuable for use in the GWBM, which was used for groundwater storage estimation and valuable for determining the areas with severe groundwater depletion and saltwater intrusion. The maps were also valuable for assigning initial and boundary conditions as well as calibration and validation procedures in flow and solute transport models. The visual comparison between these maps can immediately show the extent of saltwater intrusion through time and space.
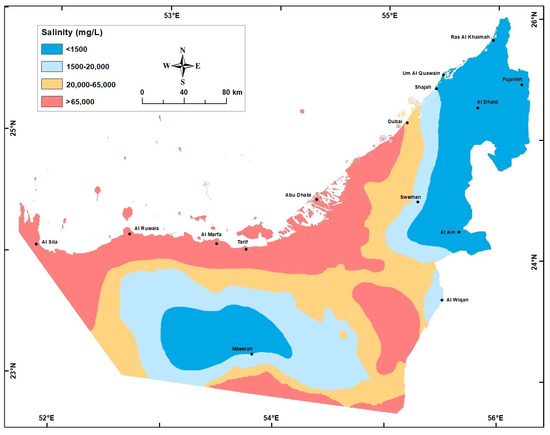
Figure 9.
Groundwater salinity (mg/L) in the Quaternary aquifer in 1969.
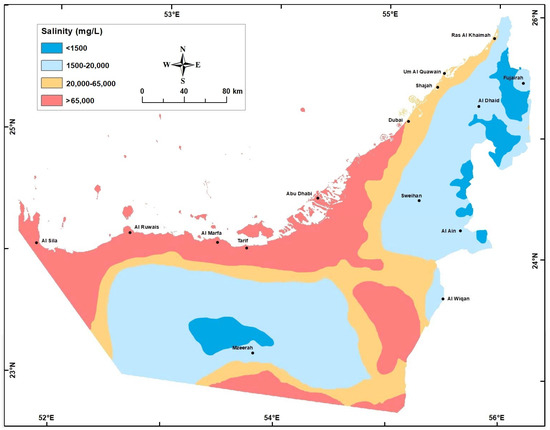
Figure 10.
Groundwater salinity (mg/L) in the Quaternary aquifer in 2005.
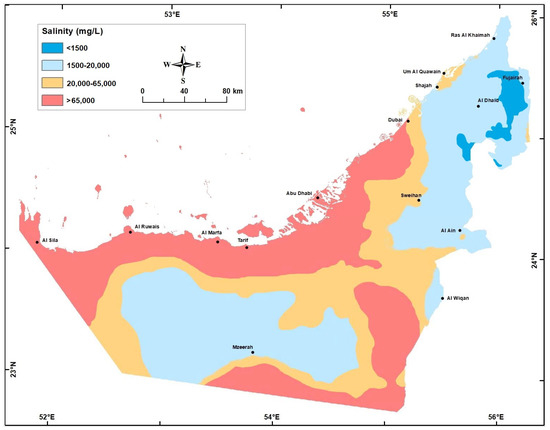
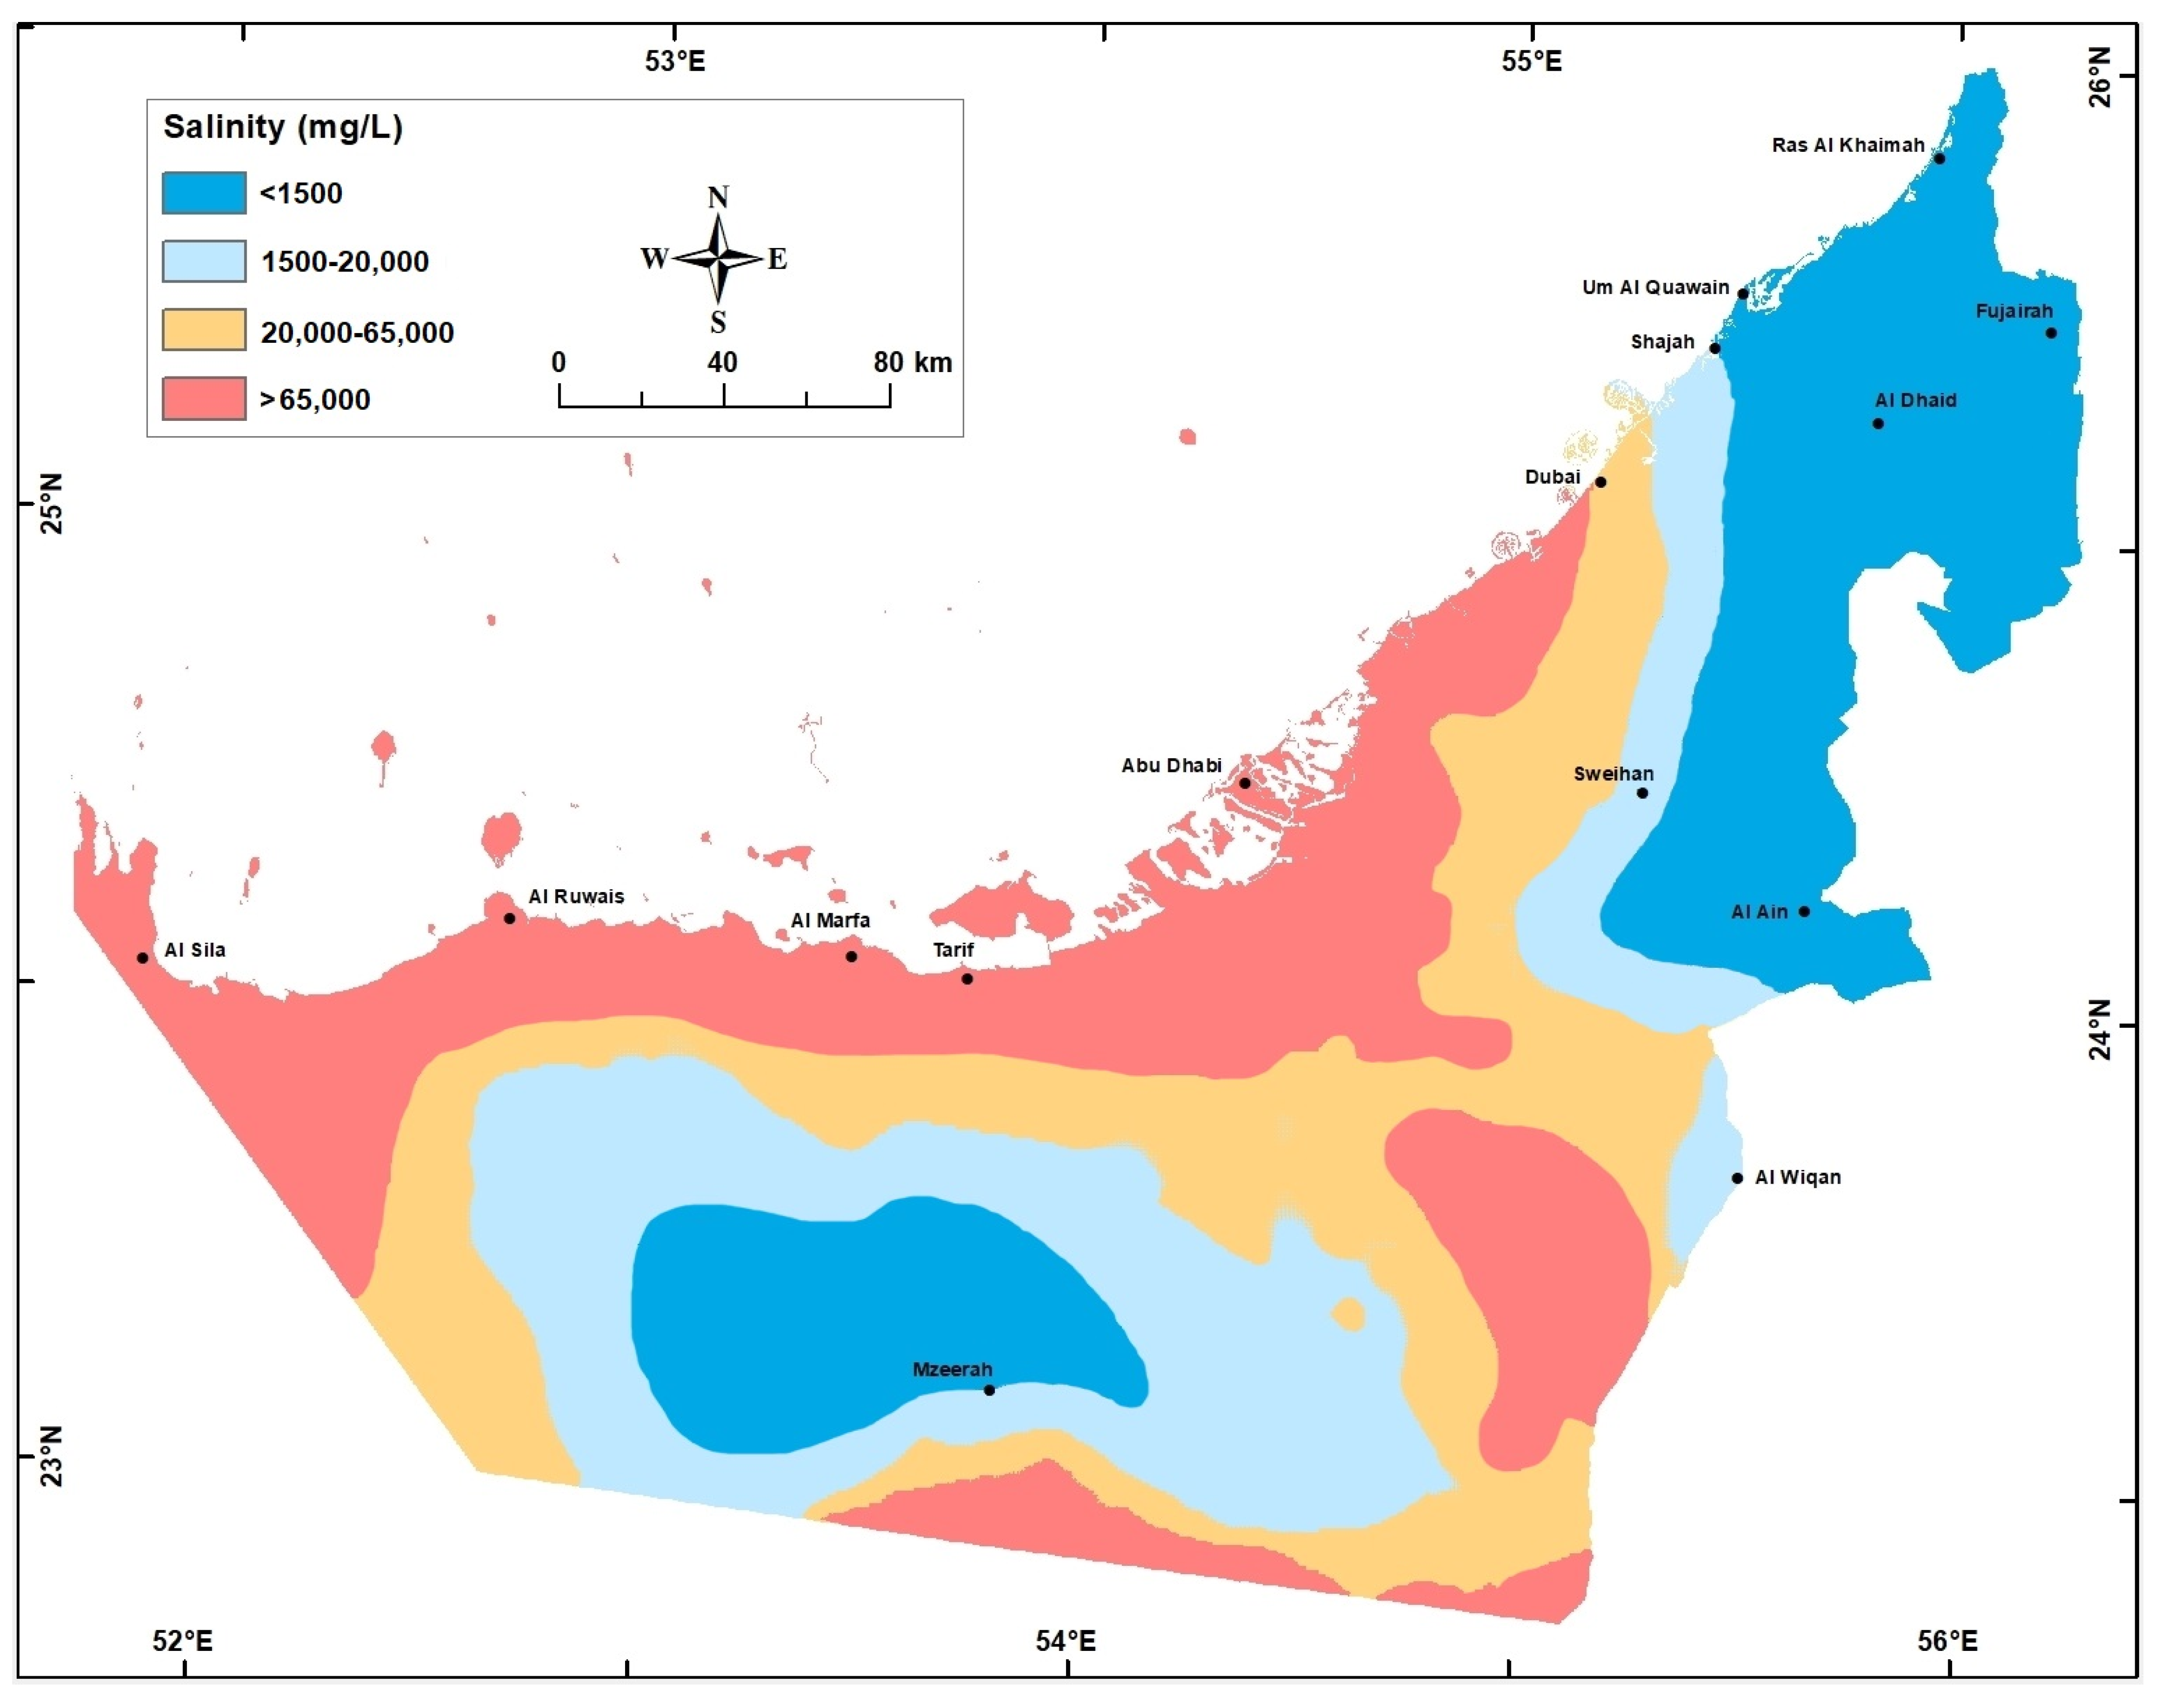
Figure 11.
Groundwater Salinity (mg/L) in the Quaternary aquifer in year 2015.
4.5. Groundwater Budget Model Results
Only the effective porosity portion of the safe yield was used for “storativity”; a value of 8–15% effective porosity was acceptable for fine to coarse sand. The assigned predevelopment groundwater salinity (Figure 9), the saturated thickness (m) in 1969, and Sy (%) for each grid cell (Figure 1) were plugged into Equation (9), to calculate groundwater storage at that cell in 1969 and its water type. The GIS calculator was used to calculate this for the 71,572 grid squares (Figure 1). A similar procedure was done for the years 2005, 2010, and 2015 using the salinity maps of these years. The obtained results are listed in Table 2.

Table 2.
Groundwater reserve in the Quaternary aquifer as calculated from GWBM (cubic kilometers) for years 1969, 2005, 2010, and 2015, in which the input data for WBM are available.
Consequently, the total volume of water (GWV) available in a certain area ranging from one km2 to the whole area of UAE was equal to
The obtained results for the year 2005 were compared to the results reported in [30]. The estimated groundwater reserve of all water qualities up to a maximum salinity of 65,000 mg/L in Abu Dhabi Emirate was 644 km3, which was a good match with the estimated volume in this study (660 km3). In addition, the estimated groundwater reserve up to a maximum salinity of 65,000 mg/L in Abu Dhabi emirate for the year 2015 was 622 km3, which was close to the volume of 606 km3 was reported in [31]. The estimation errors in the previous studies as well as in the present study lie in the range of 20% depending on the accuracy of measurement recorded from monitoring wells and accuracy of the pumping tests interpretation for Sy. The present study can be considered a novel study for UAE and provides valuable information for groundwater resources planning in the next 50 years.
There was a major change in groundwater salinity between year 1969 when the aquifer was under a steady-state condition and the present. During the last 5 decades, in some areas (e.g., Liwa crescent surrounding Mzeerah village, Al Ain, and Al Dhaid), intensive cones of depressions were developed accompanied with major salinity increase to the extent that water type changed from fresh to brackish to saline (Table 2, and Figure 9, Figure 10 and Figure 11).
The GWBM was not only used to calculate the available groundwater storage spatially and temporarily of each water type category (fresh/brackish/saline) but also used to calculate average annual groundwater abstraction for irrigation purposes. In UAE, the irrigation use (farms and forest, as shown in Figure 1) represented more than 95% of the total groundwater abstraction. The obtained value (2.3 BCM) was a very good match with the value (2.37 BCM) estimated using the thermal remote sensing data (PROBA-V AND VIIRS) in a recent study conducted by [32,33]. However, an irrigation volume of 2.854 BCM was also estimated based on representative irrigation averages estimated based on the inventory visits of representative farms [1,31]. Therefore, the abstraction rate for irrigation purposes ranged from 2.3 to 2.854 BCM per year. The agreement between the estimations obtained from the GWBM and the thermal remote sensing data might suggest that the lower limit (2.4 BCM) probably represented the accurate estimate.
The available monitoring wells in the carbonate aquifer were very few, and water level and electrical conductivity measurements were not enough to construct reliable potentiometric surface nor to construct groundwater salinity maps for this aquifer.
4.6. Recharge Estimation
Based on data availability and site conditions, various techniques can be used for estimating recharge (e.g., the Water Table Fluctuation Method (WTF), Potential Method, and numerical methods), the selection of which was not straightforward and, therefore, it was recommended to use multiple methods to reduce uncertainty. For example, WTF was typically used where short-term water-level rises occurred in unconfined aquifers after each individual storm due to recharge water arriving at the water table [34,35,36]. The accuracy of the estimate depended on the accuracy of the safe yield value (Sy) and water table measurements. In this study, the WTF method was only used in the northern part of UAE as the precipitation rate in the southern part of UAE was not enough to produce measurable fluctuations in the water table elevation. However, in the southern part of UAE, there was a reasonable volume of data to produce the geopotential maps needed for the application of the potential method, as discussed in detail in [25].
4.6.1. Water Table Fluctuation Method
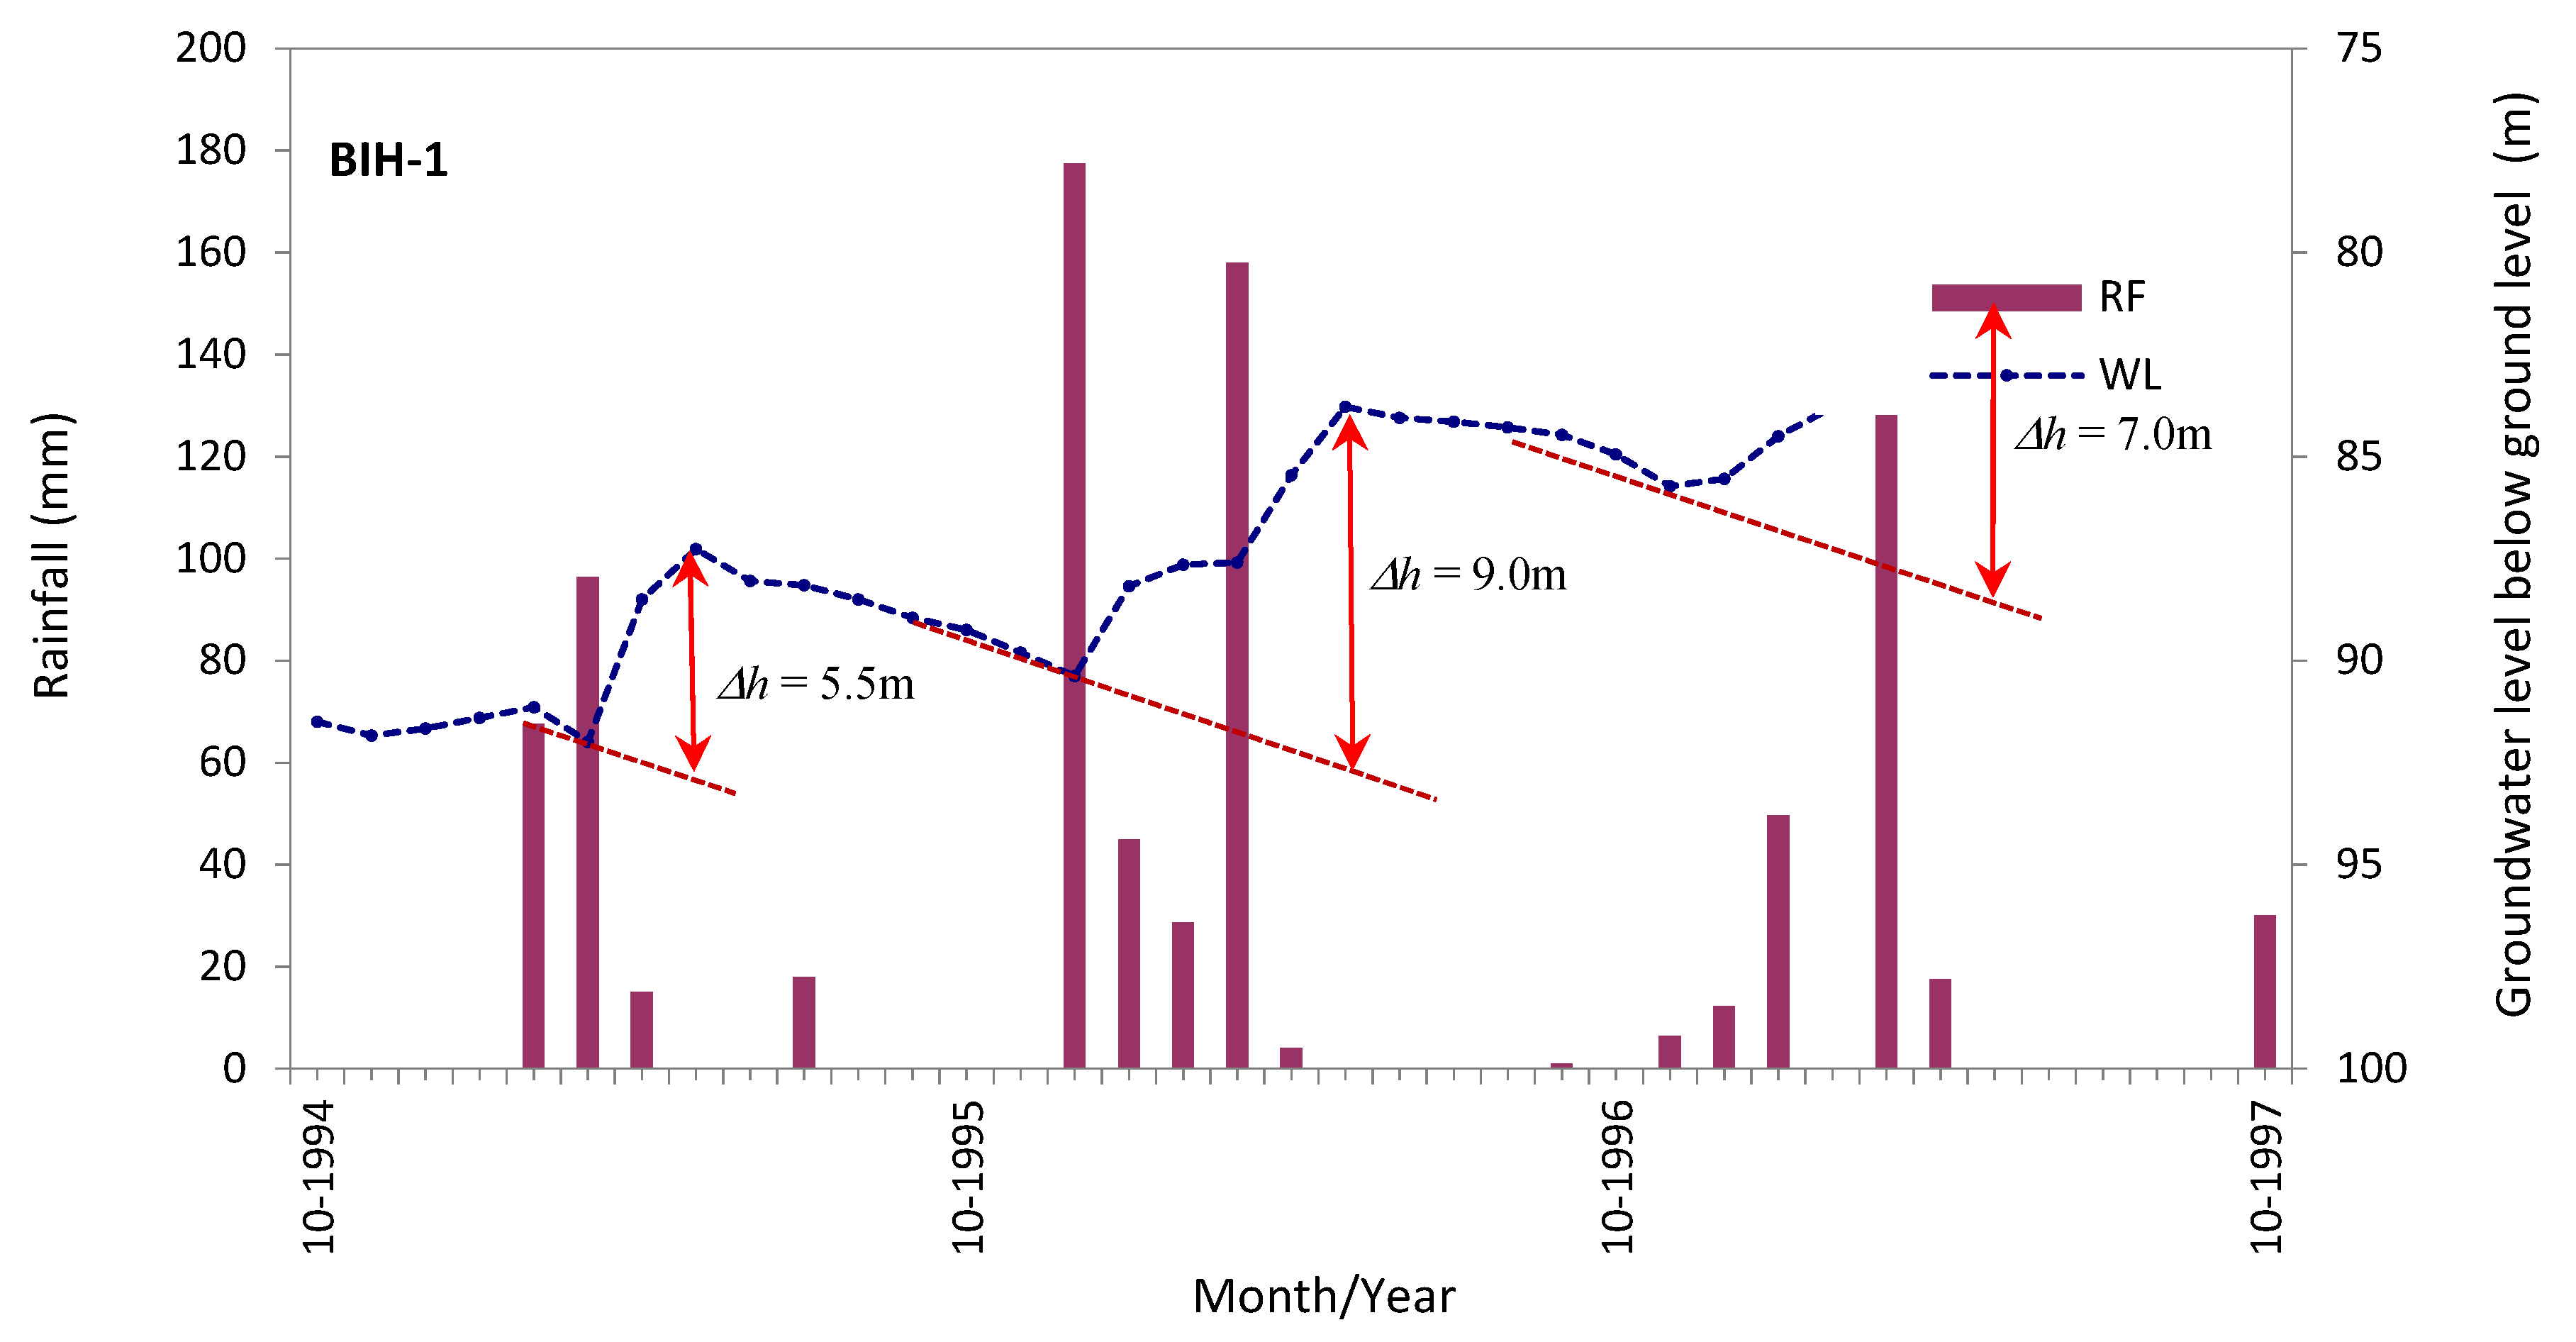
The WTF method was based on the premise that rises in groundwater levels in unconfined aquifers were due to recharge water arriving at the water table [25,35,37]. Recharge was calculated as:
where, Sy is specific yield, h is water-table height [L], and t is time [L] (an example is shown in Figure 12).
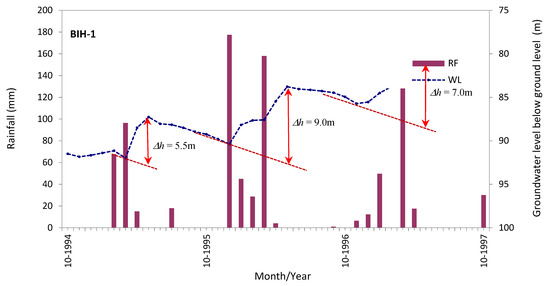
Figure 12.
An example of an isolated recharge events for recharge depth (∆h) estimation (Source: [24]).
4.6.2. Potential Method
In principle, the simplest methods used for estimating potential (gross) recharge R, is;
where IP is the infiltration percent (expressed as integers from 0 to 100) and P is the average annual precipitation rate in millimeters. Then this relationship was improved by [37], to the following empirical relationship to determine the groundwater recharge in limited climatological homogenous areas.
where ‘a’ is the recharge per cent (from 0 to 100) and ‘b’ is a constant. The values of ‘a’ and ‘b’ are assigned based on the precipitation rate.
Equation (12) was slightly modified by [25] to suit the UAE environment and also the limited database. Geopotential maps were constructed for infiltration rate, land use, soil types, and average annual precipitation. These raster maps were used to estimate potential groundwater recharge at each grid cell (1 km2) in UAE using the following equation [25].
where Ri is the potential recharge volume in cubic meters for cell i with an area Ai (1 km2). RPmax is the maximum reported natural (i.e., without any augmentation infrastructure) recharge from the annual rainfall in UAE, which was 20% in the alluvial gravels of the eastern region [12]. Pi is the average annual precipitation rate at cell i in mm. Ii, and Imax are the infiltration rate at cell i, and maximum infiltration rate reported for UAE in mm/hr, respectively. Cf is the sum of the contributions of the coefficients set for drainage intersections, and geological structure (DIGS), ground surface slope (GSS), lithology and soil type (LI), and land use (LU). The value of each coefficient ranged between 0 and 4% and thus Cf ranged between 0 and 16%, respectively. The developed geopotential maps and the application of this method in UAE was discussed in detail in [25], and the obtained results were used in the water budget model.
4.7. Desalinated Water Supply
Desalinated water was the major source of fresh water in many countries (e.g., the Gulf Countries), and thus it was considered as a supply component in the WBM. For example, the UAE had one of the most developed desalination production and distribution systems in the world. The first desalination plant was installed in Abu Dhabi in 1960 with a total capacity of 250 m3/day. Due to a rapid increase in domestic and industrial water demand, more plants were installed, particularly in Abu Dhabi and Dubai. According to the statistics published by the UAE Ministry of Energy and Infrastructure, the present total annual desalinated seawater is around 2.043 BCM (5.6 MCM/day) and contributes about 38% of the total water budget of the country (5.446 BCM in 2018). The contribution percent has been steadily growing from less than 10% in 1995, 21% in 2005, and currently around 38% [38,39,40,41].
4.8. Treated Wastewater Supply
Treated wastewater is increasingly becoming an important component of the water supply almost everywhere around the Globe. However, its uses are different from one country to another, depending on its treatment method and the availability of other freshwater resources. Presently, 92 wastewater treatment plants are present in the UAE. Most of the major treatment plants in the UAE use conventional treatment methods, including tertiary treatment. Currently, about 736 MCM water are being reclaimed, and 549 MCM are being reused for the public realm and landscape purposes [33].
5. Results and Discussion
5.1. Groundwater Annual Inflow and Outflow
5.1.1. Natural Groundwater Annual Inflow (Recharge)
Direct Rainwater Percolation: For this component, the Water Table Fluctuation Method (WTFM) from the physical category and Potential Recharge Method (PRM) from the numerical category were used to develop a groundwater recharge map for UAE as presented by [25]. In major wadis and associated gravel plain, where the water table rise due to each rainfall event can be estimated using WTFM, a very good match was obtained between the recharge values estimated by both methods. The obtained values were also calibrated using the values reported in previous studies for two small areas in the northern part of UAE. In a study given by [25,42], the total recharge to the surficial aquifer from direct rainwater percolation in UAE was estimated to be about 132 MCM/yr. This represents around 4% of the groundwater abstraction from the same aquifer for irrigation. As a result, the country’s main aquifer is depleting, and the water quality is affected. It should be noted, however, that other substantial sources of recharge were not considered by [25,43], including recharges from return flow, network leakage, and recharge above/below the mountains gaps as in the Al Ain area. The recharge rate ranges from less than 1% to around 42% of the precipitation, depending on the location and the available infrastructure for rainfall harvesting.
Recharge of the Groundwater Aquifers from Oman Mountains: According to [44], this kind of recharge is developed within drainage basins above the gaps in the mountainous areas. In such regions, runoff calculation along the gaps plays an essential role in evaluating the water-balance components upstream of the basins and in routing the flows downstream on the alluvial plain. The recharge is encountered principally as a transmission loss along the course of the wadis [45,46]. Most of the wadi recharge flows through bedrock fractures and subsequently fluxes into the fan deposits as subsurface mountain-front recharge [25,47]. A water-balance approach to estimate groundwater recharge in the ungagged basins of Oman and Abu Dhabi, in which a distributed transmission-loss for ephemeral streamflow in arid and semi-arid areas, was developed and calibrated by [43]. The total average annual recharge for the basins in the mountainous area of Al Ain was estimated to be about 55.3 MCM, mainly as transmission loss or internal flux along major wadis and below gaps across the western edge of the mountains.
From the last two points, it can be concluded that the total annual recharge from rainfall and internal flux is about 187 MCM.
5.1.2. Man-Made Groundwater Annual Inflow (Recharge)
Groundwater Fed Irrigation Return Flow: This is defined as the portion of artificially applied water, which was not consumed by evapotranspiration and returns to groundwater. The reported value for irrigation returns flow for Abu Dhabi Emirate (which is about 83% of the total area of UAE) was 501 MCM per year [41]. The same ratio of the volume of return flow to the volume of water used in irrigation in Abu Dhabi Emirate (15%) was used in this study to estimate the irrigation return flow in the northern part of UAE, and the resulted value was 99 MCM per year. It was estimated that out of 2764 MCM groundwater abstraction for irrigation, 600 MCM recharge the surficial aquifer as irrigation return flow [2].
Desalinated and TSE Water Fed Irrigation Return Flow and Domestic Network Losses: In some farms, desalinated seawater was used for irrigation. It was estimated that 58 MCM recharged the surficial aquifer as irrigation return flow out of about 230 MCM desalinated seawater used for irrigation in Abu Dhabi Emirate [43]. It was reported that out of about 549 MCM Treated Sewage Effluent (TSE) water used for landscape irrigation, 117 MCM recharged the surficial aquifer as irrigation return flow [2,43].
Additionally, it was also estimated that 10% of the produced desalinated seawater recharged the Quaternary (surficial) aquifer as water domestic network losses. Therefore, out of the 2043 MCM produced desalinated water, 204 MCM (10%) was added to the recharge component of the Quaternary aquifer. Therefore, the total annual recharge component from desalinated and TSE water was about 379 MCM. The addition of this value to groundwater-fed irrigation return flow (600 MCM) resulted in a value of 979 MCM for total recharge to surficial aquifer from return flow and network loess, which was more than five times the total annual recharge from rainfall and internal flux in the mountainous areas (187 MCM).
Groundwater outflow (discharge) can also be classified into natural outflow and man-made outflow:
5.1.3. Man-Made Groundwater Outflow (Discharge)
Farms and Cultivated Forests Irrigation: In a study by [41], an estimated volume of 1756 MCM was abstracted annually for farm irrigation in Abu Dhabi emirate. In addition to this amount, 248 MCM/year was abstracted for cultivated forestry irrigation and 60 MCM used in the amenity irrigation. An amount of 600 MCM was abstracted annually for farm irrigation in Dubai and Northern Emirates [2]. In addition to this volume, 100 MCM was used annually for irrigation in the amenity sector and cultivated forests in Dubai and Northern emirates.
Domestic and industrial use: Based on the same study and the study provided by [2], an estimated volume of 90 MCM was abstracted annually for domestic and industrial uses.
5.1.4. Natural Groundwater Outflow (Discharge)
Evaporation from Inland Sabkha: [14] Estimated the average annual evaporation rates from sabkha surfaces (based on field experiments) to be about 0.24 mm/d in the Abu Dhabi Municipality area and roughly 0.14 mm/day in western Abu Dhabi. Based on these values, the evaporation from sabkha in UAE was approximately 98 MCM per year.
Groundwater Outflow across Boundaries and to the Sea: The estimated groundwater outflow across the southeastern boundary was estimated to be about 9 MCM [41]. When the Quaternary aquifer was in the predevelopment time, there was a considerable groundwater component to the Arabian Gulf. Reference [41] used infrared thermal imaging techniques and estimated a value of 9 MCM/yr for groundwater seepage along the coastline in the northern emirates. After the development of major cones of depression due to intensive agricultural development starting from the mid-80s to the present, this resulted in a thick transition zone of brackish water, and the Ghyben–Herzberg equation was applicable in most areas [48,49]. Examples of these areas were the coastal zones of Sham, Ras Al Khaimah, Diba, and Al Fujairah. In the area between Ras Al Khaimah city and Sham, the discharged groundwater to the sea was predominantly brackish or saline water coming by upward coning from the carbonate (Hajar) aquifer. The coastal area in Abu Dhabi Emirate was mostly flat and made up of sabkhas sediment and groundwater was not discharged into the sea but was evaporated. However, due to the high topographic gradient and lithological composition of the Quaternary aquifer sediments on the east coast, the Ghyben–Herzberg equation was only applicable in some areas (Diba, outlet of wadi Ham). Therefore, groundwater seepage to the Oman Sea was mostly freshwater and cannot be neglected and was estimated by Lavalin (1980) to be around 9 MCM per year.
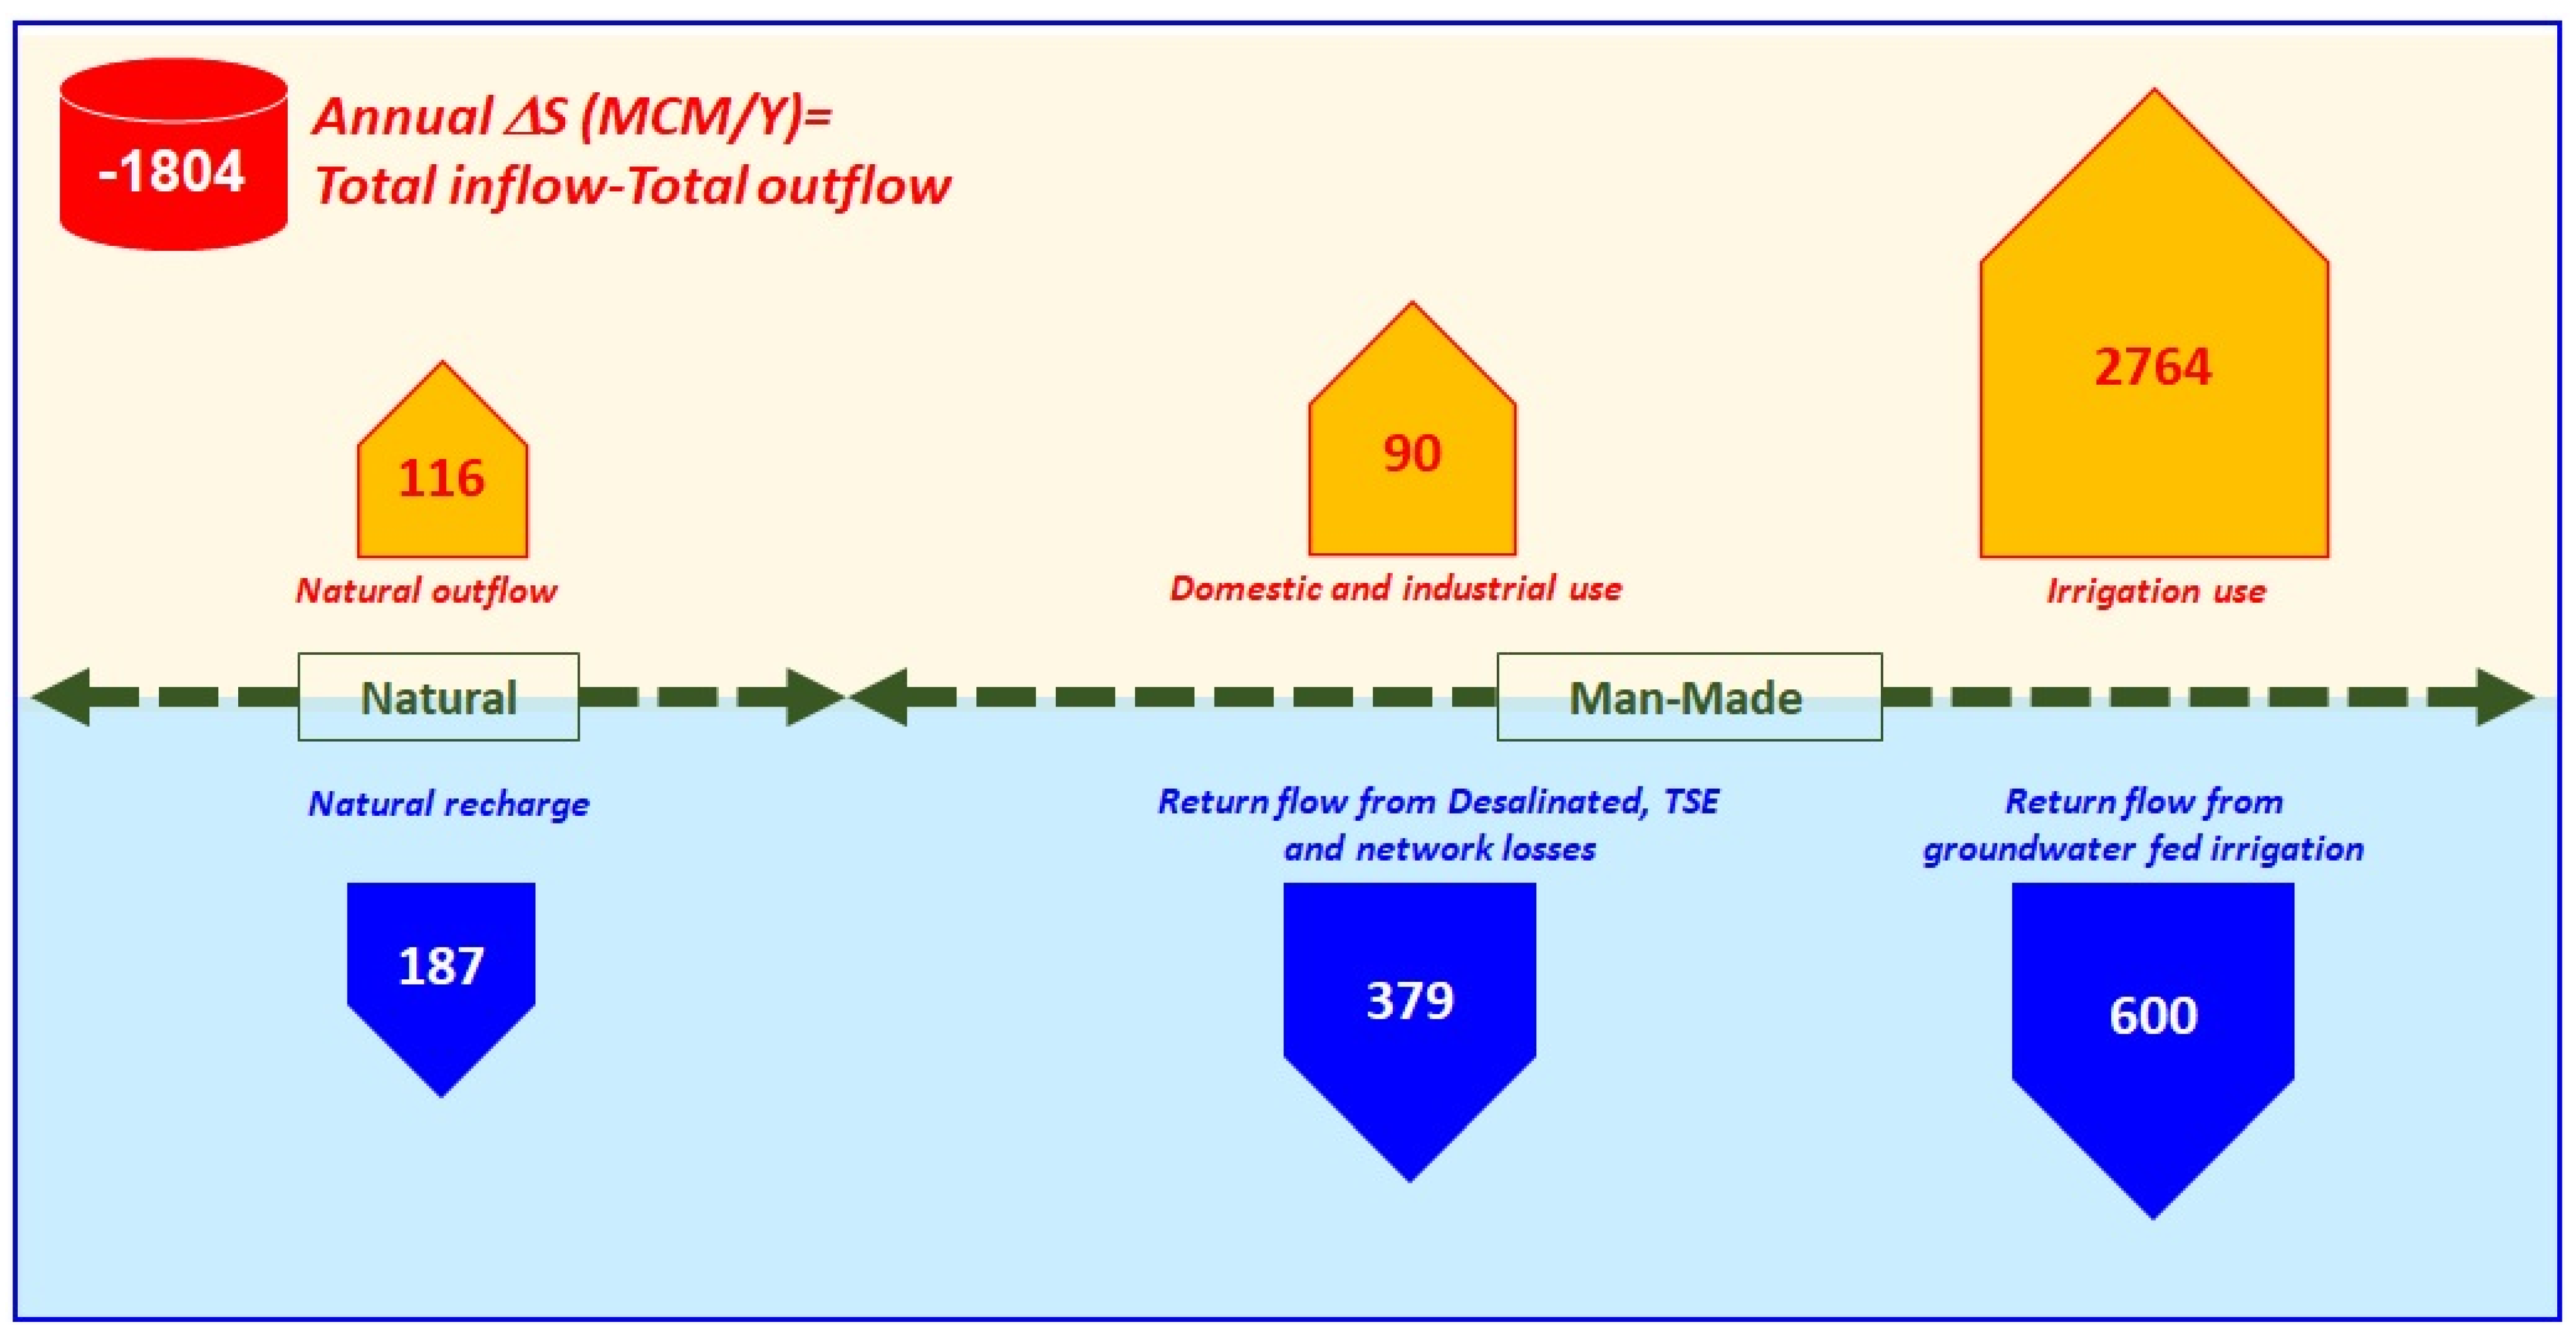
Figure 13 summarizes the inflow and outflow quantities to and from the surficial aquifer as discussed in the previous section. There was an annual deficit of 1804 MCM between the recharge to and discharge from the surficial aquifer. In other words, a volume of 1804 MCM is mined from the shallow aquifer annually, all of which was from the fresh to slightly brackish groundwater storage.
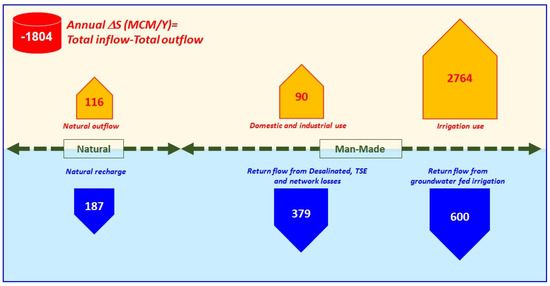
Figure 13.
Groundwater inflow and outflow from the surficial Aquifer in the UAE, considering all available budget components (all values are given in million cubic meters per year).
Groundwater was used in the agriculture, forestry, and domestic sectors (Table 3). If the annual decrease in groundwater storage was compared to the average total groundwater storage (fresh to saline types, 660 BCM), the depletion percentage would be only 0.28% annually. Since the major part of annual groundwater abstraction was from fresh groundwater storage, it should be compared to the present total fresh groundwater resources (only 10 BCM), which is a very alarming precursor indicating the critical situation in the supply of agricultural water. It is important to note that the parameters, which were used for the assessment of groundwater storage, were only approximately known, in particular, the effective porosity of the aquifer. Therefore, the calculated groundwater storage of each water type should be considered as an estimation.

Table 3.
Estimated present groundwater abstraction and recharge in the Quaternary aquifer.
6. Conclusions
This study represents a typical example of the water resources management challenges in the arid area. Despite the fact that groundwater depletion and salt-water intrusion problems are mostly irreversible as the current groundwater abstraction is far more than recharge in the arid areas, this study offers applicable solutions to these problems. The main solution is water conservation and demand management of the slightly brackish water and fresh water in the shallow and deep fossil aquifers.
In this study, an effort has been made to understand the UAE water resources system and to follow the temporal changes in the available groundwater resources as well as to determine the recharge sources (whether natural or man-made) to the shallow aquifer and their augmentation possibilities. The obtained results indicated that artificial recharge is almost five folds of natural recharge from rain. This is a very important result, which leads to the correct estimation of the deficit between groundwater abstraction for irrigation and the total recharge of the aquifers. This deficit is currently about 1.8 BCM per year. The estimated groundwater storage of all water type categories (fresh, brackish, saline, and brine) is about 660 BCM. If the deficit is compared to the total groundwater storage, then the depletion percentage is only 0.28% annually. If the comparison has been done to the fresh groundwater storage only (total salinity < 1500 mg/L), then a very alarming precursor indicating that the lifespan of fresh groundwater resources is less than 10 years. It also indicates how precious the slightly brackish to slightly saline water resources are, which are still plentiful in this aquifer.
Despite the fact that there is no feasible way to recharge this aquifer, except naturally (e.g., serval successive wet years), the sustainability of groundwater resources in this aquifer might be still possible, at least in some areas (for example, in the northern part of UAE) through managed aquifer recharge and freshwater demand management. The sustainable development of brackish water is also crucial. The sand dunes aquifer setting and characterization in the Liwa area surrounding Mzeerah village need detailed hydrogeological studies to determine the possible recharge sources.
The estimated natural recharge to the surficial aquifer is 187 MCM/year, which represents only 6.7% of the total annual groundwater abstraction (2764 MCM) indicate that there is a great opportunity to augment recharge from the rainwater accumulation behind the 145 recharge dams in UAE, through managed aquifer recharge (MAR) and intentional recharge. The developed GIS database for water resources in UAE for the period 1969 to present will be useful for conducting the feasibility study for the MAR method. In addition, this database, with its dynamic geopotential maps and useful information on the initial and boundary conditions of the aquifers, is crucial for modeling of water resources management alternatives and preparing the input information for the decision support system. The karstified limestone aquifer is a very potential aquifer, and the last major study of this aquifer was conducted by [11,12], and there is a need to study in detail this important aquifer. The sustainable management of freshwater resources in this aquifer could lead to achieving water security in the UAE.
Author Contributions
Conceptualization, M.S., A.S., A.A.E. and M.A.M.; methodology, A.S., A.A.E. and M.A.M.; software, A.S. and M.A.; validation, A.A.E., M.S. and M.A.M.; formal analysis, A.A.E. and K.A.; investigation, A.A.E. and M.A.M.; resources, M.A.; data curation, M.A.M.; writing—original draft preparation, A.A.E., A.S. and M.A.M.; writing—review and editing, M.S., A.A.E., M.A.M. and A.A.E.; visualization, A.S., K.A.; supervision, M.S.; project administration, M.S.; funding acquisition, M.S. All authors have read and agreed to the published version of the manuscript.
Funding
This research received no external funding.
Institutional Review Board Statement
Not Applicable.
Informed Consent Statement
Not Applicable.
Data Availability Statement
Restrictions apply to the availability of these data. Data was obtained from the Ministry of Energy and Industry, UAE, and are available AE with the permission of the Ministry of Energy and Industry, UAE.
Conflicts of Interest
The authors declare no conflict of interest.
References
- An, Z.; Porter, S.C.; Kutzbach, J.E.; Xihao, W.; Suming, W.; Xiaodong, L.; Xiaoqiang, L.; Weijian, Z. Asynchronous Holocene Optimum of the East Asian Monsoon. Quat. Sci. Rev. 2000, 19, 743–762. [Google Scholar] [CrossRef]
- HydroAtlas. UAE HYDROATLAS; Internal Report; National Water Center and Ministry of Energy and Industry: Al Ain, United Arab Emirates, 2015. [Google Scholar]
- AGEDI. Final Technical: Regional Desalination and Climate Change; LNRCCP. CCRG/IO.; AGEDI, Environment Agency: Abu Dhabi, United Arab Emirates, 2016. [Google Scholar]
- Kibaroglu, A. Natural Cooperation Facing Water Challenges in the Middle East MEI Policy; Paper 2016-8; The Middle East Institute: Washington, DC, USA, 2016. [Google Scholar]
- Hassan, A.A.; Al-Aidarous, A. Regional Aquifer Geology–Onshore Abu Dhabi; ADCO Project Report; Geology Department: Abu Dhabi, United Arab Emirates, 1985; pp. 1584–1650. [Google Scholar]
- Alsharhan, A.S. Petroleum Geology of the United Arab Emirates. J. Pet. Geol. 1989, 12, 253–288. [Google Scholar] [CrossRef]
- Ahmed, E.A.; Soliman, M.A.; Alsharhan, A.S.; Tamer, S.; Soliman, M.A.; Alsharhan, A.S.; Tamer, S. Mineralogical Characteristics of the Quaternary Sand Dunes in the Eastern Province of Abu Dhabi, United Arab Emirates. Available online: https://www.taylorfrancis.com/ (accessed on 16 November 2020).
- Al-Suwaidi, A.S.; Taher, A.K.; Alsharhan, A.S.; Salah, M.G. Stratigraphy and Geochemistry of Upper Jurassic Diyab Formation, Abu Dhabi, United Arab Emirates. In Middle East Models of Jurassic/Cretaceous Systems SEPM; Alsharhan, A.S., Scott, R.W., Eds.; Special Publication no. 69; Society for Sedimentary Geology: Tulsa, OK, USA, 2000; pp. 249–271. [Google Scholar]
- Sharland, P.R.; Casey, D.M.; Davies, R.B.; Simmons, M.D.; Sutcliffe, O.E. Arabian Plate Sequence Stratigraphy–Revisions to SP2. GeoArabia 2004, 9, 199–214. [Google Scholar]
- Robins, N.; Benham, A.J.; Mitchell, C.J. The Geology and Geophysics of the United Arab Emirates. Volume 3: Economic Geology and Hydrogeology; British Geological Survey: Nottingham, UK, 2006. [Google Scholar]
- Farrant, A.; Ellison, R.; Merritt, J.; Merritt, J.E.; Newell, A.; Lee, J.; Price, S.J.; Leslie, A.; Thomas, B. Geology of the Abu Dhabi 1:100 000 Map Sheet, 100–116, United Arab Emirates; British Geological Survey: Nottingham, UK, 2012. [Google Scholar]
- IWACO Ground Water Study Drilling of Deep Water Wells at Various Locations in the UAE, Groundwater Development in the Northern Agricultural Region; Internal Report; Ministry of Agriculture and Fisheries: Dubai, United Arab Emirates, 2010; Volume 7.
- NDC; USGS. Groundwater Research Project; National Drilling Company and USGS: Al Ain/Abu Dhabi, United Arab Emirates, 1996. [Google Scholar]
- Sanford, W.E.; Wood, W.W. Hydrology of the Coastal Sabkhas of Abu Dhabi, United Arab Emirates. Hydrogeol. J. 2001, 9, 358–366. [Google Scholar] [CrossRef]
- Ghoneim, E. Optimum Groundwater Locations in the Northern United Arab Emirates. Int. J. Remote Sens. 2008, 29, 5879–5906. [Google Scholar] [CrossRef]
- Hutchinson, C.; Al Aidrous, K.; Budebes, O. History of Water Resources Development in Abu Dhabi Emirate; Administrative Report; US Geological Survey: Reston, VA, USA, 1996; pp. 108–126. [Google Scholar]
- JICA. The Master Plan Study on the Groundwater Resources Development for Agriculture in the Vicinity of Al Dhaid, UAE; Internal Report; Japan International Cooperation Agency (JICA): Abu Dhabi, United Arab Emirates; Ministry of Environment and Water: Dubai, United Arab Emirates, 1996. [Google Scholar]
- Sherif, M.; Al Mahmoudy, A.; Garamoon, H.; Kasimov, A.; Akram, S.; Ebraheem, A.M.; Shetty, A. Geoelectrical and Hydrogeochemical Studies for Delineating Ground-Water Contamination Due to Salt-Water Intrusion in the outlet of Wadi Ham, UAE. Environ. Geol. 2006, 49, 536–551. [Google Scholar] [CrossRef]
- Ebraheem, A.; Al Mulla, M.; Sherif, M.; Awad, O.; Akram, S.; Al Suweidi, N.; Shetty, A. Mapping Groundwater Conditions in Different Geological Environments in the Northern Area of UAE Using 2D Earth Resistivity Imaging Survey. Environ. Earth Sci. 2014, 72, 1599–1614. [Google Scholar] [CrossRef]
- Alsharhan, A.S.; Rizk, Z.E. Water Resources and Integrated Management of the United Arab Emirates; World Water Resources; Springer International Publishing: Berlin/Heidelberg, Germany, 2020; ISBN 978-3-030-31683-9. [Google Scholar]
- Hadley, D.; Brouwers, E.; Brown, T. Quaternary Paleodunes, Arabian Gulf Coast, Abu Dhabi Emirate: Age and Paleoenvironmental Evolution; A.A. Balkema: Brookfield, VT, USA, 1998. [Google Scholar]
- Stokes, S.; Bray, H.E. Late Pleistocene Eolian History of the Liwa Region, Arabian Peninsula. Geol. Soc. Am. Bull. 2005, 117, 1466–1480. [Google Scholar] [CrossRef]
- Burns, S.J.; Matter, A.; Frank, N.; Mangini, A. Speleothem-Based Paleoclimate Record from Northern Oman. Geology 1998, 26, 499–502. [Google Scholar] [CrossRef]
- Rizk, Z.S.; Alsharhan, A.S. Water resources in the United Arab Emirates. In Developments in Water Science; Alsharhan, A.S., Wood, W.W., Eds.; Water Resources Perspectives: Evaluation, Management and Policy; Elsevier: Amsterdam, The Netherlands, 2003; Volume 50, pp. 245–264. [Google Scholar]
- Sherif, M.M.; Ebraheem, A.M.; Al Mulla, M.M.; Shetty, A.V. New System for the Assessment of Annual Groundwater Recharge from Rainfall in the United Arab Emirates. Environ. Earth Sci. 2018, 77, 412. [Google Scholar] [CrossRef]
- Wood, W.W.; Imes, J.L. Dating of Holocene ground-water recharge in western part of Abu Dhabi (United Arab Emirates): Constraints on global climate-change models. In Developments in Water Science; Elsevier: Amsterdam, The Netherlands, 2003; Volume 50, pp. 379–385. [Google Scholar]
- Styles, M.T.; Ellison, R.A.; Arkley, S.L.; Crowley, Q.; Farrant, A.R. The Geology and Geophysics of the United Arab Emirates; Goodenough, K.M., McKervey, J.A., Pharaoh, T.C., Phillips, E.R., Schofield, D., Thomas, R.J., Eds.; Geology, British Geological Survey: Nottingham, UK, 2006; Volume 2. [Google Scholar]
- Al Mulla, M.; Debebe, A.; Sherif, M.; Ebraheem, A.M.; Abdullah, M.; Qaiser, M. A GIS water resources and water budget system for an integrated management of water resources in UAE. In Proceedings of the 9th WSTA Annual Meeting, Muscat, Oman, 22–24 March 2010. [Google Scholar]
- Halcrow and Partners. Report on the Water Resources of the Trucial States; Water Resources Survey; Trucial States Council: Abu Dhabi, United Arab Emirates, 1969. [Google Scholar]
- EAD and GTZ. Status Report Phases 1Xa, 1Xb and 1Xc for Groundwater Assessment Project Abu Dhabi; Internal Report; Abu Dhabi Environment Agency: Abi Dhabi, United Arab Emirates, 2005. [Google Scholar]
- EAD. Economic Valuation of Groundwater in the Abu Dhabi Emirate; Environment Agency: Abu Dhabi, United Arab Emirates, 2016. [Google Scholar]
- ICBA and MOEI. Estimate of Groundwater Abstraction for Farm Irrigation in the United Arab Emirates; Internal Report; Ministry of Energy and Infrastructure: Dubai, United Arab Emirates, 2018. [Google Scholar]
- MOEI. The Annual Statistical Report of Year 2018; Internal Report; Ministry of Energy and Industry: Dubai, United Arab Emirates, 2018. [Google Scholar]
- Sharda, V.; Kurothe, R.; Sena, D.; Pande, V.; Tiwari, S. Estimation of groundwater recharge from water storage structures in a semi-arid climate of India. J. Hydrol. 2006, 329, 224–243. [Google Scholar] [CrossRef]
- Crosbie, R.S.; James, L.; McCallum, J.L.; Glenn, A.H. Estimation of groundwater recharge and discharge across northern Australia. In Proceedings of the 18th World IMACS/MODSIM Congress, International Congress on Modelling and Simulation: Interfacing Modelling and Simulation with Mathematical and Computational Sciences, Cairns, QLD, Australia, 13–17 July 2009; pp. 3053–3059. [Google Scholar]
- Healy, R.W.; Cook, P.G. Using groundwater levels to estimate recharge. Hydrogeol. J. 2002, 10, 91–109. [Google Scholar] [CrossRef]
- Sophocleous, M. Groundwater recharge estimation and regionalization: The Great Bend Prairie of central Kansas and its recharge statistics. J. Hydrol. 1992, 137, 113–140. [Google Scholar] [CrossRef]
- EAD. Abu Dhabi Water Resources Master Plan; Environment Agency: Abu Dhabi, United Arab Emirates, 2009. [Google Scholar]
- Brook, M.C.; Al Houqani, H.; Dawoud, M. The Opportunities for Water Resources Management in the Emirate of Abu Dhabi, United Arab Emirates. In Proceedings of the 7th Gulf Water Conference, Kuwait City, Kuwait, 19–23 November 2005. [Google Scholar]
- Brook, M.C.; Al Houqani, H.; Al Mugrin, A. The current status and future requirements of water resources management in the Arabian Peninsula. In Policy Perspectives for Water and Ecosystem Management in the Arabian Peninsula; Internal Report; EAD: Abu Dhabi, United Arab Emirates, 2005. [Google Scholar]
- EAD. Groundwater Atlas of Abu Dhabi Emirate; Environment Agency: Abu Dhabi, United Arab Emirates, 2018. [Google Scholar]
- Lavalin Inc.; Gulf Agricultural Development. Report on the Discovery of Submarine Springs Using Infrared Thermal Imagery; Internal Report; Former Ministry of Agriculture and Fisheries: Dubai, United Arab Emirates, 1980. [Google Scholar]
- Sherif, M.; Ebraheem, A.; Shetty, A. Groundwater Recharge from Dams in United Arab Emirates. In Proceedings of the World Environmental and Water Resources Congress 2017, Sacramento, CA, USA, 21–25 May 2017; American Society of Civil Engineers: Reston, VA, USA, 2017; pp. 139–146. [Google Scholar]
- Osterkamp, W.; Lane, L.; Menges, C. Techniques of ground-water recharge estimates in arid/semi-arid areas, with examples from Abu Dhabi. J. Arid. Environ. 1995, 31, 349–369. [Google Scholar] [CrossRef][Green Version]
- Wood, W.W.; Rizk, Z.S.; Alsharhan, A.S. Timing of recharge, and the origin, evolution and distribution of solutes in a hyperarid aquifer system. In Developments in Water Science; Elsevier: Amsterdam, The Netherlands, 2003; Volume 50, pp. 295–312. [Google Scholar]
- Woods, W.W.; Imes, J.L. How wet is wet? Precipitation constraints on late quaternary climate in the southern Arabian Peninsula. J. Hydrol. 1995, 164, 263–268. [Google Scholar] [CrossRef]
- Wood, W.W. Source of paleo-groundwater in the Emirate of Abu Dhabi, United Arab Emirates: Evidence from unusual oxygen and deuterium isotope data. Hydrogeol. J. 2010, 19, 155–161. [Google Scholar] [CrossRef]
- Ghyben, B.W. Nota in verband met der voorgenomen putboring nabij Amsterdam. Tijdschr. Kon. Inst. Ing. 1888, 9, 8–22. [Google Scholar]
- Herzberg, A. Die Wasserversorgung Einiger Nordseebäder; J. Gasbeleucht. Wasserversorg: München, Germany, 1901; Volume 44, pp. 815–819, 842–844. [Google Scholar]
Publisher’s Note: MDPI stays neutral with regard to jurisdictional claims in published maps and institutional affiliations. |
© 2021 by the authors. Licensee MDPI, Basel, Switzerland. This article is an open access article distributed under the terms and conditions of the Creative Commons Attribution (CC BY) license (http://creativecommons.org/licenses/by/4.0/).

