
Assessment of the Impacts of Land Use Change on Non-Point Source Loading under Future Climate Scenarios Using the SWAT Model


Abstract
1. Introduction
2. Materials and Methods
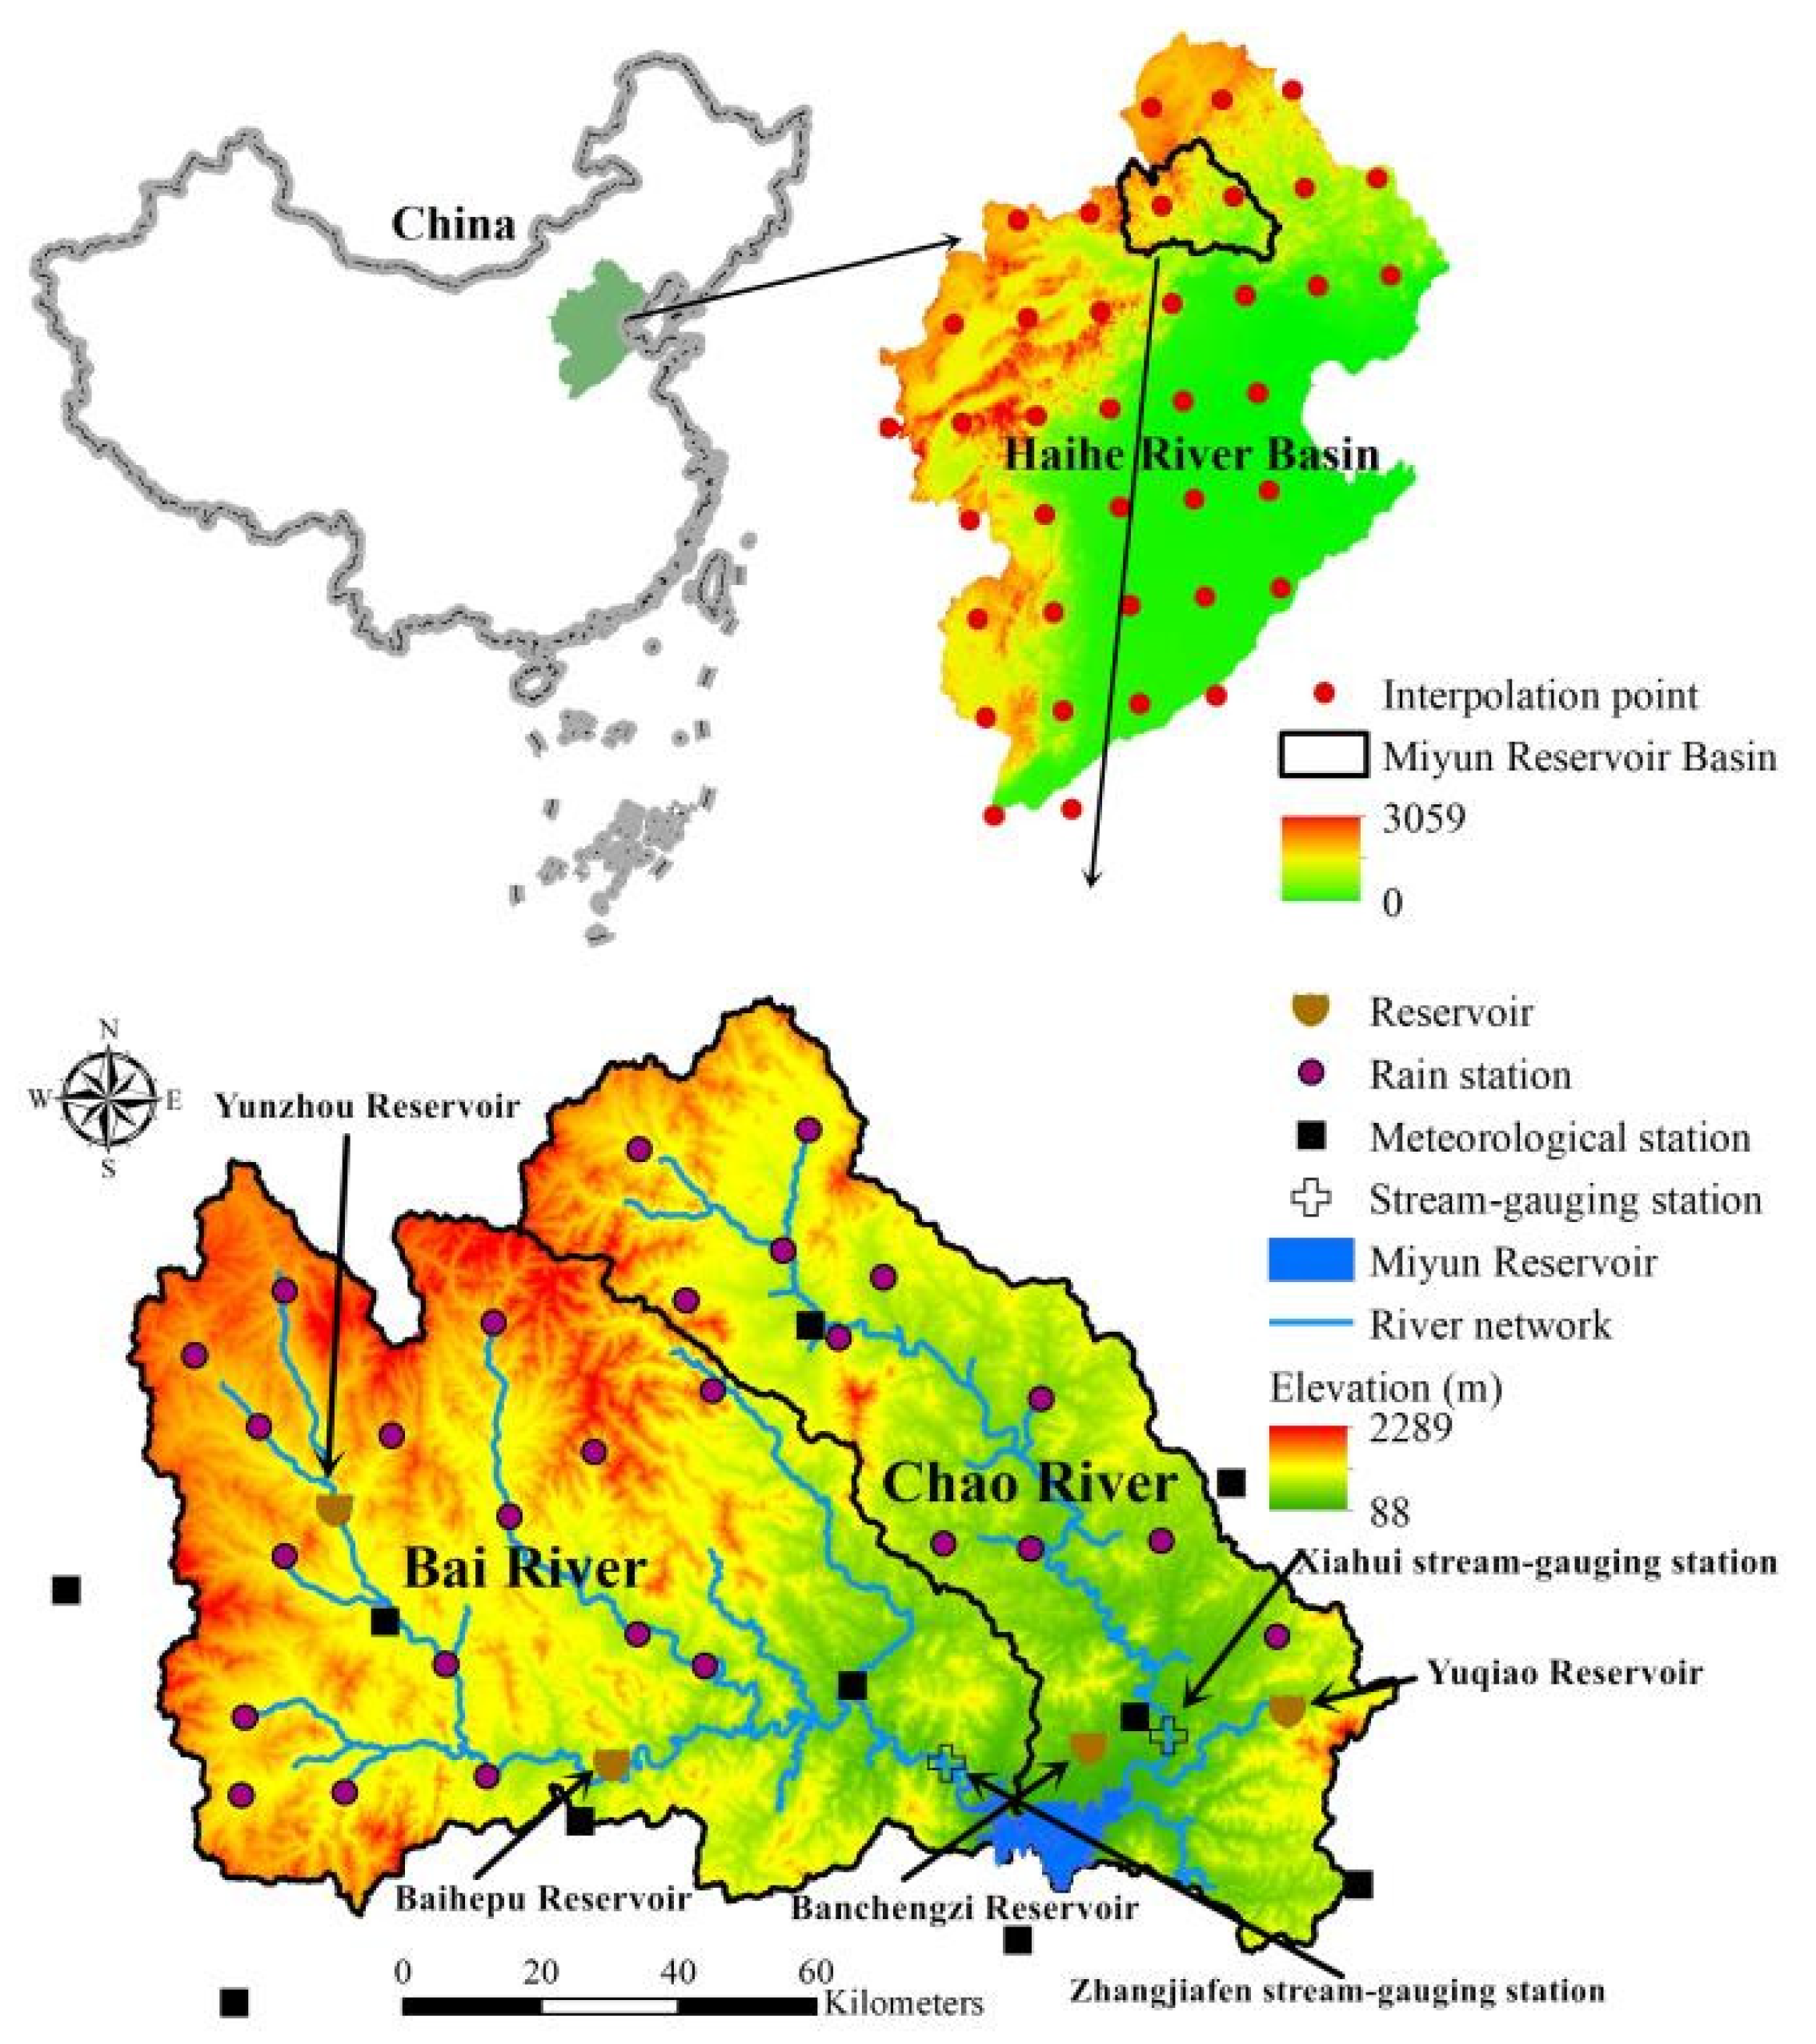
2.1. Study Area
2.2. Data Collection
2.3. Historical Land Use Change
2.4. Research Methodology
2.4.1. Future Climate Data Corrected by Quantile Mapping Methods
2.4.2. Land Use Change Model
2.4.3. Hydrological and Water Quality Modeling
3. Results and Discussion
3.1. Model Calibration and Validation
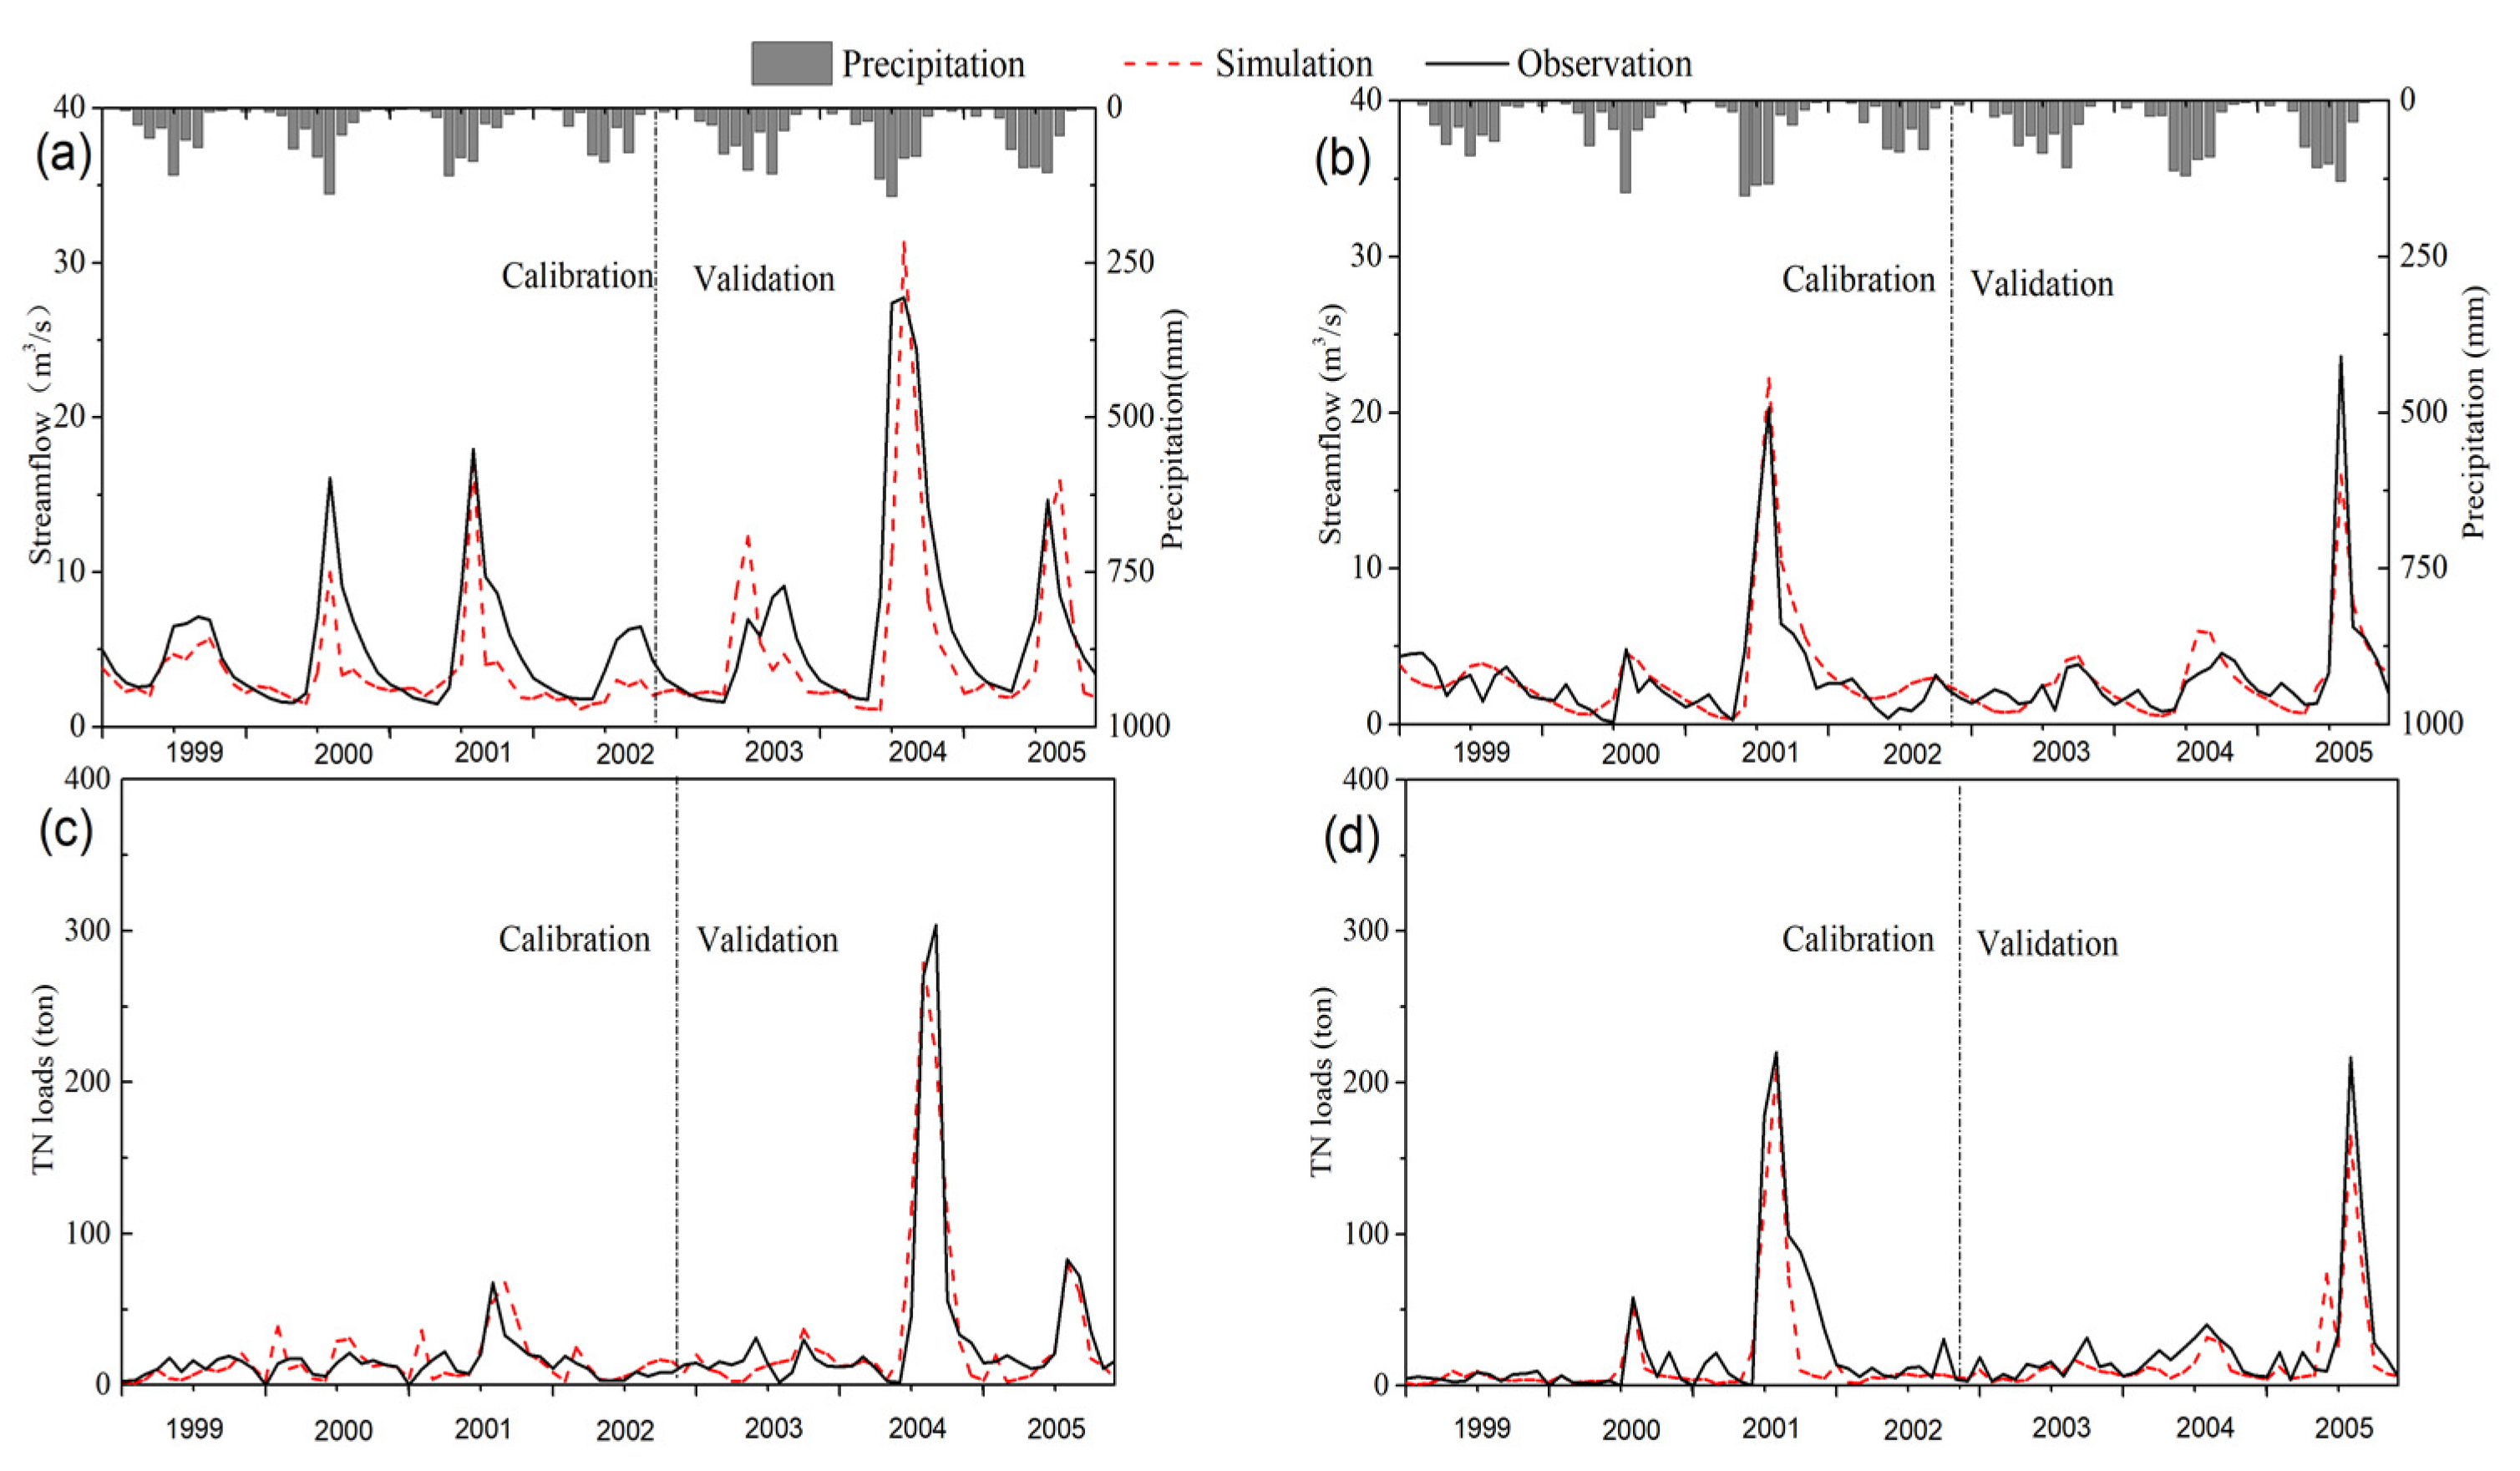
3.1.1. SWAT Model Calibration and Validation
3.1.2. CLUE-S Model Calibration and Validation
3.2. Future Climate Change Analysis
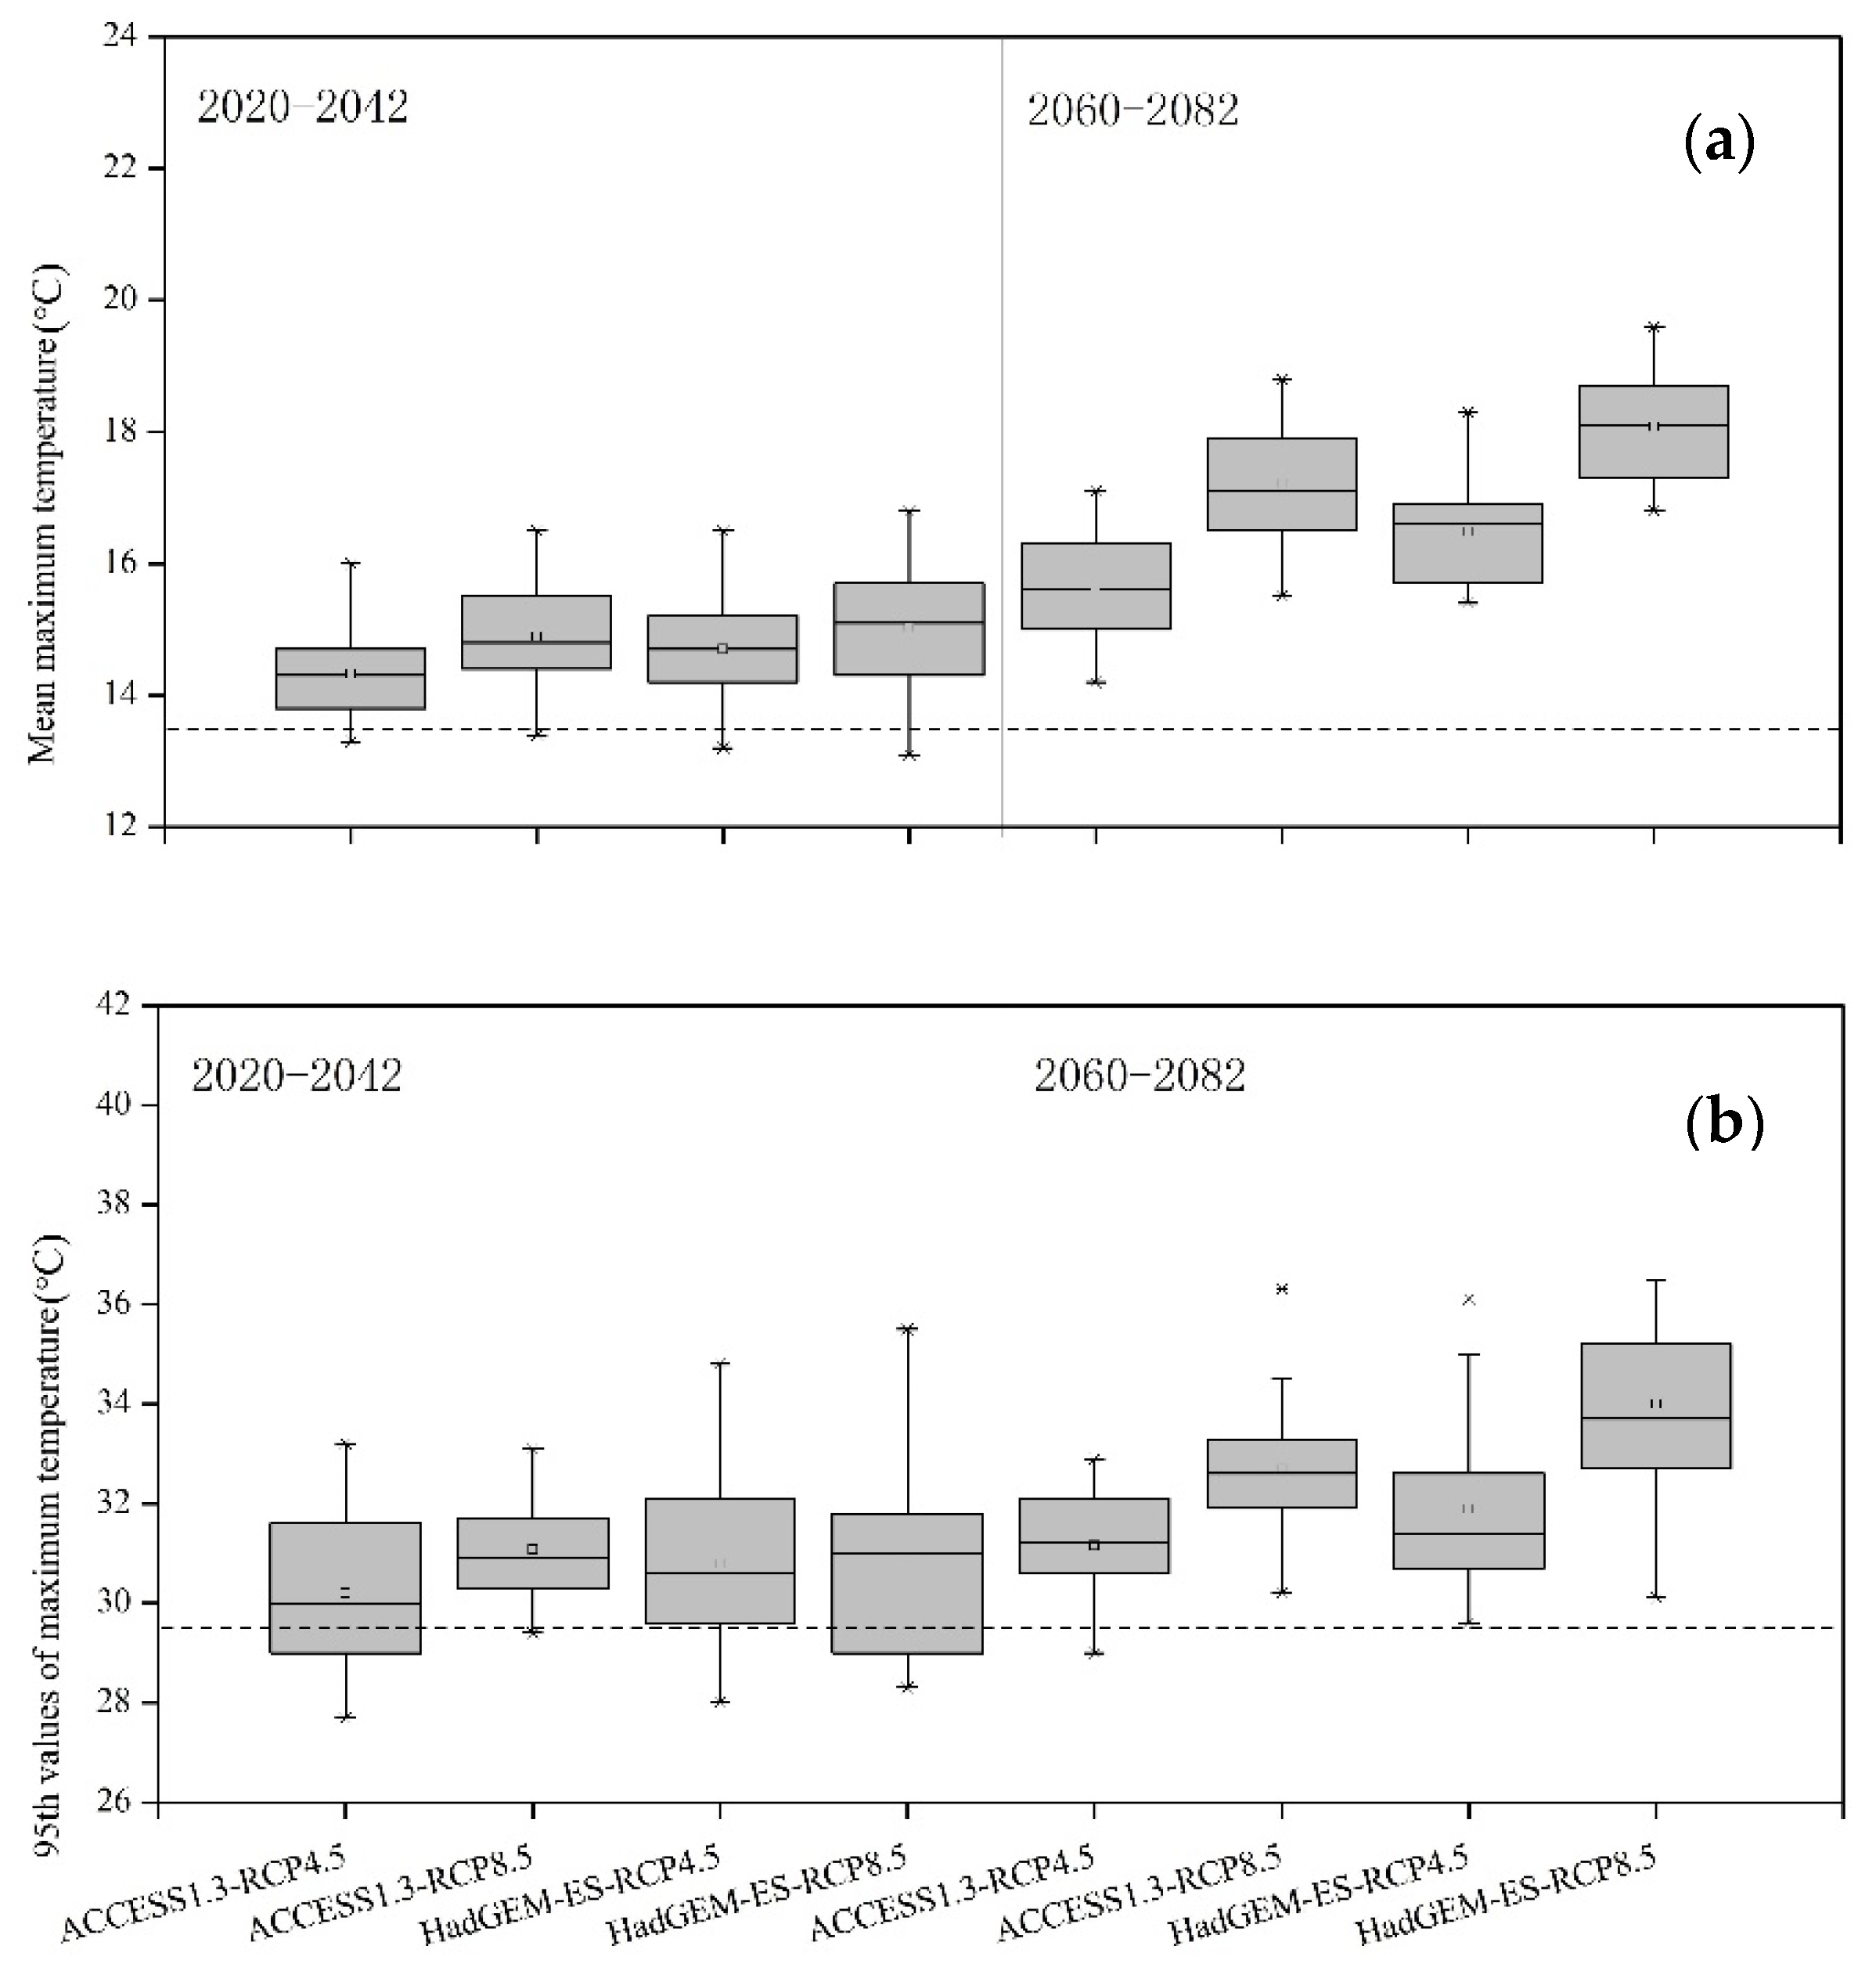
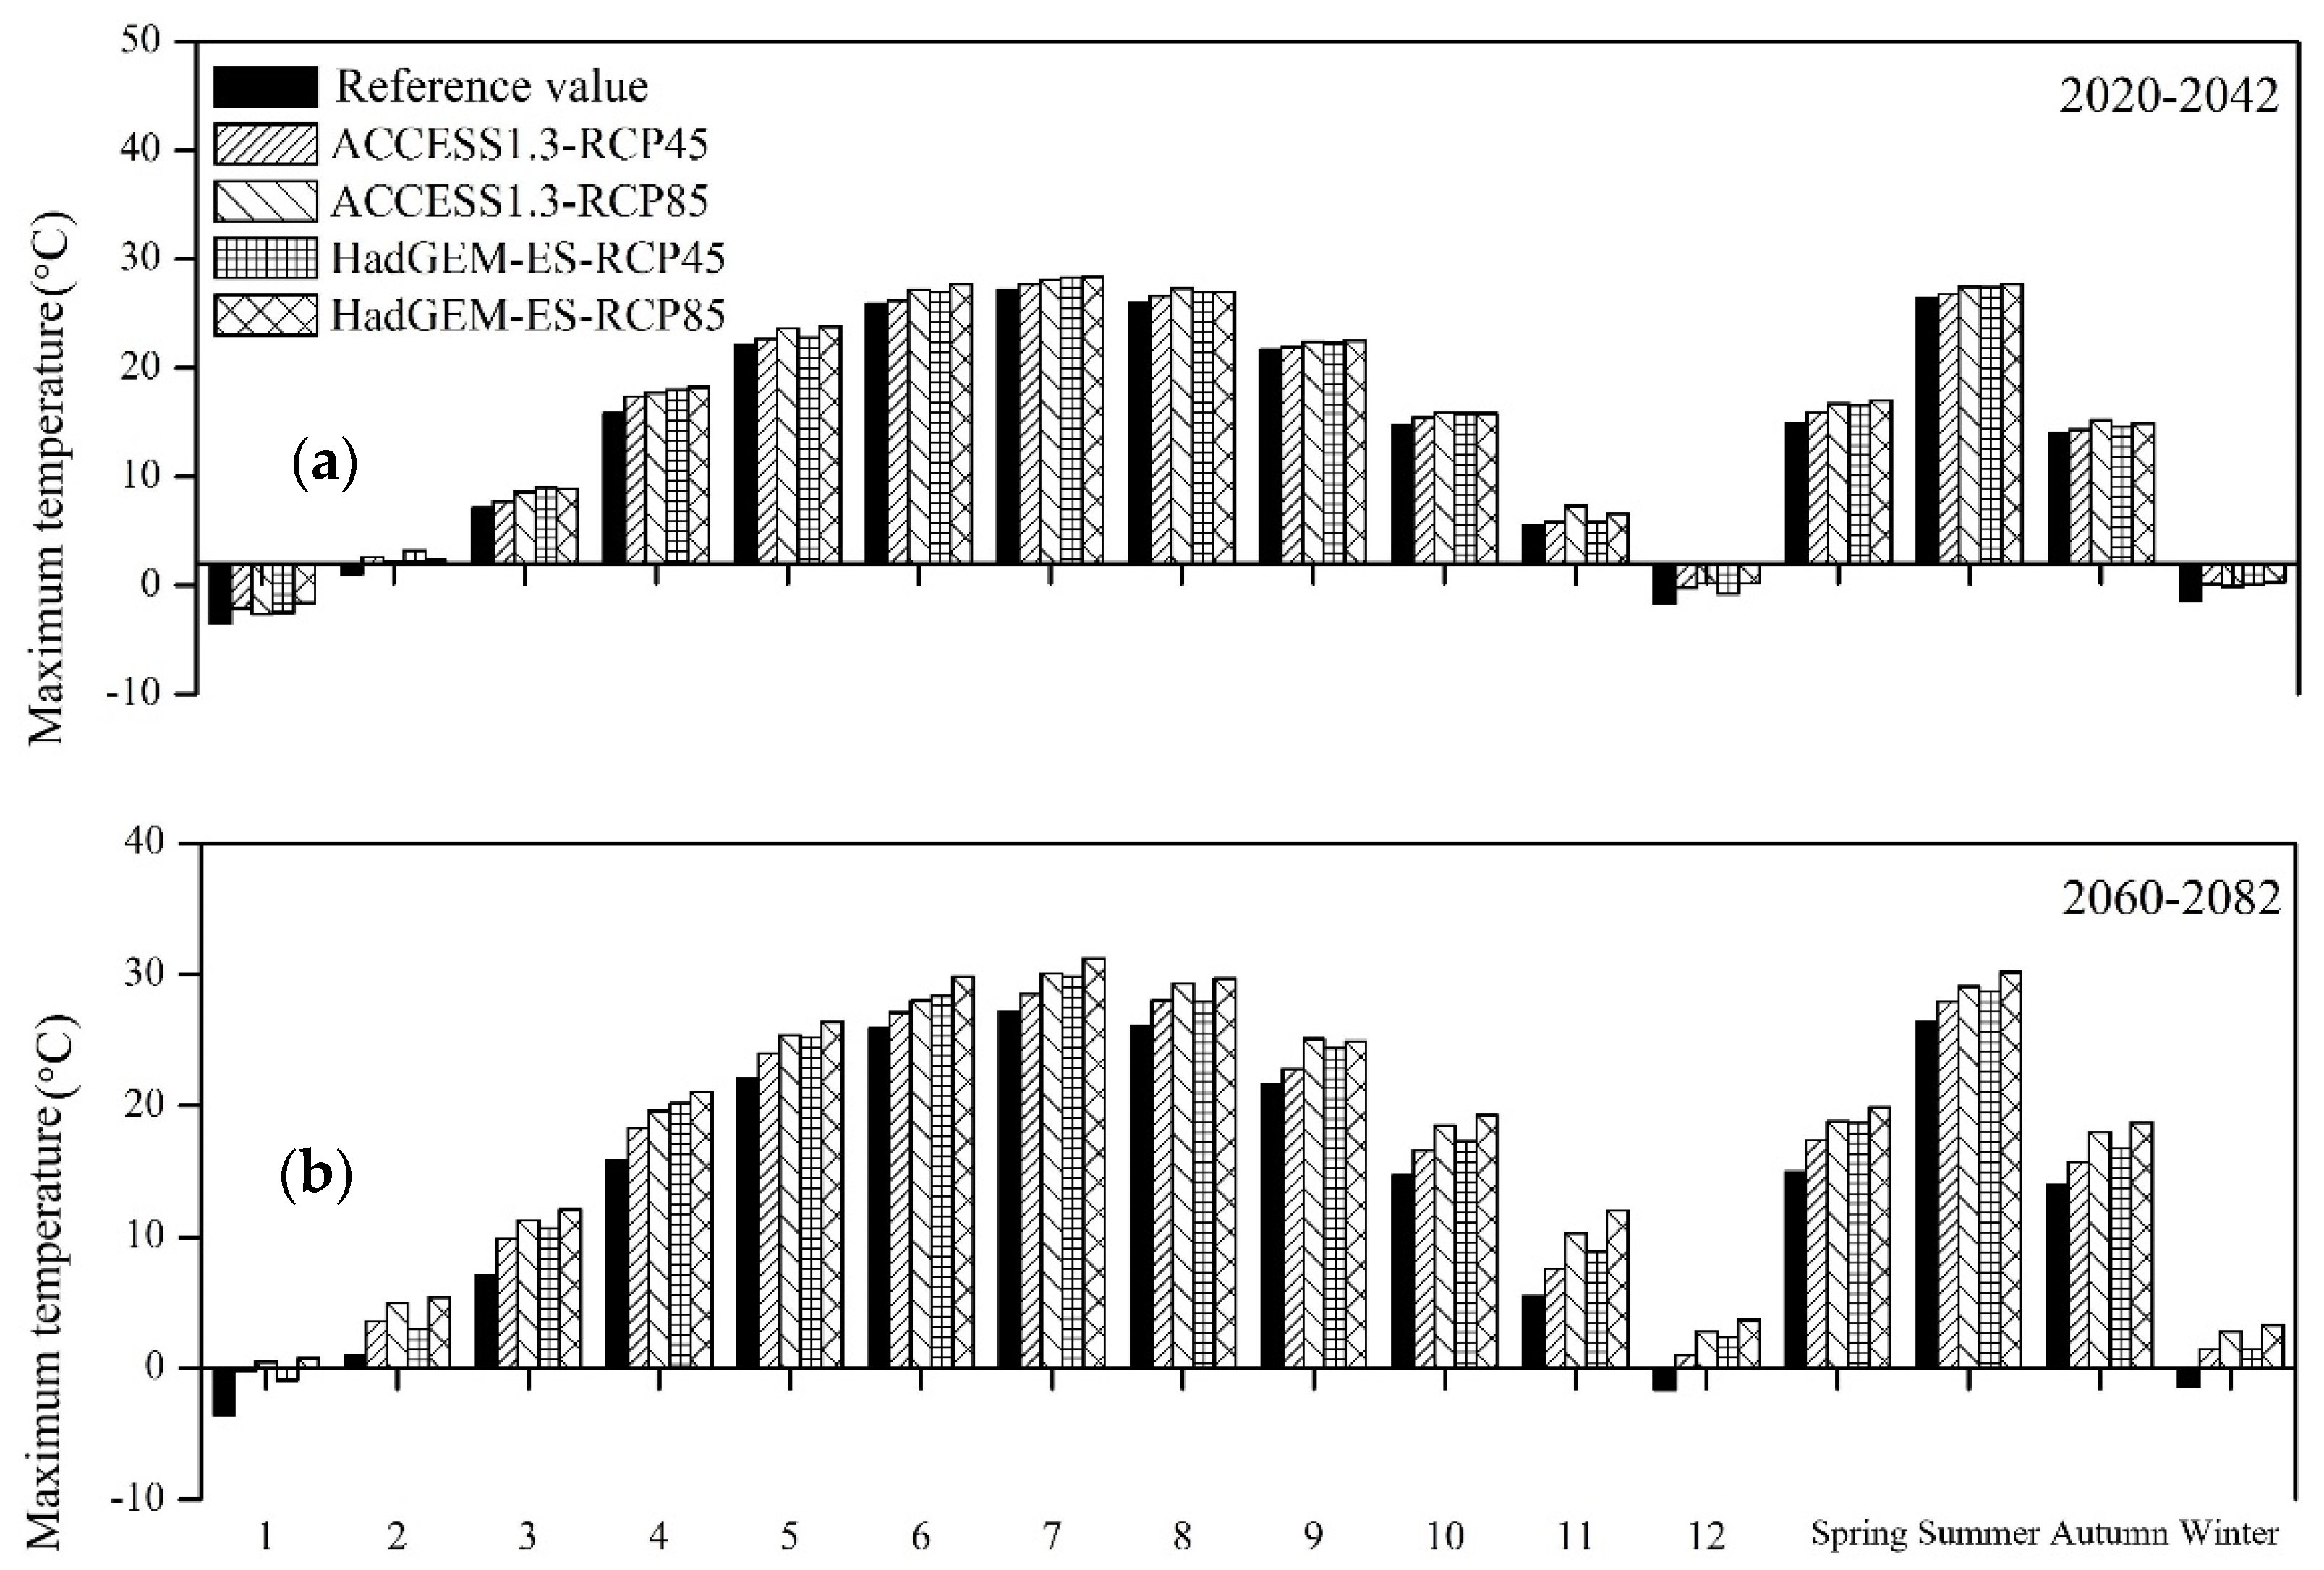
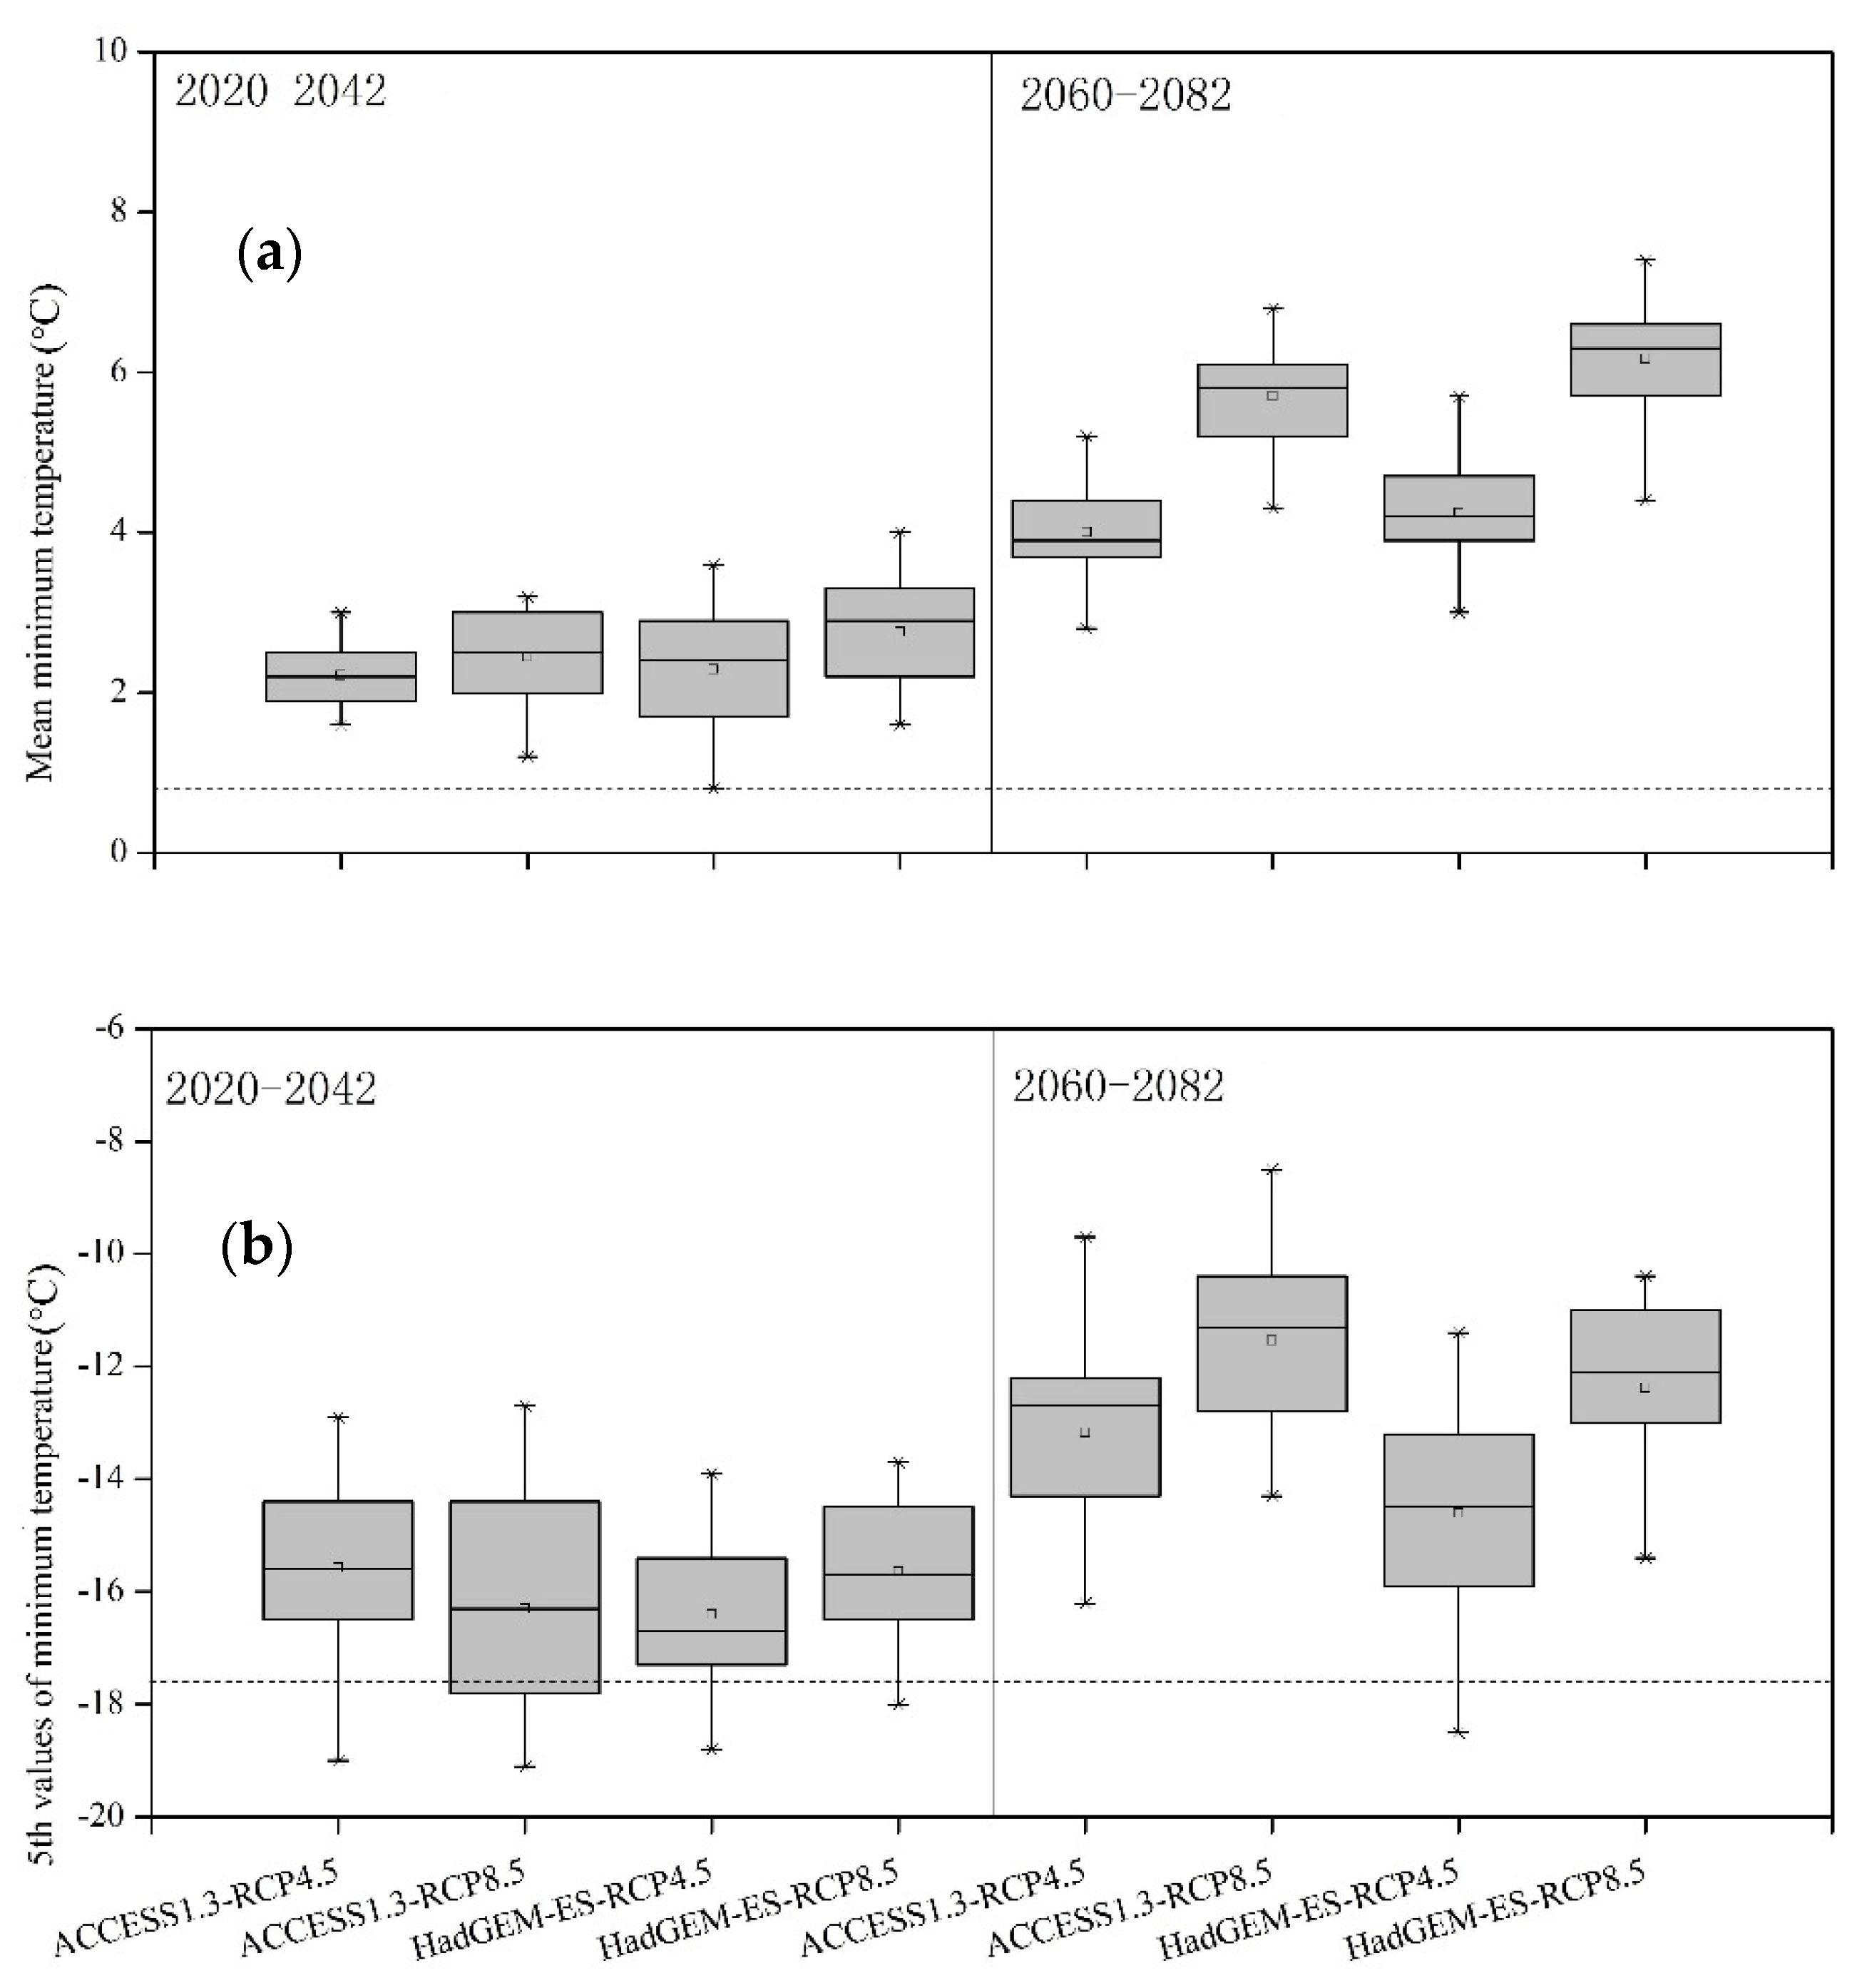
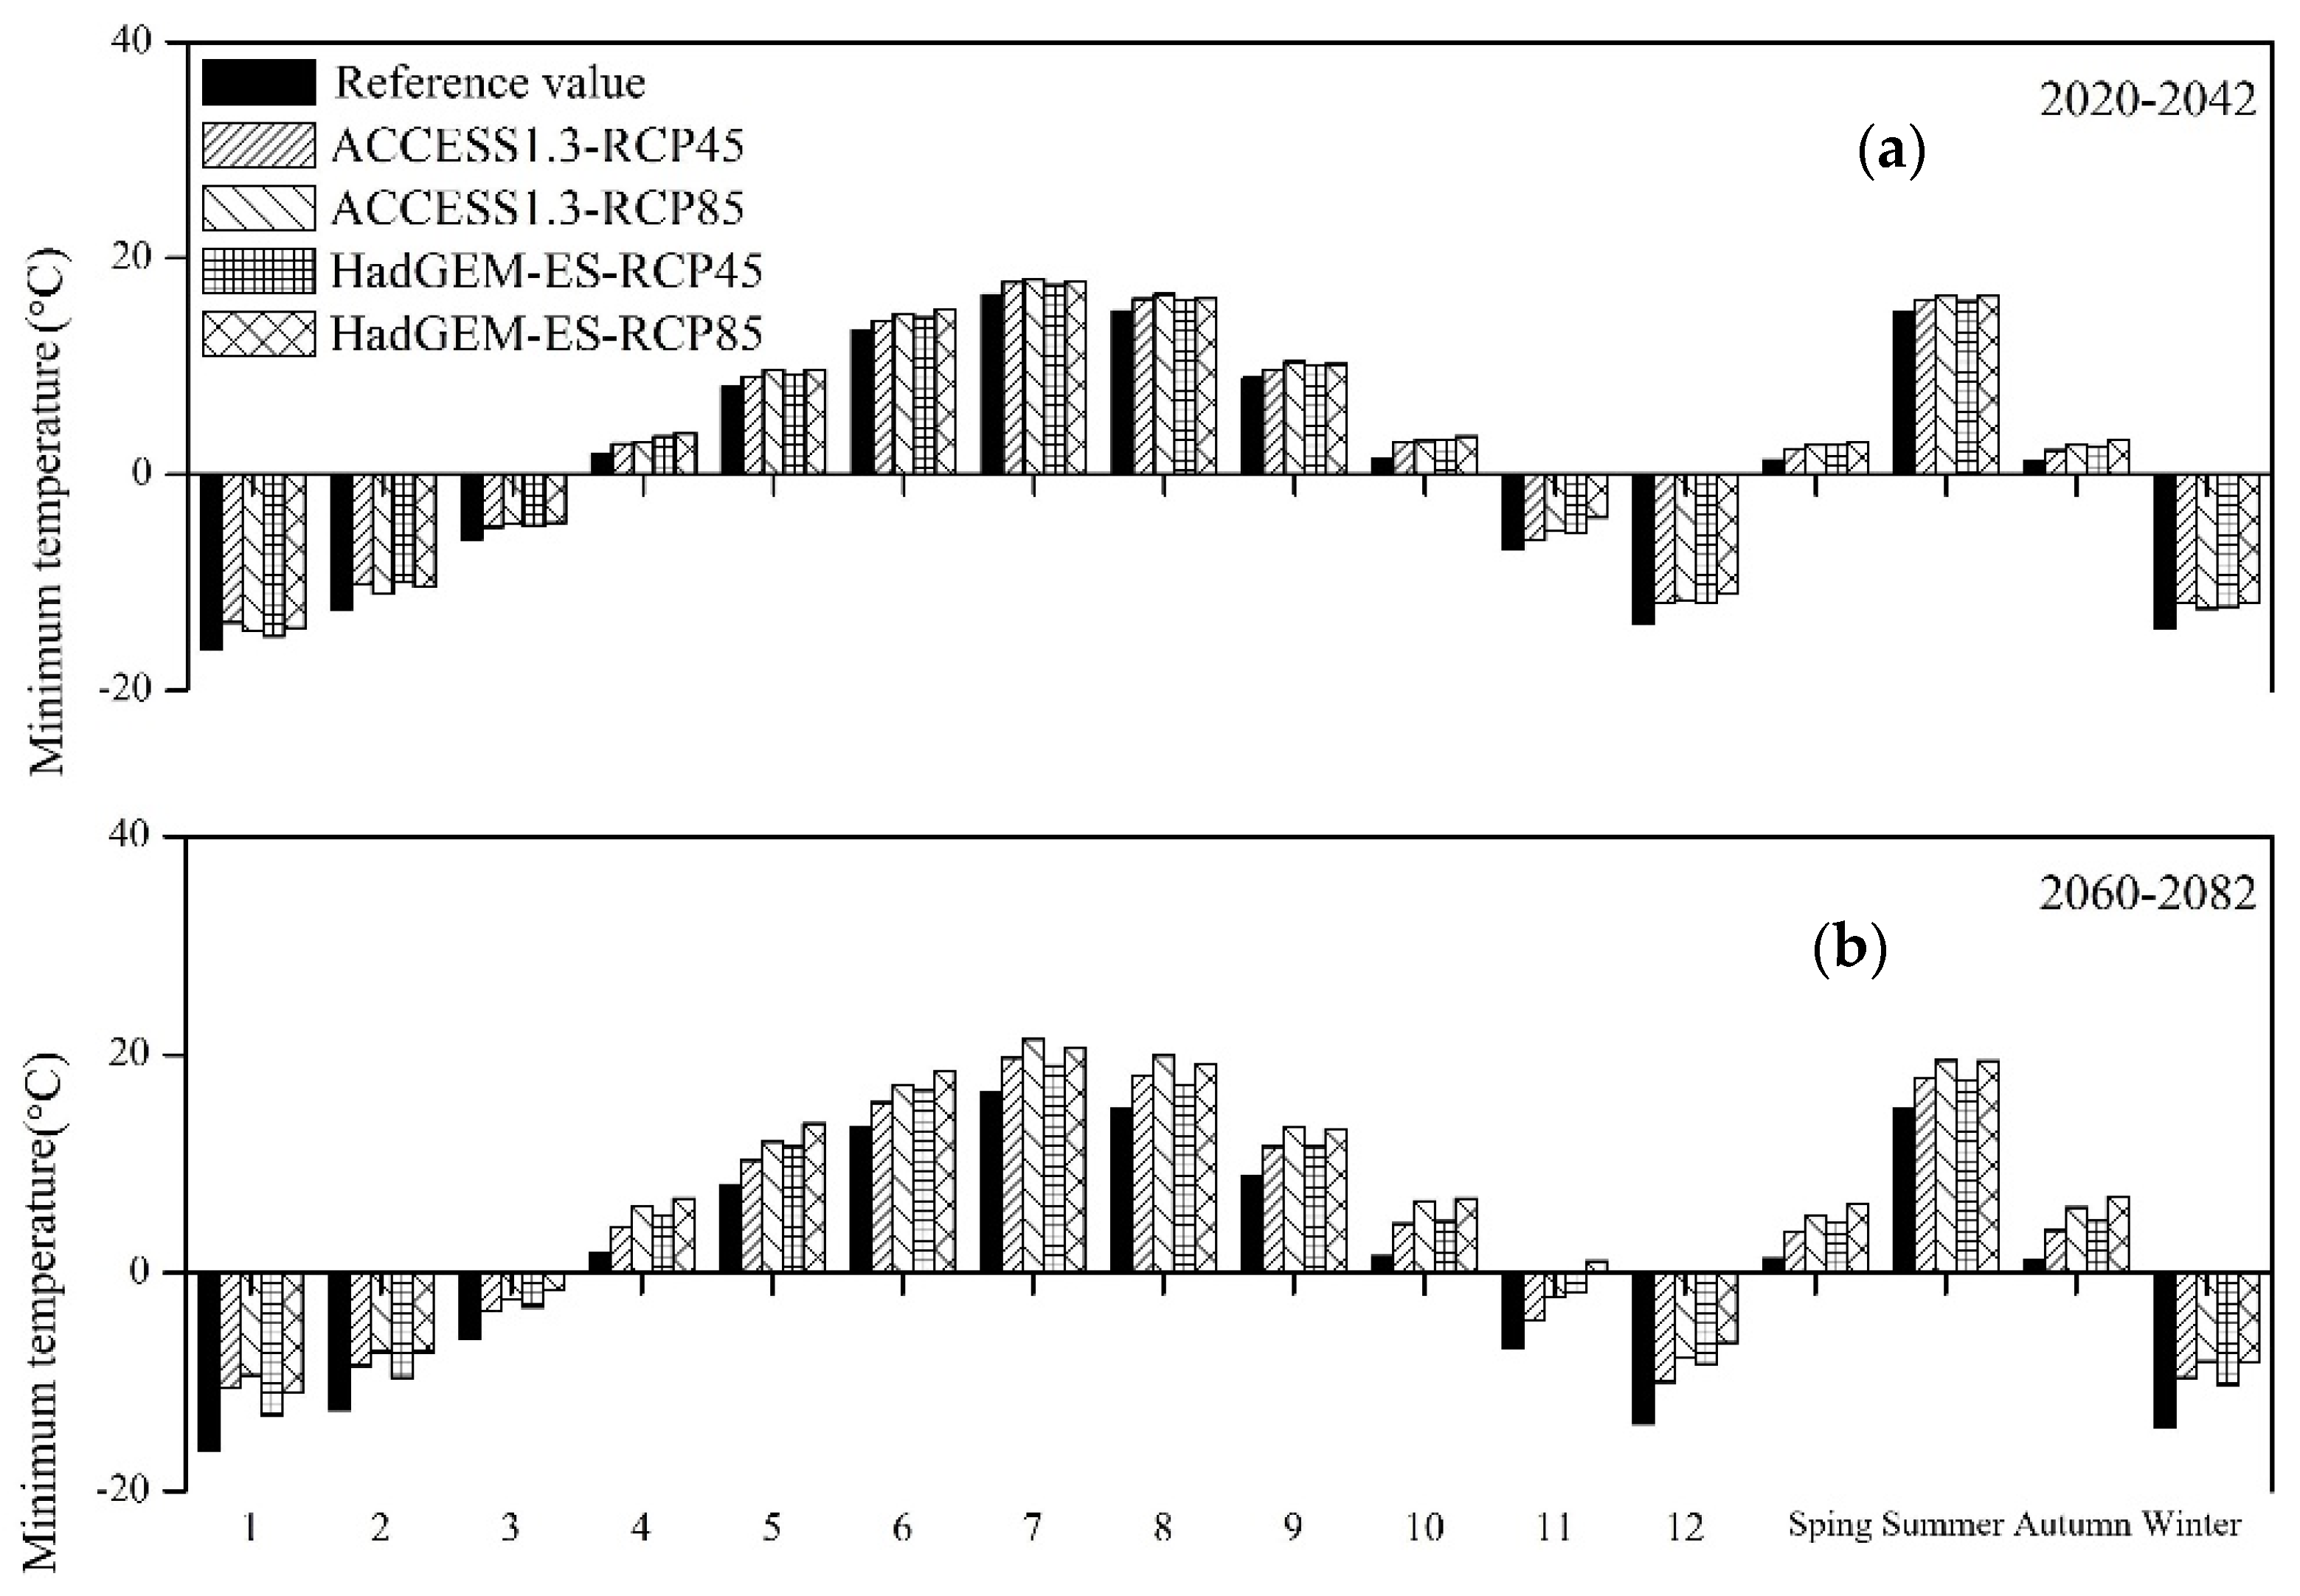
3.2.1. Variation in Future Temperature
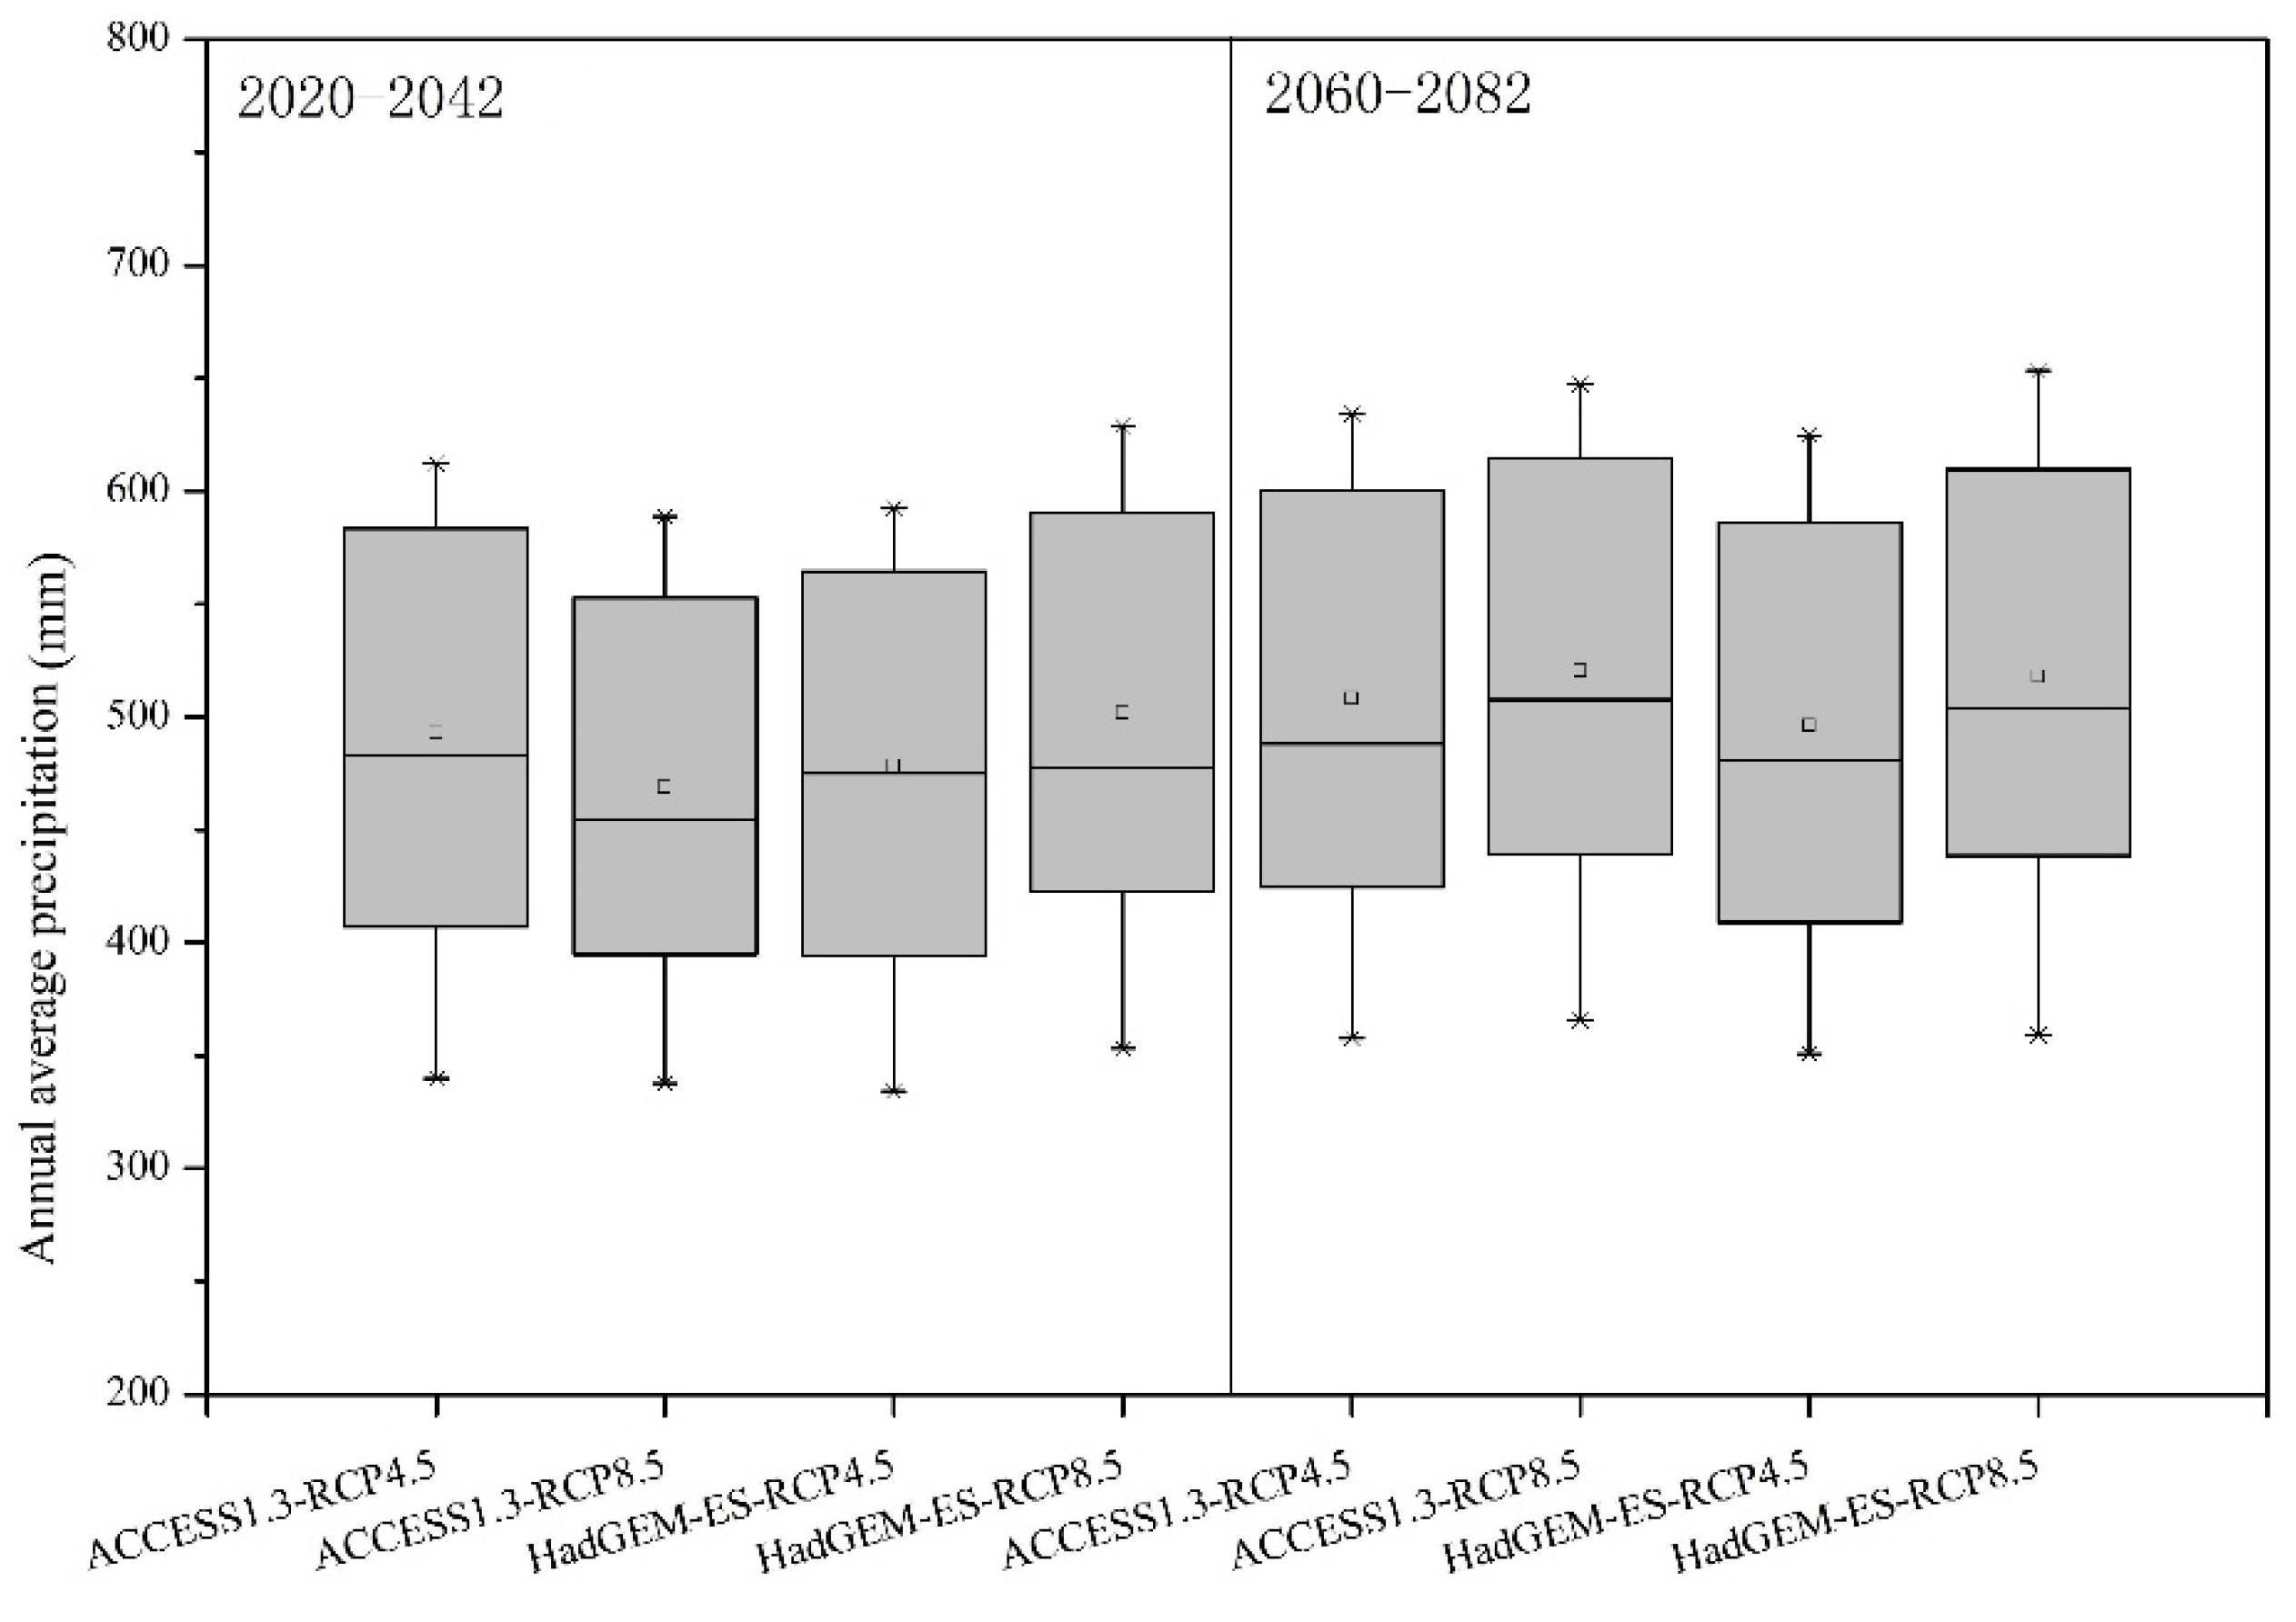
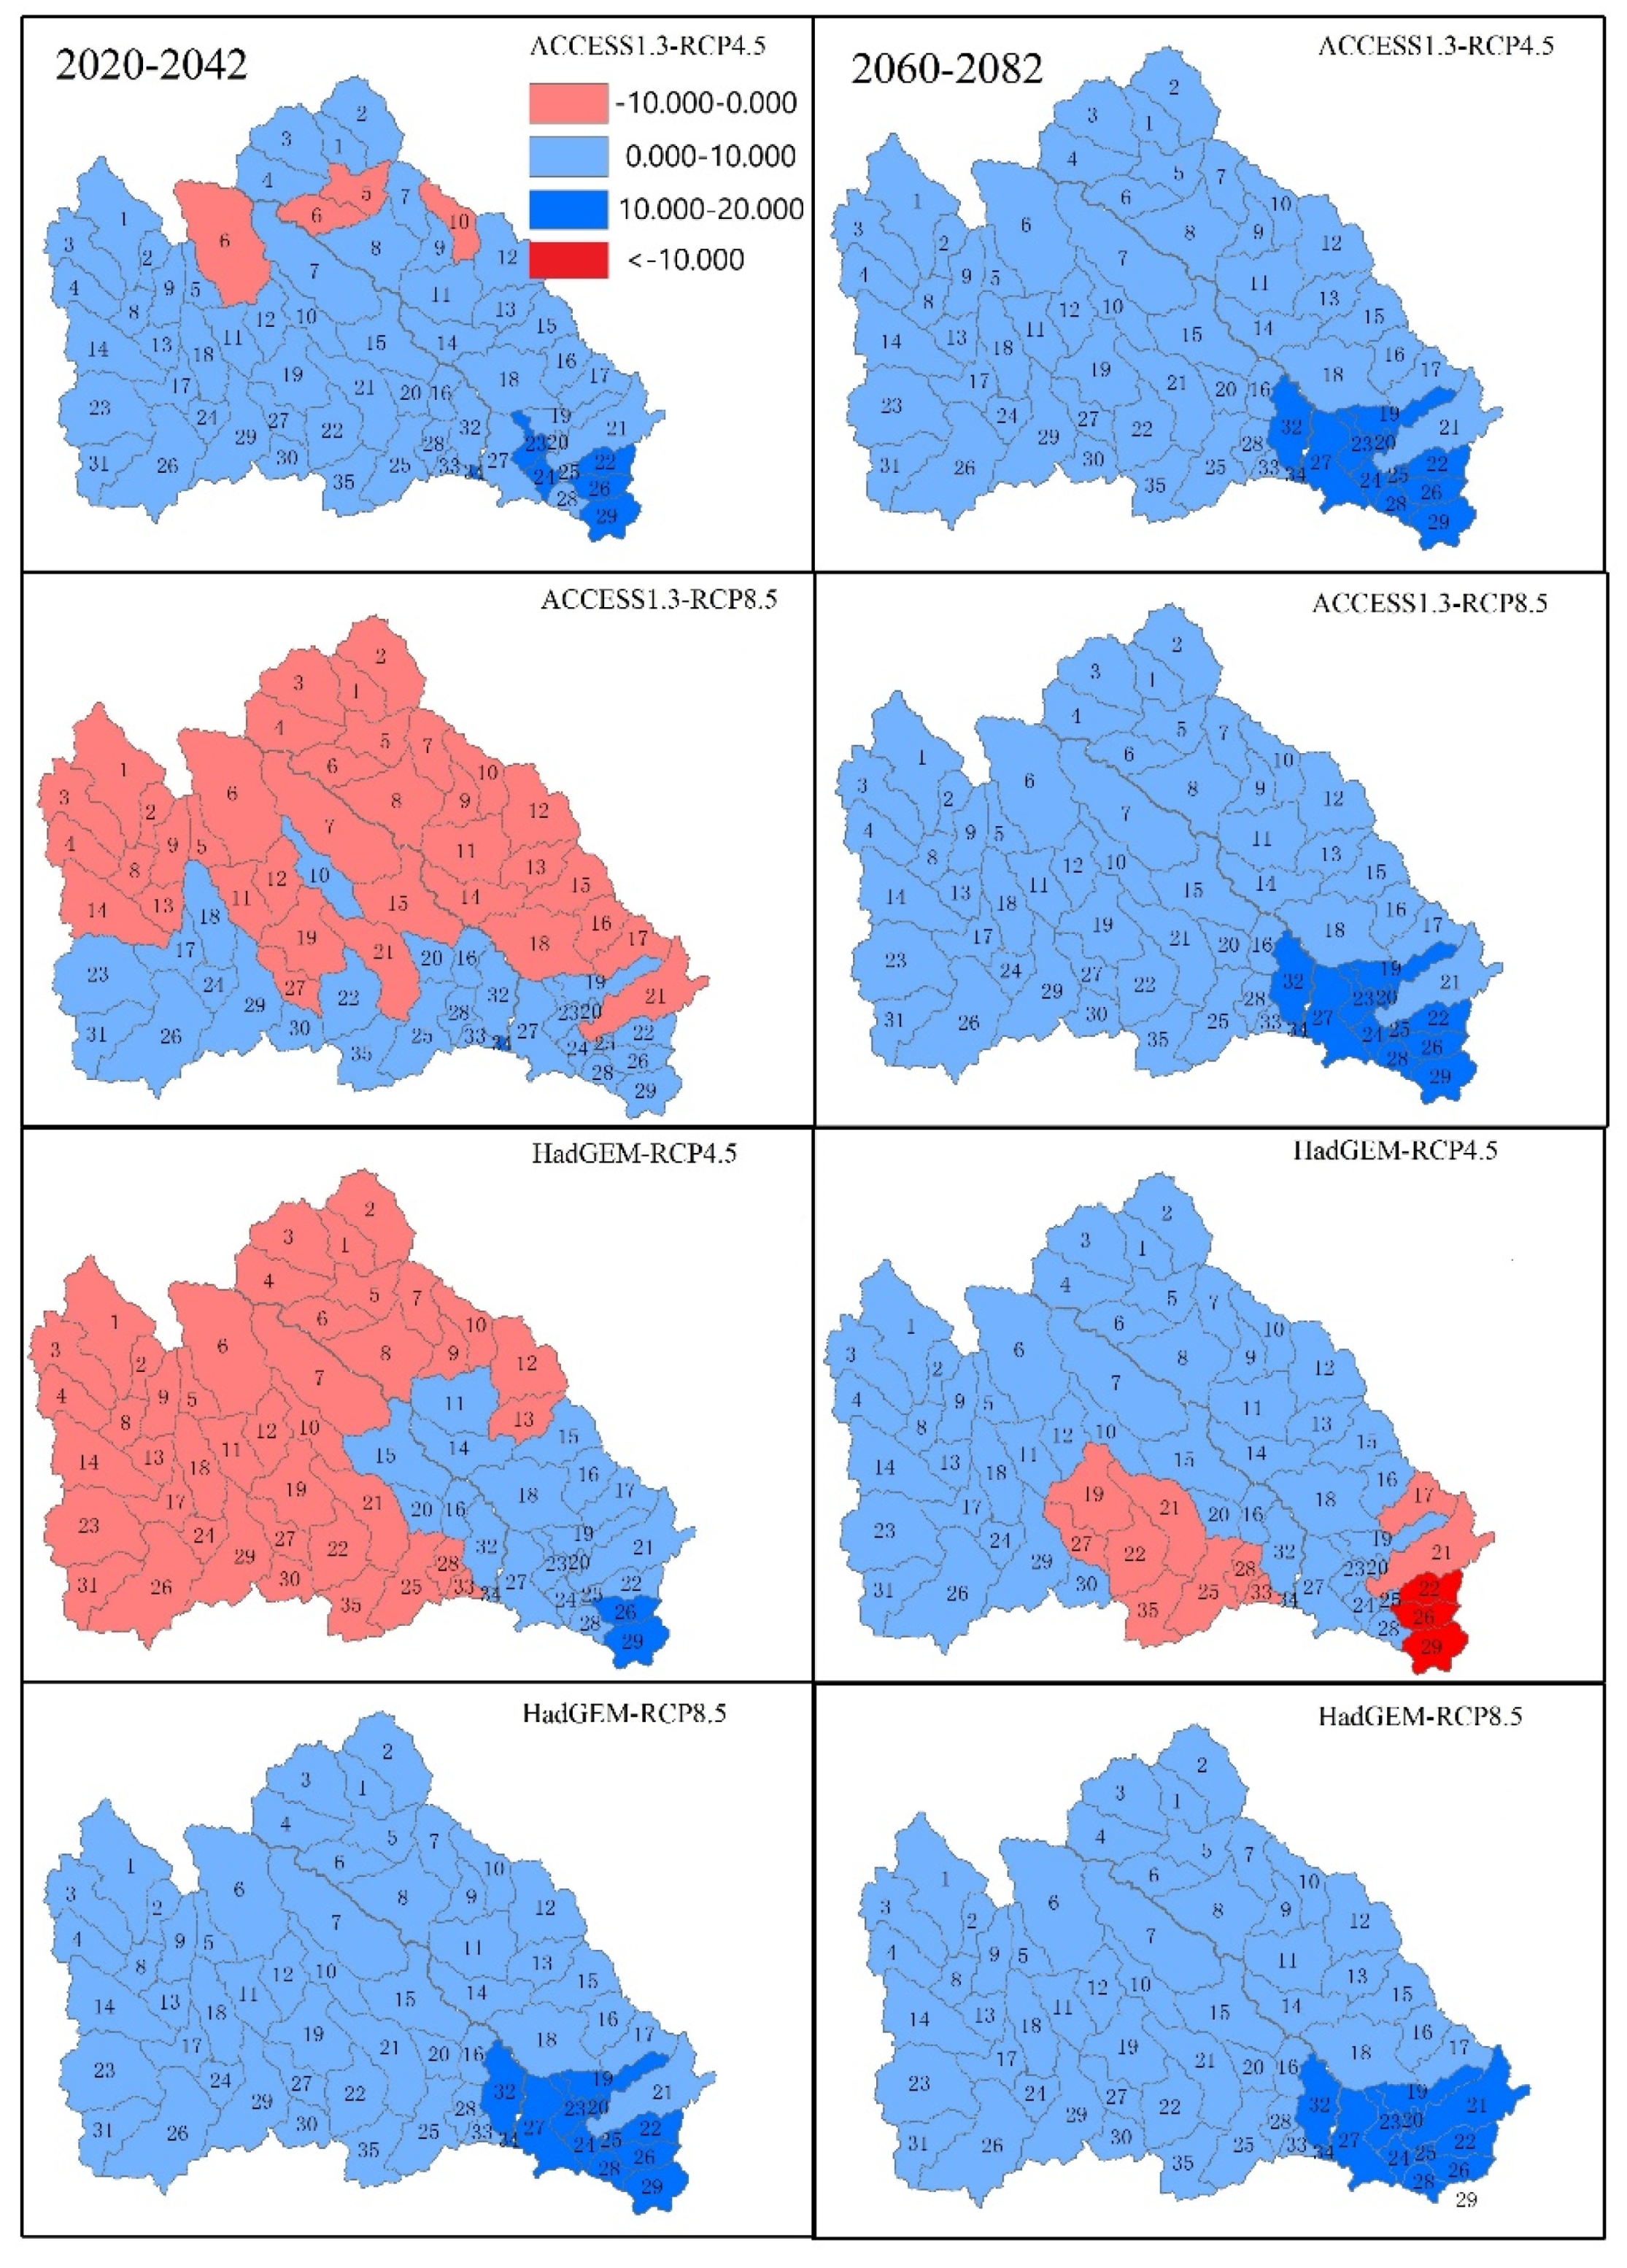
3.2.2. Variation in Future Precipitation
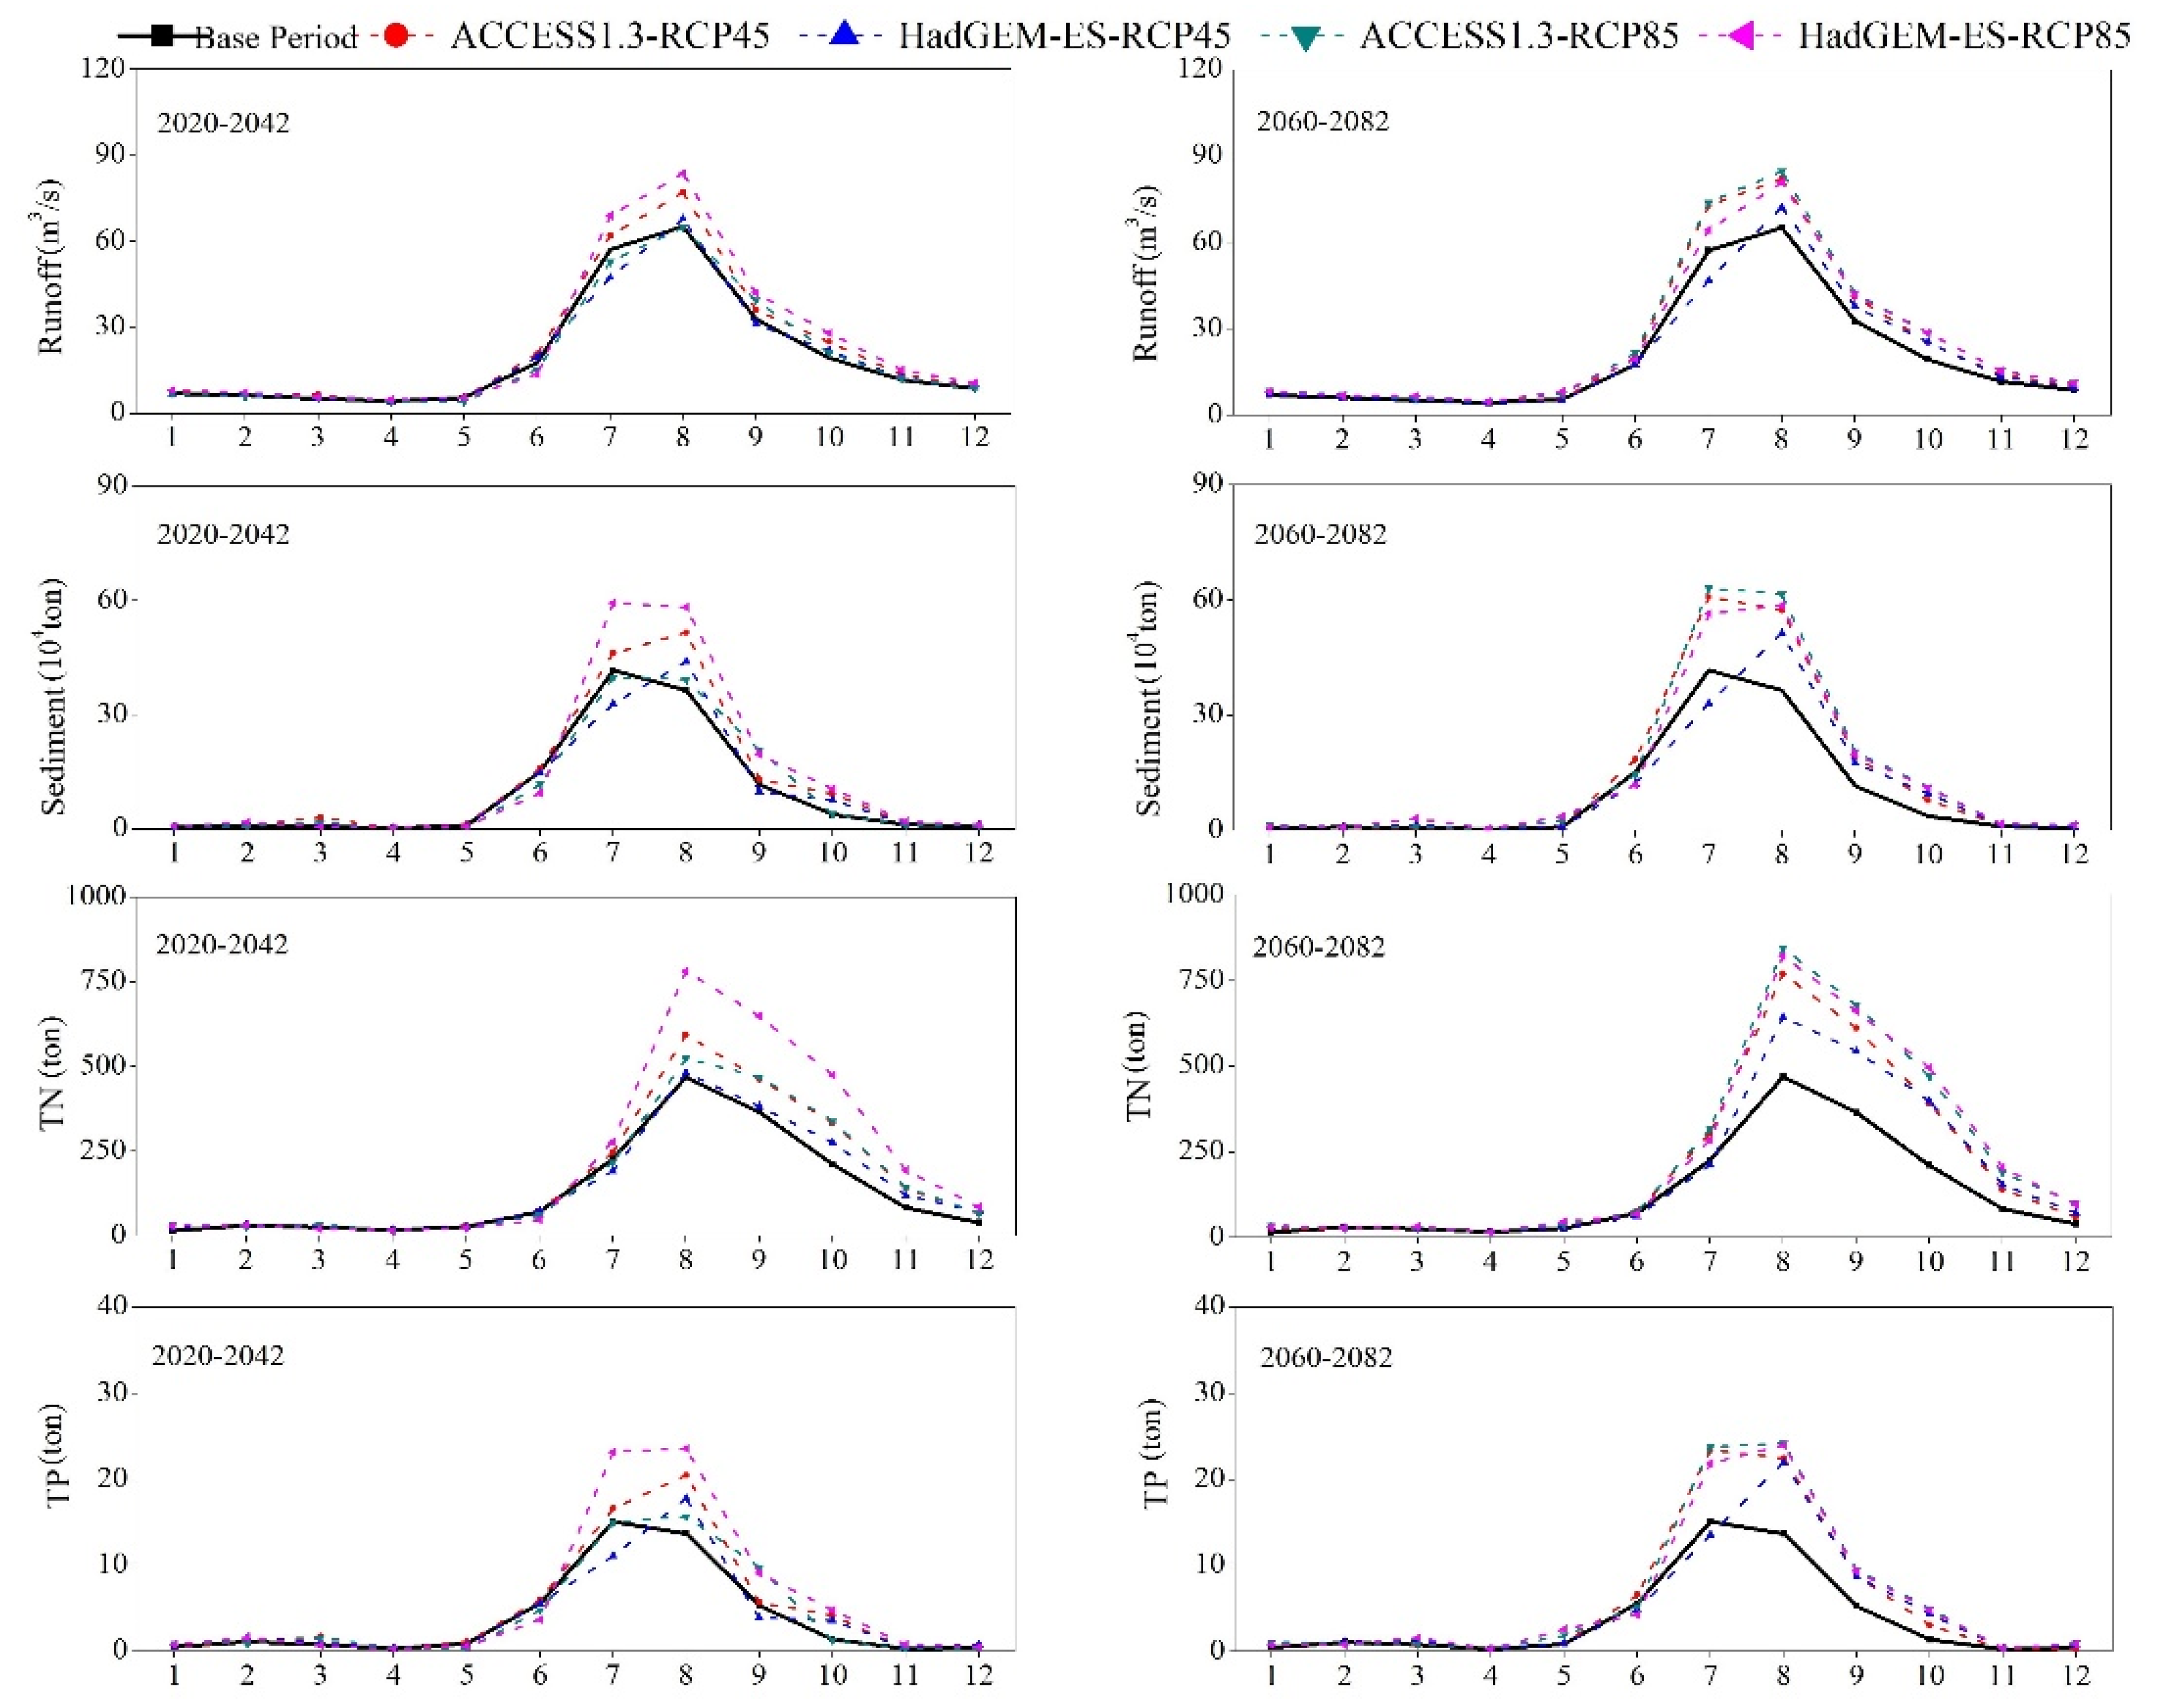
3.3. Climate Change Impact on Streamflow and Sediments
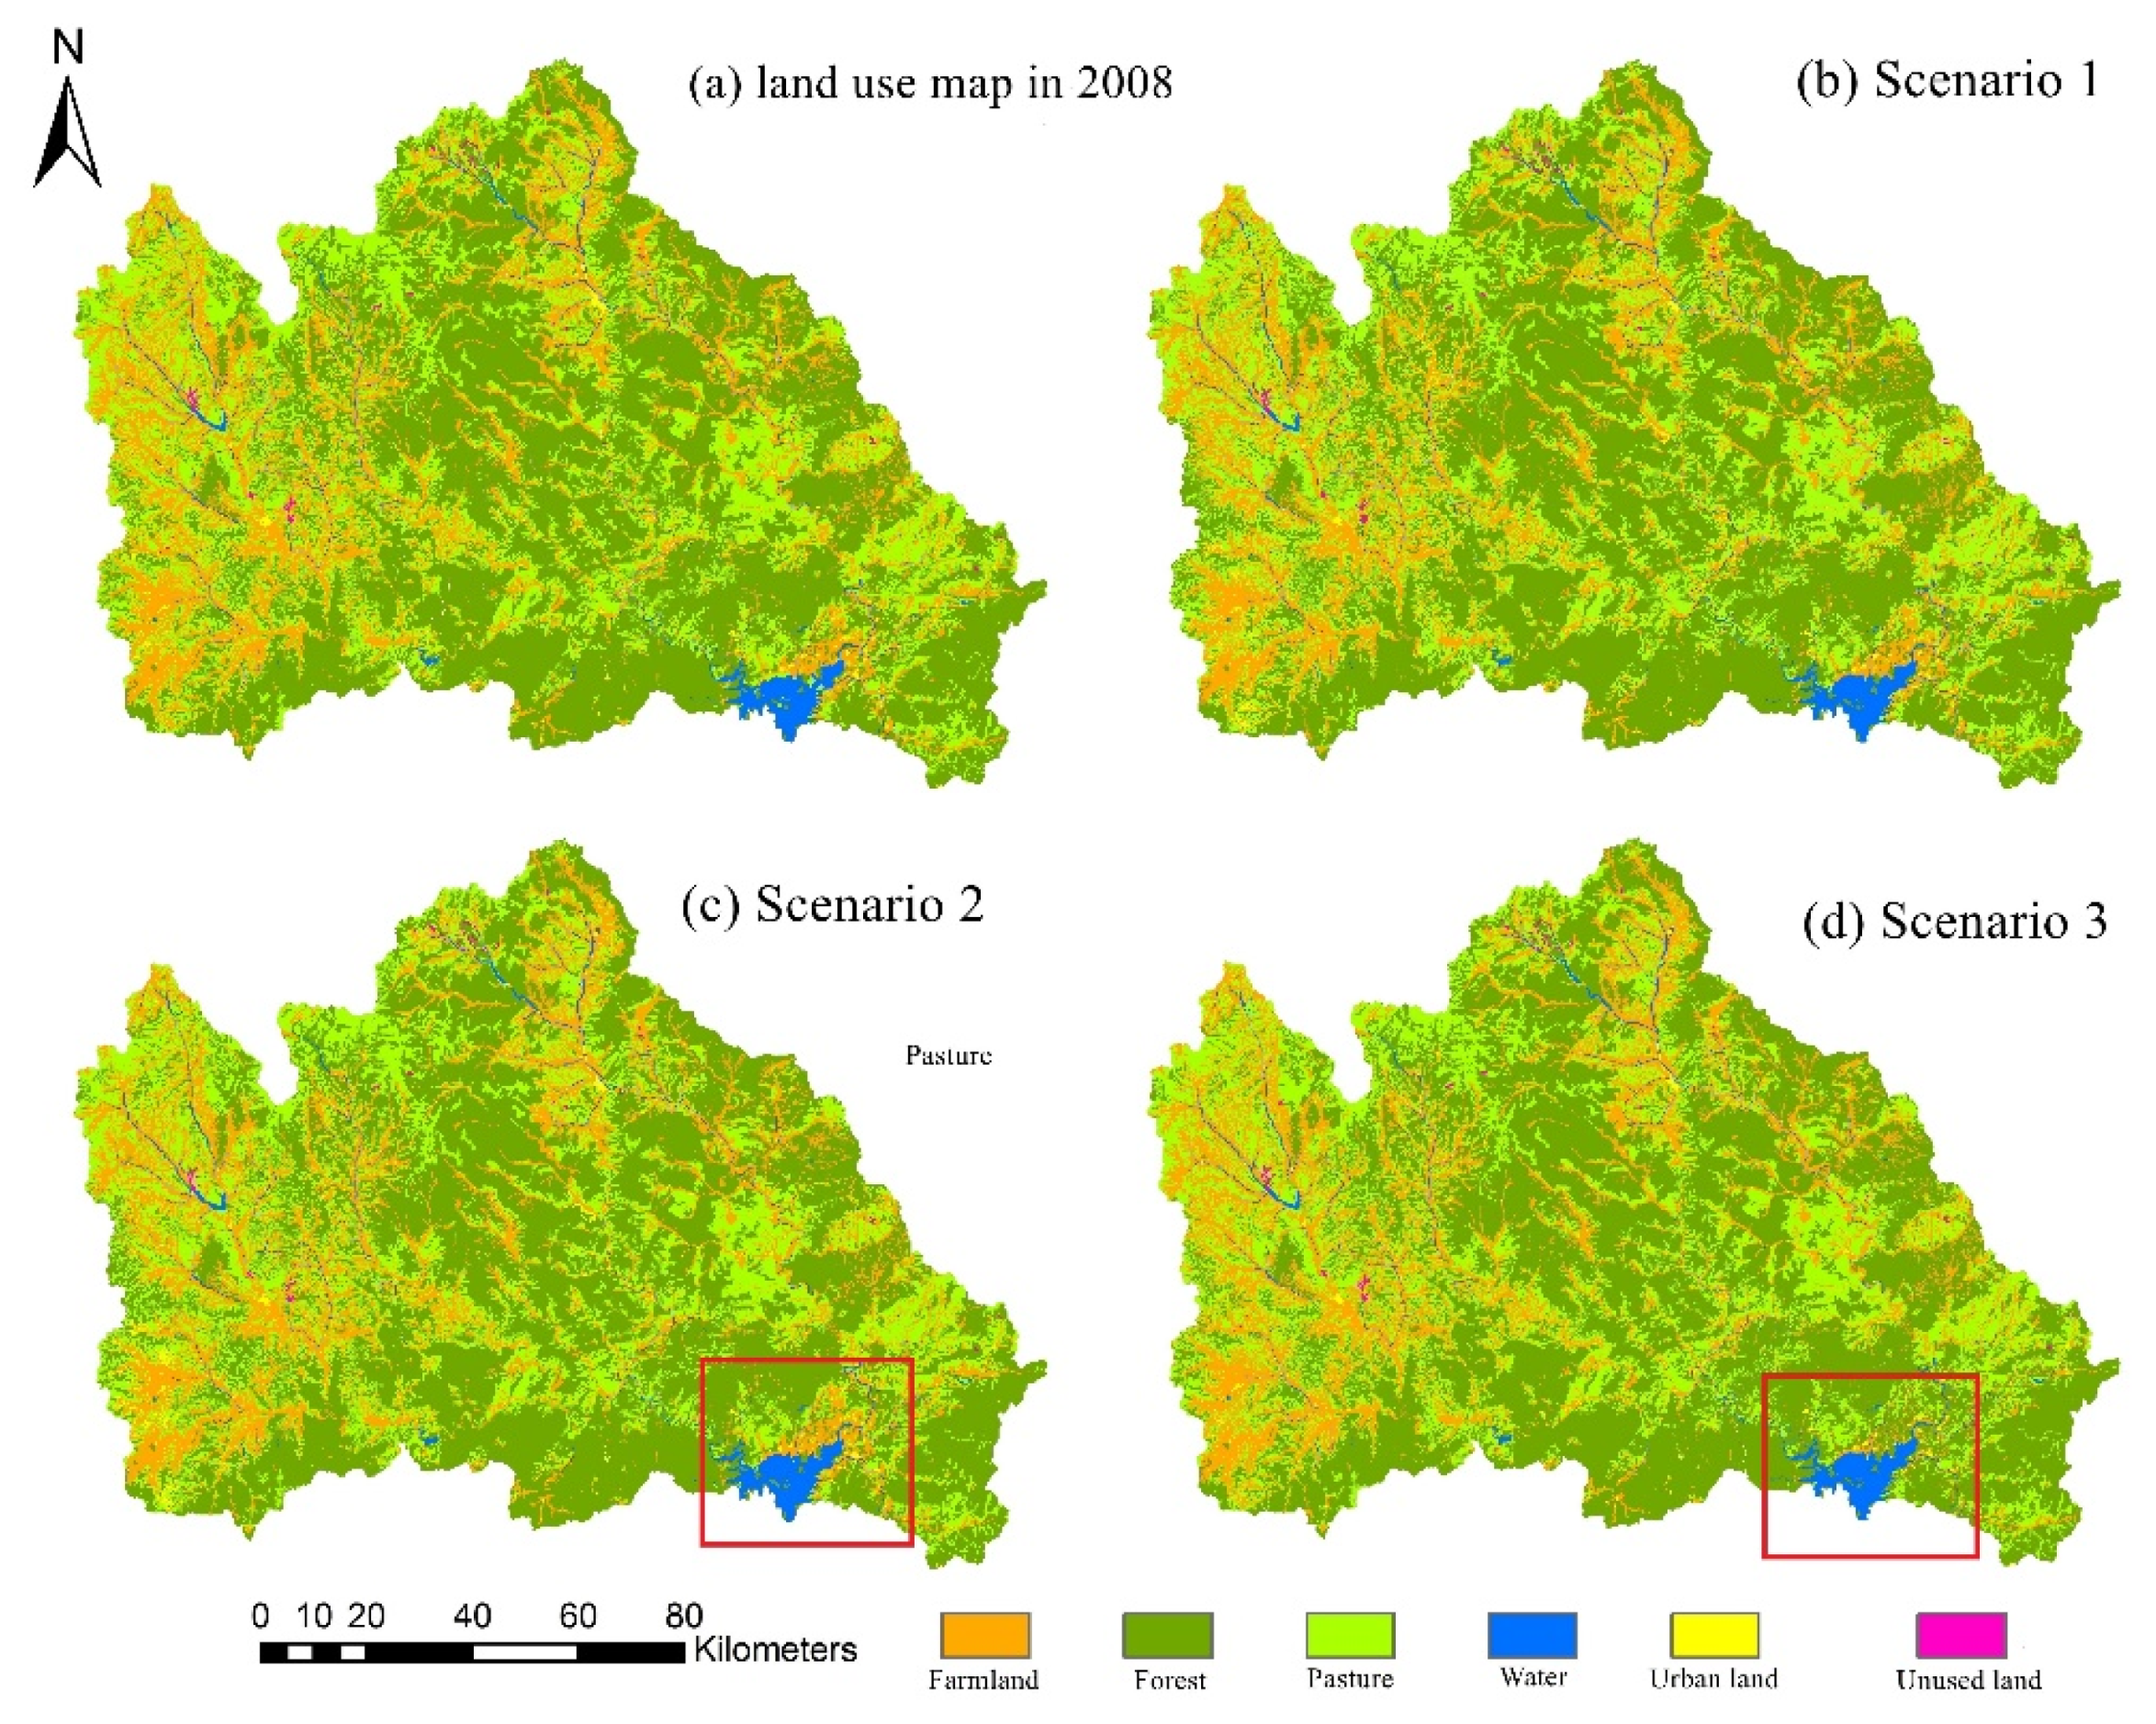
3.4. Future Land Use Scenarios
- Historical trend scenario: The future demand for land use follows the linear change trend of land use from 2000 to 2008. The overall performance of future land use changes is as follows: forest and urban land will increase and the area of grassland, water bodies, unused land and arable land will decrease. This scenario describes a scenario where there is no future intervention in land use change policies.
- Ecological protection without consideration of spatial allocation scenario: Many water and soil conservation projects are currently being implemented in the Miyun River Watershed, such as: Taihang Mountain Greening Project, Beijing-Tianjin Sand Source Control Project. In the meantime, since the Miyun Reservoir is the source of drinking water in Beijing, environmental protection of the watershed is particularly important. Therefore, in the future, the annual growth rate of forest land, grassland and urban land will be 1.5, 0.5 and 1.5 times the historical trend scenario, respectively.
- Ecological protection with consideration of spatial allocation scenario: Based on the results of the historical SWAT simulation from 1988 to 2010 and taking into account the spatial output characteristics of non-point source pollution in the watershed under future climate change and the Miyun Reservoir Watershed Protection Zone Division, specific regional preference variables were added to increase the probability of conversion of cultivated land to forest land in the secondary protection areas of the Miyun Reservoir watershed, watersheds above 25 °C and downstream sub-catchments of the Miyun Reservoir watershed. In this study, the regional weighting factor for forest land was set at 0.6 and the weighting factor for other land use types was set to 0. The rate of change of the different land use types was consistent with the ecological protection scenarios that did not consider the spatial allocation.
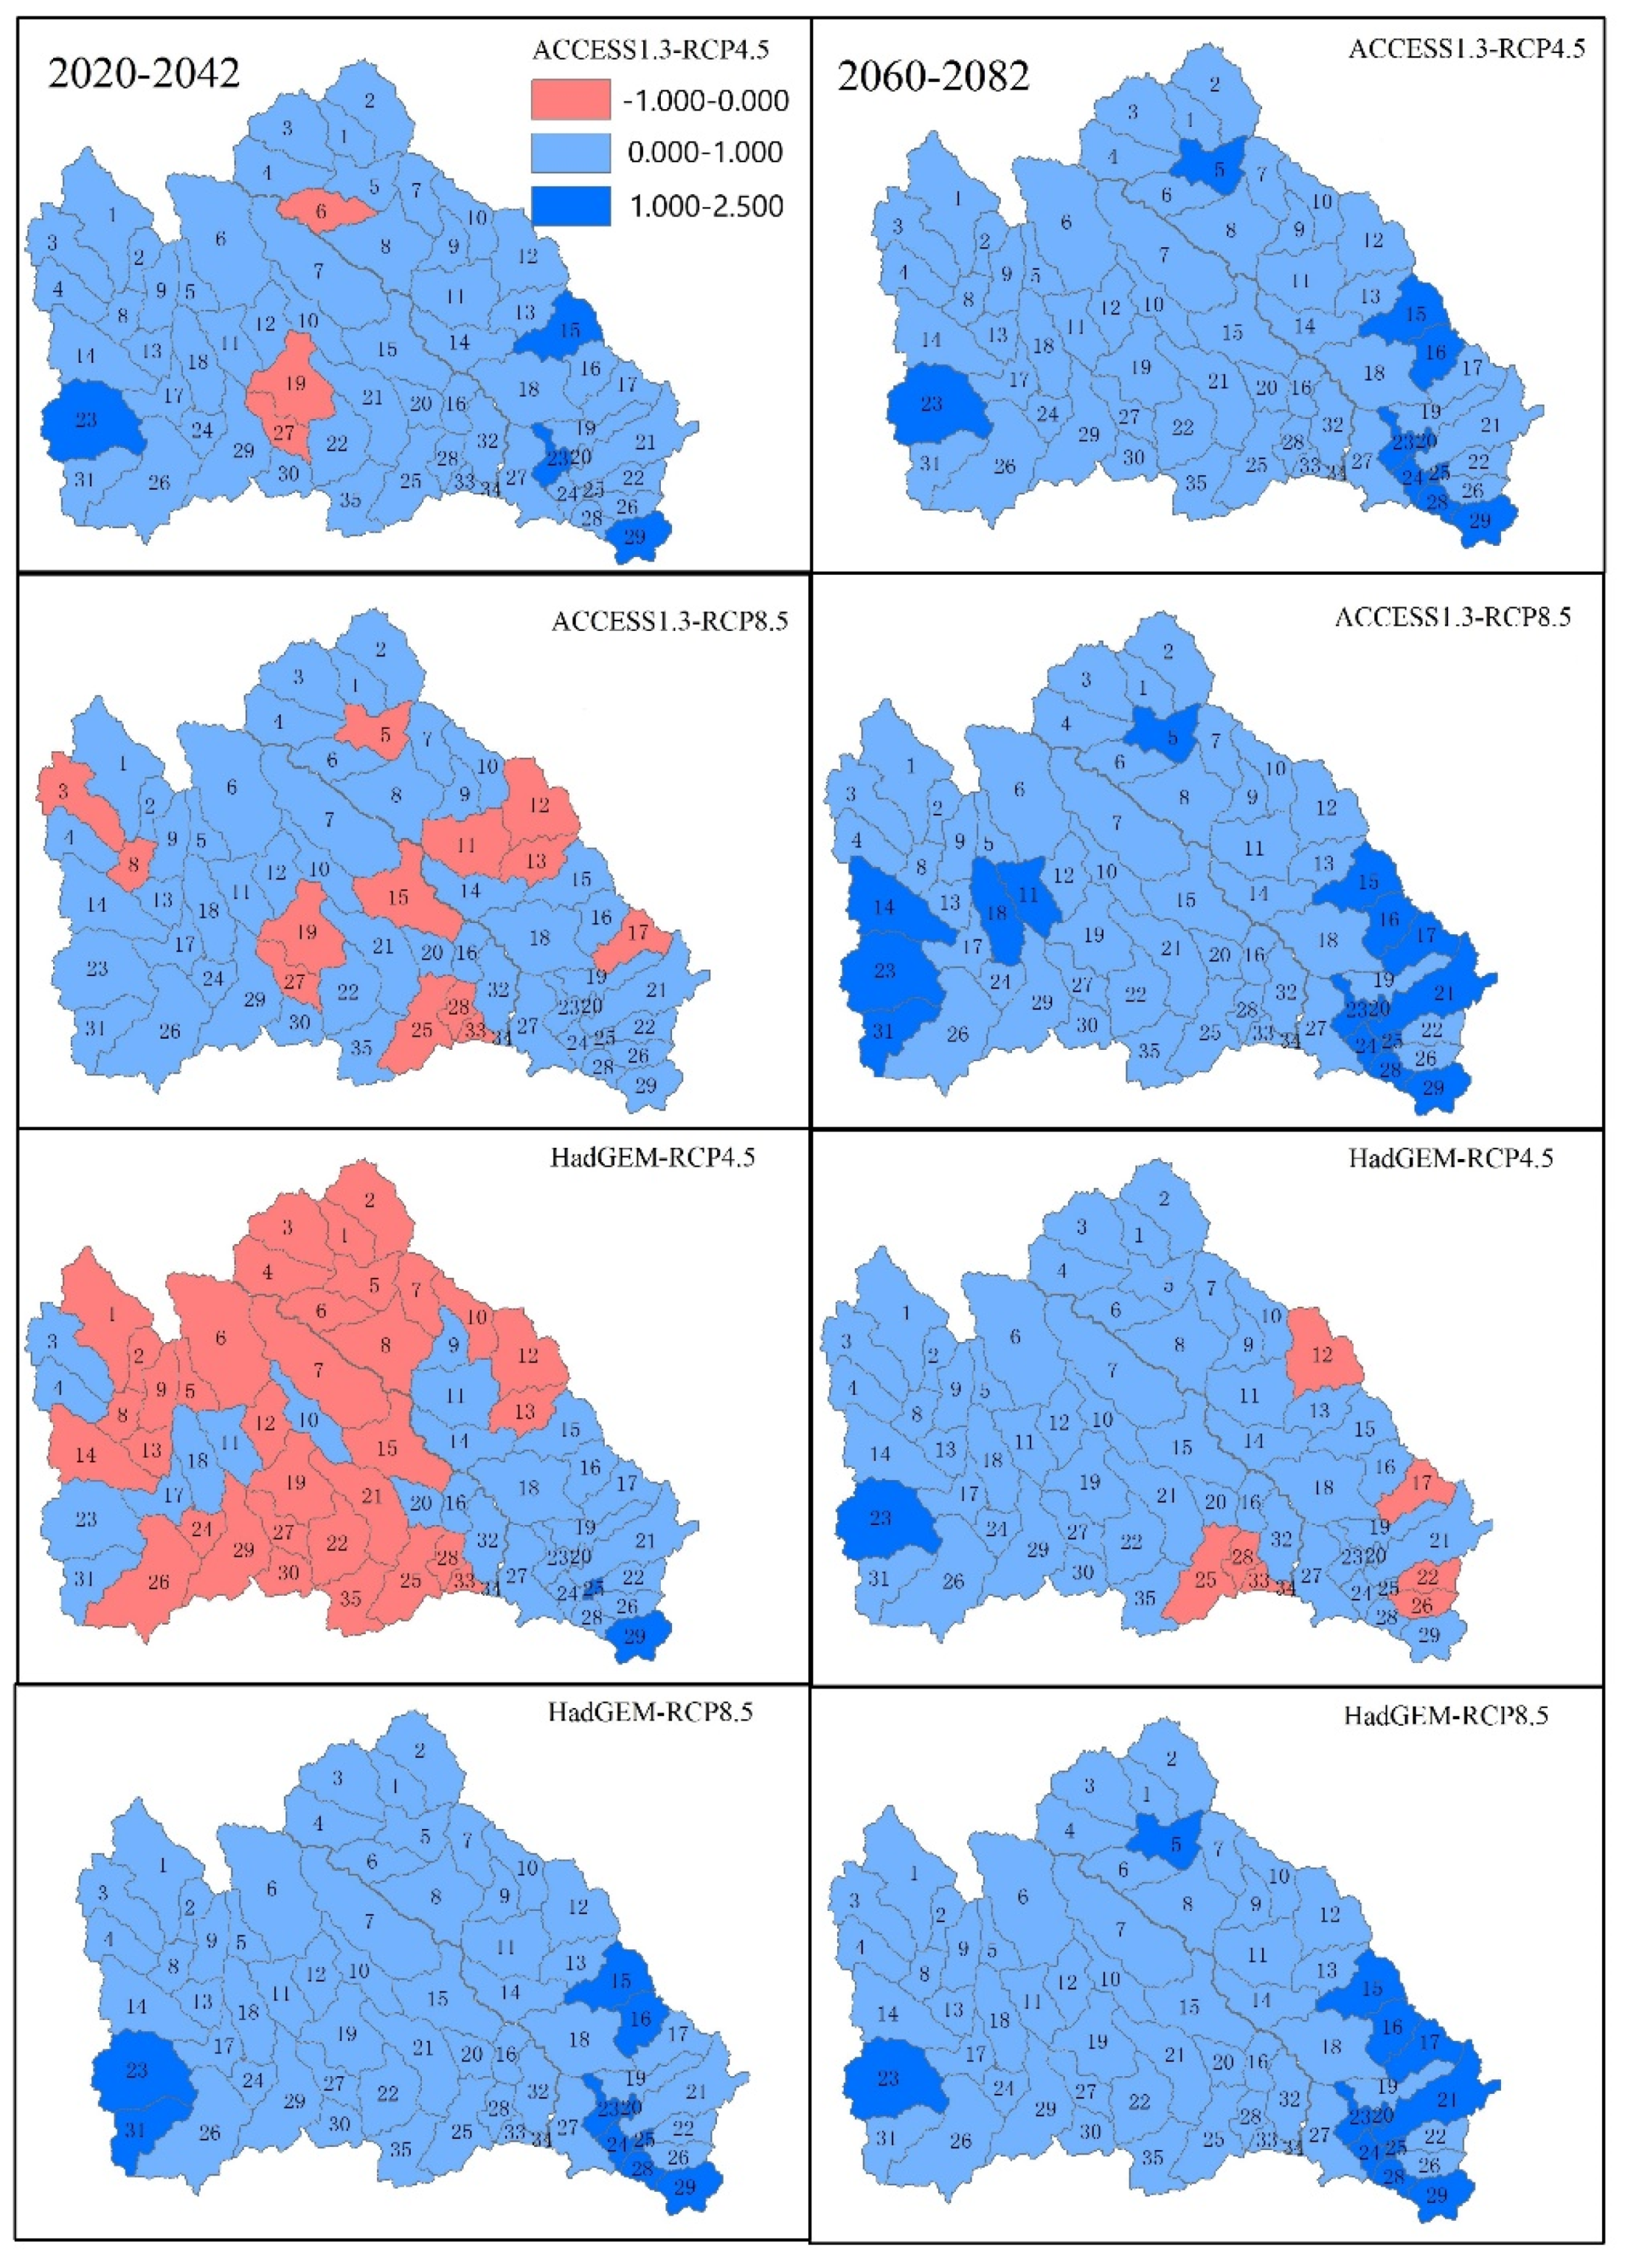
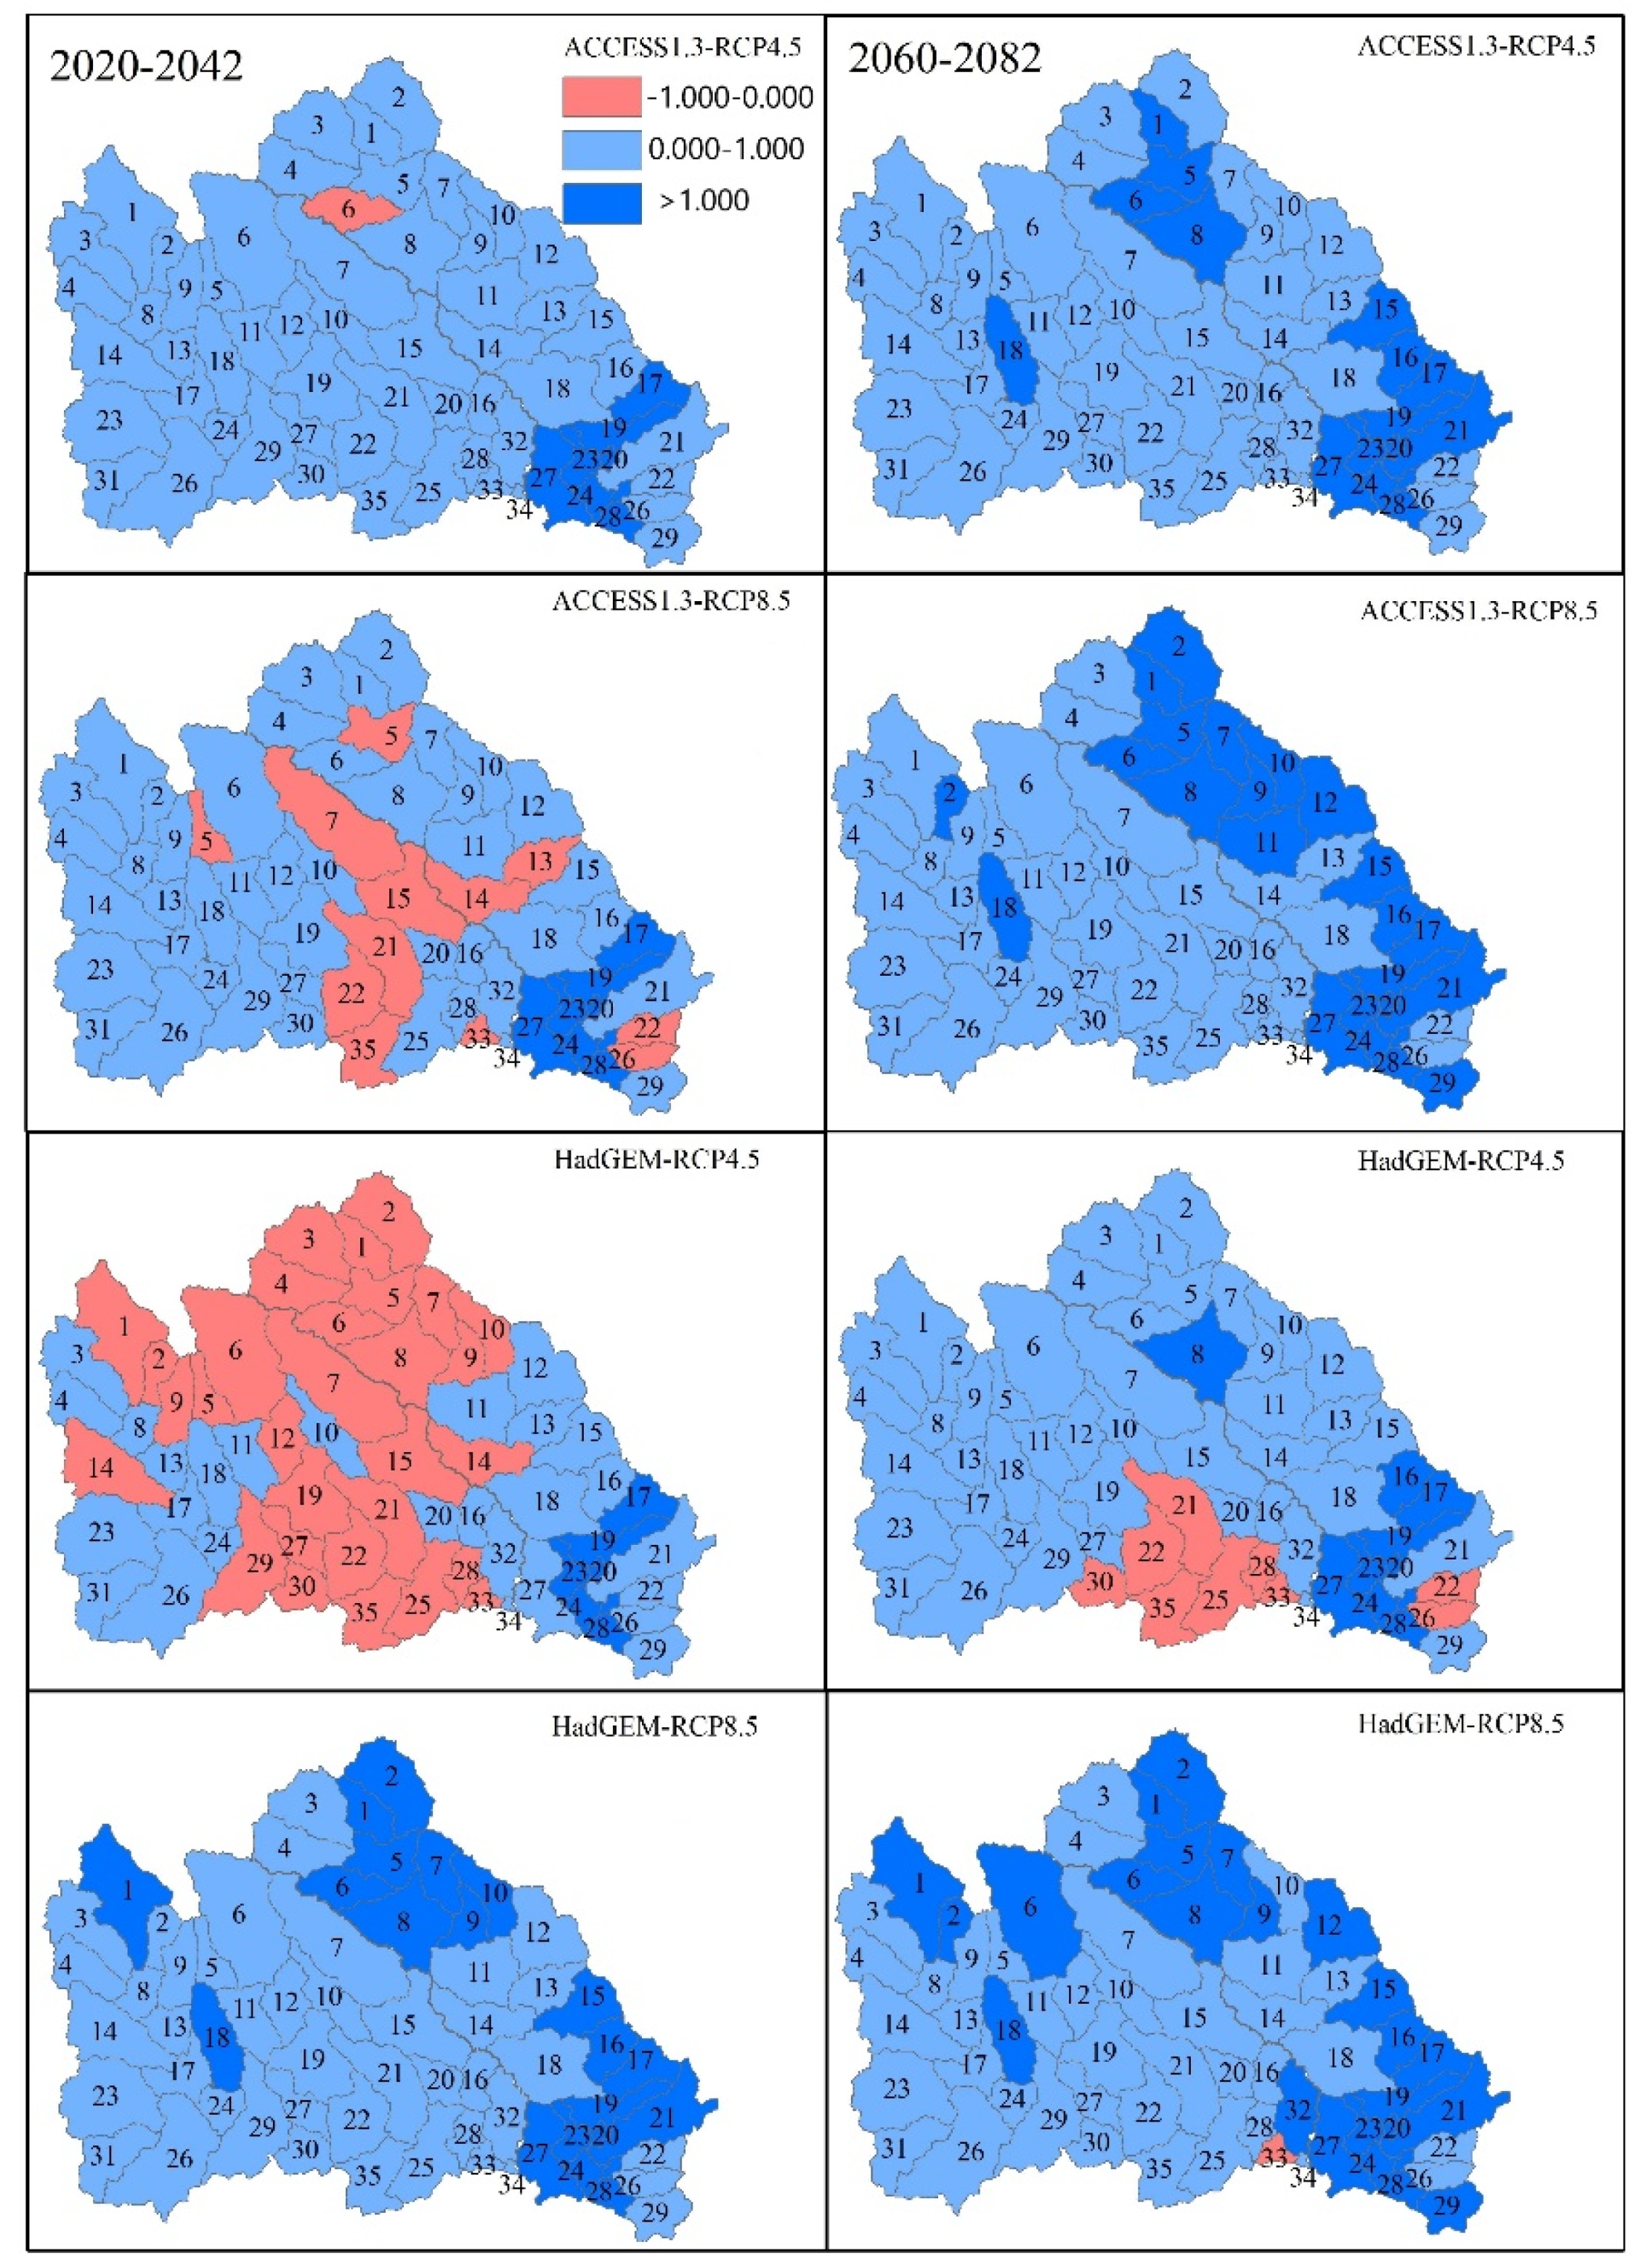
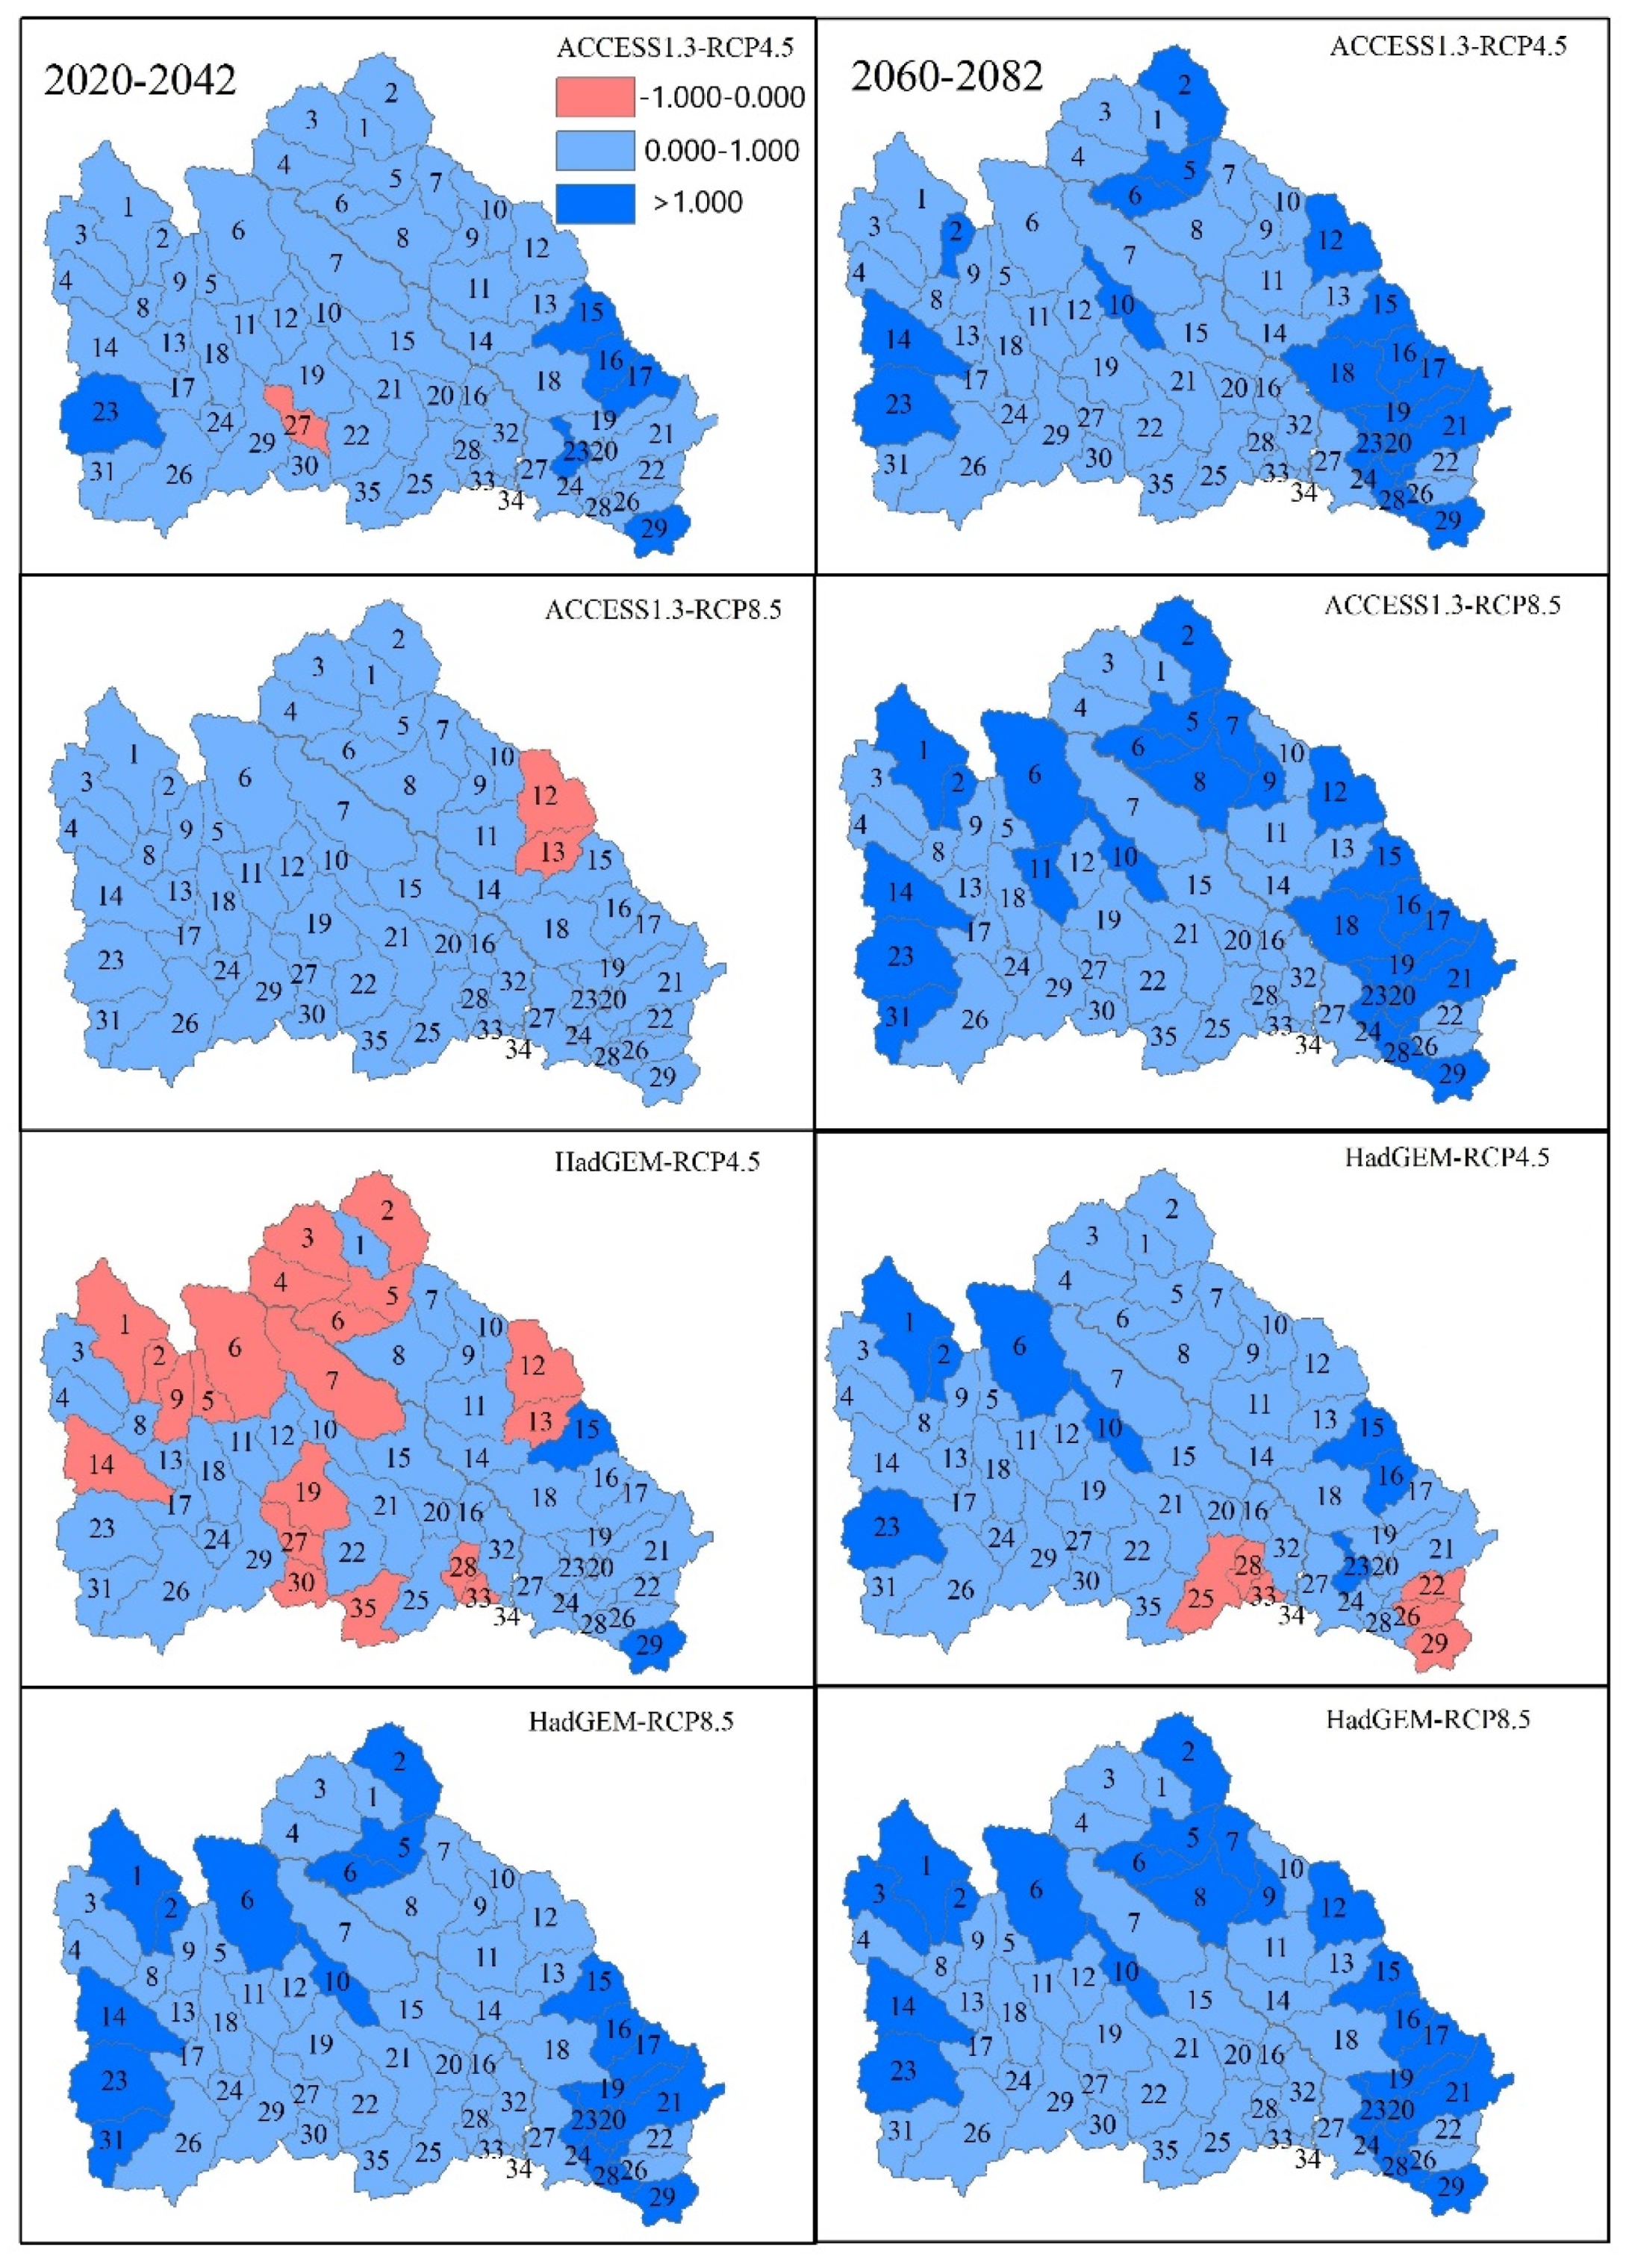
3.5. Climate Change and Land Use Change Impacts on Streamflow and NPS Loading
4. Conclusions
Author Contributions
Funding
Data Availability Statement
Acknowledgments
Conflicts of Interest
References
- Ouyang, W.; Hao, F.-H.; Wang, X.; Cheng, H.-G. Nonpoint Source Pollution Responses Simulation for Conversion Cropland to Forest in Mountains by SWAT in China. Environ. Manag. 2008, 41, 79–89. [Google Scholar] [CrossRef]
- Shen, Z.; Liao, Q.; Hong, Q.; Gong, Y. An Overview of Research on Agricultural Non-Point Source Pollution Modelling in China. Sep. Purif. Technol. 2012, 84, 104–111. [Google Scholar] [CrossRef]
- Wu, L.; Long, T.; Liu, X.; Guo, J. Impacts of Climate and Land-Use Changes on the Migration of Non-Point Source Nitrogen and Phosphorus during Rainfall-Runoff in the Jialing River Watershed, China. J. Hydrol. 2012, 475, 26–41. [Google Scholar] [CrossRef]
- Cobb, A.N.; Thompson, J.L. Climate Change Scenario Planning: A Model for the Integration of Science and Management in Environmental Decision-Making. Environ. Model. Softw. 2012, 38, 296–305. [Google Scholar] [CrossRef]
- Wang, Y.; Bian, J.; Zhao, Y.; Tang, J.; Jia, Z. Assessment of Future Climate Change Impacts on Nonpoint Source Pollution in Snowmelt Period for a Cold Area Using SWAT. Sci. Rep. 2018, 8, 1–13. [Google Scholar] [CrossRef] [PubMed]
- Nguyen, H.H.; Recknagel, F.; Meyer, W.; Frizenschaf, J.; Ying, H.; Gibbs, M.S. Comparison of the Alternative Models SOURCE and SWAT for Predicting Catchment Streamflow, Sediment and Nutrient Loads under the Effect of Land Use Changes. Sci. Total Environ. 2019, 662, 254–265. [Google Scholar] [CrossRef] [PubMed]
- Yang, H.; Wang, G.; Wang, L.; Zheng, B. Impact of Land Use Changes on Water Quality in Headwaters of the Three Gorges Reservoir. Environ. Sci. Pollut. Res. 2016, 23, 11448–11460. [Google Scholar] [CrossRef]
- Zhang, L.; Lu, W.; An, Y.; Li, D.; Gong, L. Response of Non-Point Source Pollutant Loads to Climate Change in the Shitoukoumen Reservoir Catchment. Environ. Monit. Assess. 2012, 184, 581–594. [Google Scholar] [CrossRef] [PubMed]
- Narsimlu, B.; Gosain, A.K.; Chahar, B.R. Assessment of Future Climate Change Impacts on Water Resources of Upper Sind River Watershed, India Using SWAT Model. Water Resour. Manag. 2013, 27, 3647–3662. [Google Scholar] [CrossRef]
- Li, T.; Kim, G. Impacts of Climate Change Scenarios on Non-Point Source Pollution in the Saemangeum Watershed, South Korea. Water 2019, 11, 1982. [Google Scholar] [CrossRef]
- Wang, Q.; Liu, R.; Men, C.; Guo, L. Application of Genetic Algorithm to Land Use Optimization for Non-Point Source Pollution Control Based on CLUE-S and SWAT. J. Hydrol. 2018, 560, 86–96. [Google Scholar] [CrossRef]
- Wang, Q.; Liu, R.; Men, C.; Guo, L.; Miao, Y. Effects of Dynamic Land Use Inputs on Improvement of SWAT Model Performance and Uncertainty Analysis of Outputs. J. Hydrol. 2018, 563, 874–886. [Google Scholar] [CrossRef]
- Bai, Y.; Ochuodho, T.O.; Yang, J. Impact of Land Use and Climate Change on Water-Related Ecosystem Services in Kentucky, USA. Ecol. Indic. 2019, 102, 51–64. [Google Scholar] [CrossRef]
- Bai, X.; Shen, W.; Wang, P.; Chen, X.; He, Y. Response of Non-Point Source Pollution Loads to Land Use Change under Different Precipitation Scenarios from a Future Perspective. Water Resour. Manag. 2020, 34, 3987–4002. [Google Scholar] [CrossRef]
- Liu, R.; Zhang, P.; Wang, X.; Chen, Y.; Shen, Z. Assessment of Effects of Best Management Practices on Agricultural Non-Point Source Pollution in Xiangxi River Watershed. Agric. Water Manag. 2013, 117, 9–18. [Google Scholar] [CrossRef]
- Xie, H.; Chen, L.; Shen, Z. Assessment of Agricultural Best Management Practices Using Models: Current Issues and Future Perspectives. Water 2015, 7, 1088–1108. [Google Scholar] [CrossRef]
- Jang, S.S.; Ahn, S.R.; Kim, S.J. Evaluation of Executable Best Management Practices in Haean Highland Agricultural Catchment of South Korea Using SWAT. Agric. Water Manag. 2017, 180, 224–234. [Google Scholar] [CrossRef]
- Kaini, P.; Artita, K.; Nicklow, J.W. Optimizing Structural Best Management Practices Using SWAT and Genetic Algorithm to Improve Water Quality Goals. Water Resour. Manag. 2012, 26, 1827–1845. [Google Scholar] [CrossRef]
- Jeon, D.J.; Ki, S.J.; Cha, Y.; Park, Y.; Kim, J.H. New Methodology of Evaluation of Best Management Practices Performances for an Agricultural Watershed According to the Climate Change Scenarios: A Hybrid Use of Deterministic and Decision Support Models. Ecol. Eng. 2018, 119, 73–83. [Google Scholar] [CrossRef]
- Yan, T.; Bai, J.; Lee Zhi Yi, A.; Shen, Z. SWAT-Simulated Streamflow Responses to Climate Variability and Human Activities in the Miyun Reservoir Watershed by Considering Streamflow Components. Sustainability 2018, 10, 941. [Google Scholar] [CrossRef]
- Xu, Z.X.; Pang, J.P.; Liu, C.M.; Li, J.Y. Assessment of Runoff and Sediment Yield in the Miyun Reservoir Catchment by Using SWAT Model. Hydrol. Process. 2009, 23, 3619–3630. [Google Scholar] [CrossRef]
- Bai, J.; Shen, Z.; Yan, T. A Comparison of Single- and Multi-Site Calibration and Validation: A Case Study of SWAT in the Miyun Reservoir Watershed, China. Front. Earth Sci. 2017, 11, 592–600. [Google Scholar] [CrossRef]
- Eum, H.-I.; Gupta, A.; Dibike, Y. Effects of Univariate and Multivariate Statistical Downscaling Methods on Climatic and Hydrologic Indicators for Alberta, Canada. J. Hydrol. 2020, 588, 125065. [Google Scholar] [CrossRef]
- Chen, H.; Xu, C.-Y.; Guo, S. Comparison and Evaluation of Multiple GCMs, Statistical Downscaling and Hydrological Models in the Study of Climate Change Impacts on Runoff. J. Hydrol. 2012, 434–435, 36–45. [Google Scholar] [CrossRef]
- Wang, L.; Ranasinghe, R.; Maskey, S.; Van Gelder, P.H.A.J.M.; Vrijling, J.K. Comparison of Empirical Statistical Methods for Downscaling Daily Climate Projections from CMIP5 GCMs: A Case Study of the Huai River Watershed, China. Int. J. Climatol. 2016, 36, 145–164. [Google Scholar] [CrossRef]
- Xu, C. From GCMs to River Flow: A Review of Downscaling Methods and Hydrologic Modelling Approaches. Prog. Phys. Geogr. Earth Environ. 1999, 23, 229–249. [Google Scholar] [CrossRef]
- Abatzoglou, J.T.; Brown, T.J. A Comparison of Statistical Downscaling Methods Suited for Wildfire Applications. Int. J. Climatol. 2012, 32, 772–780. [Google Scholar] [CrossRef]
- Cannon, A.J.; Sobie, S.R.; Murdock, T.Q. Bias Correction of GCM Precipitation by Quantile Mapping: How Well Do Methods Preserve Changes in Quantiles and Extremes? J. Clim. 2015, 28, 6938–6959. [Google Scholar] [CrossRef]
- Ngai, S.T.; Tangang, F.; Juneng, L. Bias Correction of Global and Regional Simulated Daily Precipitation and Surface Mean Temperature over Southeast Asia Using Quantile Mapping Method. Glob. Planet. Chang. 2017, 149, 79–90. [Google Scholar] [CrossRef]
- Yan, T.; Bai, J.; Arsenio, T.; Liu, J.; Shen, Z. Future Climate Change Impacts on Streamflow and Nitrogen Exports Based on CMIP5 Projection in the Miyun Reservoir Basin, China. Ecohydrol. Hydrobiol. 2019, 19, 266–278. [Google Scholar] [CrossRef]
- Zheng, F.; Hu, Y. Assessing Temporal-Spatial Land Use Simulation Effects with CLUE-S and Markov-CA Models in Beijing. Environ. Sci. Pollut. Res. 2018, 25, 32231–32245. [Google Scholar] [CrossRef] [PubMed]
- Qiu, J.; Shen, Z.; Chen, L.; Hou, X. Quantifying Effects of Conservation Practices on Non-Point Source Pollution in the Miyun Reservoir Watershed, China. Environ. Monit. Assess. 2019, 191, 1–21. [Google Scholar] [CrossRef] [PubMed]
- Jia, K.; Ruan, Y.; Yang, Y.; Zhang, C. Assessing the Performance of CMIP5 Global Climate Models for Simulating Future Precipitation Change in the Tibetan Plateau. Water 2019, 11, 1771. [Google Scholar] [CrossRef]
- Bao, Z.; Fu, G.; Wang, G.; Jin, J.; He, R.; Yan, X.; Liu, C. Hydrological Projection for the Miyun Reservoir Watershed with the Impact of Climate Change and Human Activity. Quat. Int. 2012, 282, 96–103. [Google Scholar] [CrossRef]
- Sun, Q.; Miao, C.; Duan, Q. Comparative Analysis of CMIP3 and CMIP5 Global Climate Models for Simulating the Daily Mean, Maximum and Minimum Temperatures and Daily Precipitation over China. J. Geophys. Res. Atmos. 2015, 120, 4806–4824. [Google Scholar] [CrossRef]


| Land Use Type | 2000 | 2008 | 2000–2008 Annual Rate of Change (%) | ||
|---|---|---|---|---|---|
| Area (hm2) | Proportion (%) | Area (hm2) | Proportion (%) | ||
| Forest | 755,689 | 49.21 | 757,623 | 49.33 | 0.03 |
| Grassland | 414,709 | 27.00 | 413,809 | 26.94 | −0.03 |
| Water body | 28,757 | 1.87 | 28,658 | 1.87 | −0.04 |
| Urban land | 8780 | 0.57 | 9268 | 0.60 | 0.69 |
| Unused land | 2334 | 0.15 | 2287 | 0.15 | −0.25 |
| Farmland | 325,491 | 21.19 | 324,115 | 21.10 | −0.05 |
| Land Use | Farmland | Forest | Grassland | Water Body | Building Land | Unused Land |
|---|---|---|---|---|---|---|
| Farmland | 258,199.6 | 24,567.0 | 36,784.1 | 4004.6 | 2475.4 | 77.9 |
| Forest | 19,689.0 | 696,492.3 | 43,751.8 | 1235.1 | 537.2 | 151.0 |
| Grassland | 42,513.1 | 40,151.6 | 325,528.0 | 931.8 | 359.0 | 402.6 |
| Water body | 3452.4 | 1204.5 | 1523.4 | 21,342.1 | 96.8 | 1.8 |
| Building land | 2111.0 | 268.8 | 205.3 | 120.0 | 4911.7 | 0.0 |
| Unused land | 125.6 | 158.5 | 299.9 | 21.0 | 0.0 | 1617.6 |
| Variable | Time Period | Chaohe River | Baihe River | ||
|---|---|---|---|---|---|
| R2 | Ens | R2 | Ens | ||
| Streamflow | Calibration (1999–2002) | 0.851 | 0.848 | 0.908 | 0.906 |
| Validation (2003–2005) | 0.856 | 0.809 | 0.754 | 0.745 | |
| Total Nitrogen | Calibration (1999–2002) | 0.798 | 0.763 | 0.865 | 0.737 |
| Validation (2003–2005) | 0.505 | 0.389 | 0.573 | 0.142 | |
| Variable | Base Period (1988–2010) | Evaluation Period 1 (2020–2042) | Evaluation Period 2 (2060–2082) | ||
|---|---|---|---|---|---|
| RCP4.5 | RCP8.5 | RCP4.5 | RCP8.5 | ||
| Evaporation (mm) | 438.7 | 436.2 | 452.5 | 466.5 | |
| 429.1 | 437.6 | 435.0 | 450.5 | 461.3 | |
| Runoff (mm) | 48.47 | 50.45 | 51.13 | 54.46 | |
| 46.61 | 49.32 | 51.37 | 52.84 | 58.56 | |
| Sediment (104 ton/ha) | 1.198 | 1.382 | 1.470 | 1.619 | |
| 1.05 | 1.220 | 1.379 | 1.474 | 1.708 | |
| Total nitrogen (ton/ha) | 1.401 | 1.691 | 1.723 | 1.905 | |
| 1.20 | |||||
| Total phosphorus (ton/ha) | 0.0360 | 0.0419 | 0.0448 | 0.0494 | |
| 0.03 | 0.0363 | 0.0418 | 0.0443 | 0.0506 | |
| Variable | History | 2020–2042 | 2060–2082 | ||||||
|---|---|---|---|---|---|---|---|---|---|
| RCP4.5 | RCP8.5 | RCP4.5 | RCP8.5 | ||||||
| GCM1 | GCM2 | GCM1 | GCM2 | GCM1 | GCM2 | GCM1 | GCM2 | ||
| Sediment reduction | −4.7 | −23.01 | −31.26 | −30.05 | −6.19 | −12.76 | −16.1 | −6.41 | −5.89 |
| Sediment reduction rate | −4.10% | −15.9% | −27.0% | −24.8% | −3.8% | −7.5% | −12.3% | −3.5% | −3.5% |
| Total nitrogen reduction | 248.74 | −60.53 | −208.15 | −130.34 | 173.11 | 71.49 | 20.18 | 214.54 | 201.87 |
| Total nitrogen reduction rate | 15.70% | −3.0% | −12.1% | −6.7% | 6.6% | 2.9% | 0.9% | 7.6% | 7.2% |
| Total phosphorus reduction | 7.44 | −6.23 | −10.84 | −9.45 | 0.74 | −2.32 | −2.39 | 1.13 | 1.06 |
| Total phosphorus reduction rate | 16.30% | −10.7% | −22.9% | −18.5% | 1.1% | −3.4% | −4.1% | 1.5% | 1.5% |
| Variable | History | 2020–2042 | 2060–2082 | ||||||
|---|---|---|---|---|---|---|---|---|---|
| RCP4.5 | RCP8.5 | RCP4.5 | RCP8.5 | ||||||
| GCM1 | GCM2 | GCM1 | GCM2 | GCM1 | GCM2 | GCM1 | GCM2 | ||
| Sediment reduction | −10.15 | −9.68 | −9.56 | −11.59 | −10.45 | −12.74 | −9.76 | −10.63 | −9.69 |
| Sediment reduction rate | −8.90% | −6.7% | −8.3% | −9.6% | −6.3% | −7.5% | −7.5% | −5.9% | −5.7% |
| Total nitrogen reduction | 218.81 | 417.82 | 343.04 | 429.56 | 643.86 | 595.69 | 518.67 | 701.03 | 737.87 |
| Total nitrogen reduction rate | 13.80% | 20.4% | 19.9% | 22.0% | 24.5% | 24.0% | 23.4% | 24.8% | 26.5% |
| Total phosphorus reduction | 6.17 | −4.13 | −4.46 | −4.59 | −4.30 | −5.16 | −3.77 | −4.74 | −3.49 |
| Total phosphorus reduction rate | 13.50% | −7.1% | −9.4% | −9.0% | −6.2% | −7.5% | −6.4% | −6.4% | −4.9% |
| Variable | History | 2020–2042 | 2060–2082 | ||||||
|---|---|---|---|---|---|---|---|---|---|
| RCP4.5 | RCP8.5 | RCP4.5 | RCP8.5 | ||||||
| GCM1 | GCM2 | GCM1 | GCM2 | GCM1 | GCM2 | GCM1 | GCM2 | ||
| Sediment reduction | 12.88 | 16.96 | 15.17 | 14.75 | 18.24 | 18.29 | 14.23 | 19.4 | 18.96 |
| Sediment reduction rate | 11.30% | 11.7% | 13.1% | 12.2% | 11.1% | 10.8% | 10.9% | 10.7% | 11.2% |
| Total nitrogen reduction | 280.92 | 115.00 | 111.82 | 147.20 | 164.31 | 152.22 | 149.20 | 171.37 | 187.73 |
| Total nitrogen reduction rate | 17.80% | 5.6% | 6.5% | 7.5% | 6.2% | 6.1% | 6.7% | 6.1% | 6.7% |
| Total phosphorus reduction | 8.12 | 4.44 | 3.89 | 4.00 | 5.05 | 4.90 | 4.21 | 5.24 | 5.24 |
| Total phosphorus reduction rate | 17.80% | 7.6% | 8.2% | 7.8% | 7.2% | 7.1% | 7.1% | 7.1% | 7.3% |
Publisher’s Note: MDPI stays neutral with regard to jurisdictional claims in published maps and institutional affiliations. |
© 2021 by the authors. Licensee MDPI, Basel, Switzerland. This article is an open access article distributed under the terms and conditions of the Creative Commons Attribution (CC BY) license (http://creativecommons.org/licenses/by/4.0/).
Share and Cite
Feng, M.; Shen, Z. Assessment of the Impacts of Land Use Change on Non-Point Source Loading under Future Climate Scenarios Using the SWAT Model. Water 2021, 13, 874. https://doi.org/10.3390/w13060874
Feng M, Shen Z. Assessment of the Impacts of Land Use Change on Non-Point Source Loading under Future Climate Scenarios Using the SWAT Model. Water. 2021; 13(6):874. https://doi.org/10.3390/w13060874
Chicago/Turabian StyleFeng, Mao, and Zhenyao Shen. 2021. "Assessment of the Impacts of Land Use Change on Non-Point Source Loading under Future Climate Scenarios Using the SWAT Model" Water 13, no. 6: 874. https://doi.org/10.3390/w13060874
APA StyleFeng, M., & Shen, Z. (2021). Assessment of the Impacts of Land Use Change on Non-Point Source Loading under Future Climate Scenarios Using the SWAT Model. Water, 13(6), 874. https://doi.org/10.3390/w13060874