
The Impacts of the Geographic Distribution of Manufacturing Plants on Groundwater Withdrawal in China


Abstract
1. Introduction
2. Materials and Methods
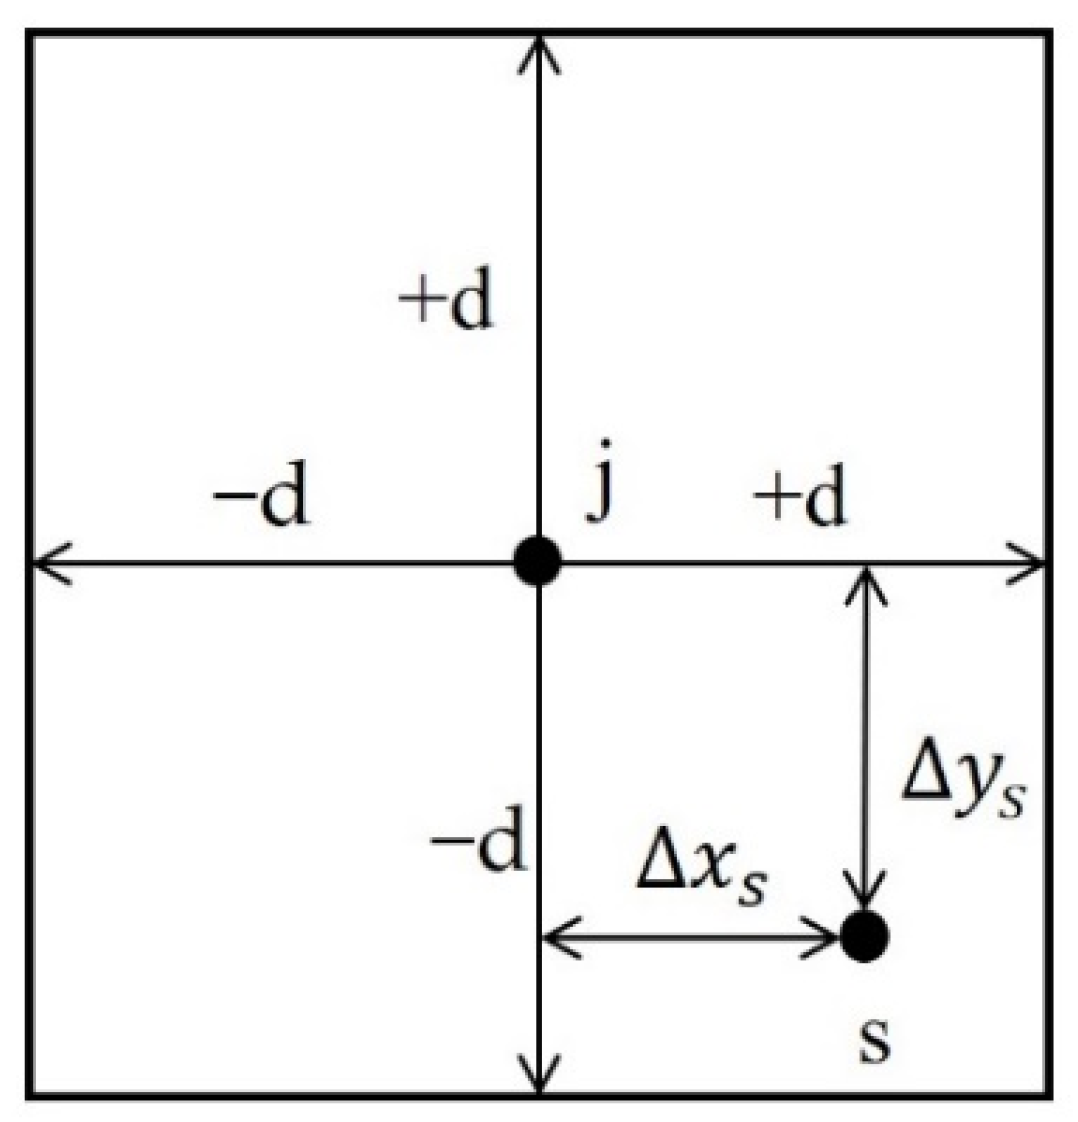
2.1. Factory Scatter Index (FSI)
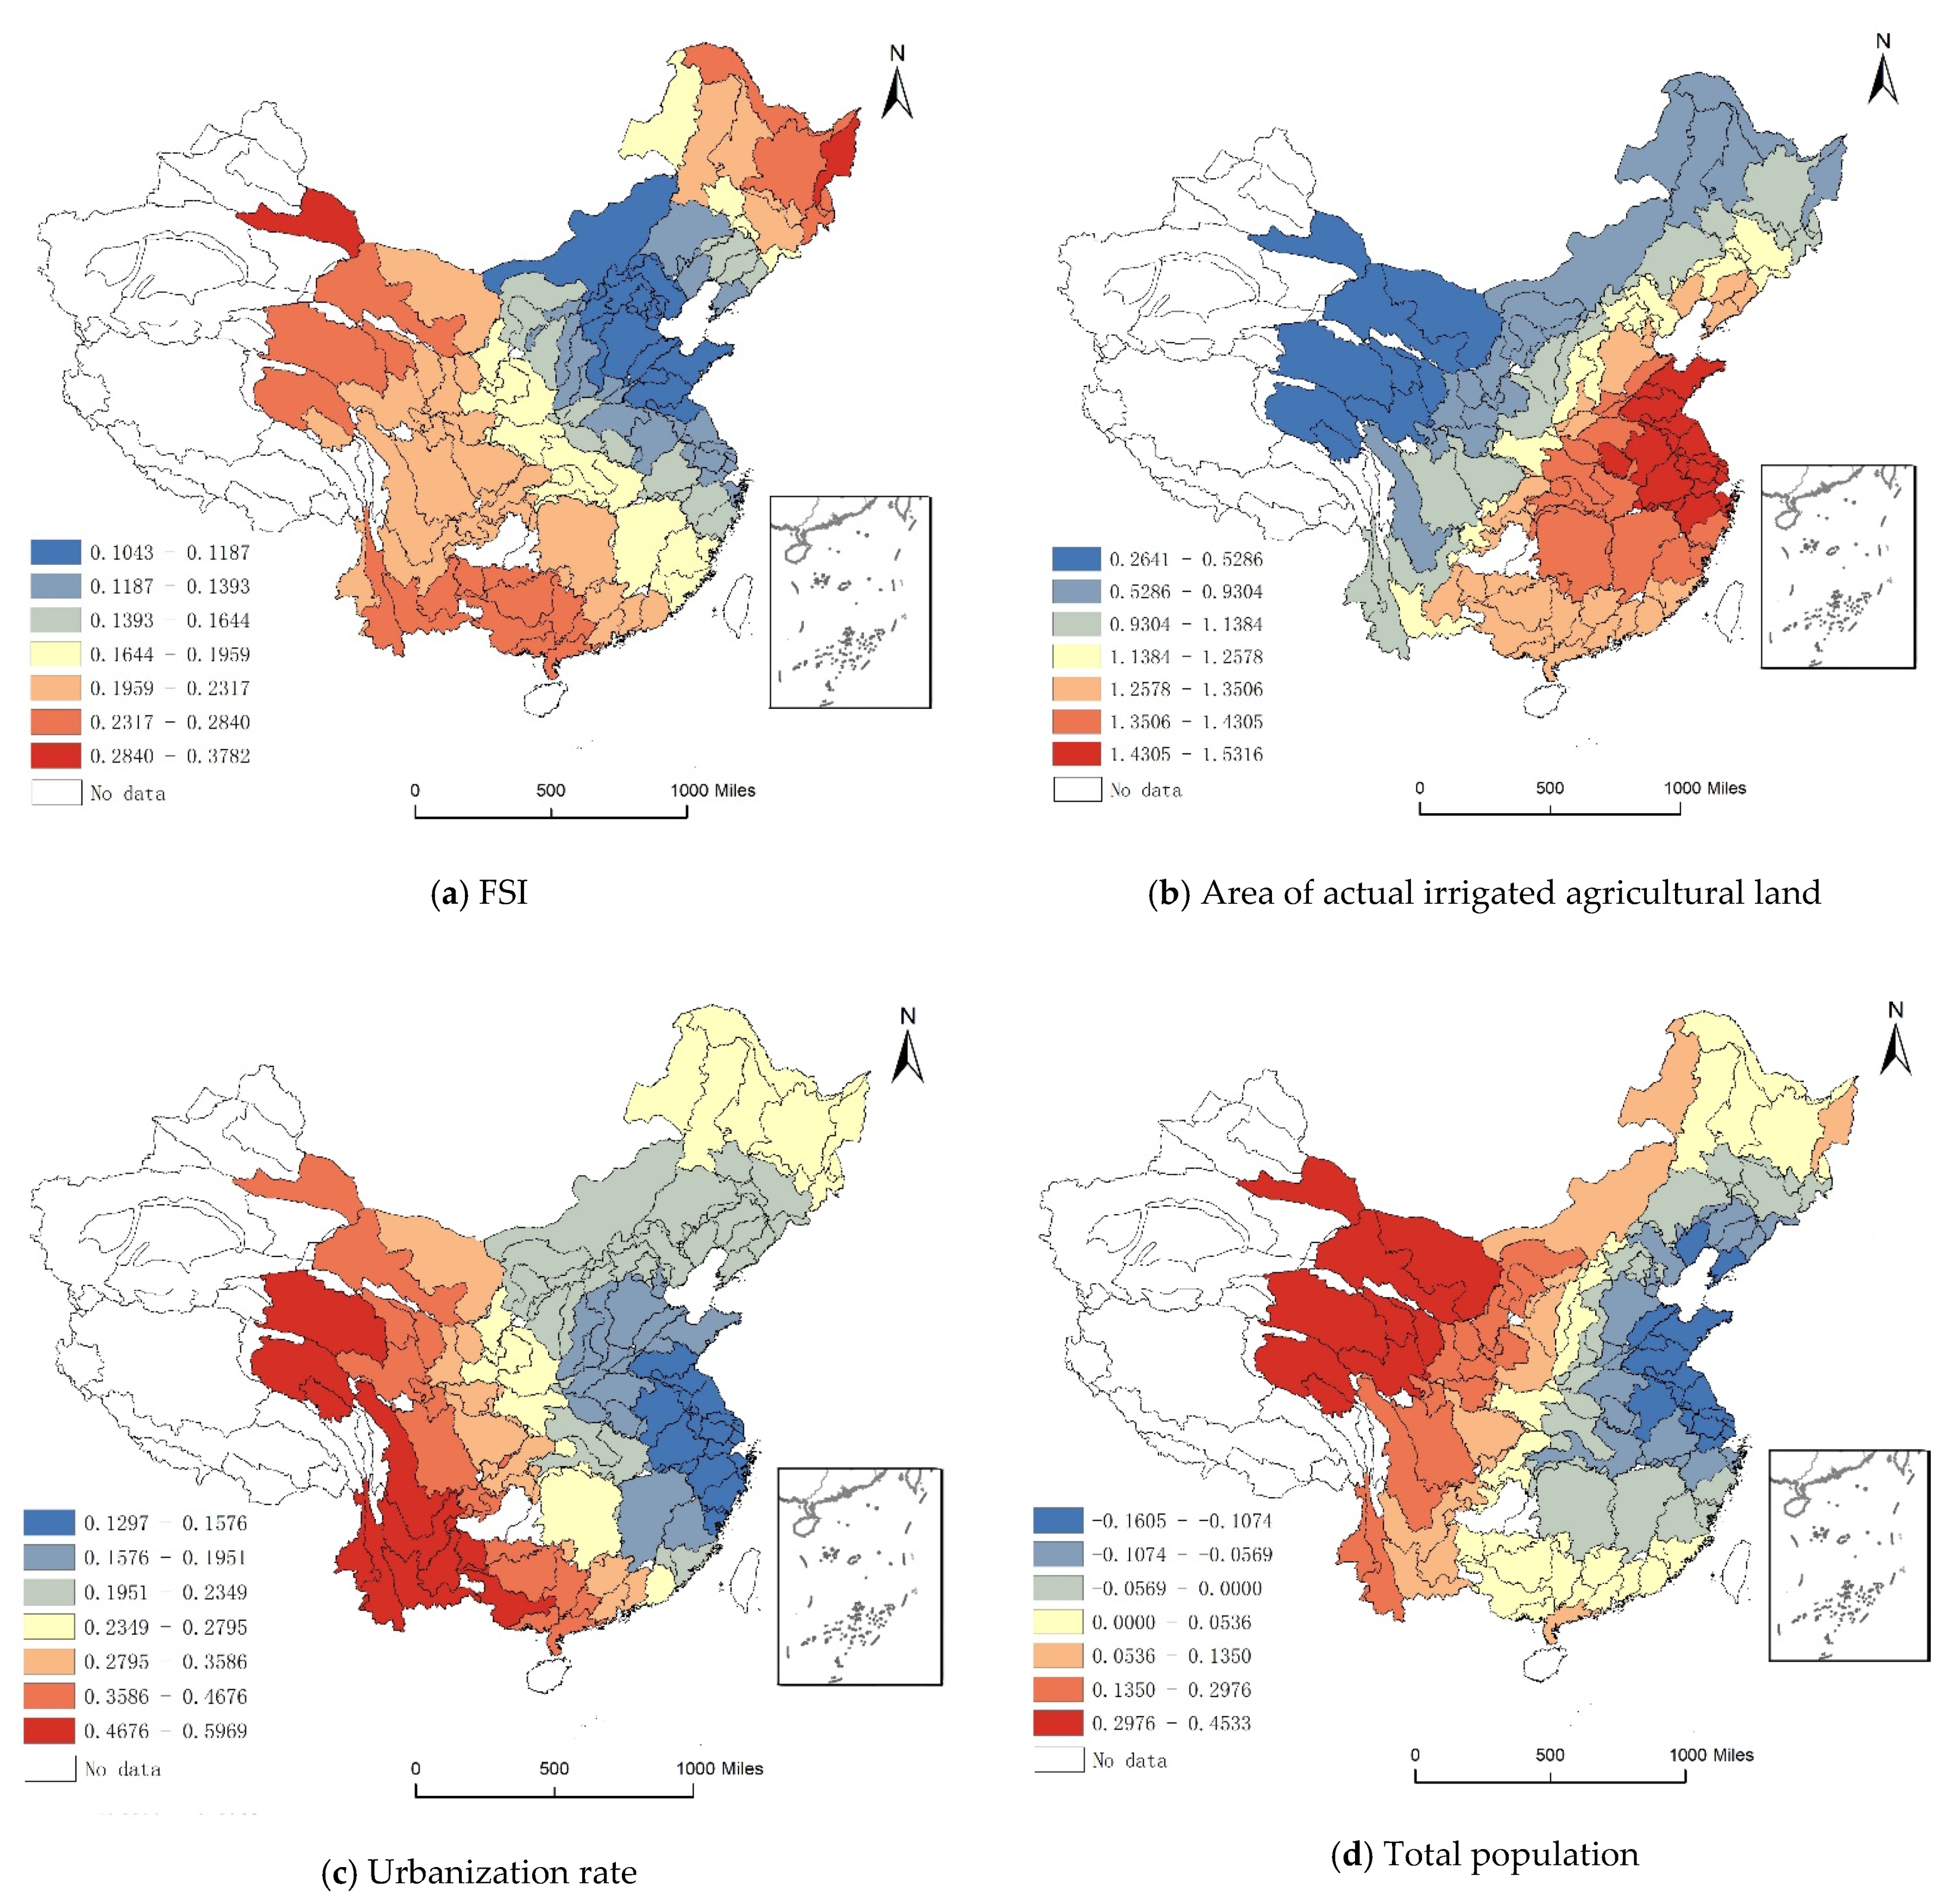
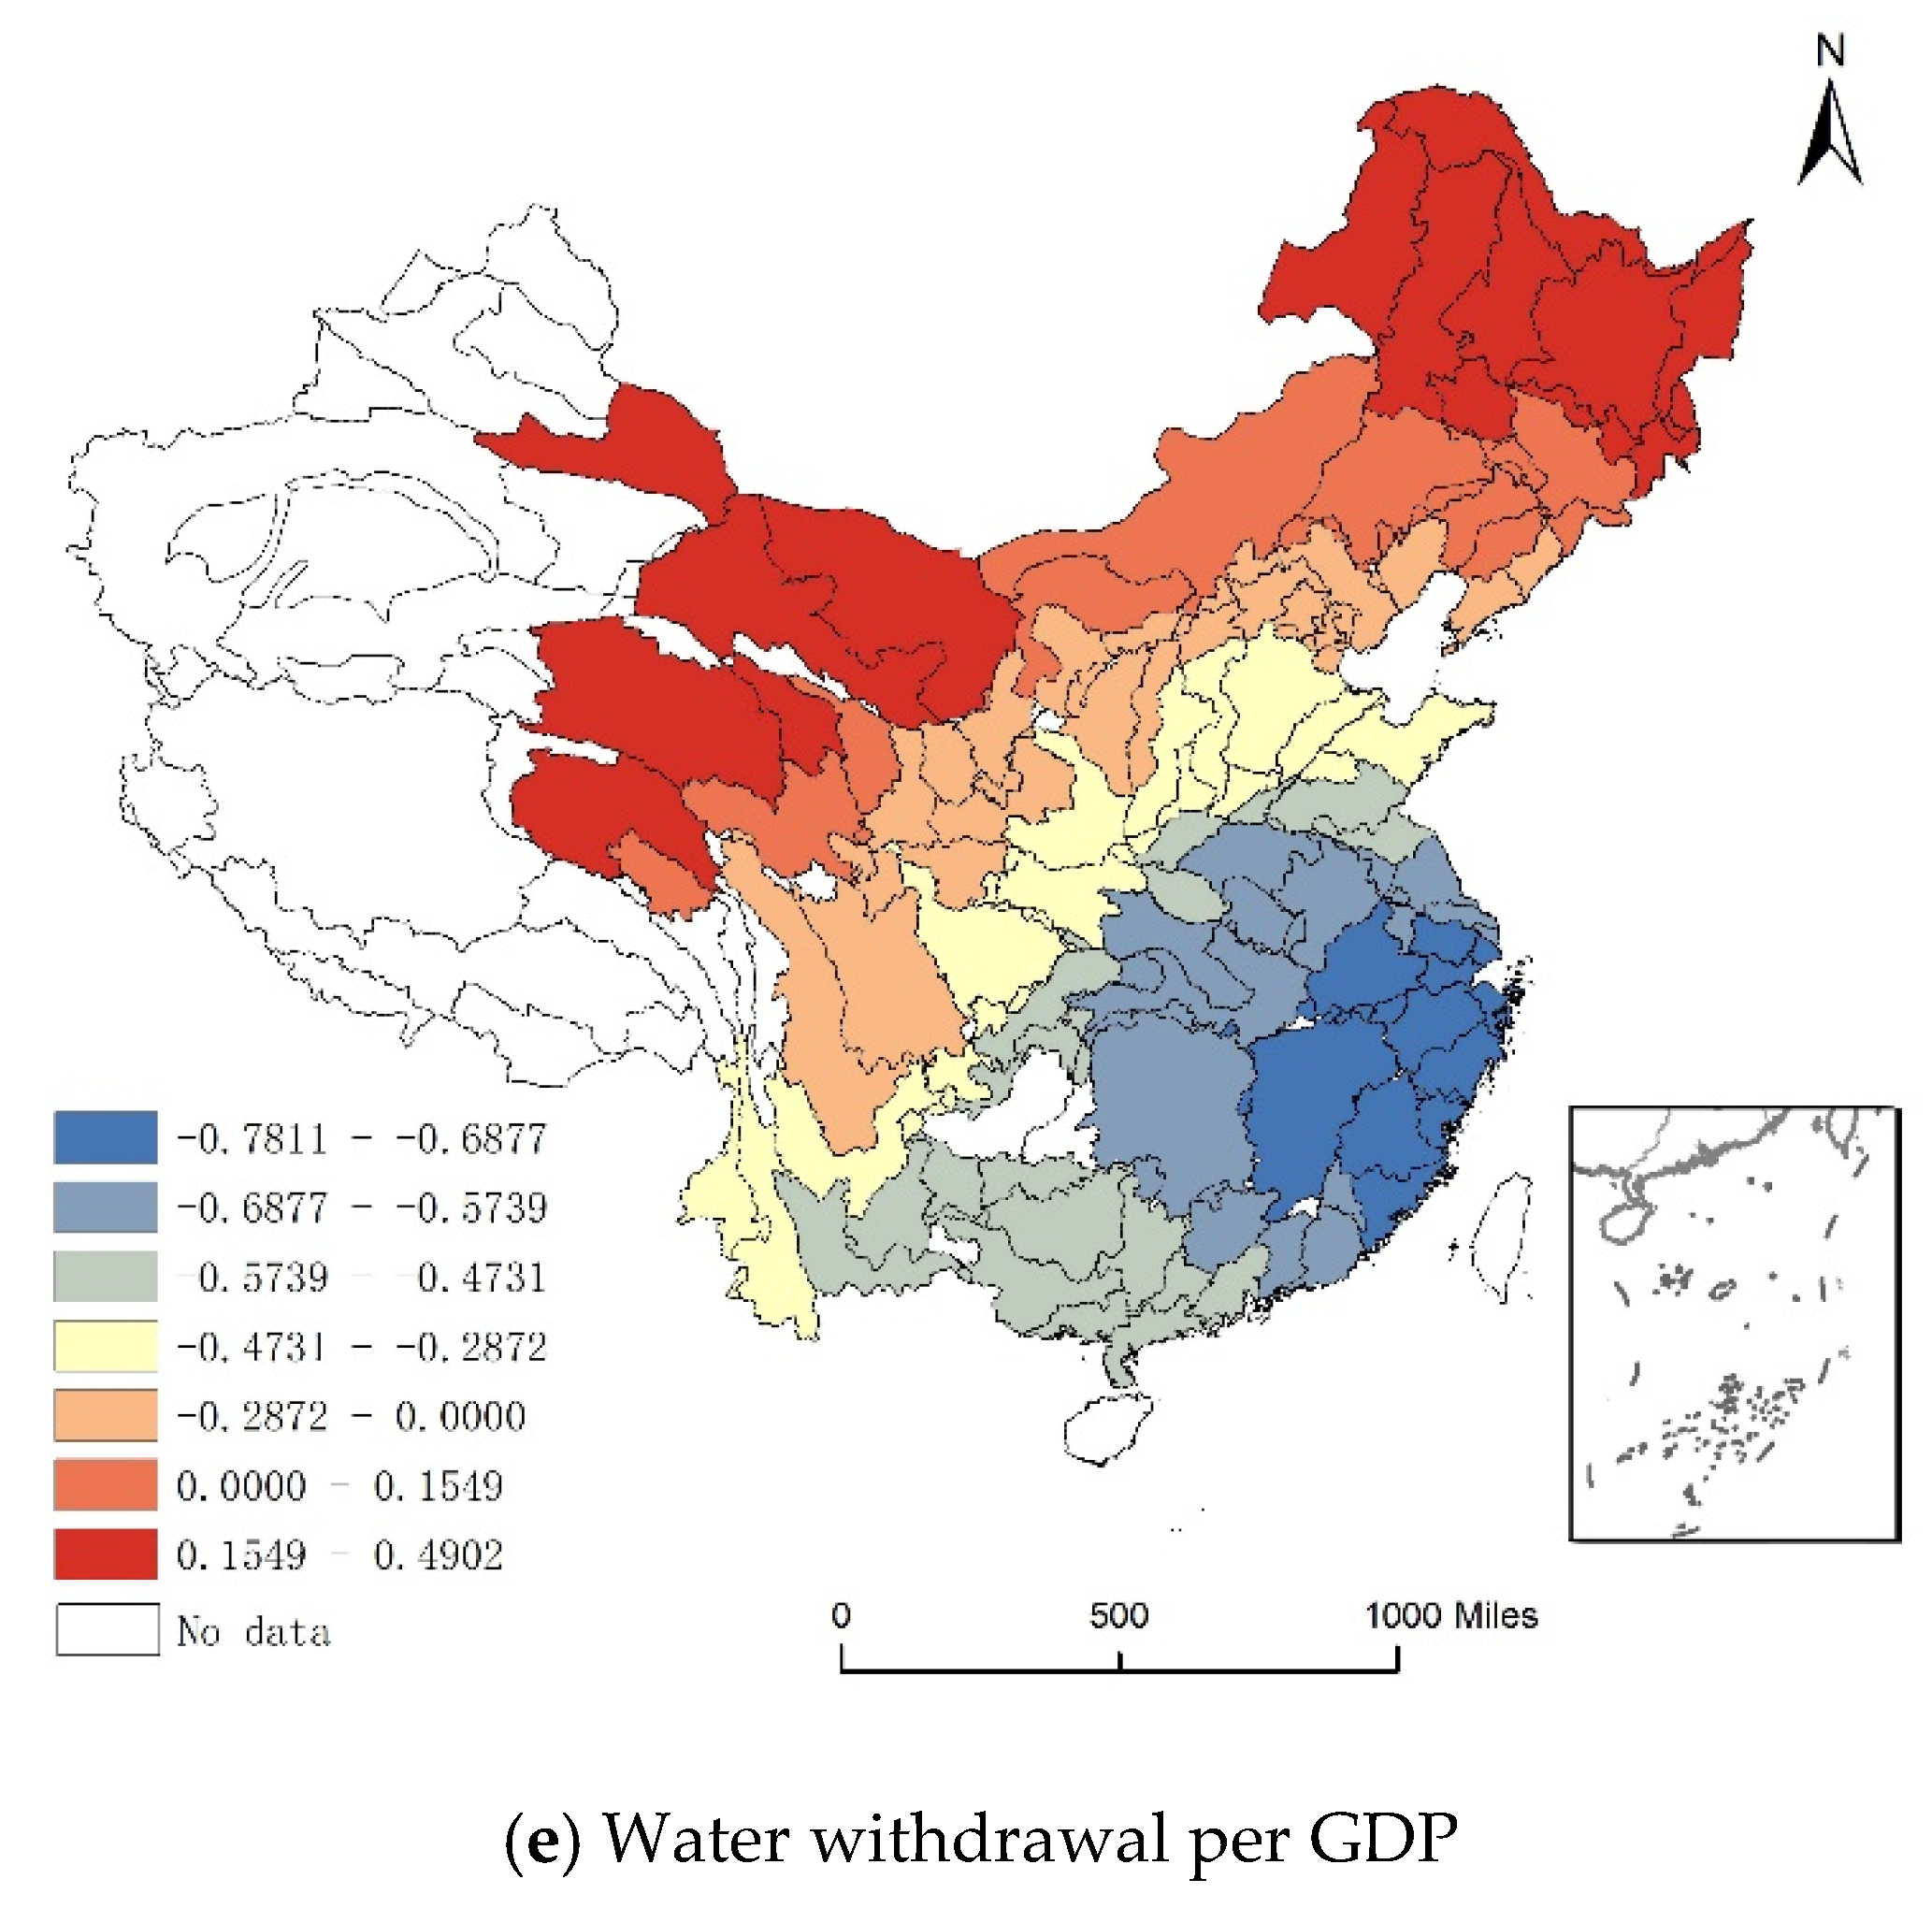
2.2. Models and Variables
- Social-economic factors
- Natural factors
3. Results
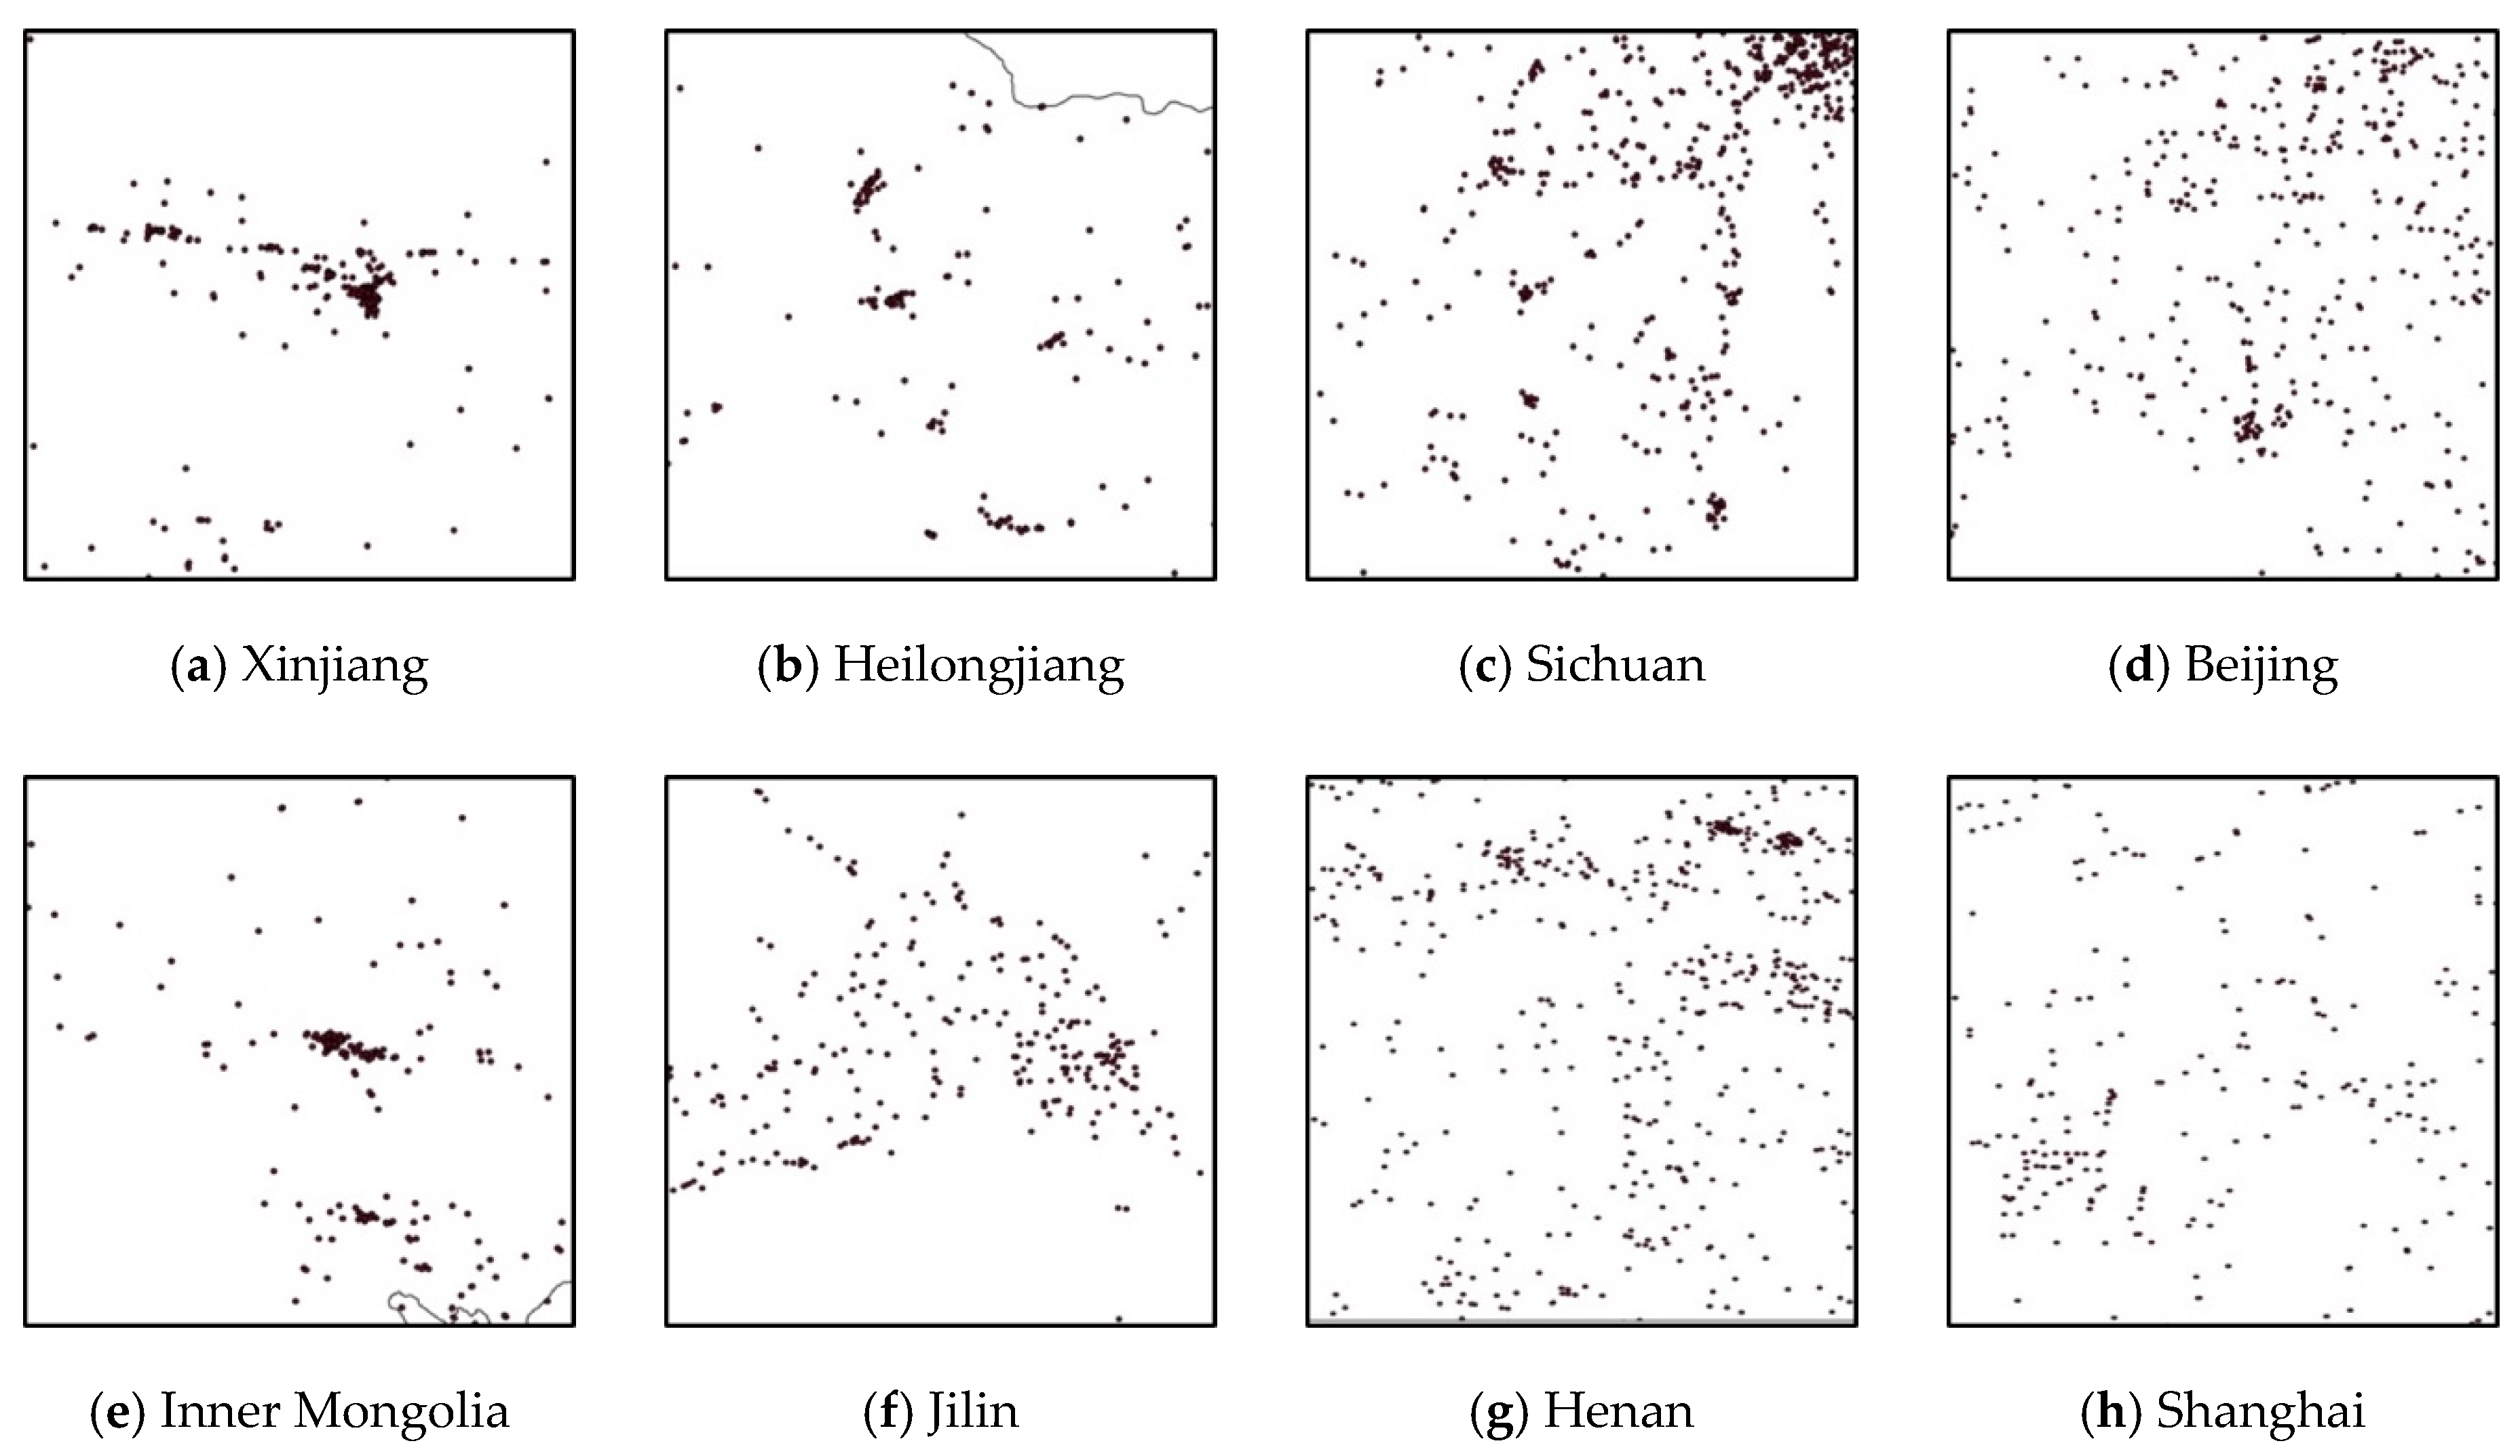
3.1. General Characteristics of the Distribution of Manufacturing Plants in China
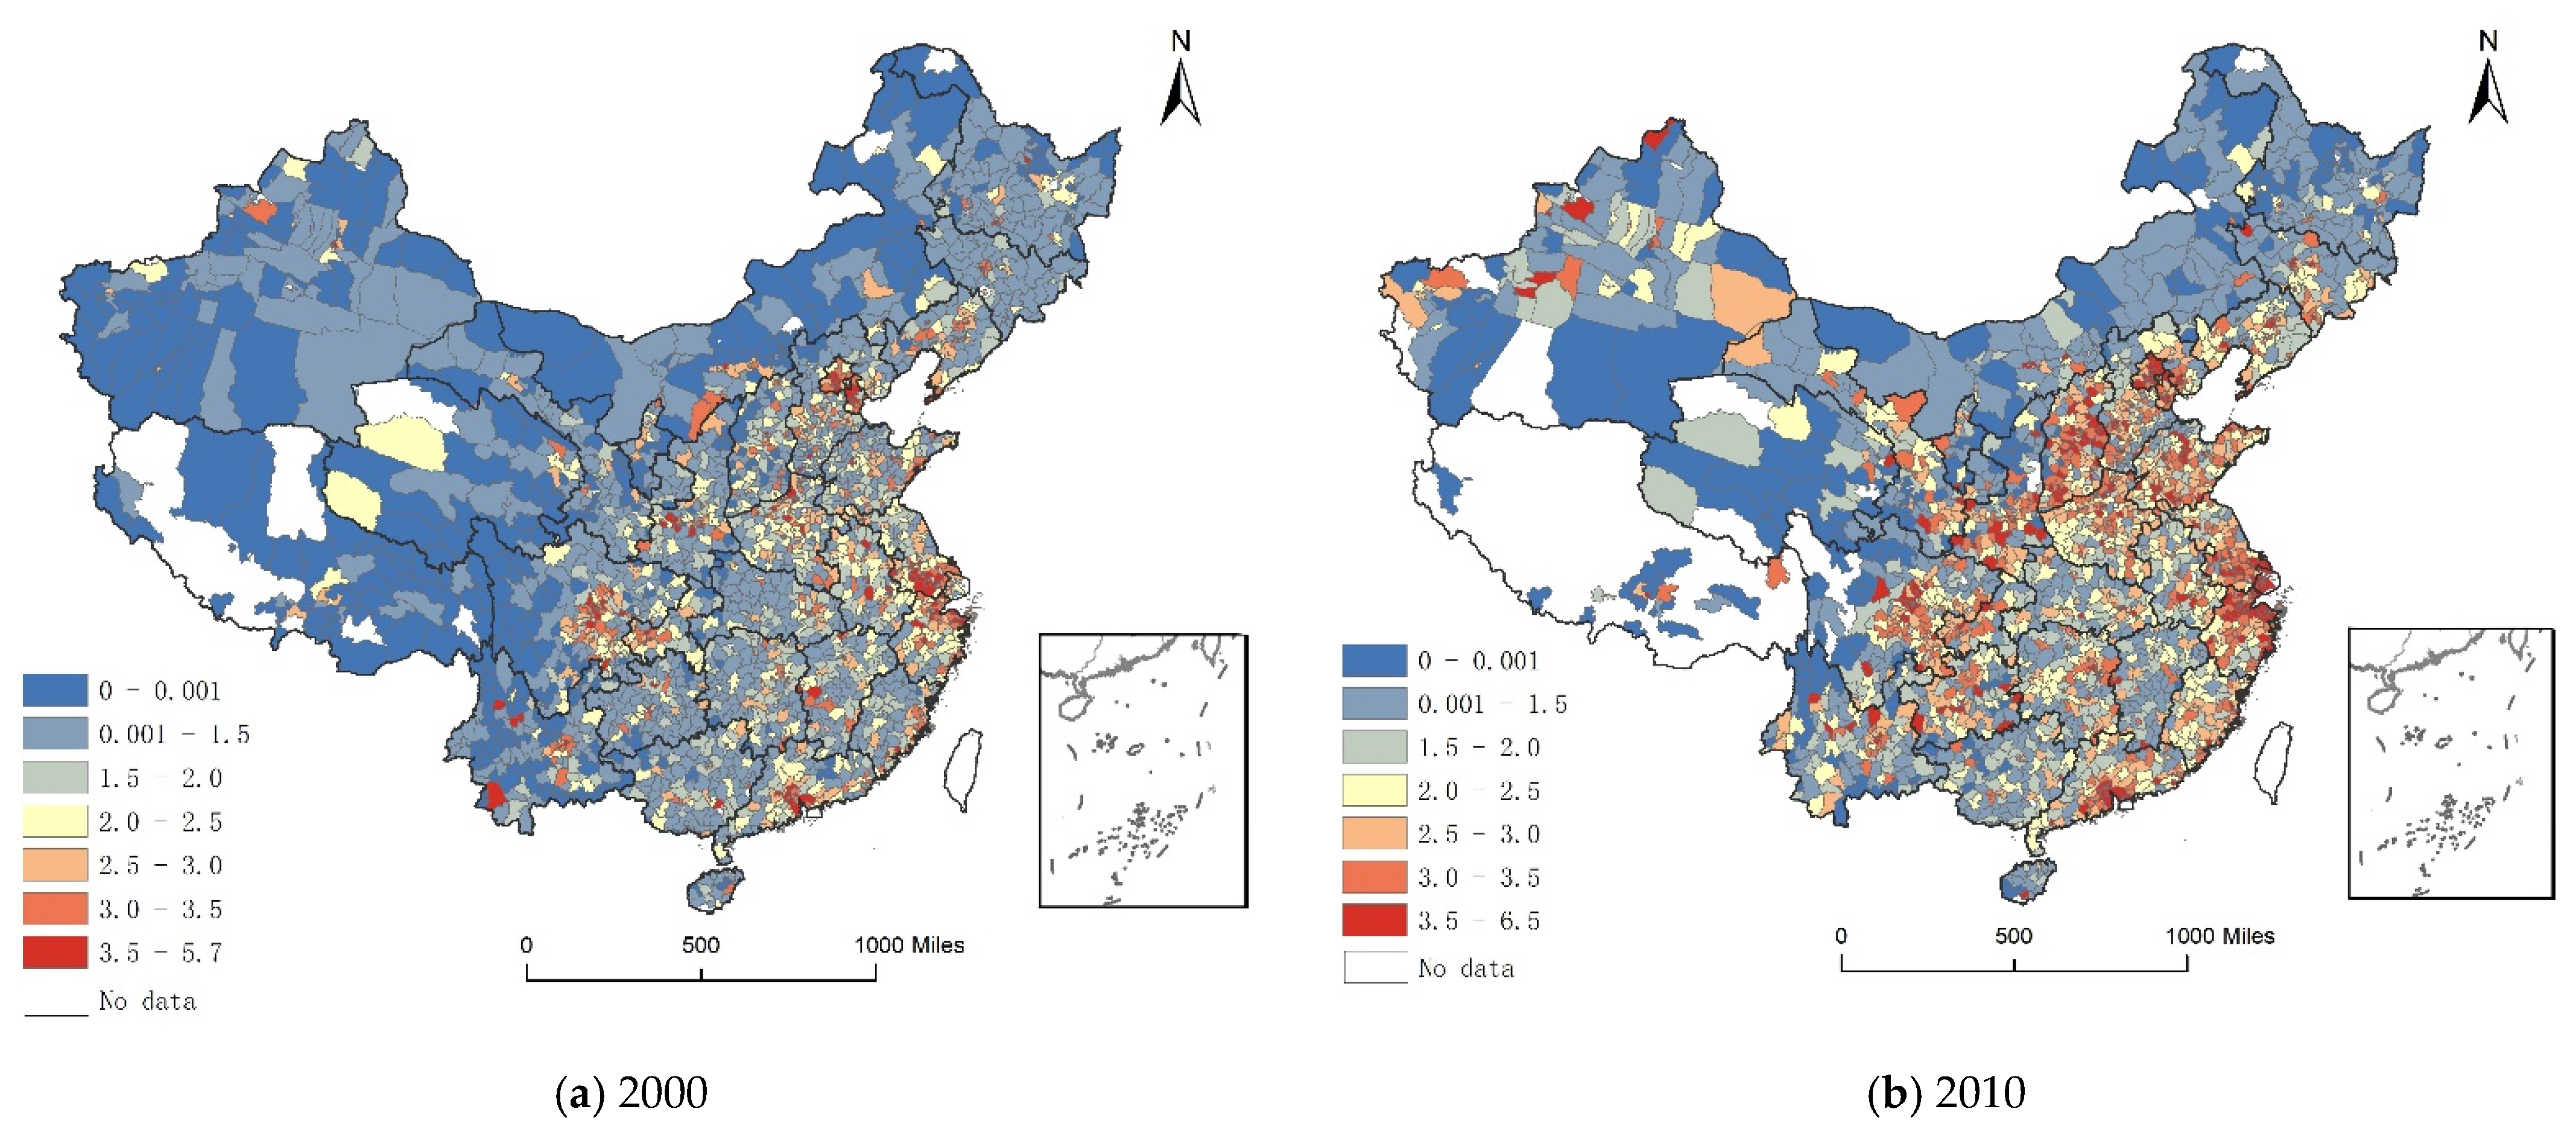
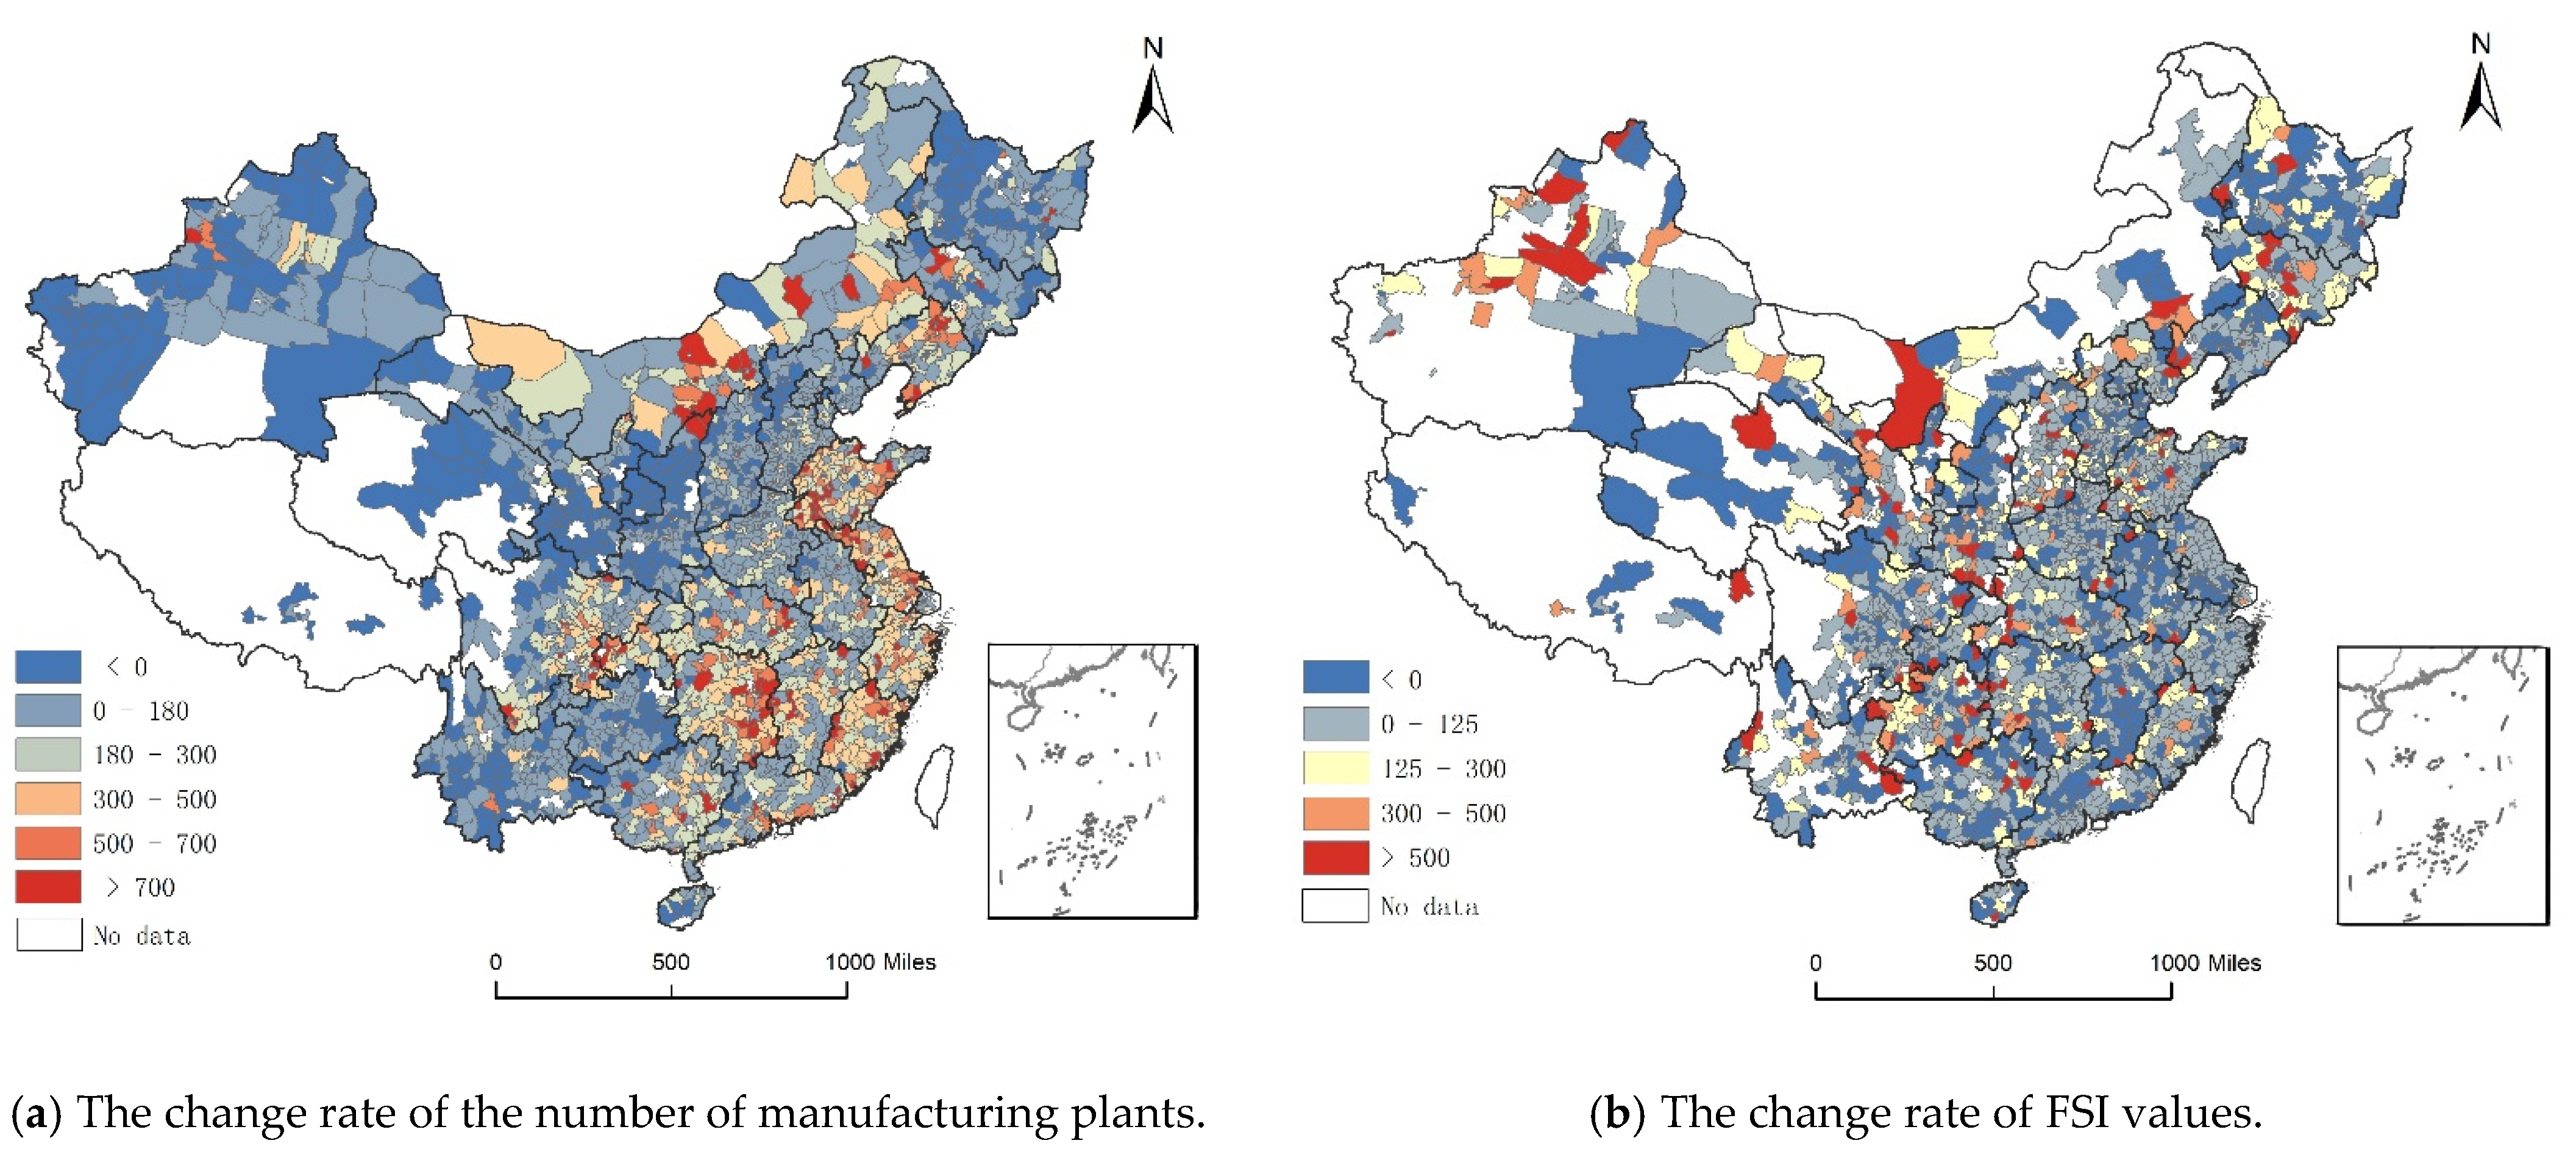
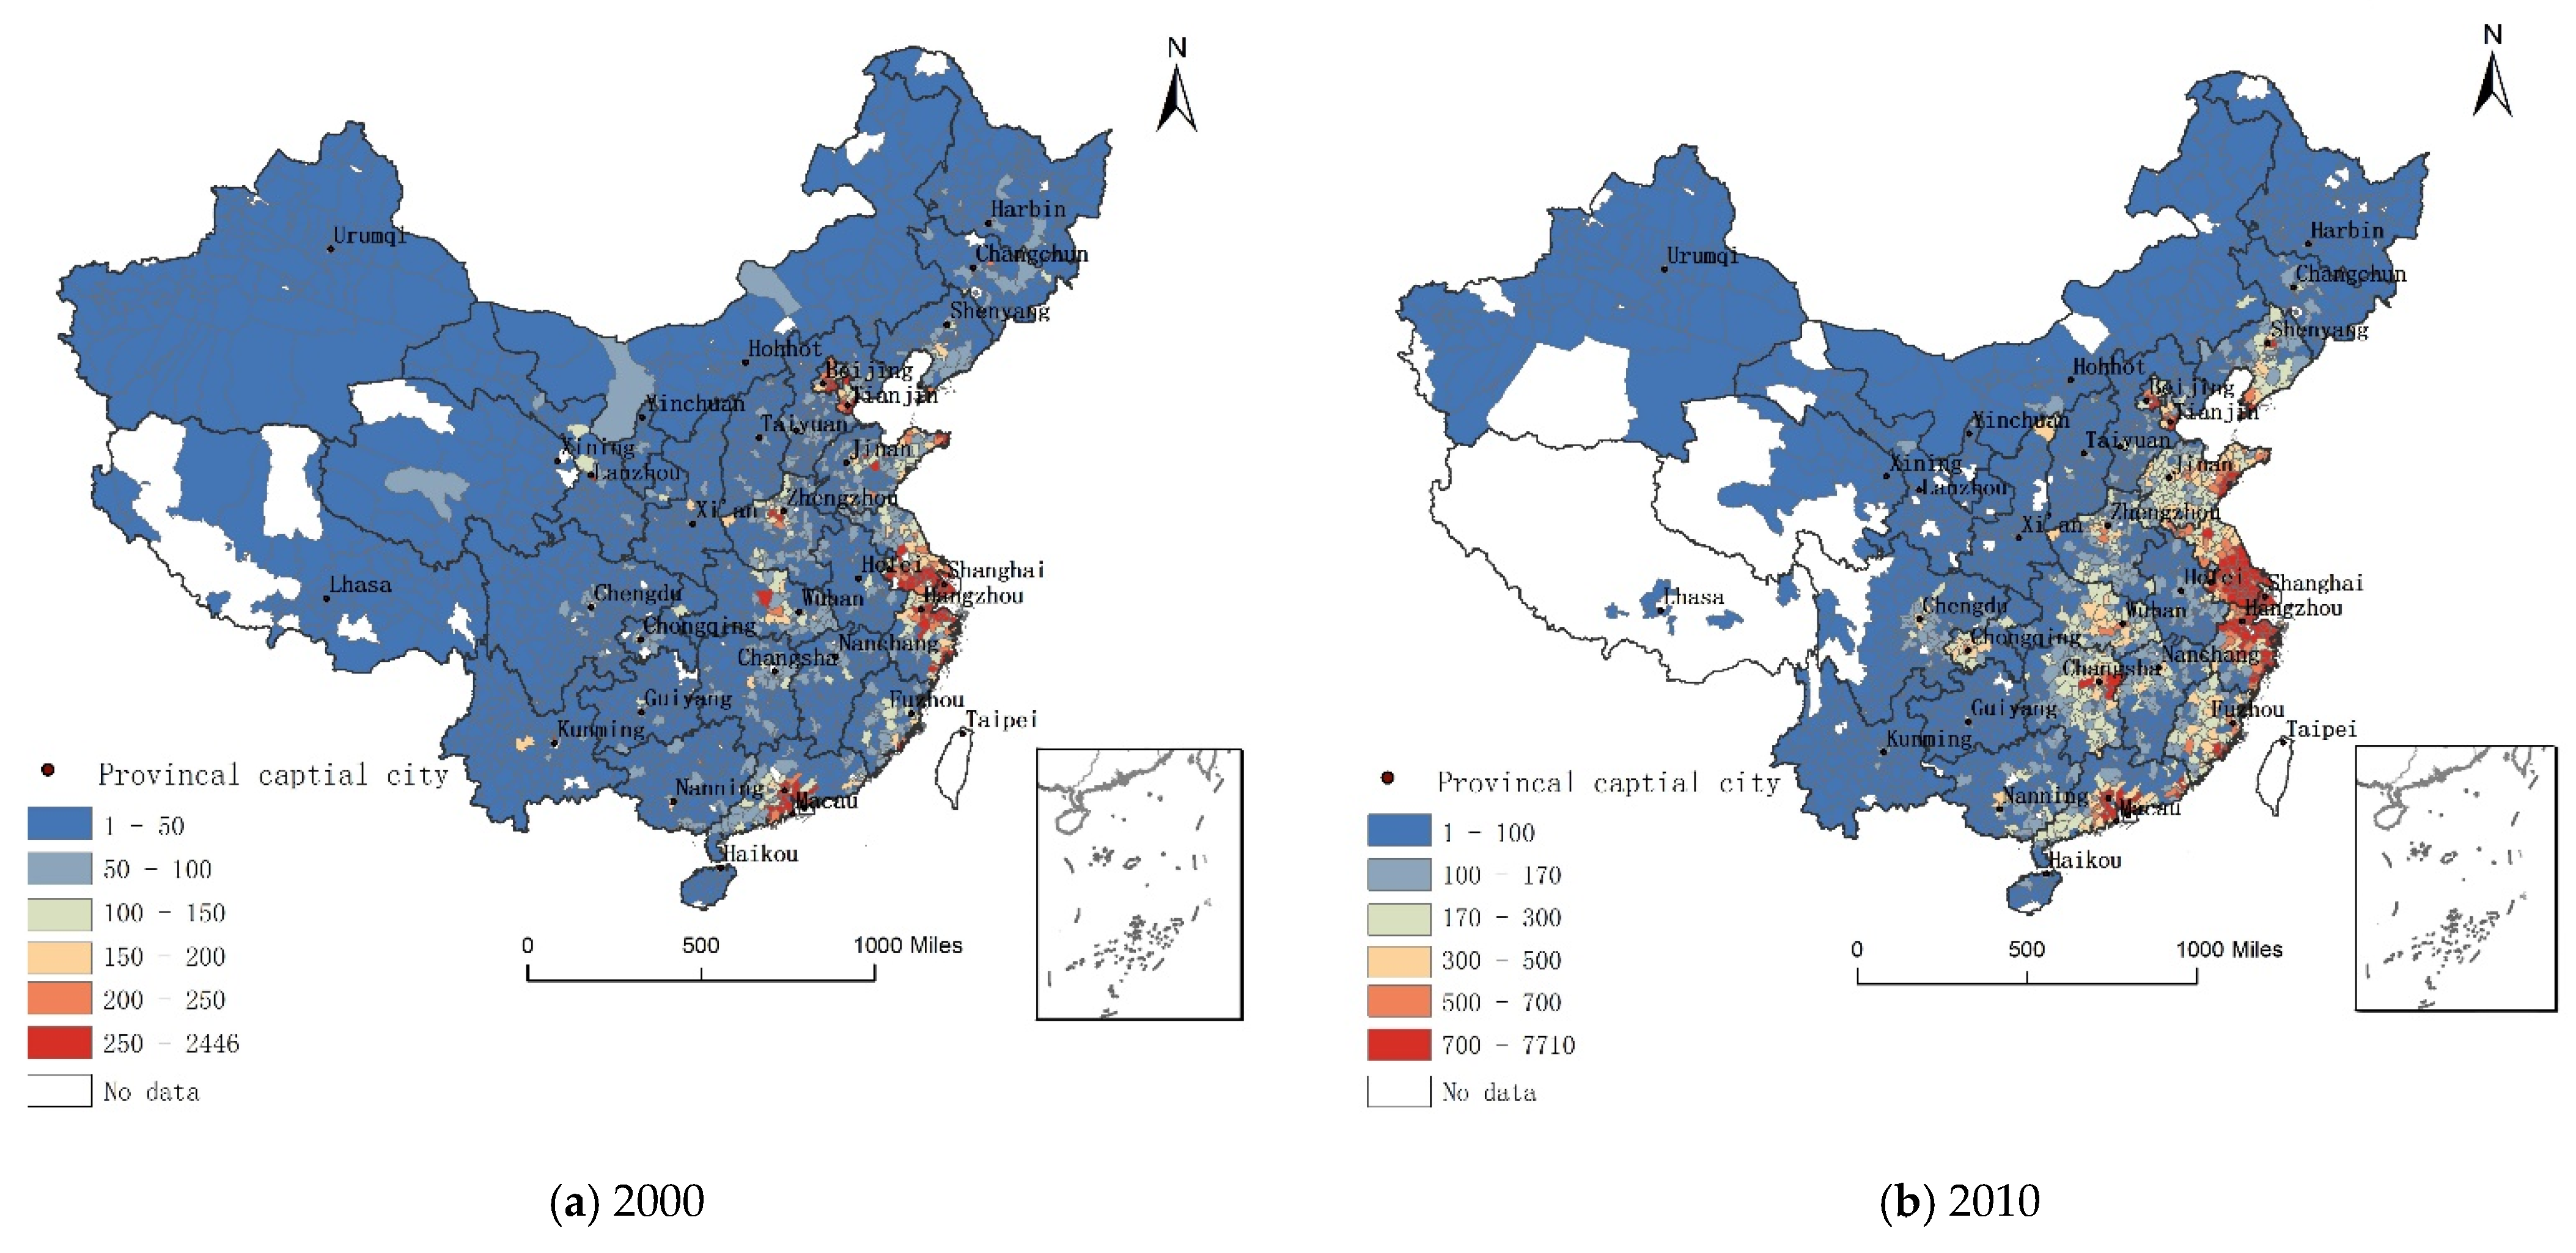
3.2. The Evolution of the Spatial Distribution of Manufacturing Plants in China
3.3. Empirical Results
4. Discussion
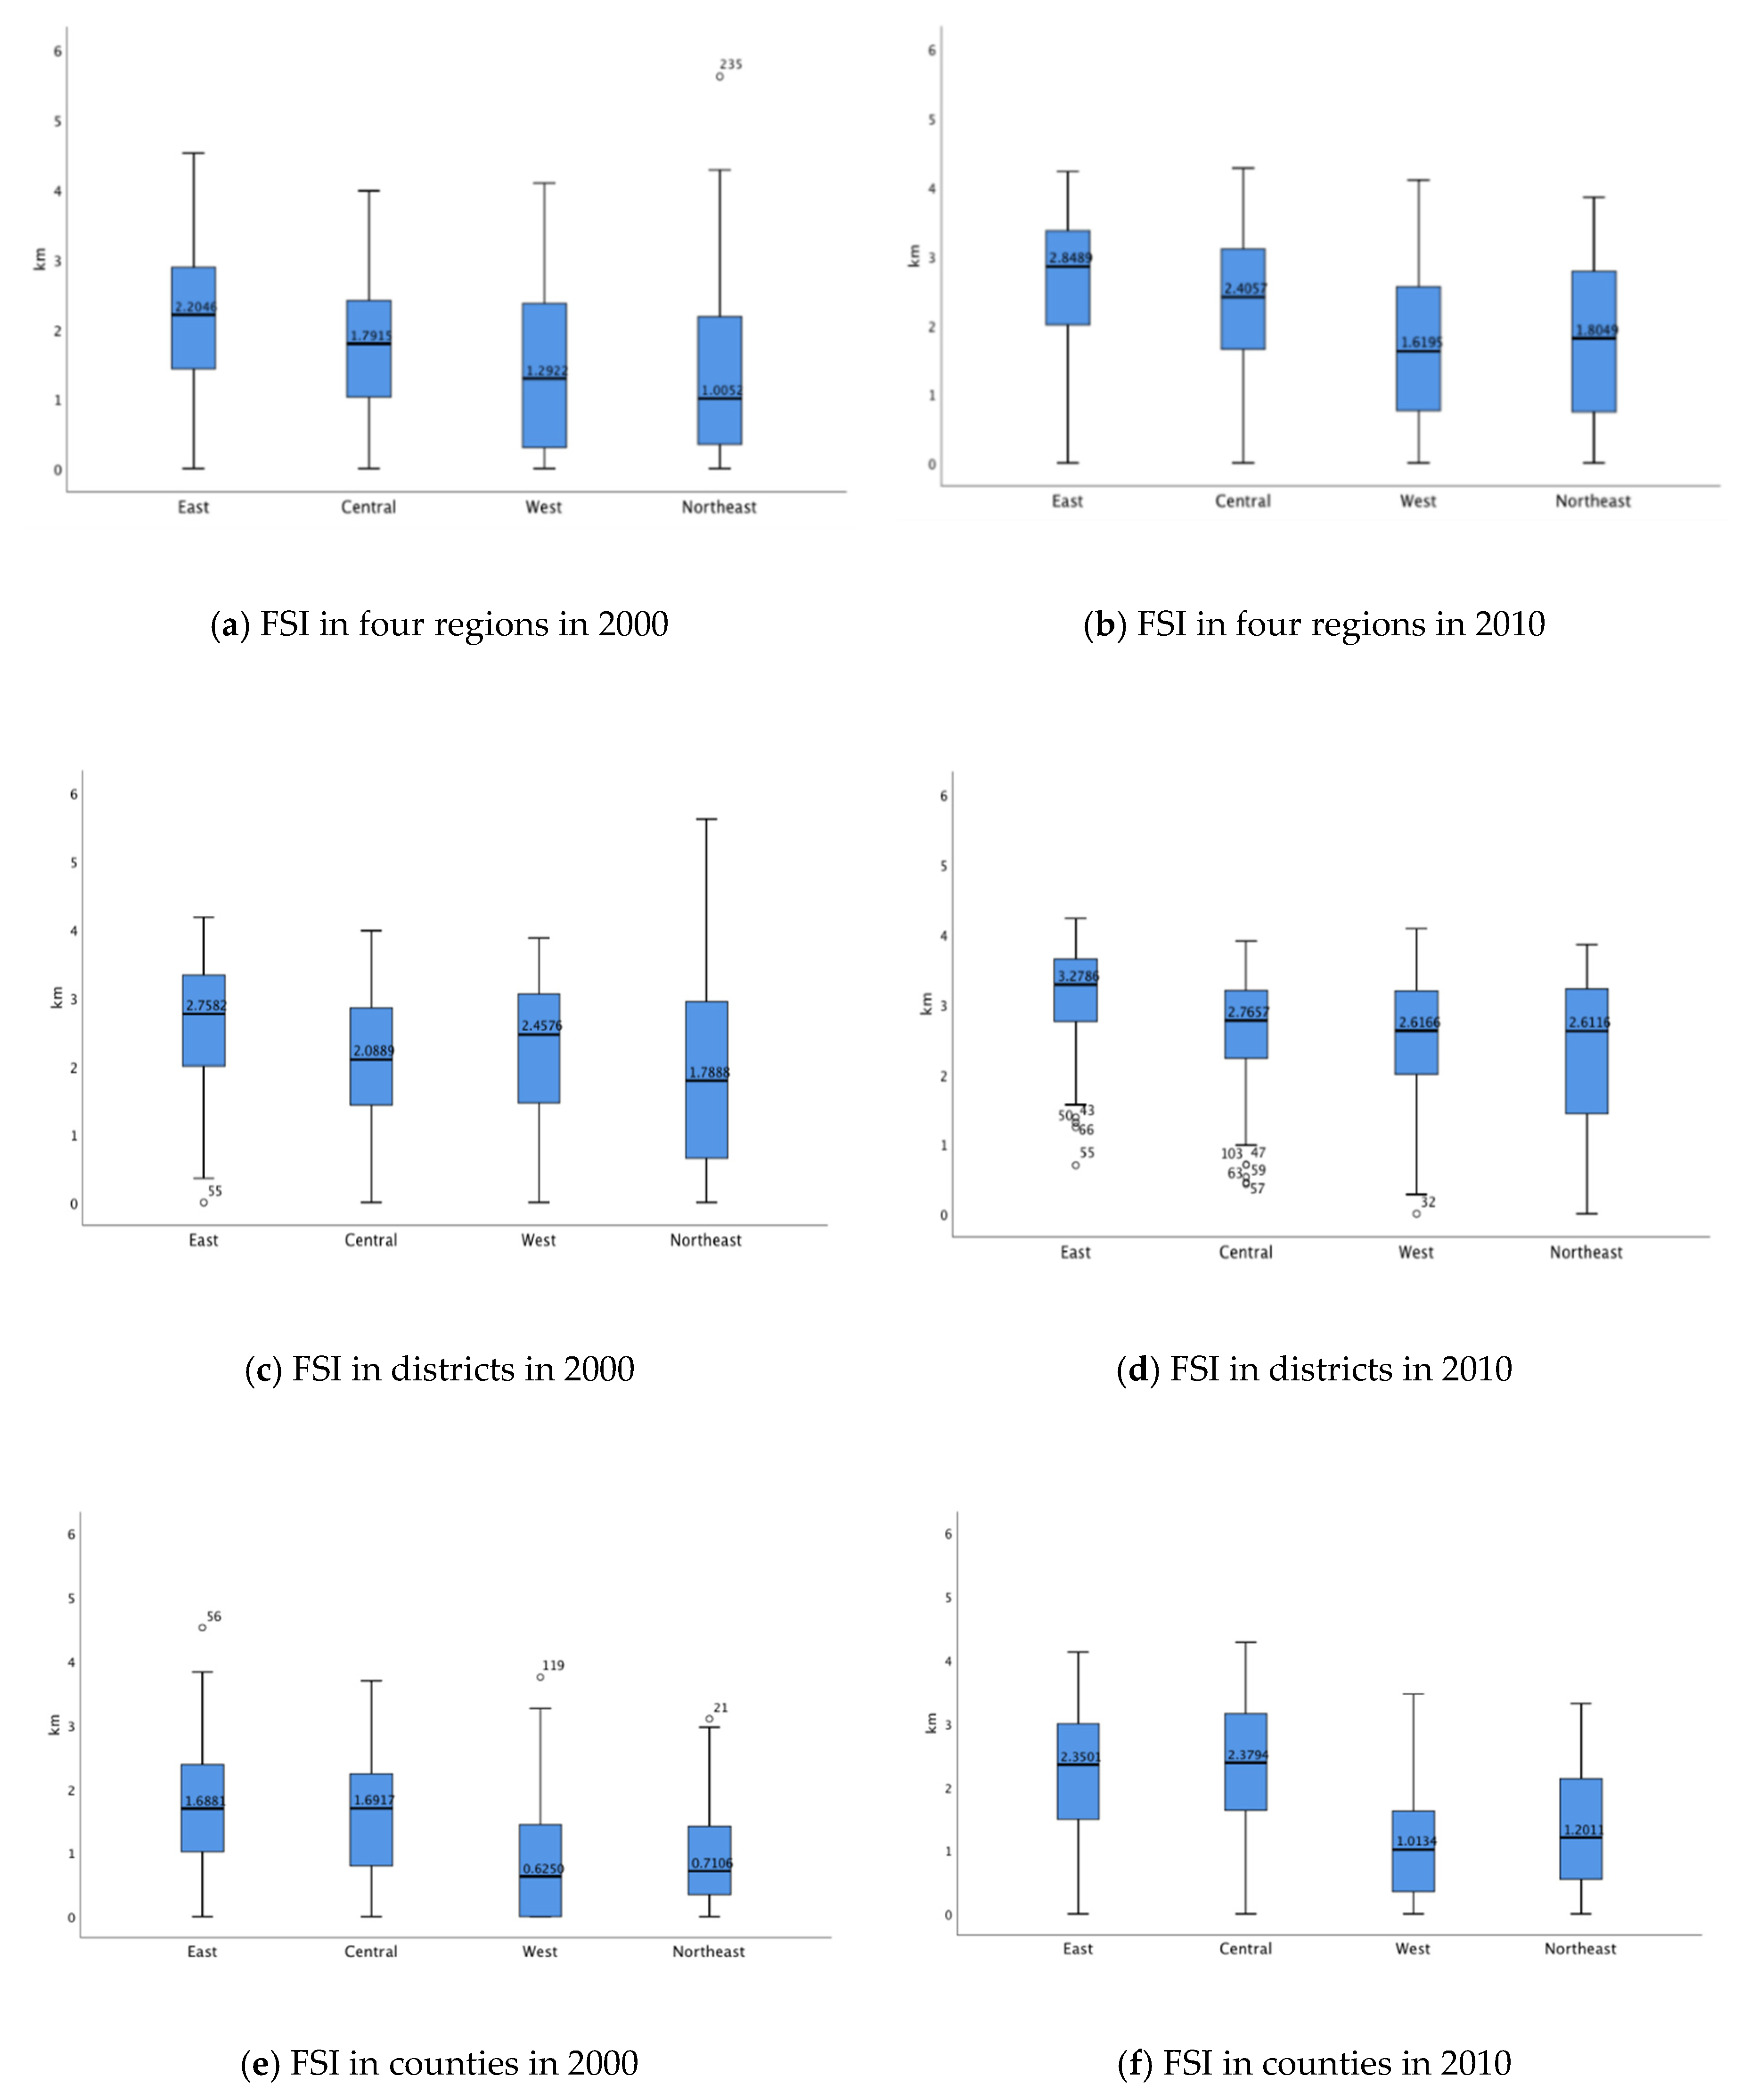
4.1. Regional Differences in the Degree of Scattering of Manufacturing Plants
4.2. Effects of the Scattering of Manufacturing Plants on Groundwater Withdrawal
4.3. Regional Differences in the Effects of the Scattering of Manufacturing Plants on Groundwater Withdrawal
5. Conclusions
Author Contributions
Funding
Institutional Review Board Statement
Informed Consent Statement
Data Availability Statement
Acknowledgments
Conflicts of Interest
Appendix A


| FSI | Number of High-Water Consumption Plants | Total Population | Area of Actual Irrigated Land | Proportion of High-Water Consumption Plants | Proportion of High-Water Consumption Plants | GDP per Capita | Water Withdrawal per GDP | Rainfall | Temperature | |
|---|---|---|---|---|---|---|---|---|---|---|
| FSI | 1 | |||||||||
| Number of high-water consumption plants | 0.3959 | 1 | ||||||||
| Total population | 0.3575 | 0.7042 | 1 | |||||||
| Area of irrigated land | 0.1643 | 0.4513 | 0.7561 | 1 | ||||||
| Proportion of high-water consumption plants | −0.2284 | −0.0838 | −0.0618 | 0.0061 | 1 | |||||
| Proportion of high-water consumption plants | 0.4653 | 0.3629 | 0.3846 | 0.2129 | −0.2442 | 1 | ||||
| GDP per capita | 0.432 | 0.4192 | 0.3261 | 0.144 | −0.0919 | 0.68 | 1 | |||
| Water withdrawal per GDP | −0.2001 | −0.209 | −0.2066 | −0.0636 | 0.1351 | −0.3529 | −0.2687 | 1 | ||
| Rainfall | 0.3312 | 0.2605 | 0.2629 | 0.1477 | −0.0783 | 0.1646 | 0.2404 | 0.1175 | 1 | |
| Temperature | 0.2712 | 0.2447 | 0.2215 | 0.1446 | −0.0361 | 0.1249 | 0.2182 | 0.1836 | 0.8014 | 1 |
| Model | AIC 1 | R2 | Adjusted R2 |
|---|---|---|---|
| OLS | −94.49802 | 0.5222 | 0.4849 |
| GWR | −119.56729 | 0.6829 | 0.6045 |
References
- De Graaf, I.E.M.; Gleeson, T.; Van Beek, L.P.H.; Sutanudjaja, E.H.; Bierkens, M.F.P. Environmental flow limits to global groundwater pumping. Nat. Cell Biol. 2019, 574, 90–94. [Google Scholar] [CrossRef]
- Braadbaart, O.; Braadbaart, F. Policing the urban pumping race: Industrial groundwater overexploitation in Indonesia. World Dev. 1997, 25, 199–210. [Google Scholar] [CrossRef]
- Koncagül, E. Facing the Challenges: Case Studies and Indicators: UNESCO’s Contributions to the United Nations World Water Development Report; UNESCO Publishing: Paris, France, 2015; Volume 2, pp. 4–5. [Google Scholar]
- Klingbeil, R.; Byiringiro, F. Food Security, Water Security, Improved Food Value Chains for a more Sustainable Socio-economic Development. In Sharaka Conference “eu-Gcc Regional Security Cooperation: Lessons Learned & Future Challenges”; CIDOB: Barcelona, Spain, 2013. [Google Scholar]
- Shah, T.; Molden, D.J.; Sakthivadivel, R.; Seckler, D. The Global Groundwater Situation: Overview of Opportunities and Challenges; International Water Management Institute (IWMI): Colombo, Sri Lanka, 2000. [Google Scholar]
- Hamdy, A.; Ragab, R.; Scarascia-Mugnozza, E. Coping with water scarcity: Water saving and increasing water productivity. Irrig. Drain. 2003, 52, 3–20. [Google Scholar] [CrossRef]
- Liu, Y.; Zhang, Z.; Zhang, F. Challenges for Water Security and Sustainable Socio-Economic Development: A Case Study of Industrial, Domestic Water Use and Pollution Management in Shandong, China. Water 2019, 11, 1630. [Google Scholar] [CrossRef]
- Yang, H.; Zhang, X.; Zehnder, A.J. Water scarcity, pricing mechanism and institutional reform in northern China irrigated agriculture. Agric. Water Manag. 2003, 61, 143–161. [Google Scholar] [CrossRef]
- Gilg, A.; Barr, S. Behavioural attitudes towards water saving? Evidence from a study of environmental actions. Ecol. Econ. 2006, 57, 400–414. [Google Scholar] [CrossRef]
- Chang, F.-J.; Huang, C.-W.; Cheng, S.-T.; Chang, L.-C. Conservation of groundwater from over-exploitation—Scientific analyses for groundwater resources management. Sci. Total Environ. 2017, 598, 828–838. [Google Scholar] [CrossRef] [PubMed]
- Gracia-De-Rentería, P.; Barberán, R.; Mur, J. The Groundwater Demand for Industrial Uses in Areas with Access to Drinking Publicly-Supplied Water: A Microdata Analysis. Water 2020, 12, 198. [Google Scholar] [CrossRef]
- Chang, H.; Parandvash, G.H.; Shandas, V. Spatial Variations of Single-Family Residential Water Consumption in Portland, Oregon. Urban Geogr. 2010, 31, 953–972. [Google Scholar] [CrossRef]
- Shandas, V.; Parandvash, G.H. Integrating Urban Form and Demographics in Water-Demand Management: An Empirical Case Study of Portland, Oregon. Environ. Plan. B Plan. Des. 2010, 37, 112–128. [Google Scholar] [CrossRef]
- Sanchez, G.M.; Smith, J.W.; Terando, A.; Sun, G.; Meentemeyer, R.K. Spatial Patterns of Development Drive Water Use. Water Resour. Res. 2018, 54, 1633–1649. [Google Scholar] [CrossRef]
- National Groundwater Pollution Prevention and Control Plan (2011–2020). Available online: http://www.gov.cn/gongbao/content/2012/content_2121713.htm (accessed on 15 November 2011).
- Wang, B.; Wang, X.; Zhang, X. An Empirical Research on Influence Factors of Industrial Water Use. Water 2019, 11, 2267. [Google Scholar] [CrossRef]
- Zhu, J.; Guo, Y. Fragmented Peri-urbanisation Led by Autonomous Village Development under Informal Institution in High-density Regions: The Case of Nanhai, China. Urban Stud. 2014, 51, 1120–1145. [Google Scholar] [CrossRef]
- Zhu, J. Making urbanisation compact and equal: Integrating rural villages into urban communities in Kunshan, China. Urban Stud. 2017, 54, 2268–2284. [Google Scholar] [CrossRef]
- Zhang, L.; Yue, W.; Liu, Y.; Fan, P.; Wei, Y.D. Suburban industrial land development in transitional China: Spatial restructuring and determinants. Cities 2018, 78, 96–107. [Google Scholar] [CrossRef]
- Zheng, Y.; Wang, L.; Chen, H.; Lv, A. Does the Geographic Distribution of Manufacturing Plants Exacerbate Groundwater Withdrawal? A case study of Hebei Province in China. J. Clean. Prod. 2019, 213, 642–649. [Google Scholar] [CrossRef]
- Zhang, G.; Fei, Y.; Wang, H.; Yan, M.; Liu, Z. Impact of farmland production increasing under irrigation water saving on groundwater exploitation in Hebei plain, China. Geol. Bull. China 2009, 28, 645–650. (In Chinese) [Google Scholar] [CrossRef]
- Zhang, G.; Fei, Y.; Liu, C.; Yan, M.; Wang, J. Adaptation between irrigation intensity and groundwater carrying capacity in North China Plain. Trans. Chin. Soc. Agric. Eng. 2013, 29, 1–10. (In Chinese) [Google Scholar]
- Sheng, L.; Zheng, X.; Zhou, P.; Li, T. An analysis of the reasons for the widening gap between the north and the south in China’s economic development. Manag. World 2018, 34, 16–24. (In Chinese) [Google Scholar] [CrossRef]
- Geng, S.; Lin, R. Local governance model and enterprise transformation and upgrading—A case study of Foxconn. Pubilc Gov. Rev. 2014, 1, 13–29. (In Chinese) [Google Scholar]
- Fan, J.; Wang, H.; Tao, A.; Xu, J. Coupling industrial location with urban system distribution: A case study of China’s Luoyang municipality. Acta Geogr. Sin. 2009, 64, 131–141. (In Chinese) [Google Scholar]
- Fan, J.; Taubmann, W. An analysis of the economic features and regional difference of China’s rural industrialization. Acta Geogr. Sin. 1996, 51, 398–407. (In Chinese) [Google Scholar]
- Duvivier, C.; Xiong, H. Transboundary pollution in China: A study of polluting firms’ location choices in Hebei province. Environ. Dev. Econ. 2013, 18, 459–483. [Google Scholar] [CrossRef]
- Zhao, H.; Liu, Y.; Xu, H. Research on the utilization of flood resources in surface water supply projects: A case study of Lixiang industrial cluster in Qianxi county, Hebei province. Haihe Water Resour. 2013, 2, 50–54. (In Chinese) [Google Scholar] [CrossRef]
- Wang, F.; Tian, Y.; Cheng, B. The impact of industrial agglomeration on industrial water use efficiency. Urban Probl. 2018, 12, 80–88. (In Chinese) [Google Scholar] [CrossRef]
- Zhang, J.; Hao, Z.Y.; Pan, W.G.; Zheng, F.D.; Zhao, F. Current situation, problems and countermeasures of water use and management in typical rural areas of Beijing. Beijing Water 2014, 5, 55–56, 60. (In Chinese) [Google Scholar] [CrossRef]
- Schnaiberg, A. Reflections on Resistance to Rural Industrialization: Newcomers’ Culture of Environmentalism. In Differential Social Impacts of Rural Resource Development; Elkind-Savatsky, P., Ed.; Westview Press: Boulder, CO, USA, 1986; pp. 229–258. ISBN 9780429036170. [Google Scholar]
- Cohen, M.J. The spatial distribution of toxic chemical emissions: Implications for nonmetropolitan areas. Soc. Nat. Resour. 1997, 10, 17–41. [Google Scholar] [CrossRef]
- Brown, L.R.; Halweil, B. China’s water shortage could shake world food security. World Watch 1998, 11, 10–16. [Google Scholar] [PubMed]
- Tian, Y.; Zhang, G.; Wang, Q.; Yan, M.; Wang, W.; Wang, J. Groundwater safeguard capacity and dependency degree of agricul-tural irrigation on groundwater in the Huang–Huai–Hai Plain. Acta Geogr. Sin. 2016, 37, 257–265. (In Chinese) [Google Scholar] [CrossRef]
- Wu, C.; Luo, Y.; Xiang, Y.; WU, X. Analysis on driving effect of industrial water consumption and Its spatio-temporal differentia-tion in Western China. J. Lanzhou Univ. Financ. Econ. 2020, 36, 62–72. (In Chinese) [Google Scholar]
- Liu, X.; Yan, L. Research on water resources utilization efficiency and factors in western China based on data envelopment model. Water Resour. Prot. 2016, 32, 32–38. (In Chinese) [Google Scholar]
- Zhou, Y. Study on Fragile Ecological Environment and Sustainable Development in Western China; Xinhua Publishing House: Beijing, China, 2015. (In Chinese) [Google Scholar]
- Wang, G.; Shao, L. Rational allocation and sustainable development of reclaimed water resources in Western China. Energy Sav. Environ. Prot. 2016, 6, 56–58. (In Chinese) [Google Scholar]


| Variable | Observations | Mean | SD | Min | Max | |
|---|---|---|---|---|---|---|
| Dependent variable | Groundwater withdrawal (104 m3) | 205 | 5.1560 | 11.848 | 0.000 | 89.220 |
| Social–economic factors | Factory scatter index (FSI) (km) | 179 | 2.2330 | 1.165 | 0.000 | 5.065 |
| Area of actual irrigated land (104 m2) | 205 | 425.6320 | 832.676 | 0.000 | 6840.100 | |
| Number of high-water consumption plants | 175 | 526.4630 | 1080.326 | 1.000 | 6457.000 | |
| Proportion of high-water consumption plants (%) 1 | 175 | 30.7850 | 17.000 | 0.000 | 100.000 | |
| Total population (×104) | 205 | 673.7730 | 1078.268 | 0.000 | 6663.180 | |
| Urbanization rate (%) | 190 | 44.1540 | 20.668 | 0.000 | 95.667 | |
| GDP per capita (104 yuan/person) | 190 | 4.4080 | 2.985 | 0.000 | 17.387 | |
| Water withdrawal per GDP (yuan/m3) | 181 | 0.0129 | 0.016 | 0.001 | 0.123 | |
| Natural factors | Rainfall (mm) | 204 | 815.7960 | 555.906 | 0.000 | 2540.349 |
| Temperature (°C) | 204 | 8.9610 | 8.023 | −20.494 | 22.798 | |
| Total | |||||
| Region | East China | Central China | West China | Northeast China | China |
| Number of manufacturing plants in 2000 | 93,972 | 30,924 | 23,033 | 11,356 | 159,285 |
| Number of manufacturing plants in 2010 | 303,540 | 83,690 | 46,127 | 23,395 | 456,752 |
| Change rate (2000–2010) (%) | 223.01 | 170.63 | 100.26 | 106.01 | 186.75 |
| Counties | |||||
| Region | East China | Central China | West China | Northeast China | China |
| Number of manufacturing plants in 2000 | 37,769 | 20,226 | 12,196 | 4525 | 74,716 |
| Number of manufacturing plants in 2010 | 143,361 | 58,221 | 24,345 | 10,318 | 236,245 |
| Change rate (2000–2010) (%) | 279.57 | 187.85 | 99.61 | 128.02 | 216.19 |
| Districts | |||||
| Region | East China | Central China | West China | Northeast China | China |
| Number of manufacturing plants in 2000 | 56,203 | 10,698 | 10,837 | 6831 | 84,569 |
| Number of manufacturing plants in 2010 | 160,179 | 25,469 | 21,782 | 13,077 | 220,507 |
| Change rate (2000–2010) (%) | 185.00 | 138.07 | 101.00 | 91.44 | 160.74 |
| Province 1 | Manufacturing Plants in 2000 | Rank | Manufacturing Plants in 2010 | Rank | Change Rate of the Number of Manufacturing Plants (%) | Rank | Change Rate of FSIs (%) | Rank |
|---|---|---|---|---|---|---|---|---|
| National average | 5887 | 11 | 17,293 | 9 | 147 | 13 | 33 | 12 |
| Jiangsu | 16,201 | 2 | 74,809 | 1 | 361.76 | 2 | 9.65 | 26 |
| Zhengjiang | 14,720 | 3 | 62,084 | 3 | 321.77 | 3 | 13.05 | 25 |
| Beijing | 4803 | 13 | 6404 | 18 | 33.33 | 22 | 14.3 | 24 |
| Fujiang | 6010 | 8 | 24,533 | 5 | 308.2 | 4 | 17.88 | 22 |
| Guangdong | 18,697 | 1 | 64,486 | 2 | 244.9 | 6 | 25.8 | 15 |
| Hebei | 7282 | 7 | 10,806 | 14 | 48.39 | 19 | 27.38 | 14 |
| Shanghai | 8771 | 6 | 15,102 | 11 | 72.18 | 18 | 37.51 | 11 |
| Hainan | 505 | 26 | 906 | 26 | 79.41 | 17 | 43.1 | 8 |
| Tianjing | 5313 | 12 | 6348 | 19 | 19.48 | 25 | 46.12 | 7 |
| Shandong | 11,670 | 4 | 38,062 | 4 | 226.15 | 8 | 58.79 | 3 |
| Jiangxi | 3598 | 17 | 12,077 | 13 | 235.66 | 7 | 9.17 | 27 |
| Anhui | 3685 | 16 | 8034 | 16 | 118.02 | 14 | 18.31 | 21 |
| Henan | 9856 | 5 | 19,588 | 7 | 98.74 | 15 | 24.08 | 17 |
| Hunan | 4687 | 14 | 21,896 | 6 | 367.16 | 1 | 37.84 | 10 |
| Hubei | 5919 | 10 | 17,618 | 8 | 197.65 | 10 | 41.66 | 9 |
| Shanxi | 3179 | 19 | 4477 | 20 | 40.83 | 21 | 65.51 | 2 |
| Chongqing | 1955 | 25 | 7974 | 17 | 307.88 | 5 | 17.88 | 23 |
| Shanxi | 2665 | 22 | 3366 | 22 | 26.3 | 23 | 18.38 | 20 |
| Sichuan | 4411 | 15 | 13,281 | 12 | 201.09 | 9 | 23.33 | 19 |
| Guanxi | 3246 | 18 | 8690 | 15 | 167.71 | 12 | 24.62 | 16 |
| Ningxia | 407 | 27 | 736 | 27 | 80.84 | 16 | 29.74 | 13 |
| Guizhou | 1984 | 24 | 2240 | 25 | 12.9 | 27 | 52.61 | 5 |
| Yunan | 2154 | 23 | 2694 | 24 | 25.07 | 24 | 54.96 | 4 |
| Liaoning | 5925 | 9 | 16,413 | 10 | 177.01 | 11 | 23.68 | 18 |
| Heilongjian | 2695 | 21 | 3045 | 23 | 12.99 | 26 | 46.61 | 6 |
| Jilin | 2736 | 20 | 3937 | 21 | 43.9 | 20 | 88.73 | 1 |
| (1) | (2) | (3) | (4) | (5) | (6) | (7) | (8) | |
|---|---|---|---|---|---|---|---|---|
| Variable | OLS 1 | OLS 2 | OLS 3 | OLS 4 | Tobit 1 | Tobit 2 | Tobit 3 | Tobit 4 |
| FSI | 0.471 *** | 0.168 ** | 0.235 ** | 0.233 ** | 0.455 *** | 0.179 * | 0.236 *** | 0.234 *** |
| (0.078) | (0.0848) | (0.0903) | (0.0904) | (0.0723) | (0.0721) | (0.0764) | (0.0764) | |
| Area of actual irrigated land | 0.643 ** | 0.586 * | 0.582 * | 0.642 *** | 0.573 *** | 0.570 *** | ||
| (0.32) | (0.302) | (0.311) | (0.143) | (0.145) | (0.146) | |||
| Number of high-water consumption plants | −0.122 | −0.123 | −0.123 | −0.125 | −0.121 | −0.12 | ||
| (0.11) | (0.123) | (0.126) | (0.104) | (0.107) | (0.107) | |||
| Proportion of high-water consumption plants | −0.0987 | −0.131 | −0.14 | −0.0864 | −0.117 | −0.124 | ||
| (0.109) | (0.12) | (0.128) | (0.0882) | (0.094) | (0.0951) | |||
| Total population | 0.318 | 0.381 * | 0.384 * | 0.296 ** | 0.364 ** | 0.366 ** | ||
| (0.202) | (0.207) | (0.208) | (0.14) | (0.141) | (0.141) | |||
| Urbanization rate | 0.250 *** | 0.212 ** | 0.208 ** | 0.213 *** | 0.184 ** | 0.181 * | ||
| (0.0852) | (0.0933) | (0.0933) | (0.0741) | (0.0912) | (0.0918) | |||
| GDP per capita | 0.0207 | 0.0206 | 0.00793 | 0.00715 | ||||
| (0.0935) | (0.0962) | (0.0999) | (0.1) | |||||
| Water withdrawal per GDP | 0.321 * | 0.317 * | 0.357 ** | 0.352 ** | ||||
| (0.174) | (0.175) | (0.167) | (0.17) | |||||
| Rainfall | −0.0749 | −0.0517 | ||||||
| (0.15) | (0.111) | |||||||
| Temperature | 0.0679 | 0.0518 | ||||||
| (0.127) | (0.113) | |||||||
| Dummy | 0.179 *** | 0.160 *** | 0.174 *** | 0.168 *** | 0.174 *** | 0.150 *** | 0.163 *** | 0.159 *** |
| (0.032) | (0.027) | (0.0276) | (0.0394) | (0.0335) | (0.027) | (0.0274) | (0.0356) | |
| Intercept | 0.260 *** | 0.254 *** | 0.208 *** | 0.196 * | 0.276 *** | 0.278 *** | 0.233 *** | 0.221 *** |
| (0.0408) | (0.0655) | (0.0793) | (0.104) | (0.0419) | (0.0556) | (0.0645) | (0.084) | |
| N | 182 | 160 | 153 | 153 | 182 | 160 | 153 | 153 |
| R2 | 0.229 | 0.52 | 0.521 | 0.522 |
| Variable | Min | Q(1/4) | Q(1/2) | Q(3/4) | Max |
|---|---|---|---|---|---|
| FSI | 0.104 | 0.133 | 0.177 | 0.218 | 0.378 |
| Area of irrigated land | 0.264 | 1.088 | 1.281 | 1.391 | 1.532 |
| Number of high-water consumption plants | −0.354 | −0.218 | −0.178 | −0.137 | 0.097 |
| Proportion of high-water consumption plants | −0.287 | −0.247 | −0.181 | −0.046 | 0.137 |
| Total population | −0.160 | −0.070 | −0.004 | 0.057 | 0.453 |
| Urbanization rate | 0.130 | 0.187 | 0.228 | 0.334 | 0.597 |
| GDP per capita | −0.143 | −0.019 | 0.065 | 0.127 | 0.193 |
| Water withdrawal per GDP | −0.781 | −0.585 | −0.432 | −0.020 | 0.490 |
| Rainfall | −0.988 | −0.398 | −0.284 | −0.115 | 0.098 |
| Temperature | −0.307 | −0.126 | −0.012 | 0.059 | 0.611 |
| Intercept | 0.089 | 0.346 | 0.451 | 0.539 | 0.632 |
Publisher’s Note: MDPI stays neutral with regard to jurisdictional claims in published maps and institutional affiliations. |
© 2021 by the authors. Licensee MDPI, Basel, Switzerland. This article is an open access article distributed under the terms and conditions of the Creative Commons Attribution (CC BY) license (https://creativecommons.org/licenses/by/4.0/).
Share and Cite
Zheng, Y.; Yang, H.; Huang, J.; Wang, L.; Lv, A. The Impacts of the Geographic Distribution of Manufacturing Plants on Groundwater Withdrawal in China. Water 2021, 13, 1158. https://doi.org/10.3390/w13091158
Zheng Y, Yang H, Huang J, Wang L, Lv A. The Impacts of the Geographic Distribution of Manufacturing Plants on Groundwater Withdrawal in China. Water. 2021; 13(9):1158. https://doi.org/10.3390/w13091158
Chicago/Turabian StyleZheng, Yanting, Huidan Yang, Jinyuan Huang, Linjuan Wang, and Aifeng Lv. 2021. "The Impacts of the Geographic Distribution of Manufacturing Plants on Groundwater Withdrawal in China" Water 13, no. 9: 1158. https://doi.org/10.3390/w13091158
APA StyleZheng, Y., Yang, H., Huang, J., Wang, L., & Lv, A. (2021). The Impacts of the Geographic Distribution of Manufacturing Plants on Groundwater Withdrawal in China. Water, 13(9), 1158. https://doi.org/10.3390/w13091158