Article

A Modified Distributed CN-VSA Method for Mapping of the Seasonally Variable Source Areas

1
Water Resources Engineering, School of Engineering, University of Guelph, Guelph, ON N1G 2W1, Canada
2
Ministry of the Environment, Conservation and Parks, Etobicoke, ON M9P 3V6, Canada
*
Author to whom correspondence should be addressed.
Water 2021, 13(9), 1270; https://doi.org/10.3390/w13091270
Submission received: 2 April 2021 / Revised: 22 April 2021 / Accepted: 23 April 2021 / Published: 30 April 2021
(This article belongs to the Section Hydrology)

Abstract

:
Many watershed models employ the Soil Conservation Service Curve Number (SCS-CN) approach for runoff simulation based on soil and land use information. These models implicitly assume that runoff is generated by the Hortonian process and; therefore, cannot correctly account for the effects of topography, variable source area (VSA) and/or soil moisture distribution in a watershed. This paper presents a new distributed CN-VSA method that is based on the SCS-CN approach to estimate runoff amount and uses the topographic wetness index (TWI) to distribute the runoff-generating areas within the watershed spatially. The size of the saturated-watershed areas and their spatial locations are simulated by assuming an average annual value of potential maximum retention. However, the literature indicates significant seasonal variation in potential maximum retention which can considerably effect water balance and amount of nonpoint source pollution. This paper focuses on developing a modified distributed CN-VSA method that accounts for the seasonal changes in the potential maximum retention. The results indicate that the modified distributed CN-VSA approach is better than distributed CN-VSA to simulate runoff amount and spatial distribution of runoff-generating areas. Overall, the study results are significant for improved understanding of hydrological response of watershed where seasonal factors describe the potential maximum retention, and, thus, saturation excess runoff generation in the watershed.

1. Introduction

Saturation excess is one of the dominant overland flow generation mechanisms in humid and well-vegetated regions [1,2,3]. Predicting the locations of saturated areas and the corresponding risks of generating surface runoff is essential for developing watershed management strategies to mitigate non-point-source pollution and its impacts [4,5,6,7,8,9].
Saturation excess theory assumes that runoff occurs when soil becomes saturated from below after the water table rises to the ground surface either from excess rainfall or from shallow lateral subsurface flow [10,11,12]. Precipitation over saturated areas is then assumed to readily generate overland flow regardless of the precipitation rate [13]. This assumption is in contrast to the Hortonian theory, which suggests that runoff occurs when the precipitation rate exceeds the maximum soil infiltration capacity regardless of the soil’s degree of saturation [14]. Furthermore, Hortonian overland flow is often assumed to take place uniformly over the landscape. However, the portion of the watershed susceptible to saturation excess runoff varies seasonally and within a storm event [15]. Thus, these areas are termed as variable source areas (VSA) or hydrologically active areas [16,17,18,19]. VSAs are generally developed along the lower portions of hillslopes, where the land is topographically concave-shaped, in valley floors, and in shallow groundwater table areas [20].
The popular hydrologic models that based on the VSA concept of watershed response include the topography-based hydrological model [21], the distributed hydrology soil vegetation model (DHSVM) [22], the soil moisture distribution and routing (SMDR) [23], and the soil moisture-based runoff model (SMoRMod) [24]. These models have varying degrees of complexity and are based on distributed moisture accounting within the segments of a watershed. These models are rarely used as they require extensive calibration and a large amount of input data [25]. Over the last decade, some encouraging attempts have been made to introduce VSA hydrology in watershed-scale water quality models, such as the soil and water assessment tool, SWAT-VSA [26], and the generalized watershed loading function (GWLF) [27]. However, these models need to be validated with rigorous field tests [28]. Moreover, these models are somewhat more complicated and computationally intensive than most engineering applications warrant [29,30,31].
The majority of hydrologic and non-point-source pollution models have the option of using the SCS-CN method for estimating surface runoff from a storm rainfall [32]. The main advantage of this approach is that it incorporates most of the factors affecting runoff generation, such as soil class, land use, surface condition, and antecedent soil moisture amount [33,34,35,36].
Despite several identified problems such as lumping the watershed parameters in a single parameter, a lack of peer-reviewed justification, and uncertainty in runoff estimates, the CN method is extensively used to estimate surface runoff [37] from ungauged watersheds. Also, the majority of water quality models still use the SCS-CN method for runoff simulation [38]. Therefore, these models are not able to accurately locate the runoff-generating areas [27].
A simplistic approach was proposed for the Soil Conservation Service (SCS) runoff equation to compute direct runoff and to predict the contributing area [39]. This method was based on the primary assumption that mainly saturated areas contribute to direct runoff. Further, in the approach the effective precipitation (Pe) parameter, and the amount of precipitation after the runoff begins was used instead of precipitation (P) value. This modified SCS approach (CN–variable source area) has been subsequently used and applied in many studies [40,41]. In these studies, a constant value of factor ‘S’ (maximum potential retention after runoff begins) was considered for the study areas. However, stream flows in humid and temperate regions, like southern Ontario, exhibit an extreme seasonal pattern. An earlier study [42] has indicated that flow during the spring period (March to May) represents about 70 percent of the total annual flow in streams in Ontario. Seasonal variation in stream flows and storm runoff suggests a seasonally variable value of ‘S’ instead of a constant value.
Since the inception of the runoff generation’s VSA concept, topography has been considered an essential factor affecting the hydrological processes and connectivity in watershed hydrology [43,44]. In hilly watersheds with moderate to steep topography, the gravity component dominates the hydraulic potential. The terrain characteristics are vital variables to determine the watershed response and distribution of water to rainfall inputs [21,45,46,47,48]. Various topographic indices of wetness are being used to generate spatially continuous soil water information for identifying saturation excess areas as an alternative to point measurements of soil water content [49,50,51]. Moreover, due to their simplicity and physical nature, topographic indices have become an integral part of VSA-based hydrological models [52].
The distributed CN–VSA method developed by [40] is one of the promising new methods based on the VSA concept to simulate the aerial distribution of saturation excess runoff. The method is physically-based and uses a traditional SCS-CN approach to predict runoff volume and spatial extent of saturated areas and distributes runoff source areas within the watershed using a topographic wetness index (TWI) approach. This simple method can be integrated with existing hydrological models for predicting the locations of runoff-generating areas based on the VSA concept. In the distributed CN-VSA method, potential maximum retention (S) is assumed to be constant throughout the year. However, field observations indicate a significant variation between the annual average potential storage and potential maximum retention value for spring, summer, and fall seasons. Therefore, the distributed CN-VSA method needs modification to move from a constant potential maximum retention to a seasonal variable potential maximum retention.
An excellent overview and discussion on SCS CN and related development have been given by [53]. They also included discussion about the approach [39] and work [40] pertaining to source area (VSA).
Based on analysis of relationships between CN-P reveals several distinct patterns: standard—a declining CN with increasing P, but approaching a constant asymptotically value at higher rainfall; complacent—declining CN value with increasing P, but not reaching a fixed equilibrium value; and violent—this is similar to complacent behavior, but without decreasing CN value at lower rainfall [53]. An evaluation of the CN-P relationship for the study watershed indicated that the watershed exhibits a standard response.
The review of previous studies presented and discussed above for VSA clearly shows that to represent variation in streamflow and storm runoff, the value of potential maximum retention (S) changes with the season. In addition, a constant value for the retention parameter can affect the predicted value of S. Therefore, the study’s primary objective was to present a novel concept of the seasonally variable value of ‘S’, and then apply and validate the new concept by applying it to a small agricultural watershed in Ontario, Canada. In addition, the specific objective was to evaluate the observed and predicted storm runoff amounts, and investigate the seasonal variability in the spatial distribution of potential runoff-contributing areas in the watershed.

2. Materials and Methods

2.1. Description of the Watershed

The experimental study was conducted in a 21.62 ha agricultural watershed situated in the Elora Research Station of the University of Guelph, located at 43°39′ N and 80°25′ W, in Ontario, Canada (Figure 1). The watershed elevation ranges from 357 to 378 m with gentle slopes as steep as 22%. The watershed’s general slope is towards the northwest side, where it outlets into a small creek. The dominant soil is sandy loam belonging to hydrological soil group B. The average saturated hydraulic conductivity of the soil, measured by Guelph permeameter, was 11.45×10⁻³ m/h. The soil depth ranged from 0.60 to 0.90 m underlain by a restrictive layer. The climate of Elora is temperate humid with an average annual precipitation of 875 mm, of which about 150 mm falls as snow. The entire watershed was under the cultivation of hay crops during the study period.
Surface runoff at the watershed outlet was measured using a V-notch weir fitted with a pressure sensor. A remotely operated low-cost wireless sensor network (WSN) system was developed and used to monitor and collect continuous runoff measurements for 45 rainfall events from September 2011 to July 2013. According to the various seasons, the distribution of events was: 7 springs, 18 summers, and 20 falls. In this study, spring covers the period 1st February to 31st May, summer from 1st June to 30th September, and fall from 1st October to 31st January. Rainfall was monitored using a tipping bucket rain gauge installed at ERS weather station located 500 m from the experimental site.

2.2. Description of Distributed CN–VSA Method

The distributed CN–VSA method divides a watershed into two parts. The saturated part generating runoff, and the remaining unsaturated portion infiltrates without contributing to the runoff. This method estimates the saturated fraction of the watershed by using the SCS runoff curve number method and aerially distributes surface runoff source areas through the watersheds by applying the TWI approach.

2.3. Predicting the Saturated Fractional Area of the Watershed

The rainfall-runoff equation used by the SCS–CN method [54] for estimating the depth of direct runoff from storm rainfall is given as:
Q = (P- Ia )2/(P- Ia +S)
where,
  • Q = Runoff depth in mm
  • P = Rainfall in mm
  • Ia = Rainfall retained in the watershed when runoff begins in mm
  • S = Potential maximum retention in mm
This equation is widely used in hydrological engineering despite its empirical nature. The effective precipitation Pe is the part of precipitation that contributes to surface runoff and is defined as in Equation (2):
Pe=P-Ia
Equation (1) can be expressed as proposed by [55,56].
Q = Pe2/(Pe +S)
Ref [39] showed that Equation (3) can be used to determine saturation excess runoff that results from saturated soils. The underlying principle of this VSA is that the rain falling on the saturated areas becomes runoff. The runoff generation rate will be proportional to the fractional saturated area (Af) of the watershed. During any short period, the fractional saturated area generating runoff can be mathematically written as the ratio of incremental runoff depth (∆Q) to incremental precipitation depth (∆Pe) as per the following equation.
Af   Δ Q Δ Pe
The fraction of runoff generating area, according to Equation (4) is equal to the derivative of Q with respect to Pe. Differentiating Equation (3) with respect to Pe using partial fraction decomposition, the equation for calculating Q can be expressed as in Equation (5):
Q=Pe-S+S2/(Pe+S)
Then the differentiation results in:
Af = 1 - S2/(Pe +S) 2
Equation (6) agrees with the natural VSA process that when pe = 0, the runoff generating area is zero, and when Pe approaches ∞, the runoff generating area is equal to 1. The application of this equation can be used for watersheds where the S value is known.
The parameter ‘S’ describes the amount of water soil retains in terms of depth before surface runoff starts. The runoff generated during storm events is mainly dependent on available soil water storage S before the rainfall event. Generally, S is computed either using CN value for average soil and land use conditions or from observed data on effective precipitation and runoff amount in gauged watersheds [57].
In terms of VSA hydrology, initial abstraction is the amount of water required to initiate the runoff. It is the amount of water that infiltrates the soil before the complete saturation of soil. The universal default for the initial abstraction given by the SCS-CN methodology is Ia = 0.20 (S). Many researchers have indicated that Ia = 0.20 (S) assumption is not universal and may depend on individual watershed characteristics [58]. Therefore, it should be carefully selected and employed with caution. It was also indicated that, according to Ia and S’s definitions, the modified SCS-CN method gives good results for humid, well-vegetated, and rural regions [39].

2.4. Spatial Location of the Runoff-Generating Areas

Topography exerts primary controls on the spatial distribution of saturated areas and affects the spatial variability of soil moisture related to hydrological processes [59,60,61,62]. The topographic wetness index (TWI) was first introduced by [63] to identify areas with the greatest propensity to saturate. It is a physically-based index that can quantify the effect of topography and moisture content on runoff generation and predict the location of surface saturation zones within a watershed [46,64]. TWI is a vital terrain attribute as it describes the spatial pattern of soil saturation and indicates the accumulated water flow at any point in a watershed [65]. It controls soil moisture, flow accumulation, distribution of saturated zones, and thickness of soil horizons [66].
The improved capability of GIS and increasing availability of digital elevation models (DEMs) has led to the development of wide variants of topography-based wetness indices (TWIs) incorporating topographic, soil characteristics, and other factors that influence soil water content during the last few decades. The topographic wetness index developed by [21] used within the rainfall-runoff model TOPMODEL is most commonly used. The fractional portions in a watershed having similar TWI values are assumed to have a similar hydrological response to rainfall. Other factors such as soil type, land use, and antecedent soil moisture are the same or can be treated as being the same [67]. A large upslope drainage area and small terrain slope result in a higher TWI. The region with a higher value of TWI indicates a high probability of soil saturation occurrence [21]. The TWI is defined as:
TWI λ = ln a tan β * D * Ksat
Where a = local upslope area draining through a certain point per unit contour length in m2, tanβ = local gradient at the point, D = depth of soil in m and, Ksat = average saturated hydraulic conductivity in m/day.
Usually, the digital elevation model (DEM) is used to calculate the TWI using the GIS. The physical description of the parameter “a” in the TWI equation is the total upslope area (A) per unit contour length draining from upstream cells to the current cell. This reflects the tendency of upslope water to accumulate at the current cell in the catchment. It is preferable to compute “a” using the multiple flow direction (MFD) algorithm as it gives more accurate flow distribution patterns [68,69,70]. The MFD algorithm assumes that water from a current position could flow into more than one neighboring cell [71].
In this study, the fractional area of the watershed that will generate the runoff for a given storm event is calculated by Eq. 6. This area is used to determine the threshold TWI (λ) value. It is assumed that the areas above this threshold λ generate runoff, and the areas below the threshold TWI (λ) are infiltrating.
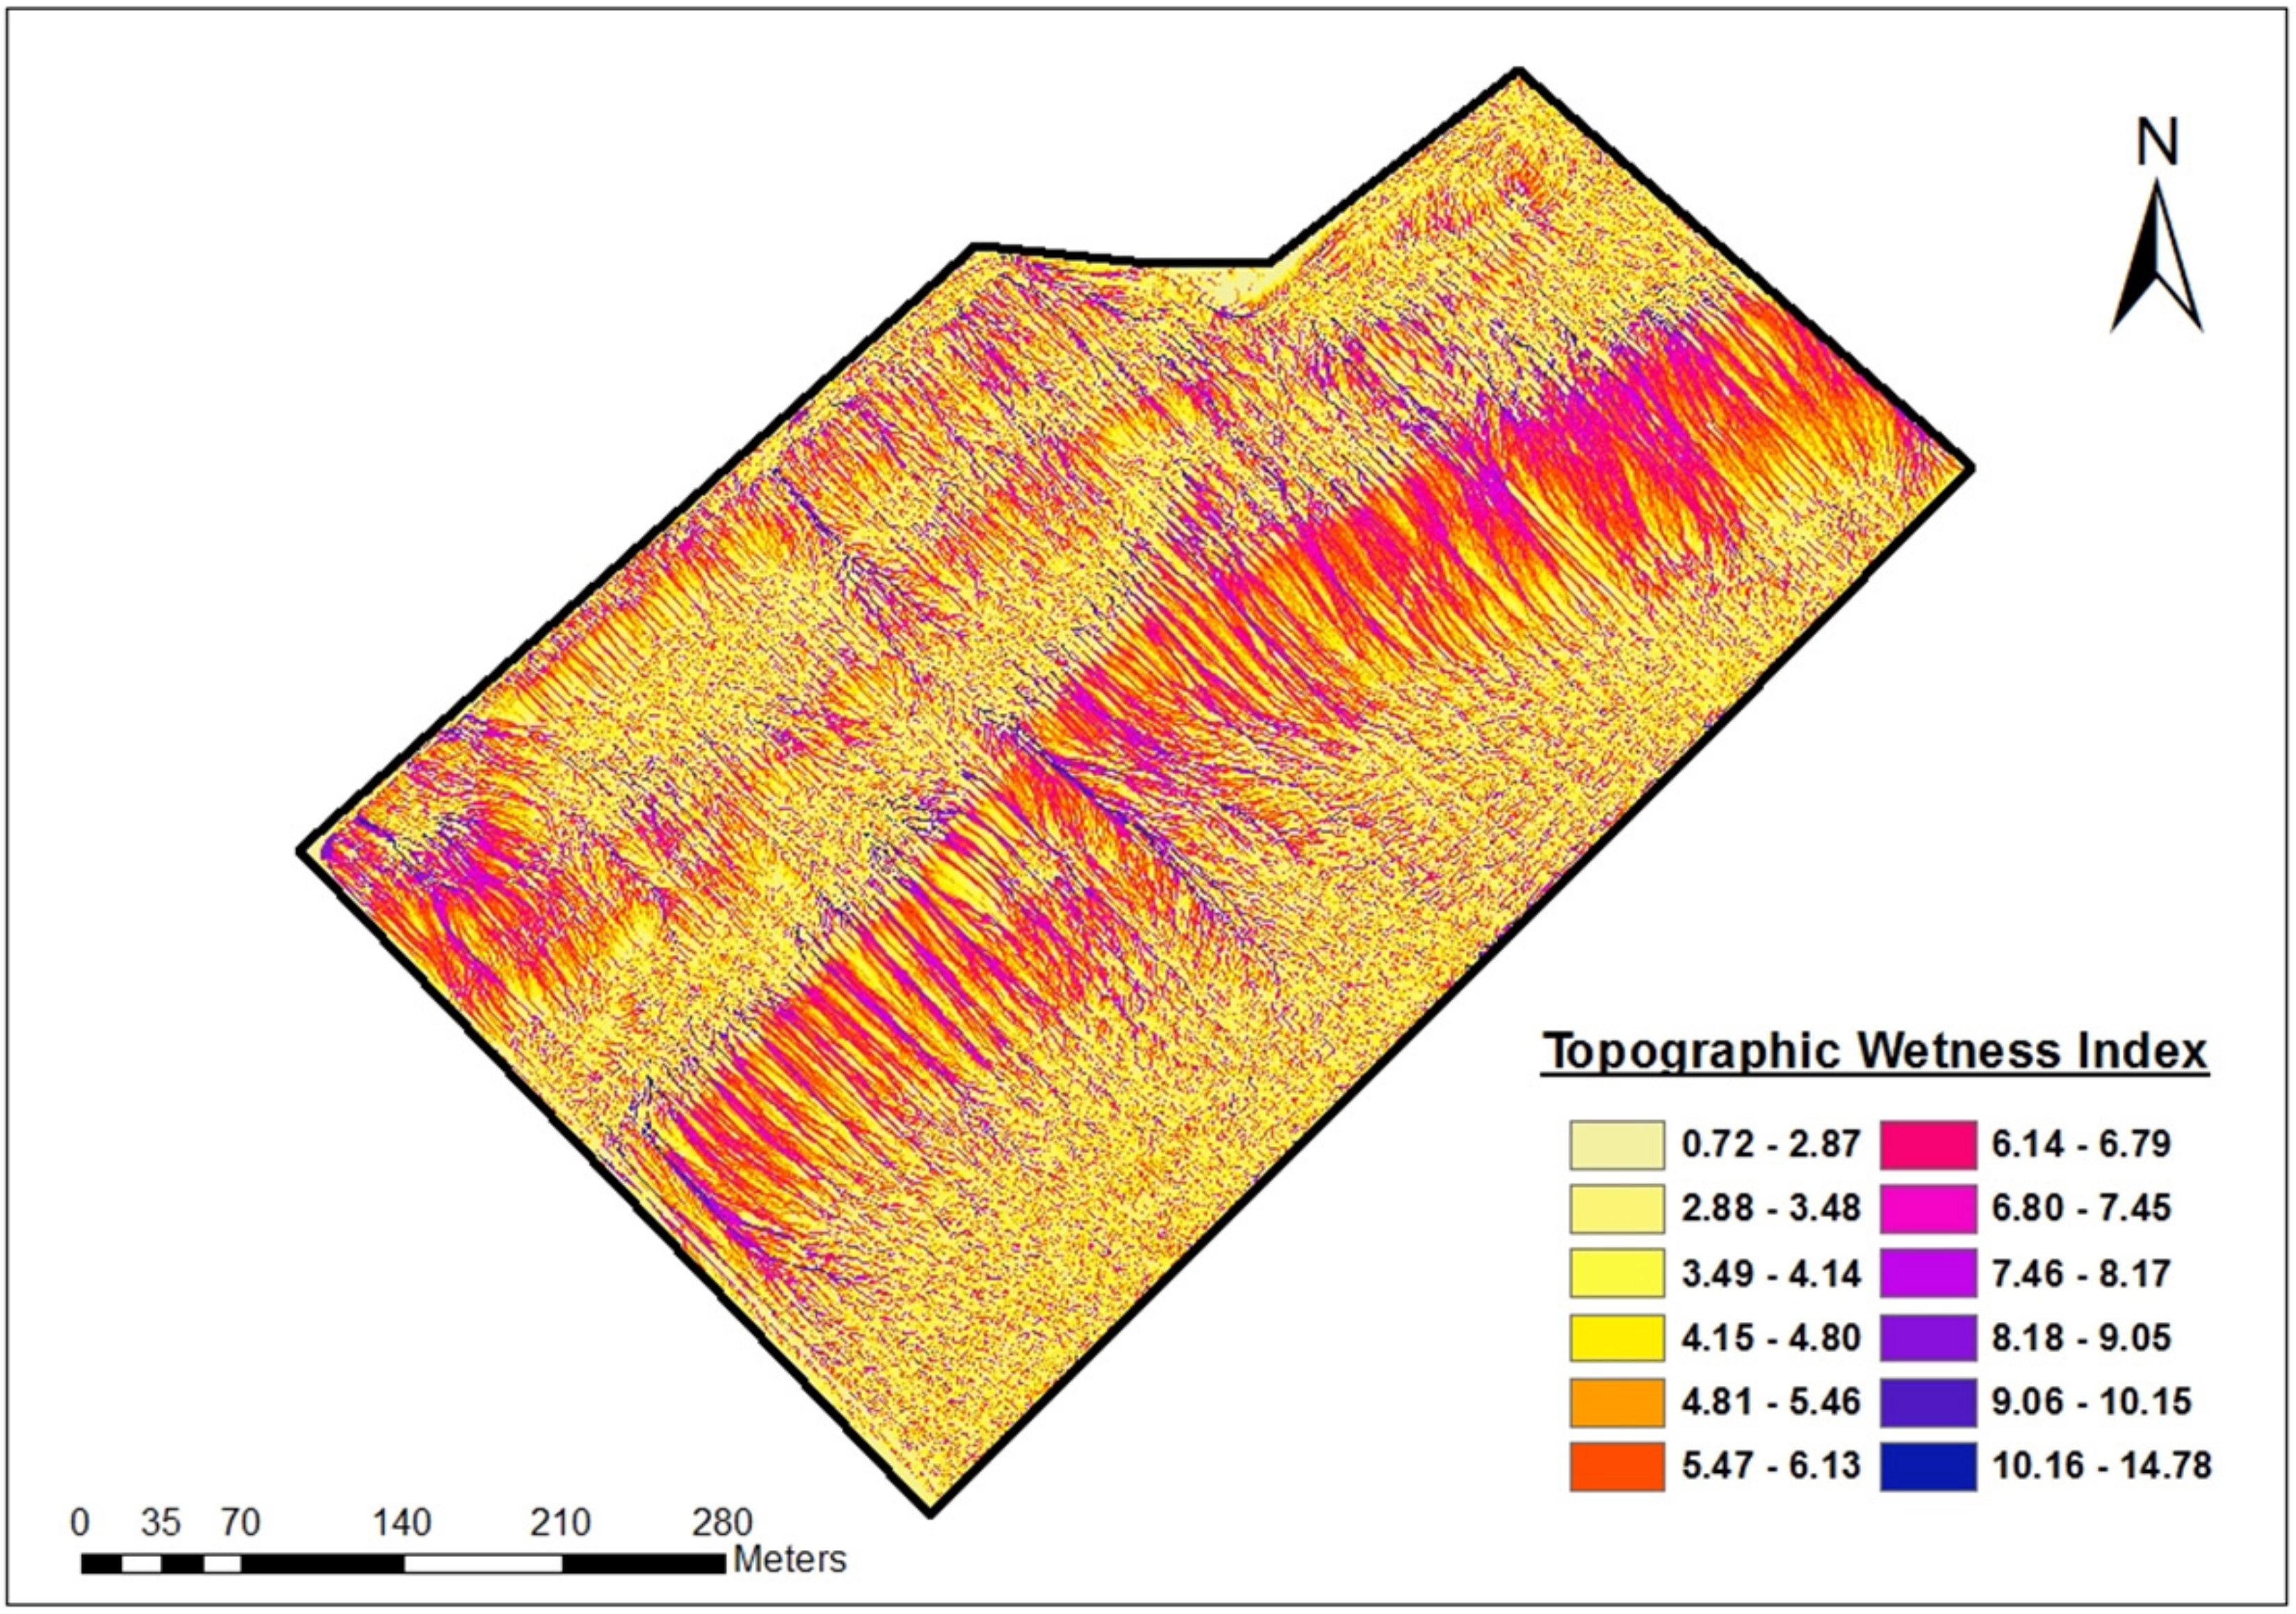
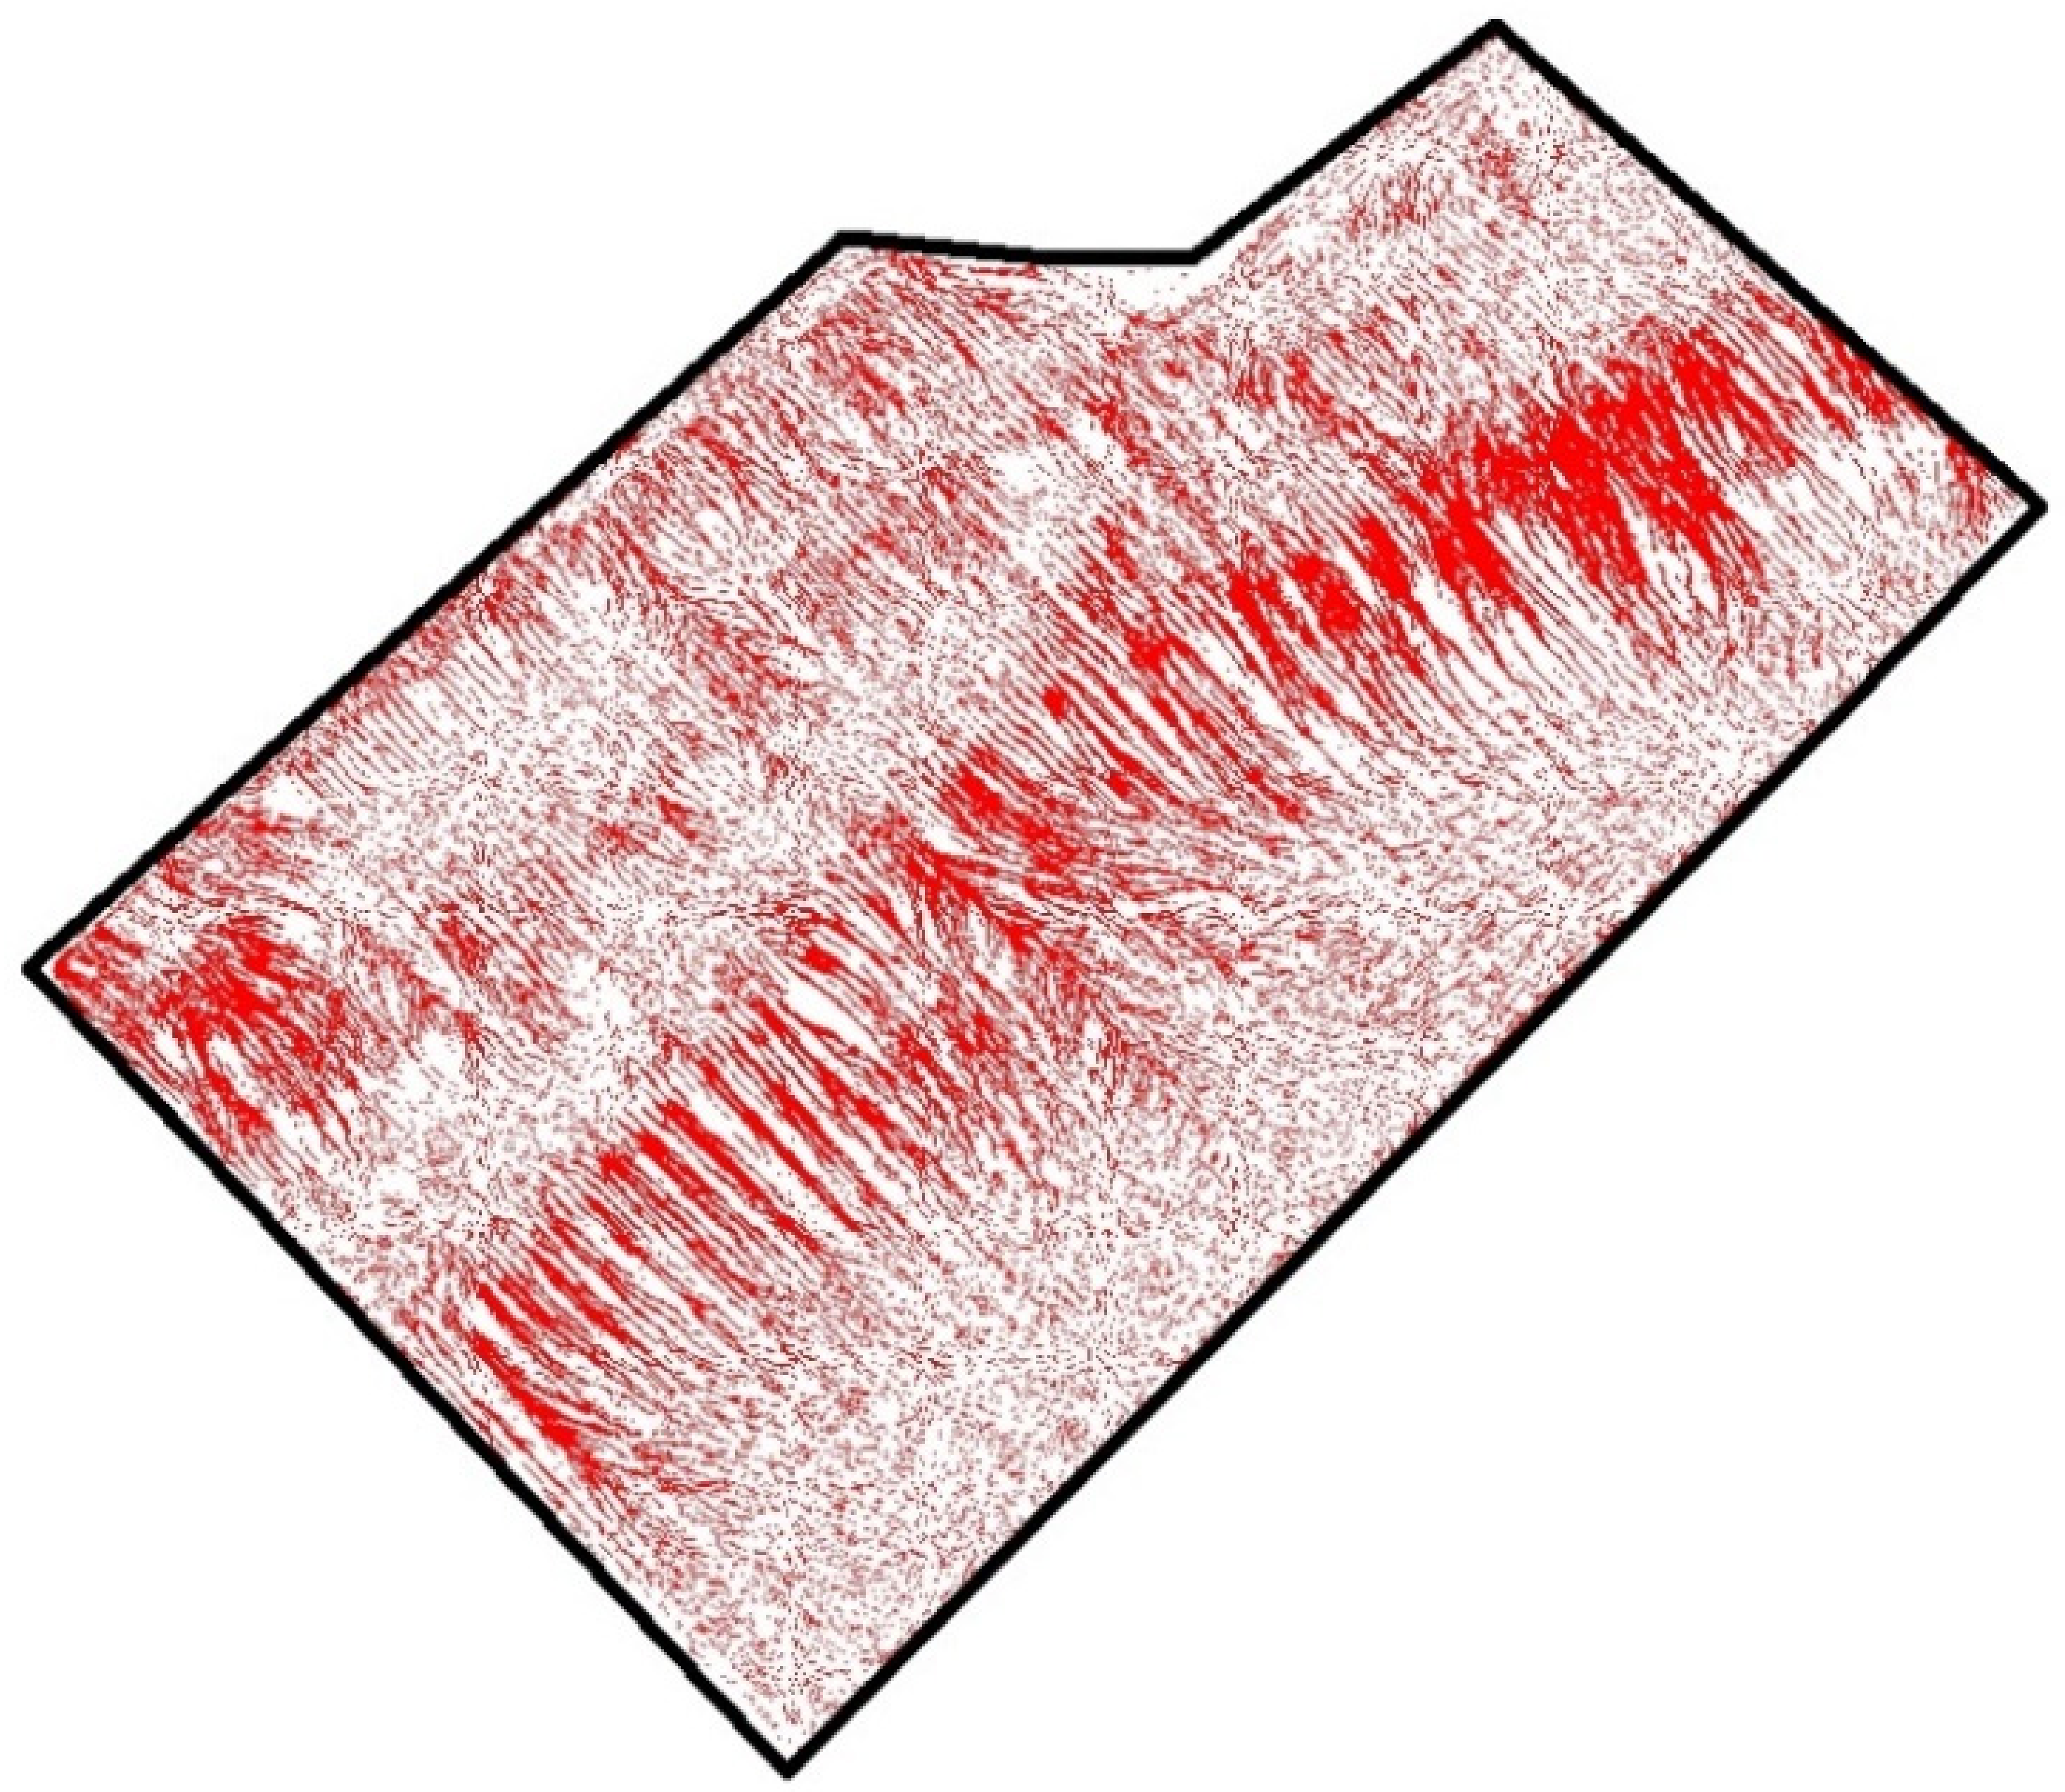
A lidar (light detection and ranging) survey of the study watershed was conducted to obtain a high-resolution digital elevation model (DEM) of 1.0 m × 1.0 m horizontal and 0.01 m vertical resolution. Land use and soil layers were prepared using ArcMap 10. The upslope contributing area per unit length of contour (a) values were determined using Whitebox Geospatial Analysis Tool [72]. This software uses a multidirectional flow path algorithm for more realistic flow and wetness distributions [68,69]. Soil depth at various locations in the field was obtained by using an auger, and a constant head Guelph permeameter was used to measure in situ field saturated hydraulic conductivity. The Raster Calculator of ArcMap 10 was used to manipulate the raster layers to derive the TWI map (Figure 2) from the DEM using Equation 7.

2.5. Distributed CN-VSA Method

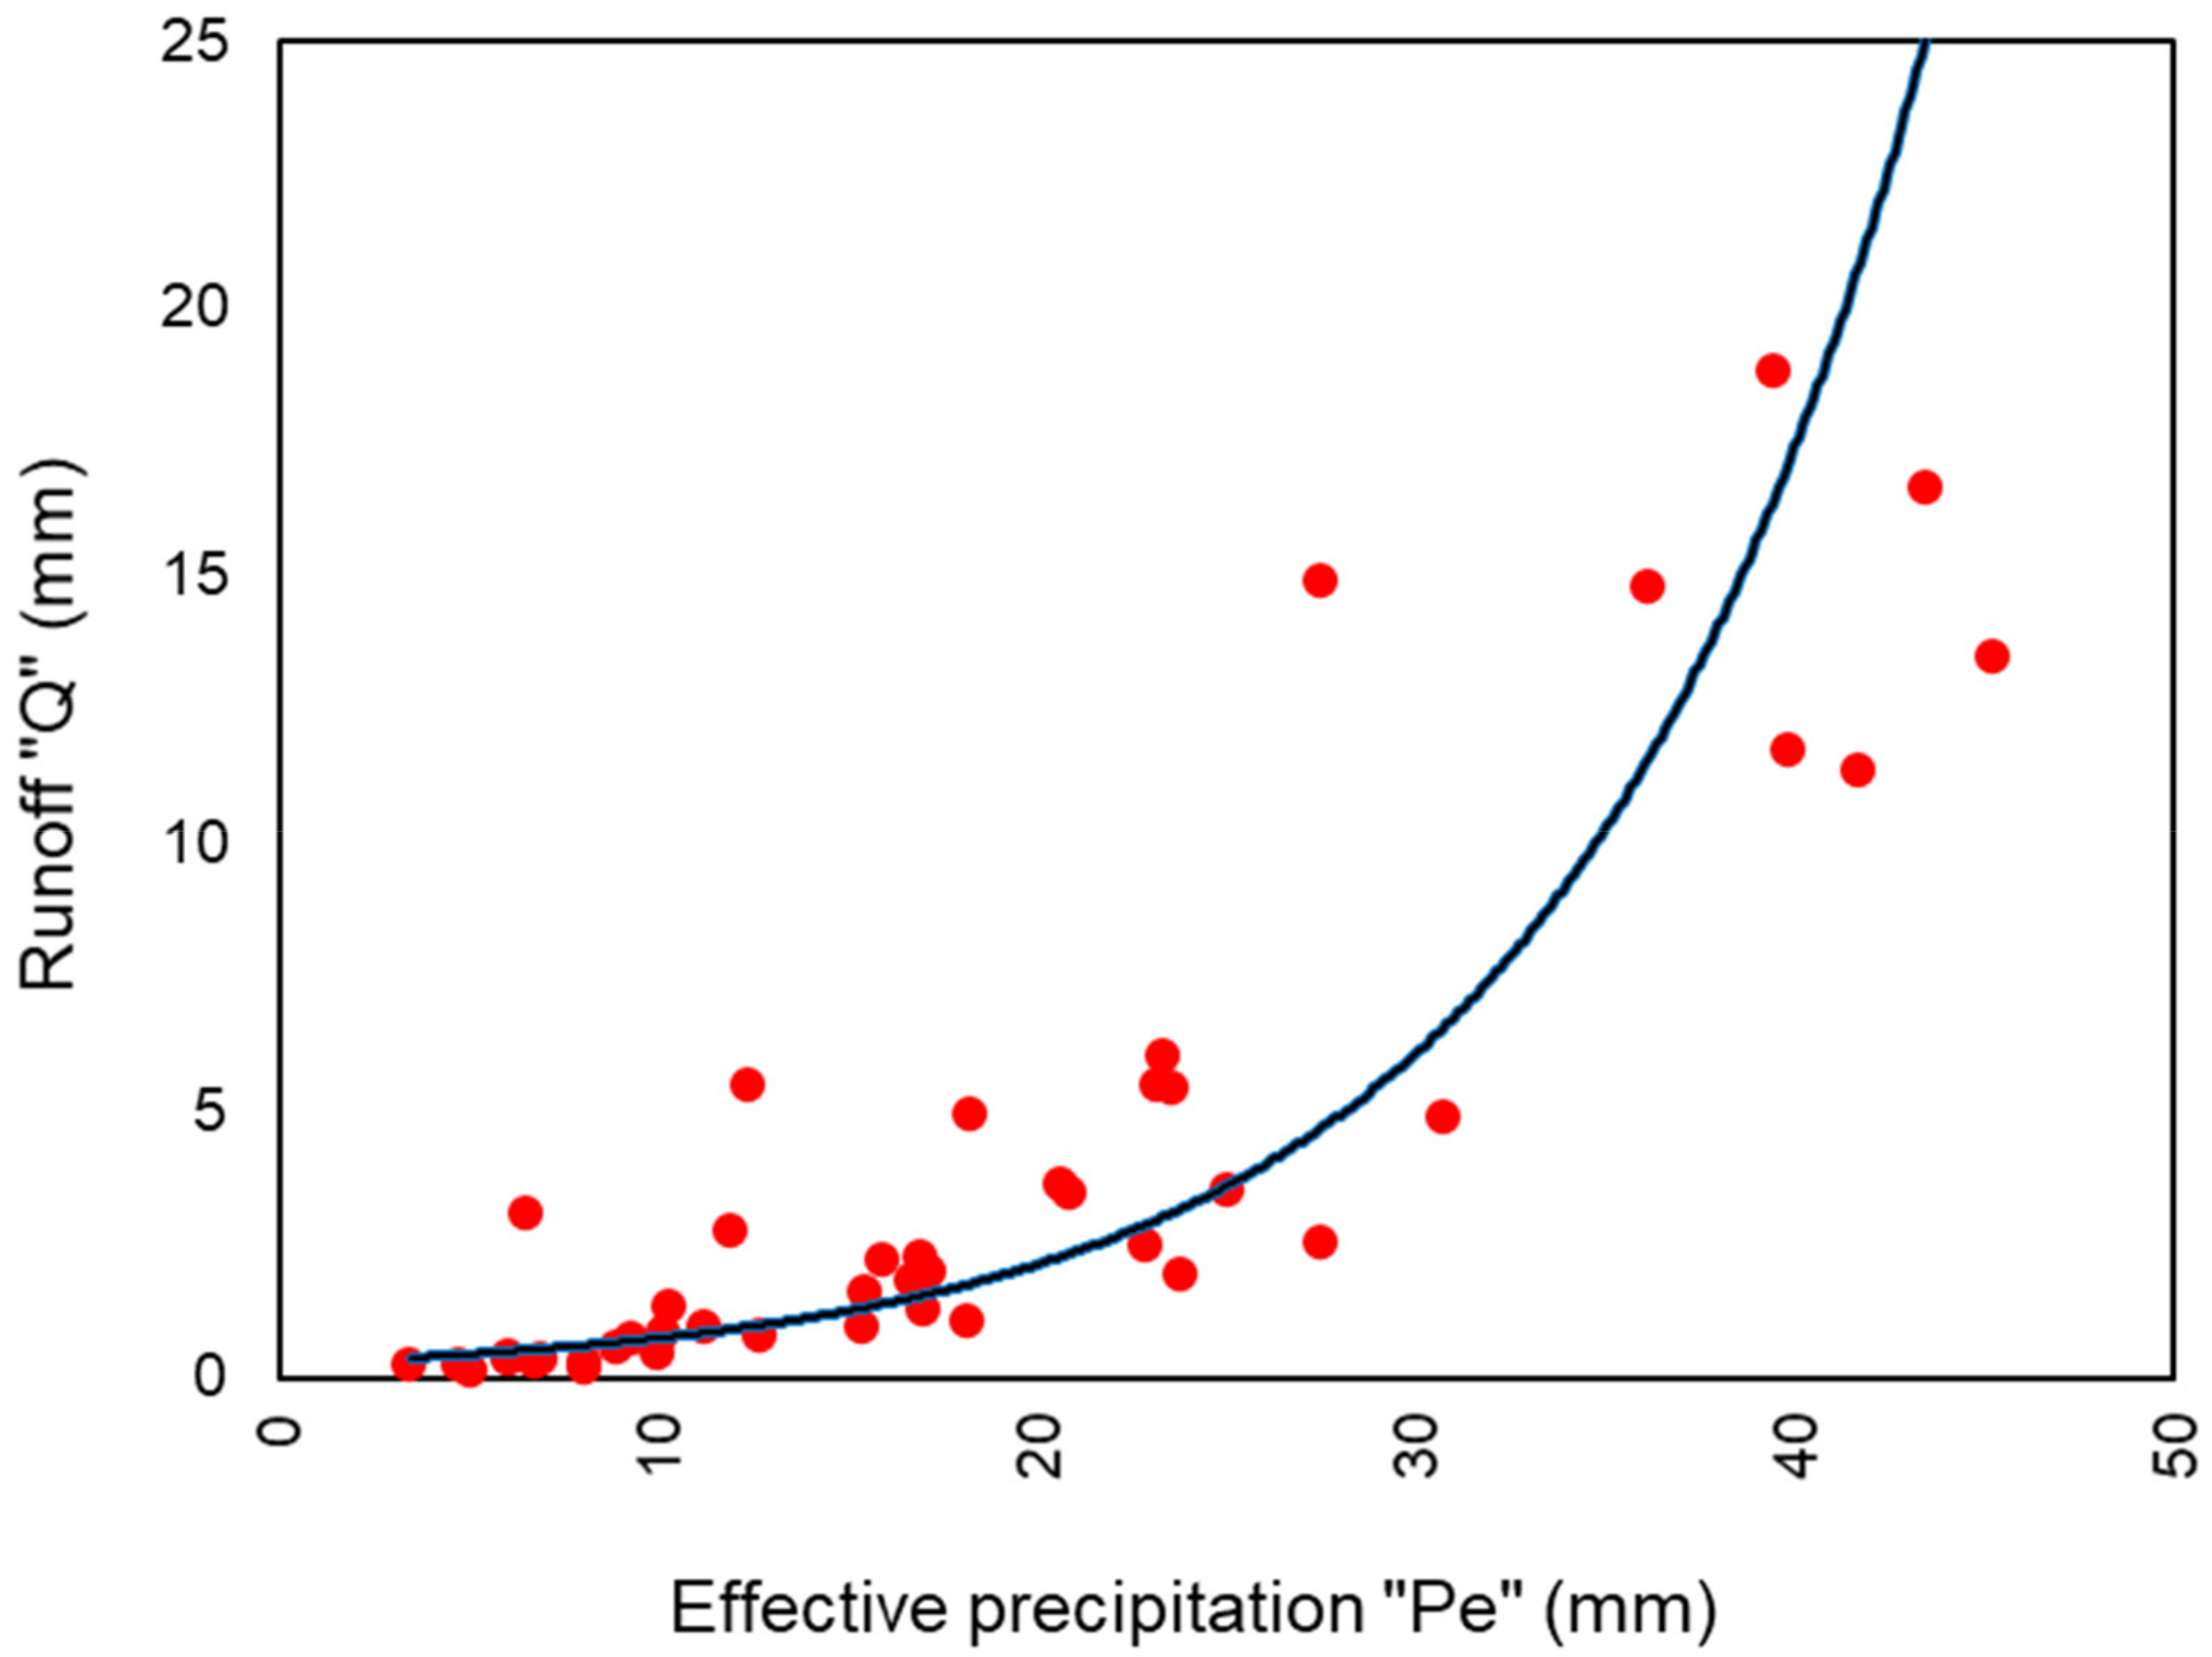
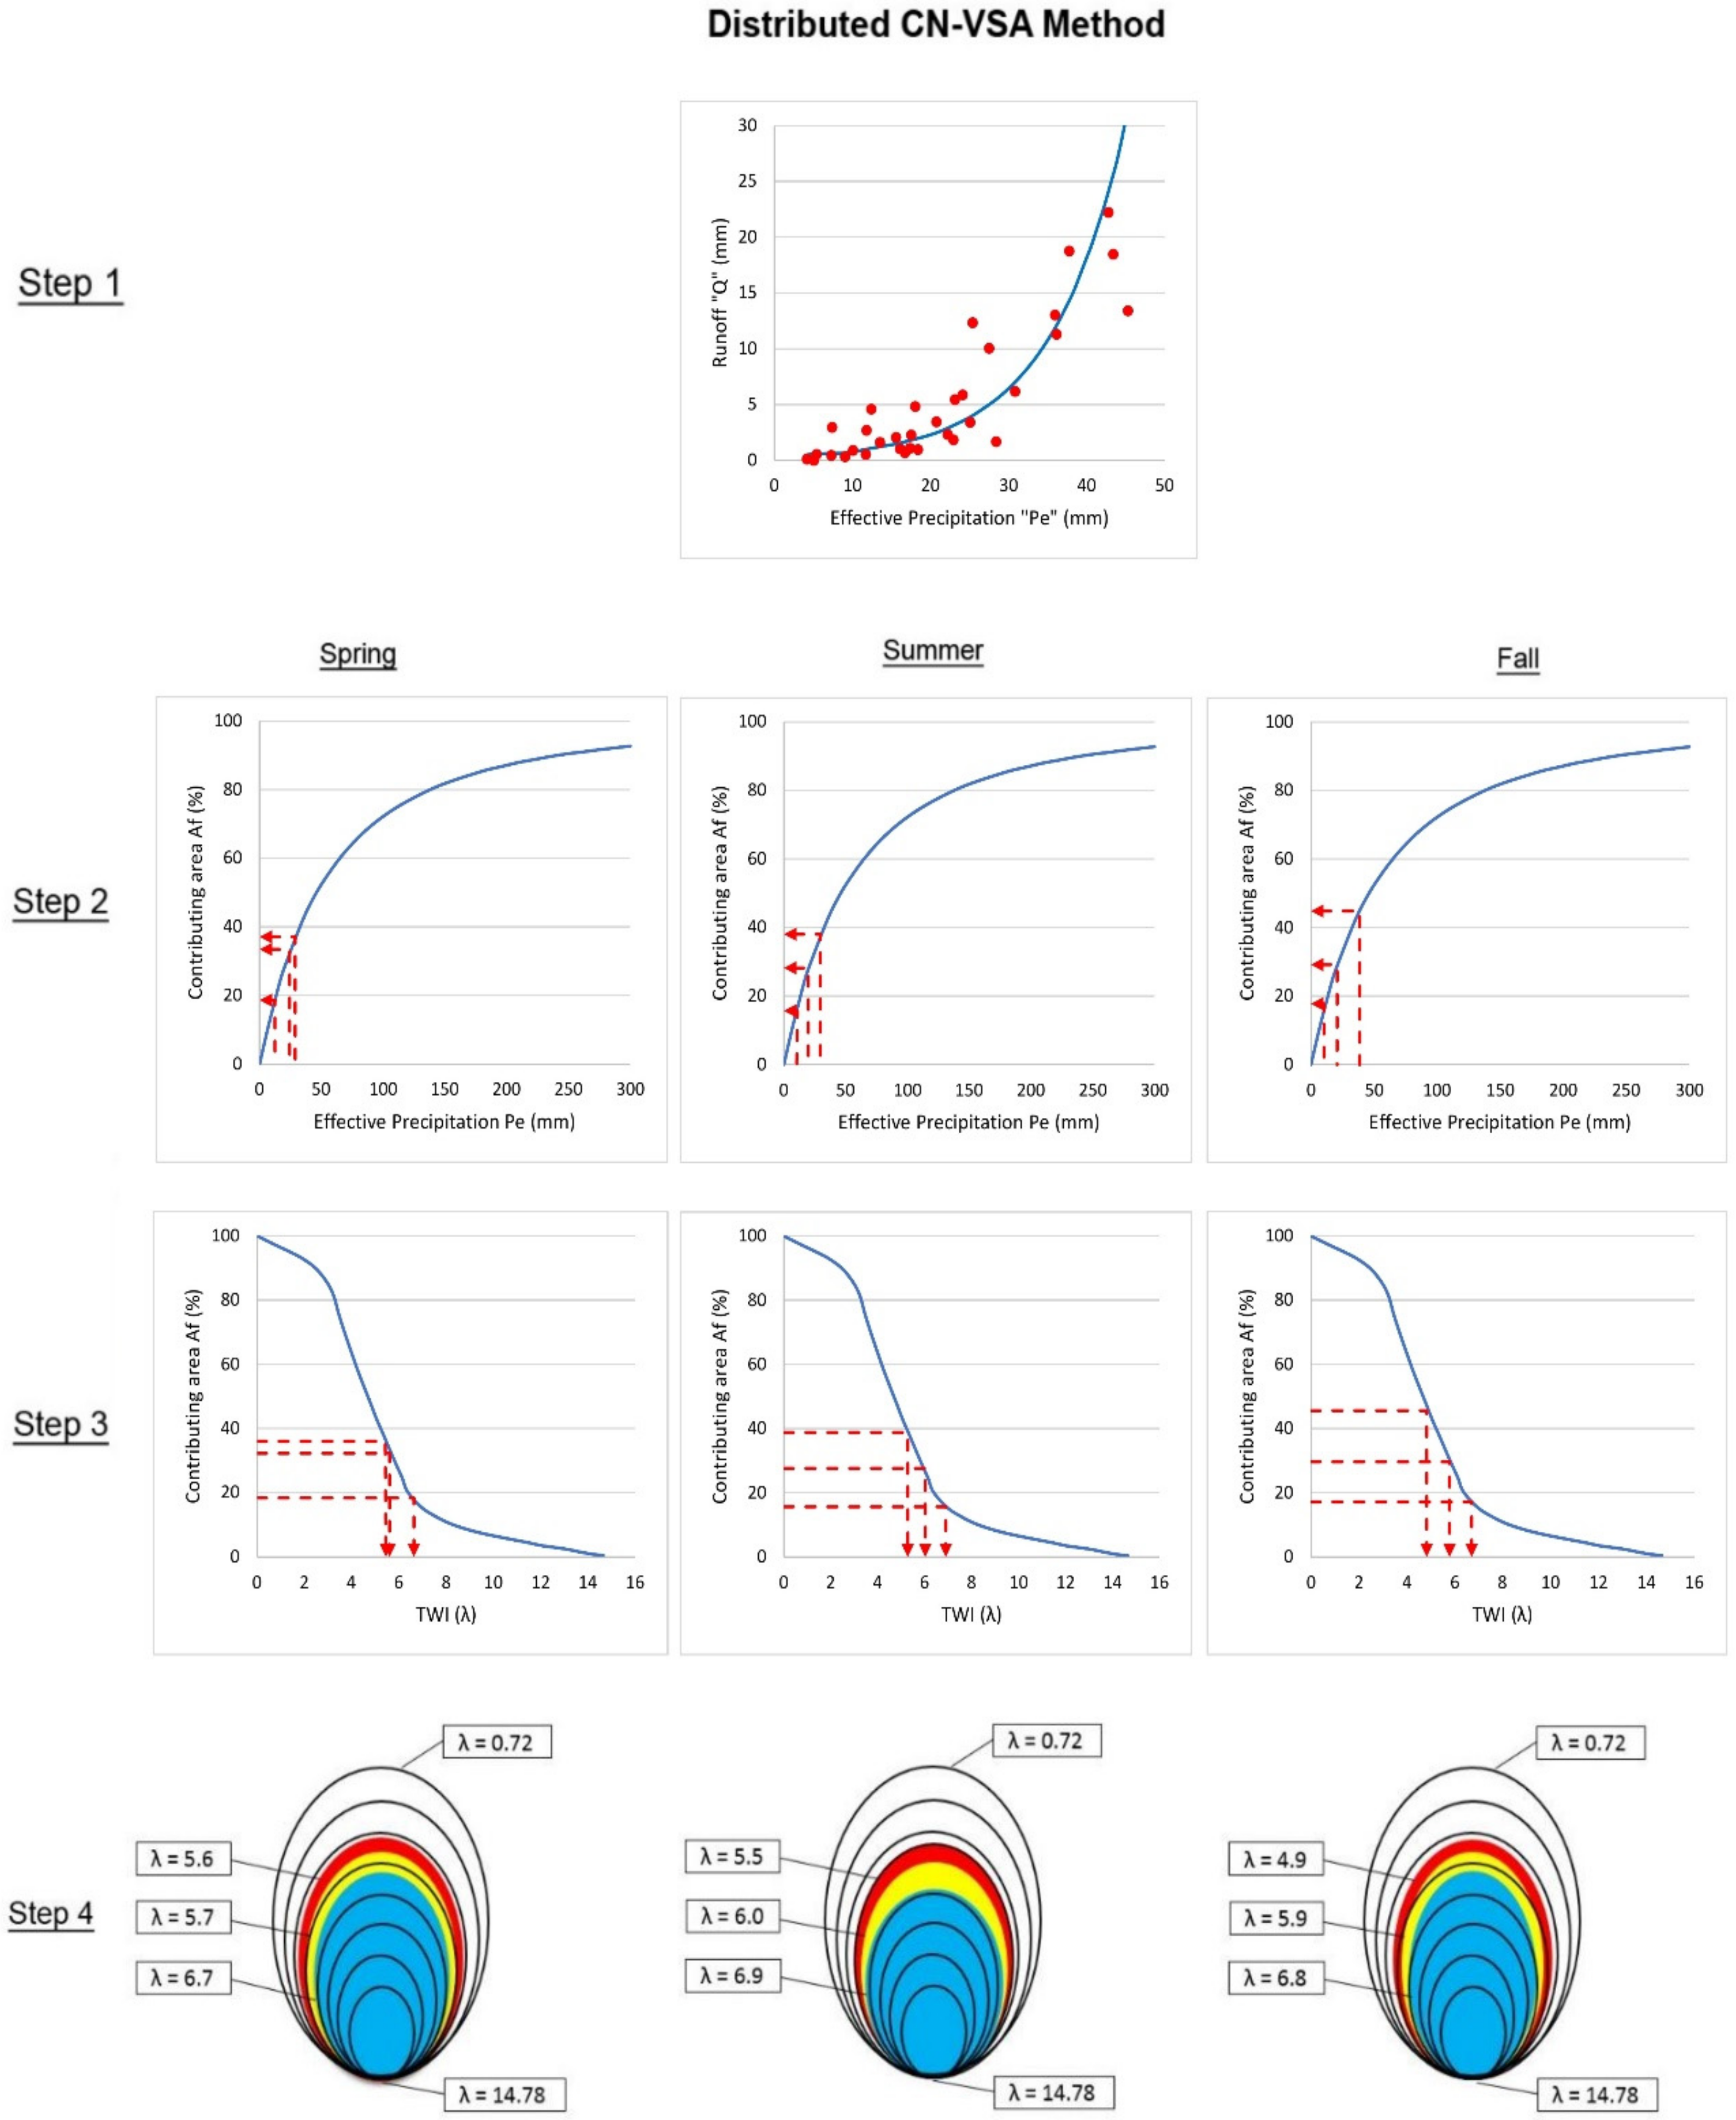
The distributed CN–VSA method consists of four steps. To explain the method, a rainfall event dated 28 May 2013 is selected as an example. In the first step, a line graph was prepared using Pe and Q observed event data as shown in Figure 3. The S value of the watershed was computed by fitting Equation 3 to Pe and Q data. The average annual S value for the watershed computed was 112 mm.
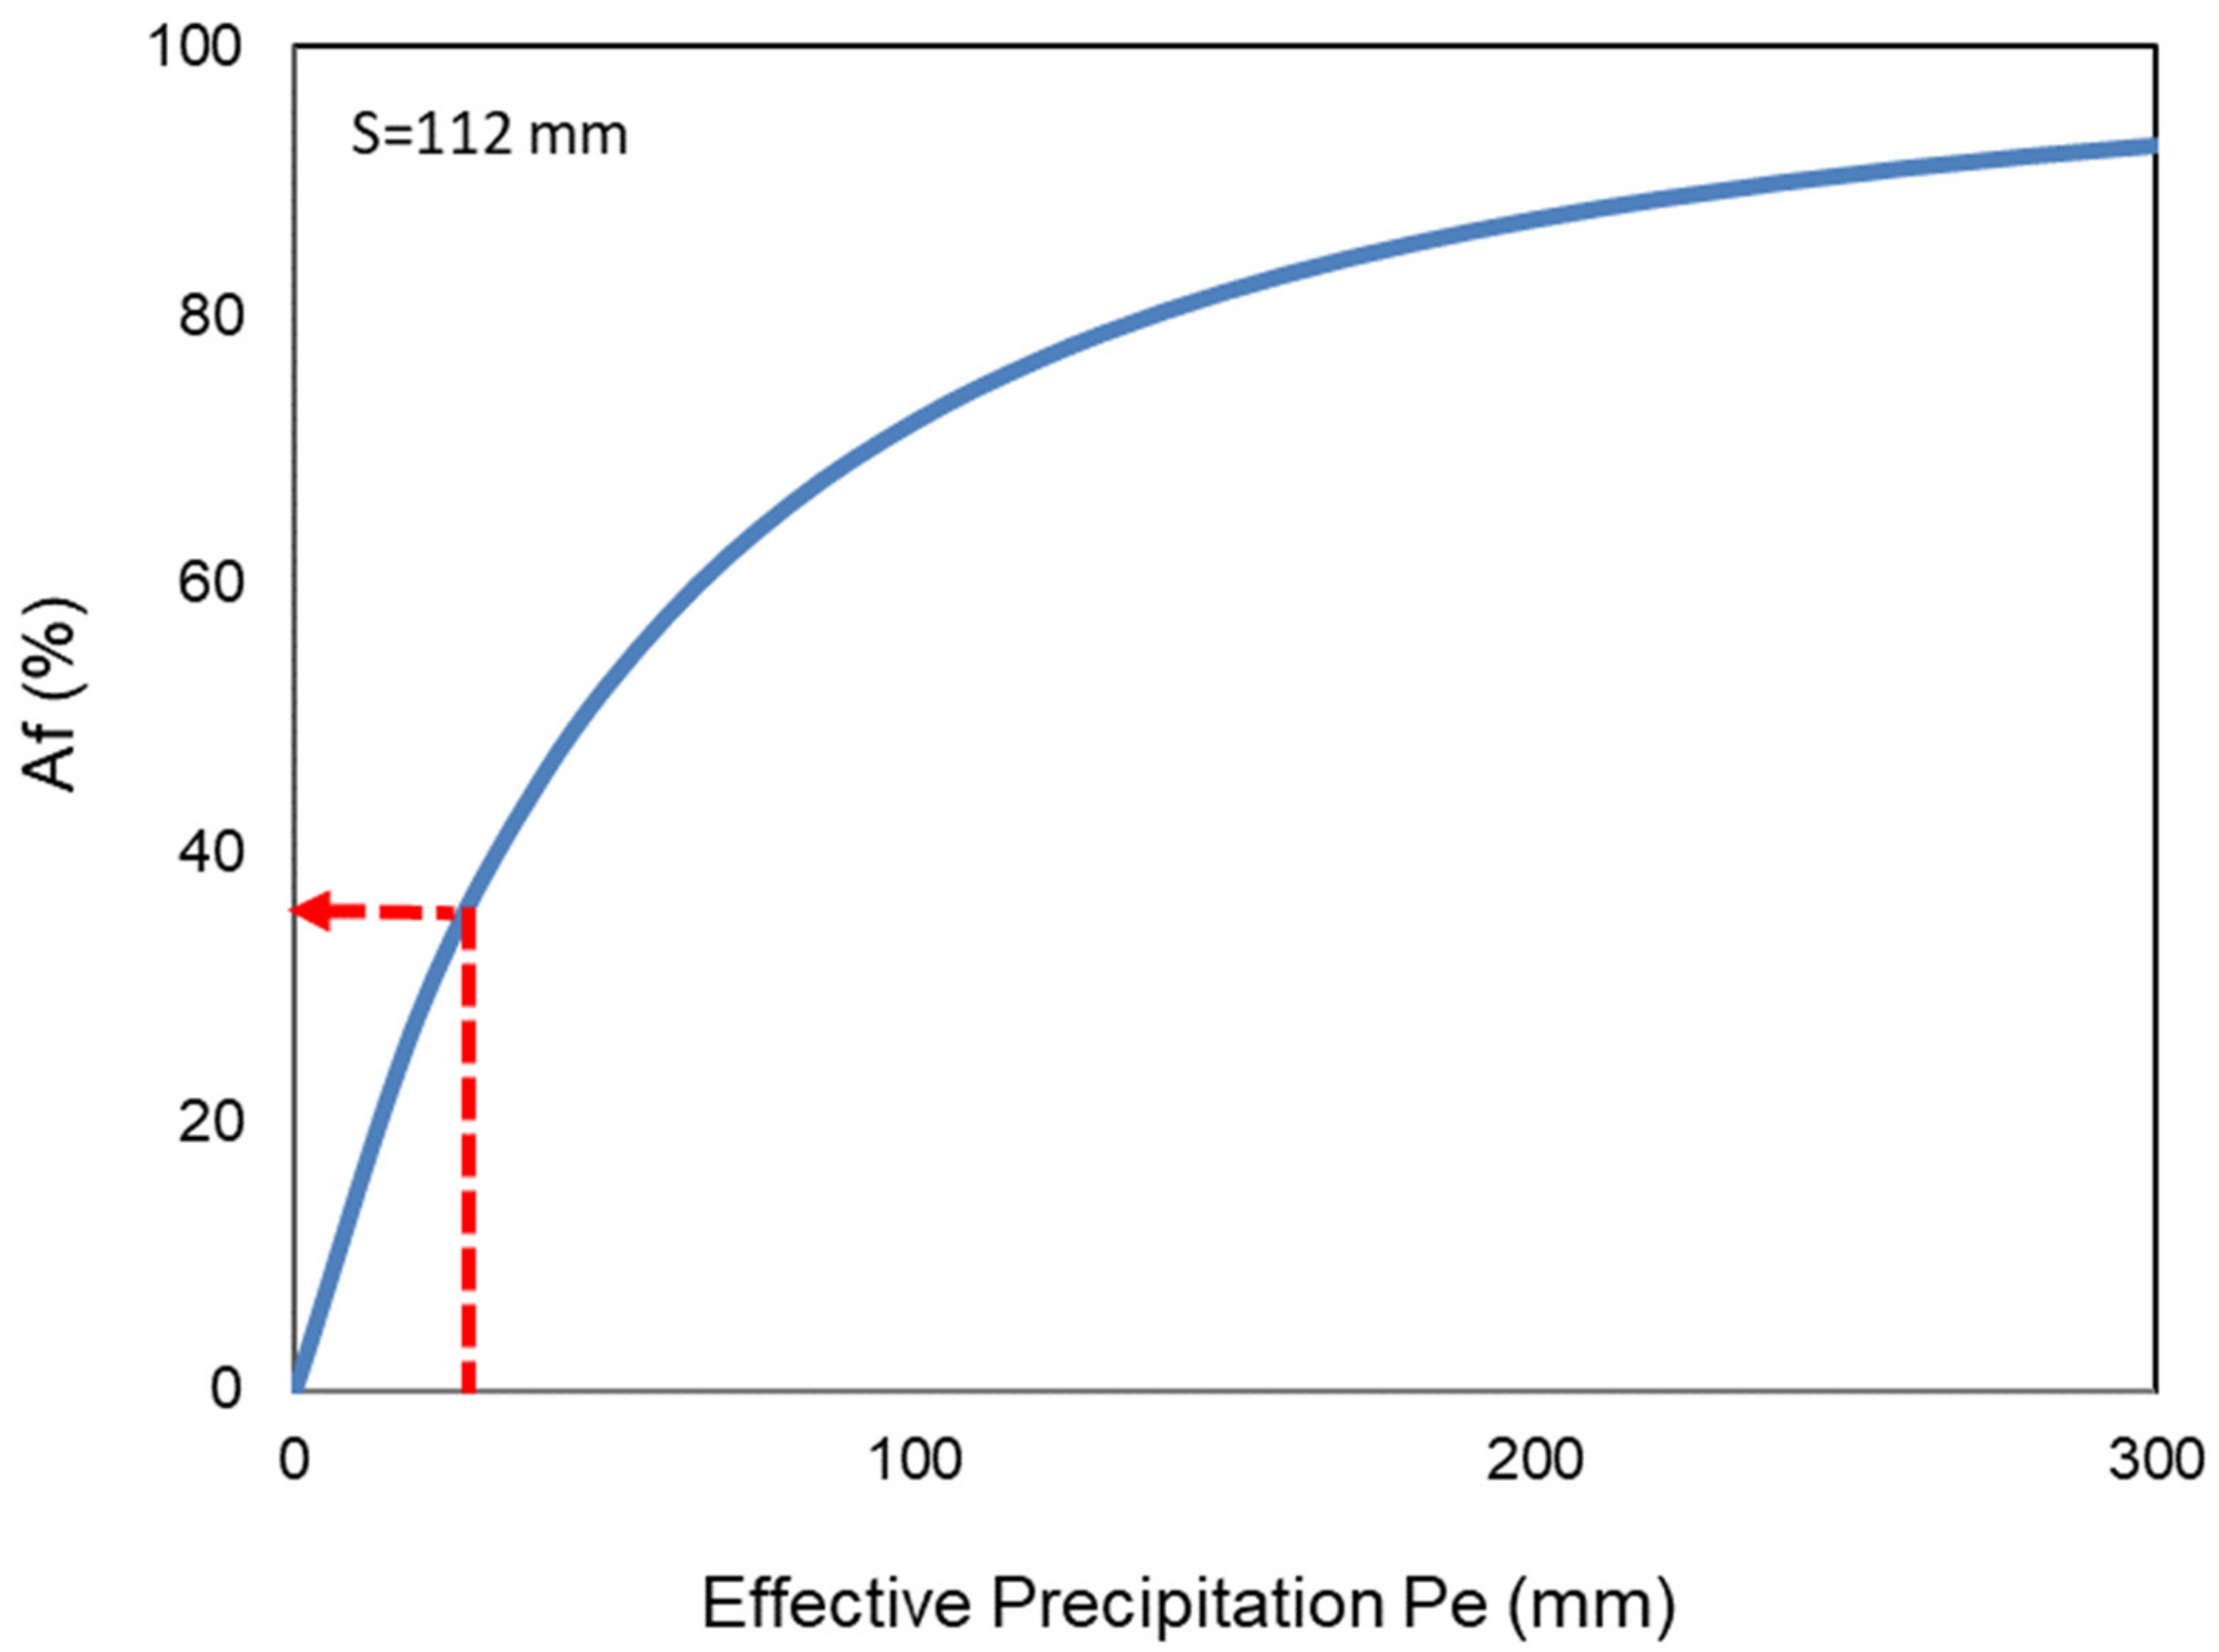
In the second step, Pe versus Af’s graph was created using Equation 6 and the S value obtained in step 1. In this step, the A f watershed’s saturated fractional area was determined using the given Pe of the rainfall event. For the rainfall event of 28 May 2013, Pe =36.14 mm and S value of 112 mm corresponds to a fraction of saturated area A f = 37% of the total watershed area as shown in Figure 4. The runoff volume of 2891 m3 for this event was calculated by multiplying the effective precipitation (Pe) 36.14 mm with the saturated area ( A f ) =7.99 ha.
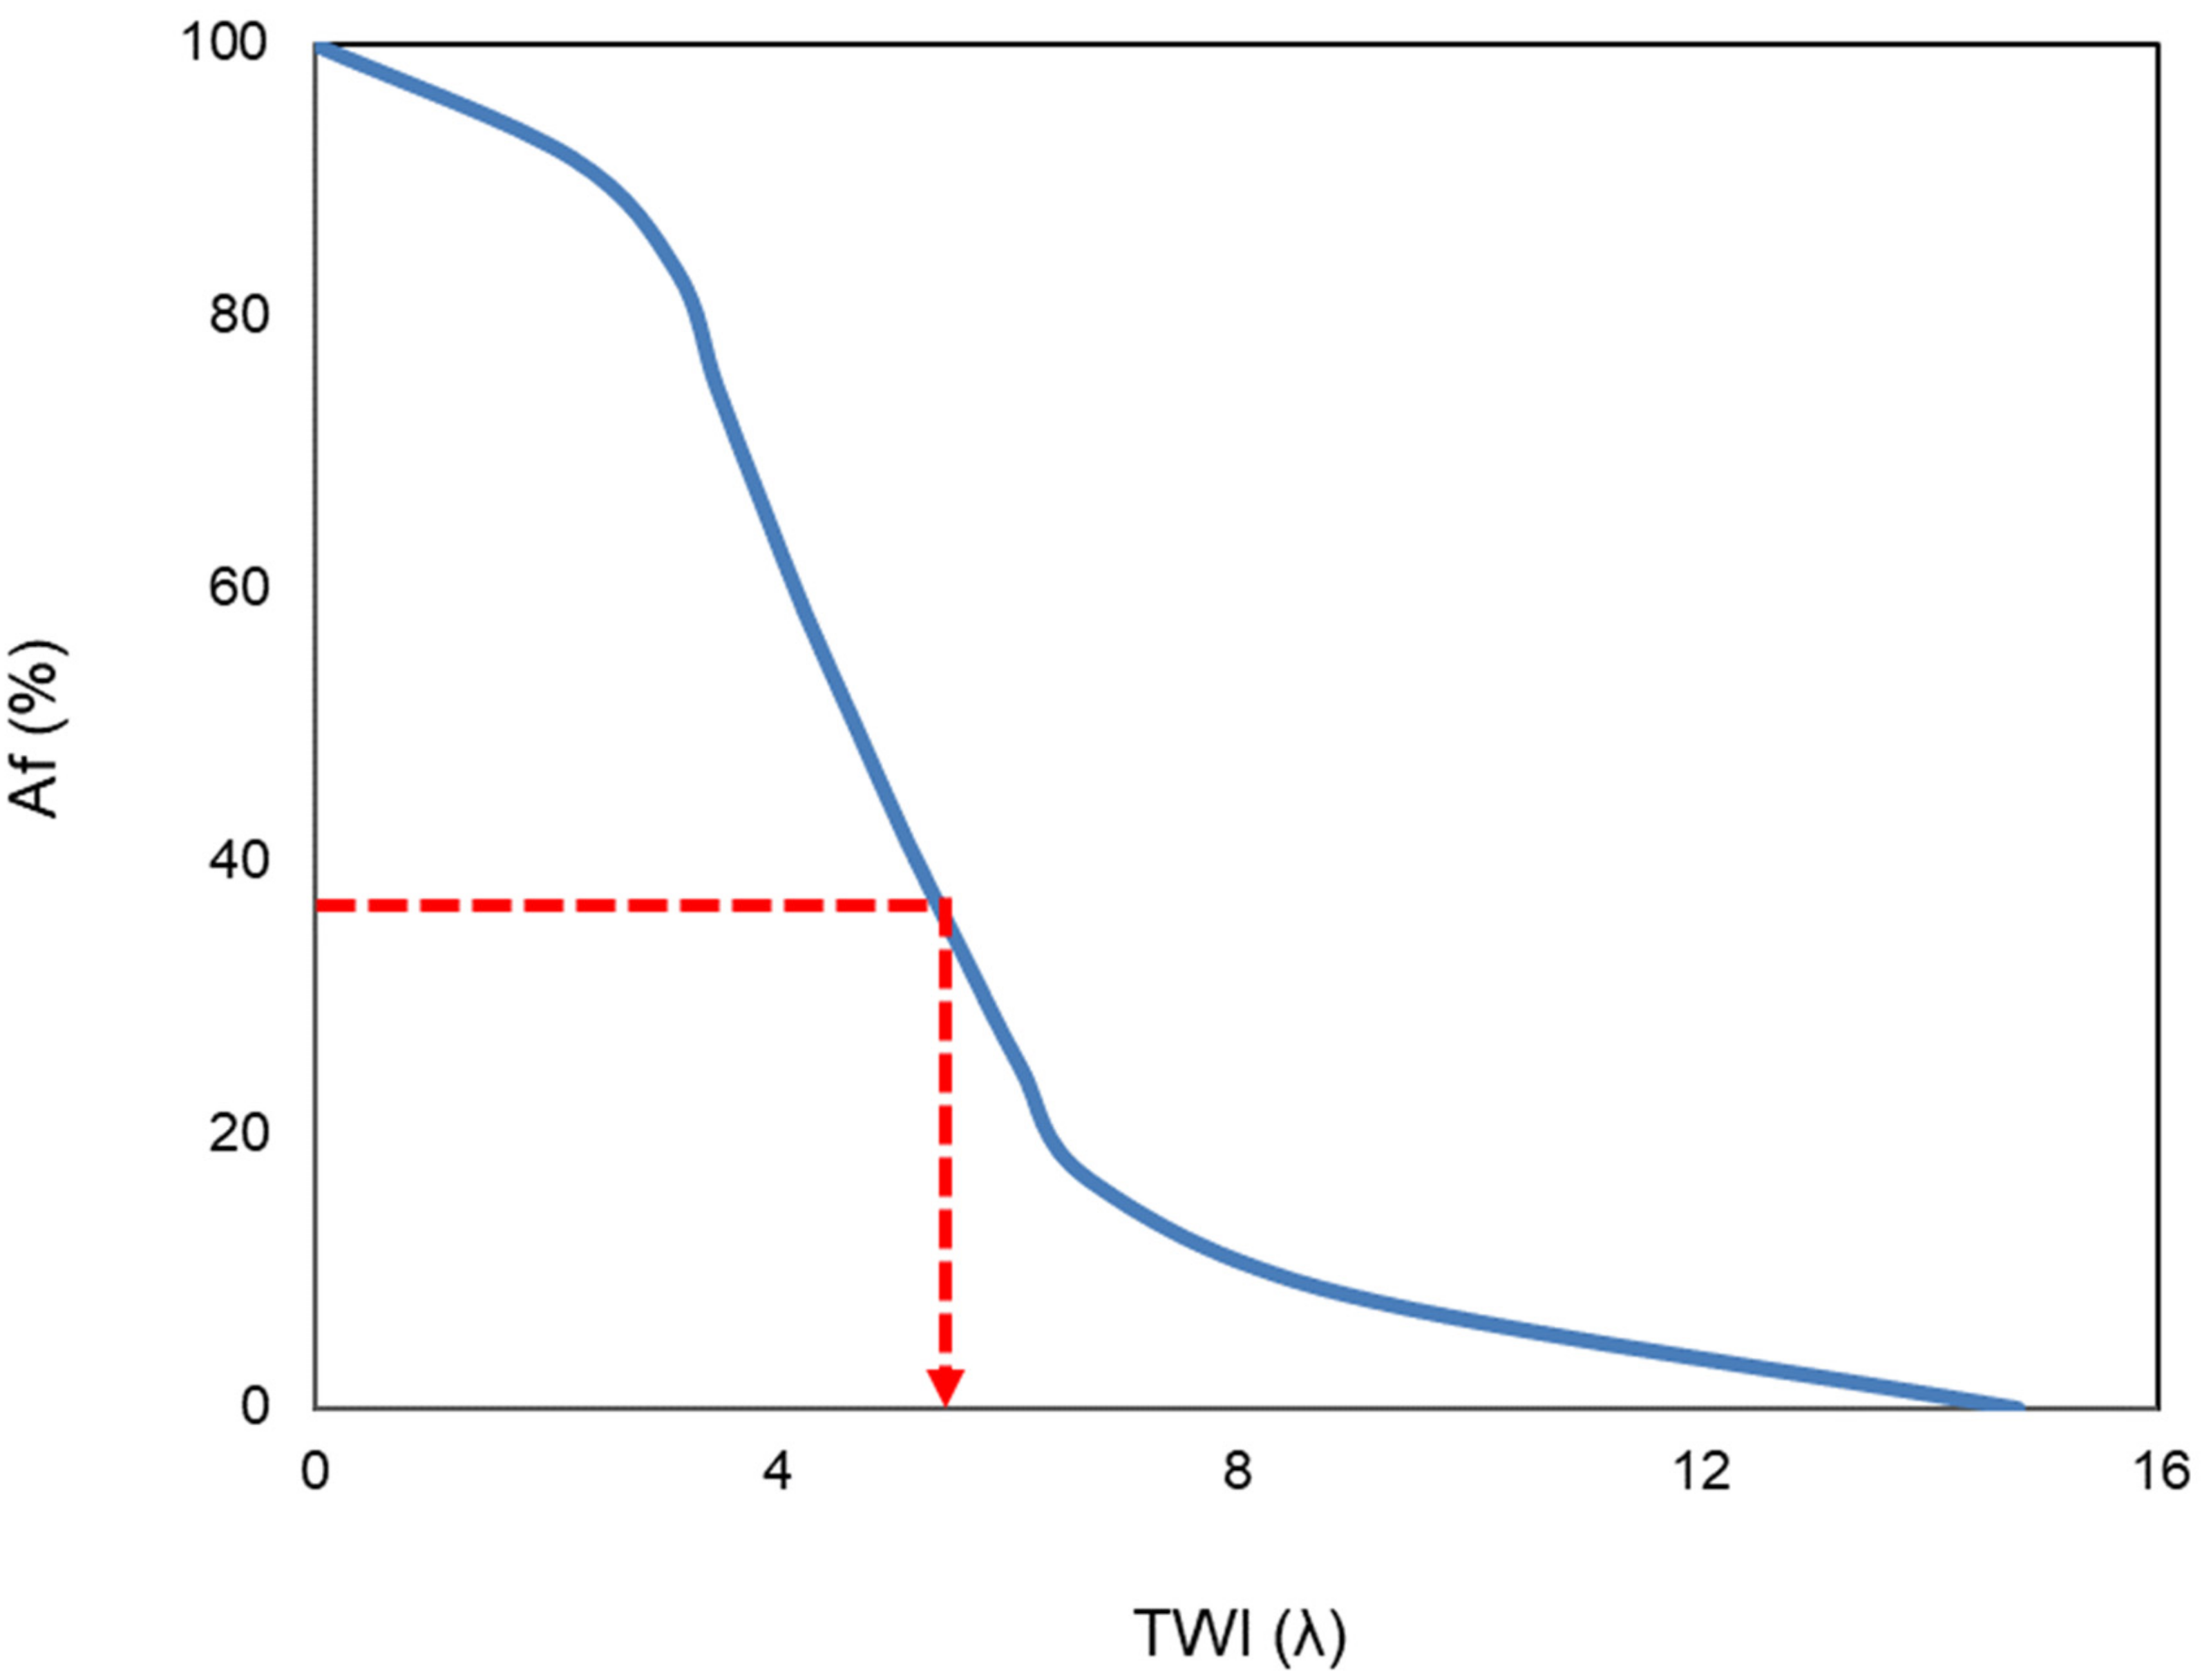
In step three, a graph of A f corresponding to the TWI was prepared using a TWI map of the study watershed, as shown in Figure 5. The threshold λ was computed using the fraction of saturated area A f computed in step two. The threshold λ value corresponding to A f value of 37% (7.99 ha) was 5.7. This implies that the rain event saturated the areas in the watershed with λ value of 5.7 or higher.
In the fourth step, the locations of saturated areas within the watershed were identified from the TWI map of the watershed using the threshold λ value obtained in step 3. The watershed portions have an equal or higher λ value than the threshold λ was saturated and generated runoff; whereas, the remaining areas do not contribute to surface runoff. Figure 6 shows runoff-generating areas within the watershed corresponding to the threshold λ value of 5.7.

2.6. Modified Distributed CN-VSA Method

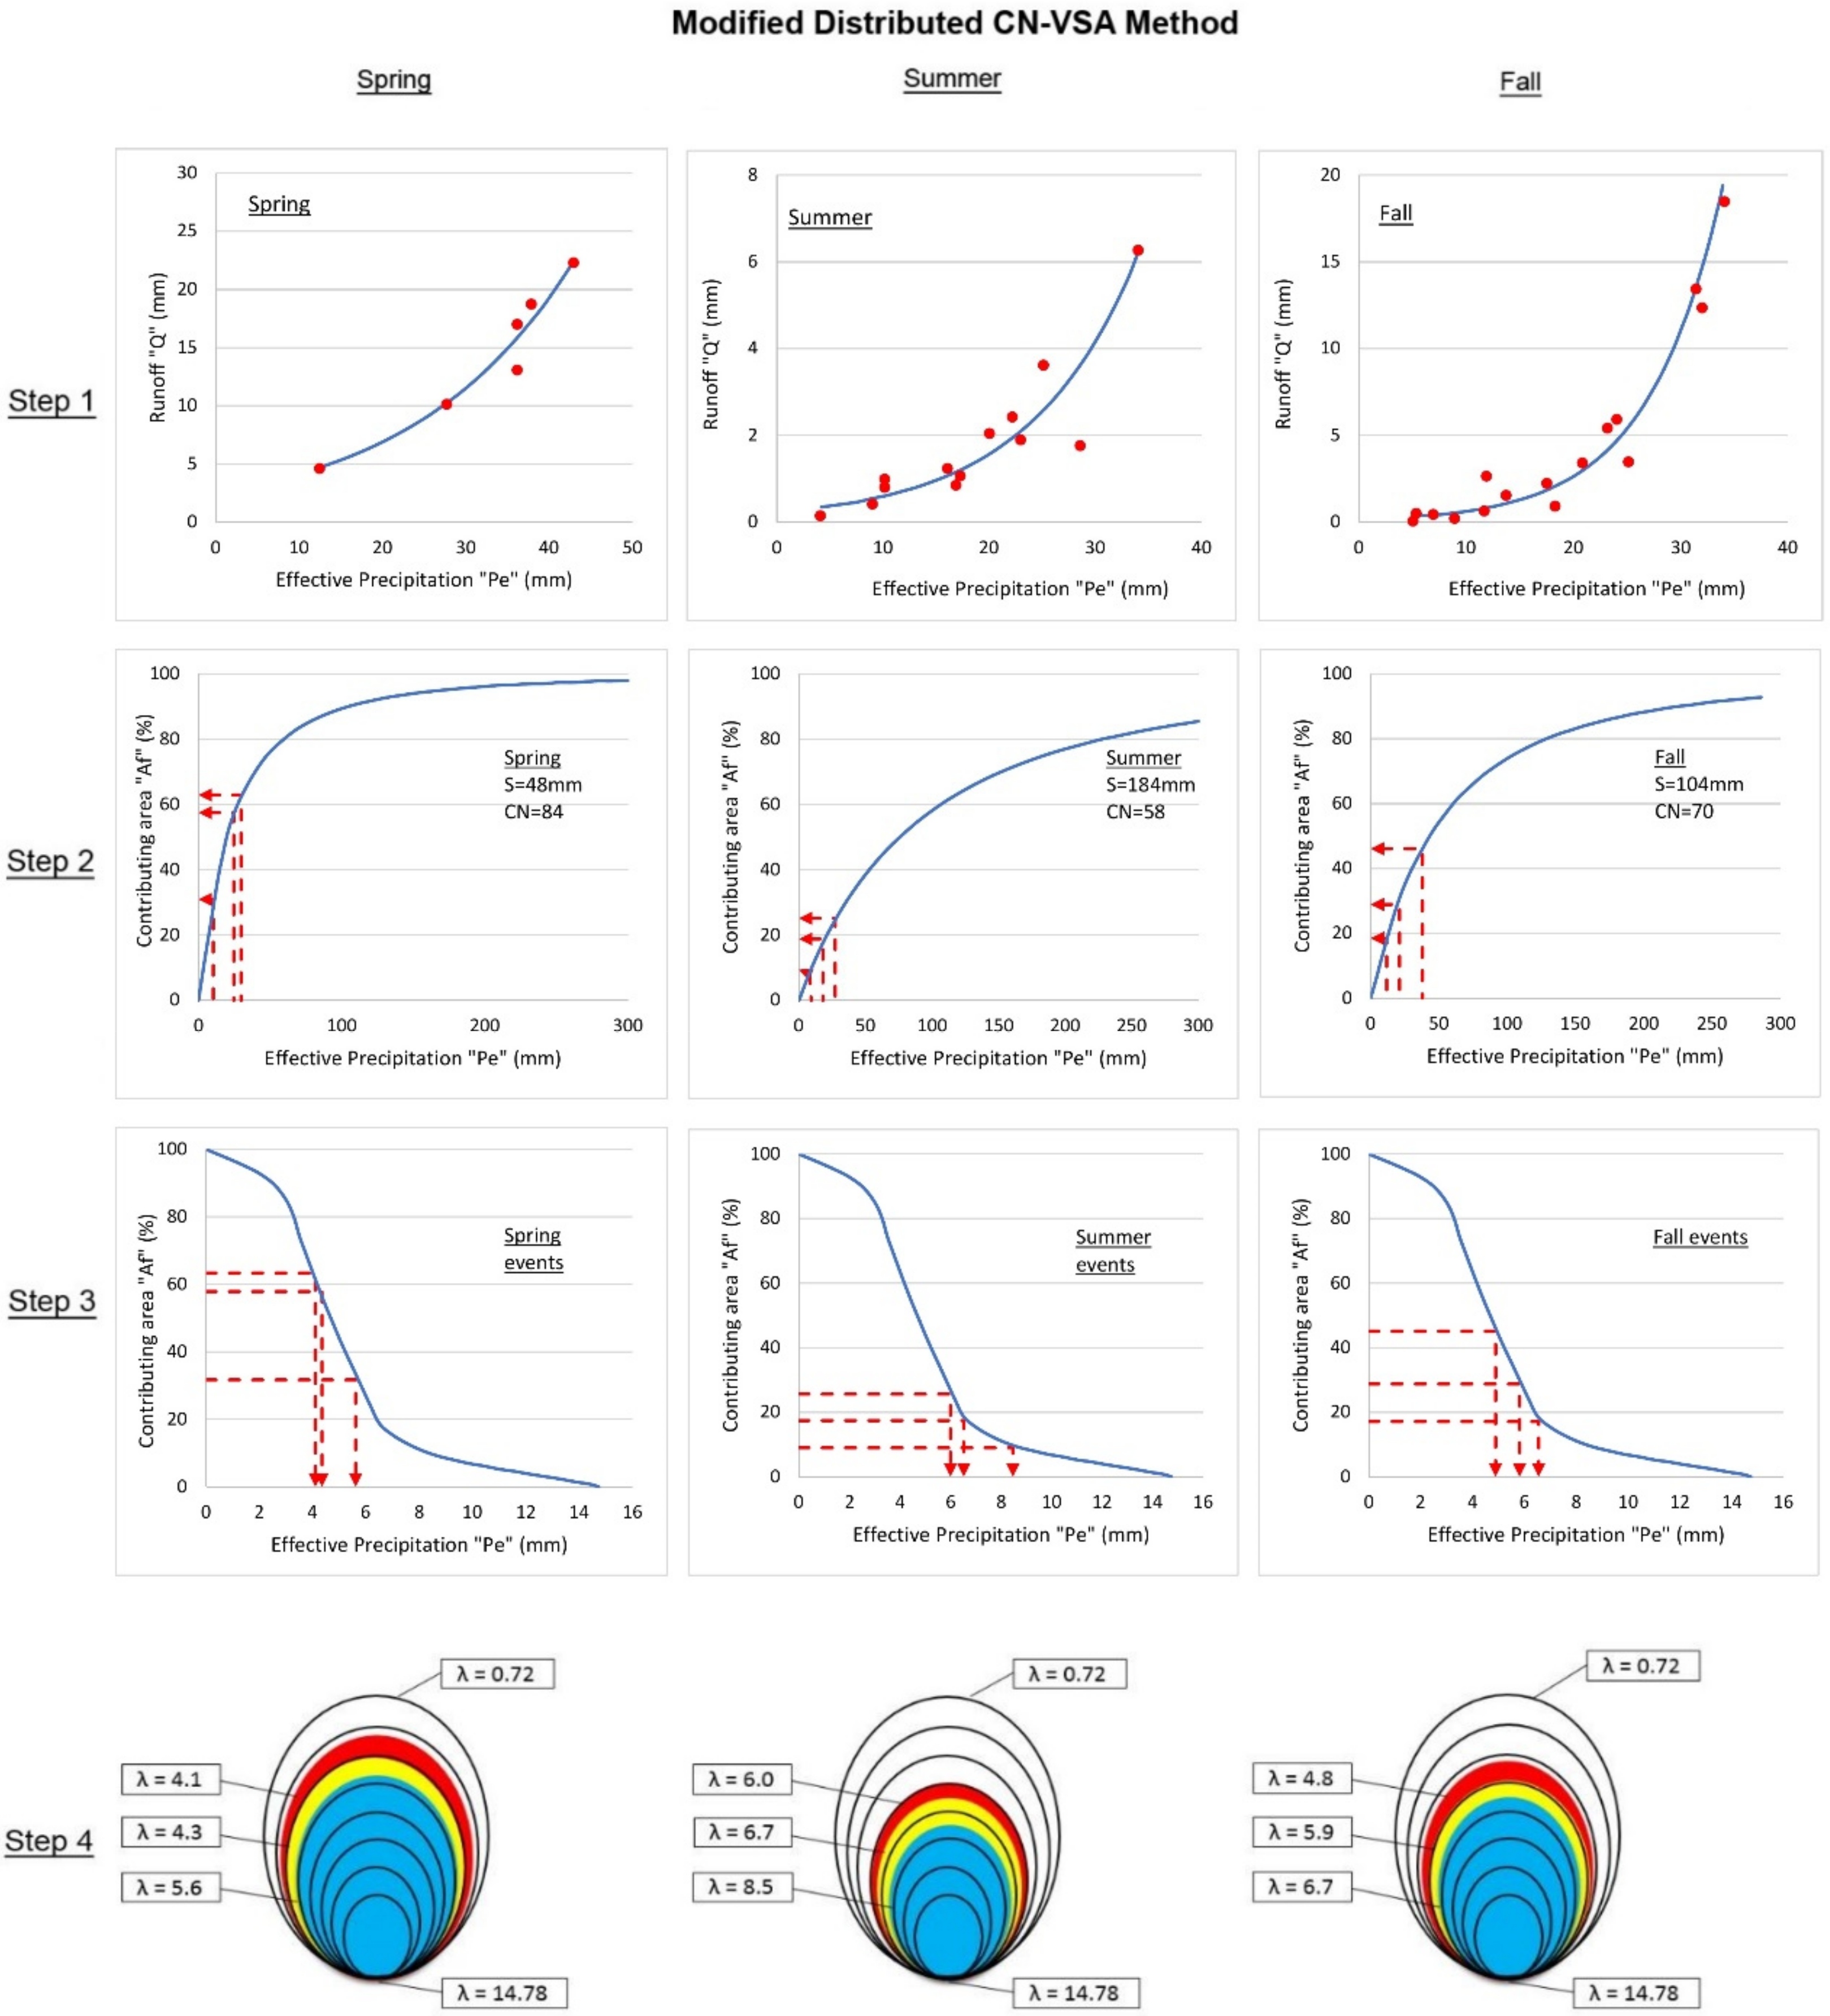
The methodology used to compute the modified distributed CN-VSA method is similar to the distributed CN-VSA method. However, instead of using an annual average value of potential maximum retention, S’s average seasonal value for spring, summer, and fall were determined in step 1 by fitting Eq. 3 to observed Pe and Q values for individual seasons. In step 2, individual graphs A f versus Pe for spring, summer, and fall were plotted by using Eq. 6 and the seasonal S values obtained in step 1. The procedure of calculating the fractional area of saturation A f , threshold values of TWI for a rainfall event in step 3, and the distribution of runoff in the watershed in step 4 remains the same as the distributed CN-VSA method.

3. Results and Discussion

3.1. Application of Distributed CN-VSA Method

The distributed CN–VSA method was applied to the study watershed, and nine representative rainfall events (small, average, and large) out of 45 monitored events were selected for detailed simulation. This included three events each for spring, three for summer, and three for fall seasons. The initial abstraction for each rainfall event was determined using the observed data of accumulated rainfall from the beginning of the rainfall event up to the time when direct runoff started. The effective rainfall Pe for each event was determined by subtracting initial abstraction from the total rainfall depth P. The steps to the simulation of these nine rainfall events are illustrated in Figure 7.
For example, during a spring event on 3 May 2012, 29.70 mm of rainfall P resulted in 27.52 mm of Pe (Table 1). The average S value of 112 mm was determined by fitting Equation (3) to observed event runoff corresponding to event Pe (Figure 7, step 1). The Pe value of 27.52 mm corresponds to A f = 33% of the total watershed area, as shown in step 2 of Figure 7. The A f value of 33% (7.13 ha) as determined in step two corresponded to a threshold λ value of 5.7 using a graph of λ versus Af for the study watershed (Figure 7, step 3), which implies that 33% of the watershed has a λ value larger than 5.7. Therefore, in response to this rain event, watershed areas with threshold values 5.7 or more were saturated. An effective precipitation depth of 27.52 mm that occurred over the saturated area of 7.13 ha resulted in a runoff volume of 1963 m3. Step 4 of Figure 7 shows runoff locations generating areas within the watershed corresponding to the threshold λ value of 5.7.

3.2. Application of the Modified Distributed CN-VSA Method

The simulation of nine rainfall events is shown in Figure 8. The average S value of watershed for spring, summer, and fall was obtained by applying Equation (3) to the rainfall-runoff events according to their seasons by plotting three individual seasonal plots of Pe versus Q resulting in 48 mm, 104 mm, and 184 mm, respectively, as shown in Figure 8, step 1. These average seasonal S values significantly different from the annual average S value of 112 mm.
For example, a spring rainfall event of 3 May 2012 generated 27.52 mm of effective precipitation Pe against a total rainfall of 29.70 mm. From the Pe versus A f for spring (S = 48 mm) with Pe value of 27.52 mm, the corresponding value of A f is 58% (12.54 ha of the watershed area) as shown in Figure 8, step 2. The plot of A f versus λ (Figure 8, step 3) designates the threshold λ value of 4.3 corresponding to the 58% fraction of saturated area, which indicates that 58% of the watershed has a λ value higher than 4.3. As a result, areas in the watershed with λ value of 4.3 or higher were saturated by this rainfall event. The runoff volume of 3451 m3 for this rain event was calculated using the Pe value of 27.52 mm and a saturated area of 12.54 ha.

3.3. Comparison of Runoff Amounts Estimated by Distributed CN–VSA Method and Modified Distributed CN–VSA Method

The runoff comparison with distributed CN-VSA method and the modified CN-VSA method with the observed data for nine rainfall events is presented in Table 1. These results indicate that the modified CN-VSA method simulates runoff much closer to observed runoff than the distributed CN-VSA method. For the spring season for two out of three events, the modified CN-VSA simulates runoff similar to observed runoff. For the third event, the modified CN-VSA overestimated the simulated runoff, which may be due to the use of S’s average seasonal value for individual rainfall event on 28 May 2013. The soil moisture data analysis before the start of this event indicated that the soil moisture conditions were much drier than estimated by seasonal S. The distributed CN-VSA underestimated runoff for all the events and the difference from the observed runoff was greater than the modified CN-VSA method.
During the summer season, the distributed CN-VSA overestimated the runoff amount, which may be because the soil was drier than the assumed average annual potential maximum retention (S) value. The modified distributed CN-VSA also overestimated the runoff amount, but the overestimation for two out of three events is less than 8% (3% and 8%). The use of monthly potential retention could further improve the agreement with the observed results. For the fall season, the distributed CN-VSA and modified distributed CN-VSA methods give similar results, an average variation of the runoff amount by 19% and 22%, respectively. However, it should be noted that mean error values for both methods for fall lie in similar range. Probably this could be due to the fact that the saturation excess runoff that may not be dominated during the fall season.
For two events, both the methods overestimated the runoff amount and underestimated for one event. These results indicate that the modified distributed CN-VSA approach has the better capability to predict runoff amount (coefficient of determination R2 = 0.74 and Nash–Sutcliffe efficiency coefficient E = 0.72) than the distributed CN-VSA approach (R2 = 0.66 and E = 0.62).
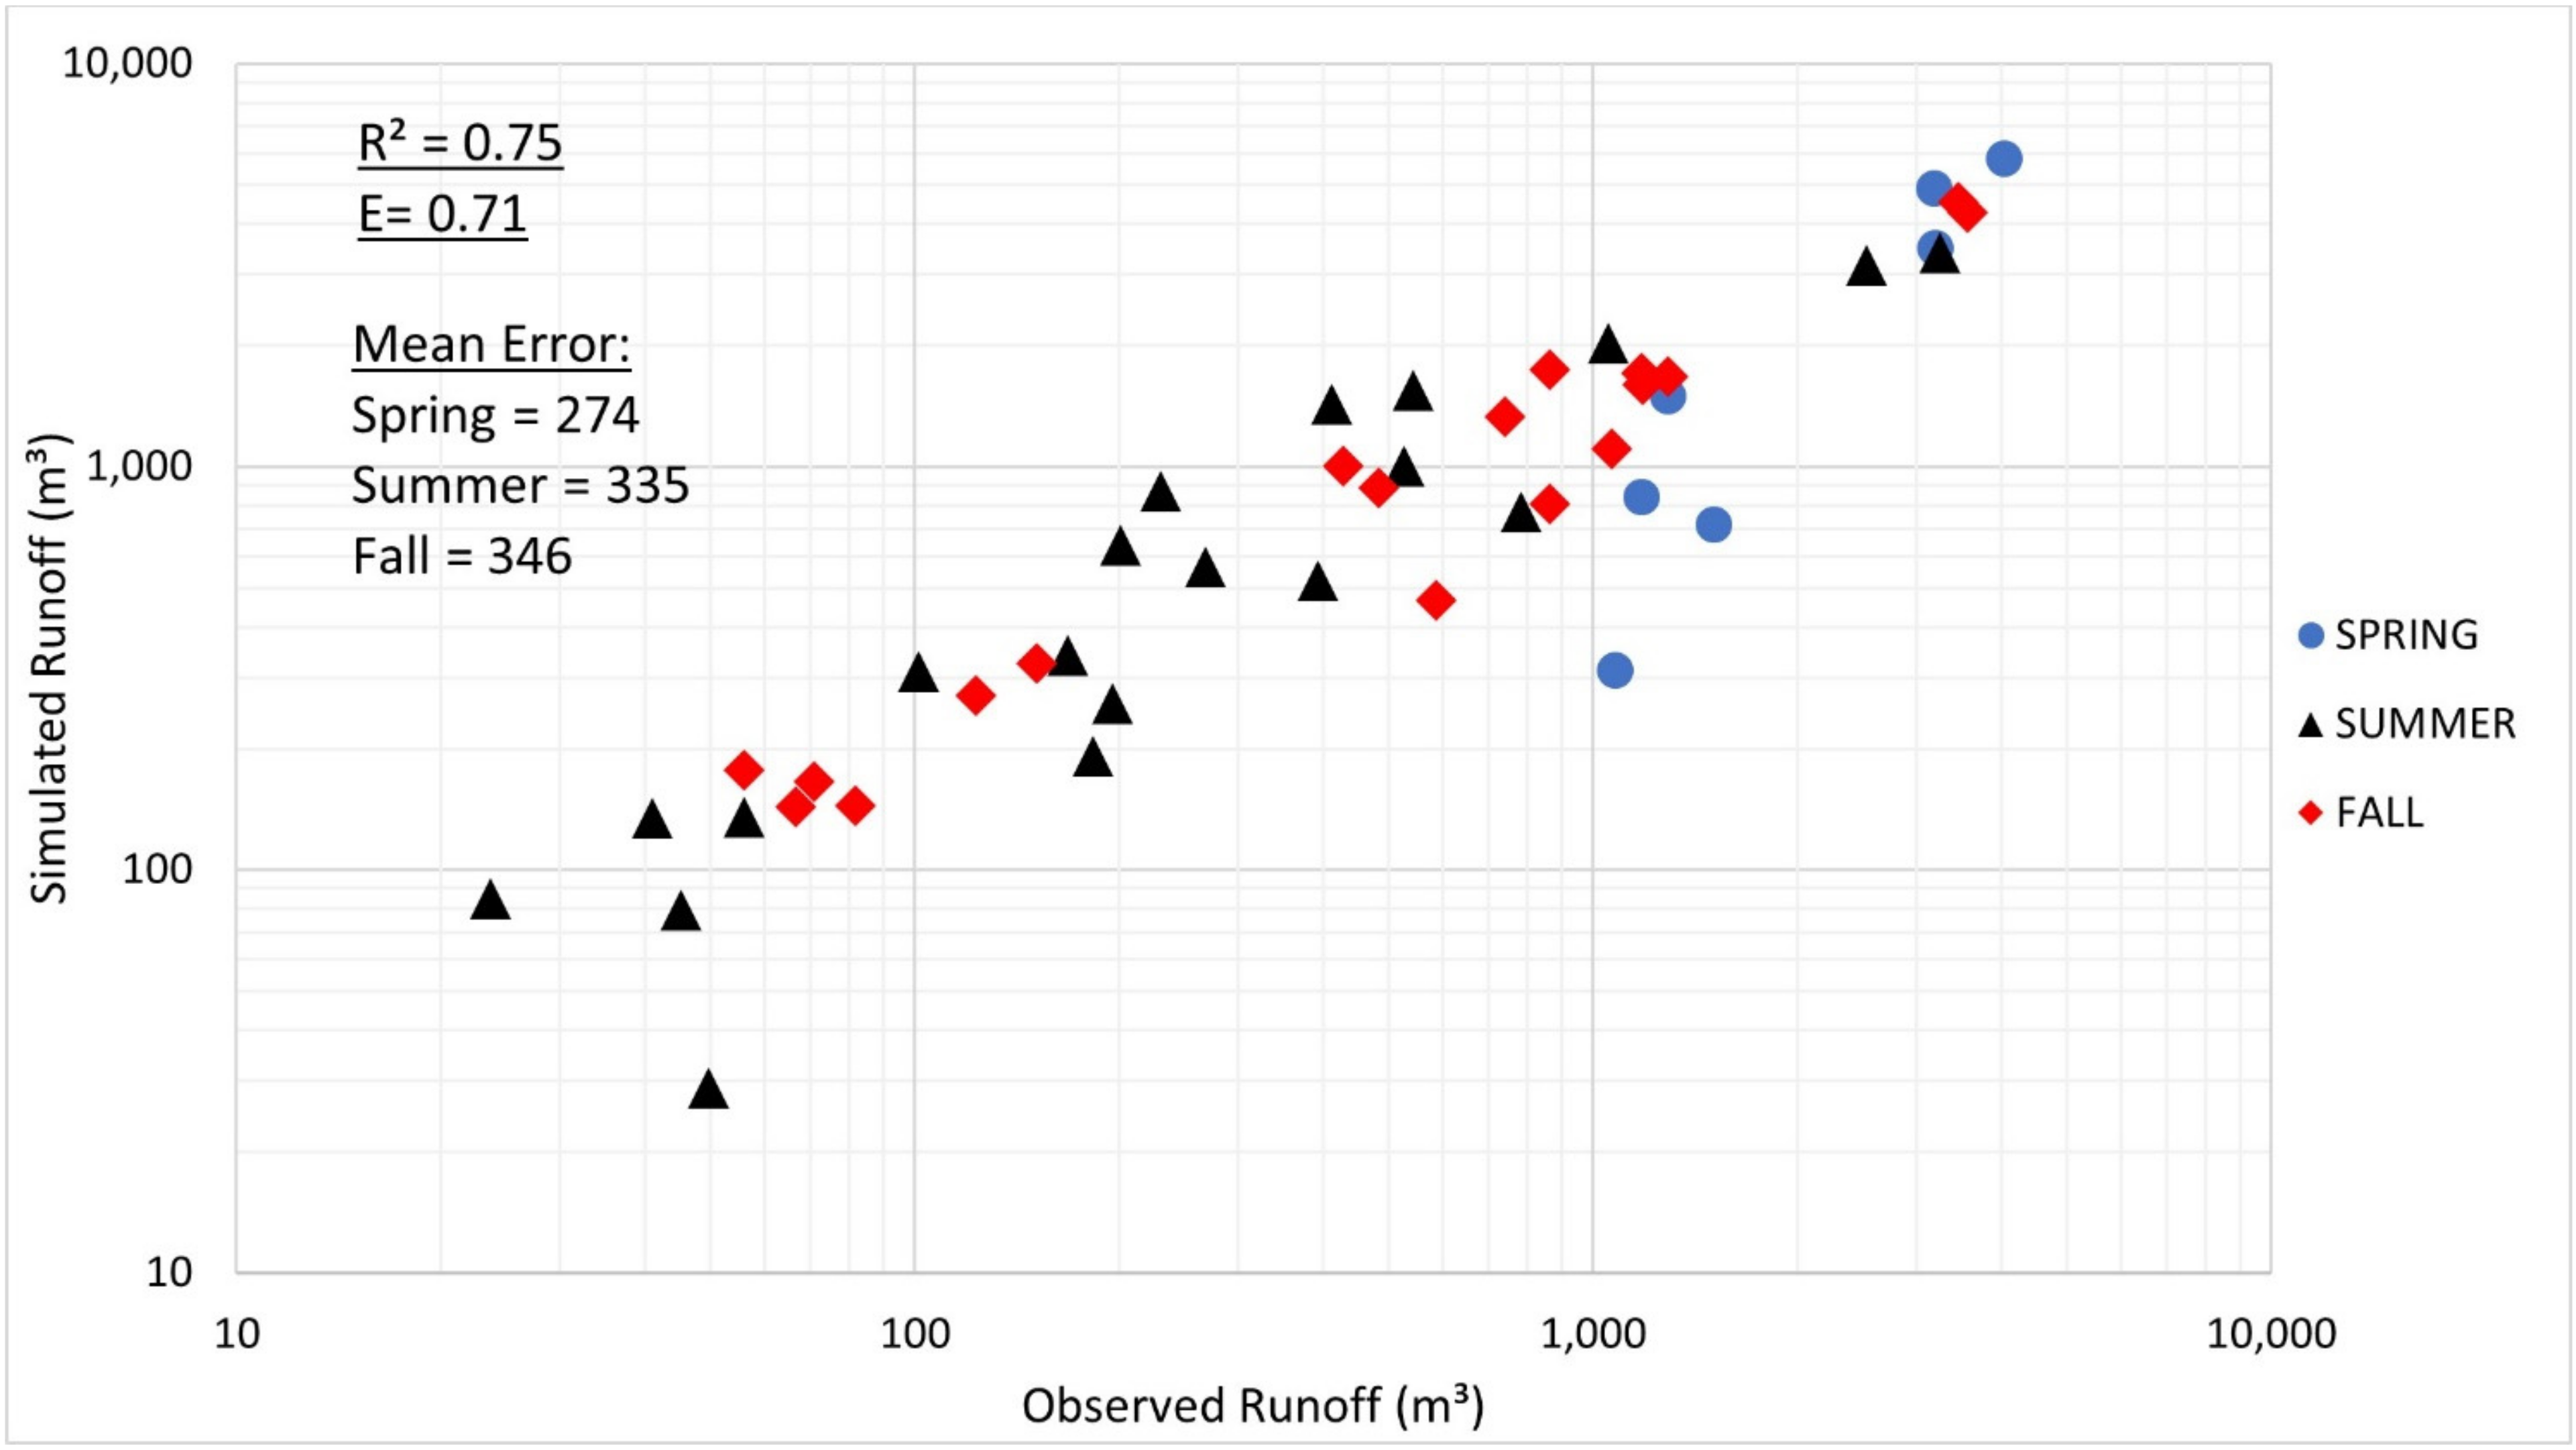
For further analysis, the simulated runoff comparison using distributed CN-VSA method and modified distributed CN-VSA method with all 45 observed runoff events are presented in Figure 9 and Figure 10, respectively.
The results are given in Figure 9 clearly show that the distributed CN-VSA underestimates the runoff amount during the spring period and overestimates during the summer period. This is due to the use of the average annual value of S. Higher estimated annual average value of S would underestimate runoff during spring and overestimate period. For the fall period, the results are mixed with combination of under- and overestimation. The R2 value between the simulated and observed runoff was 0.69 and E is 0.66.
Figure 10 shows the comparison of the runoff simulated by the modified CN-VSA with the observed runoff. The results show a better agreement of simulated runoff with observed runoff, which indicates that the modified distributed CN-VSA method is an improvement over the traditional distributed CN-VSA method. The determination coefficient improved from 0.69 to 0.75 for modified distributed CN-VSA method and improved from 0.66 to 0.71 for modified distributed CN-VSA method. This indicates that the modified distributed CN-VSA method is an improvement over the traditional distributed CN-VSA method.

3.4. Spatial Distribution of Runoff

To further evaluate these methods’ performance, the percentage of the area generating runoff at the watershed outlet, and the spatial distribution of runoff-generating areas by both methods were estimated (results are presented in Figure 11, Figure 12 and Figure 13). Both the methods use a similar approach to distribute the runoff-generating areas using the TWI concept spatially. It is assumed the areas with TWI greater than or equal to threshold λ value are saturated and generate the runoff and that the areas below this threshold λ are infiltrating.
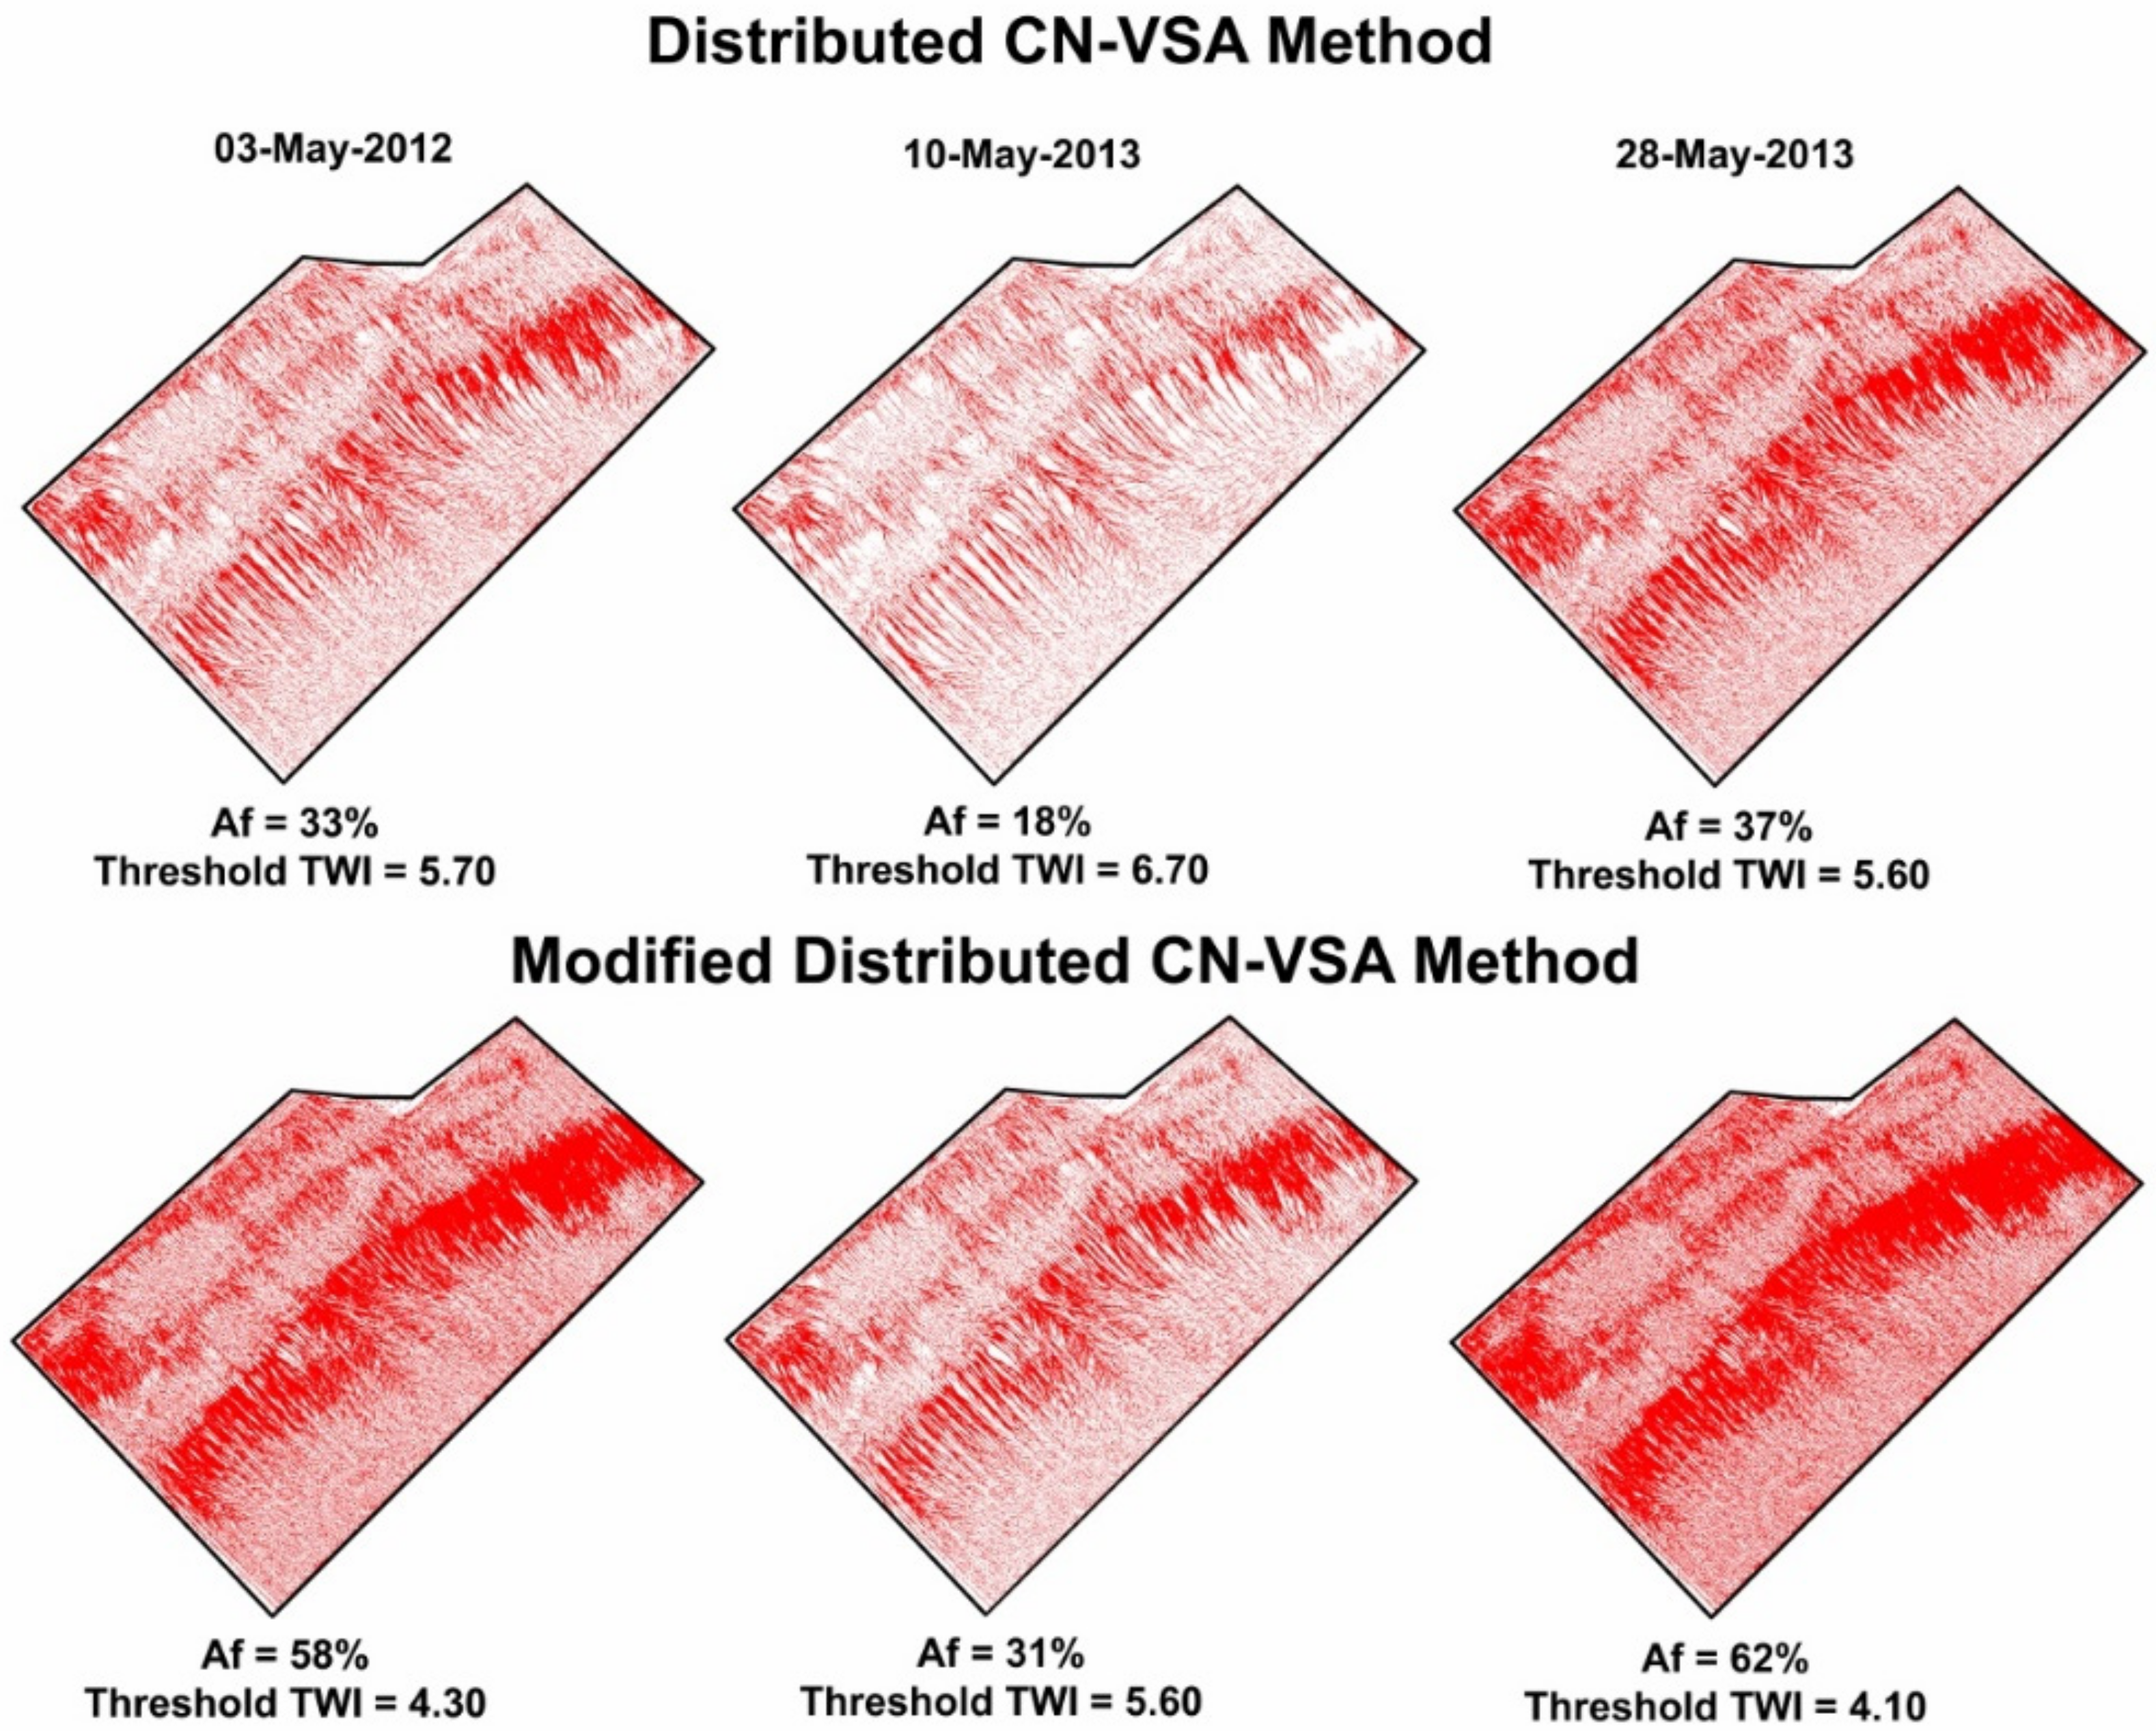
Analysis of the results for these spring rainfall events indicates that for the three spring rainfall events, the average area generating runoff estimated by the distributed CN–VSA method and modified distributed CN-VSA method were 29% (18–37%) and 50% (31 to 62%) respectively. The runoff generating area estimated by modified distributed CN-VSA looks more realistic because in Ontario, more area generates runoff due to wet soils close to saturation during late winter and early spring season. Figure 11 displays the comparison of aerial distribution and locations of runoff-generating areas for the three spring rainfall events simulated by distributed CN–VSA method and the modified distributed CN–VSA method, respectively.
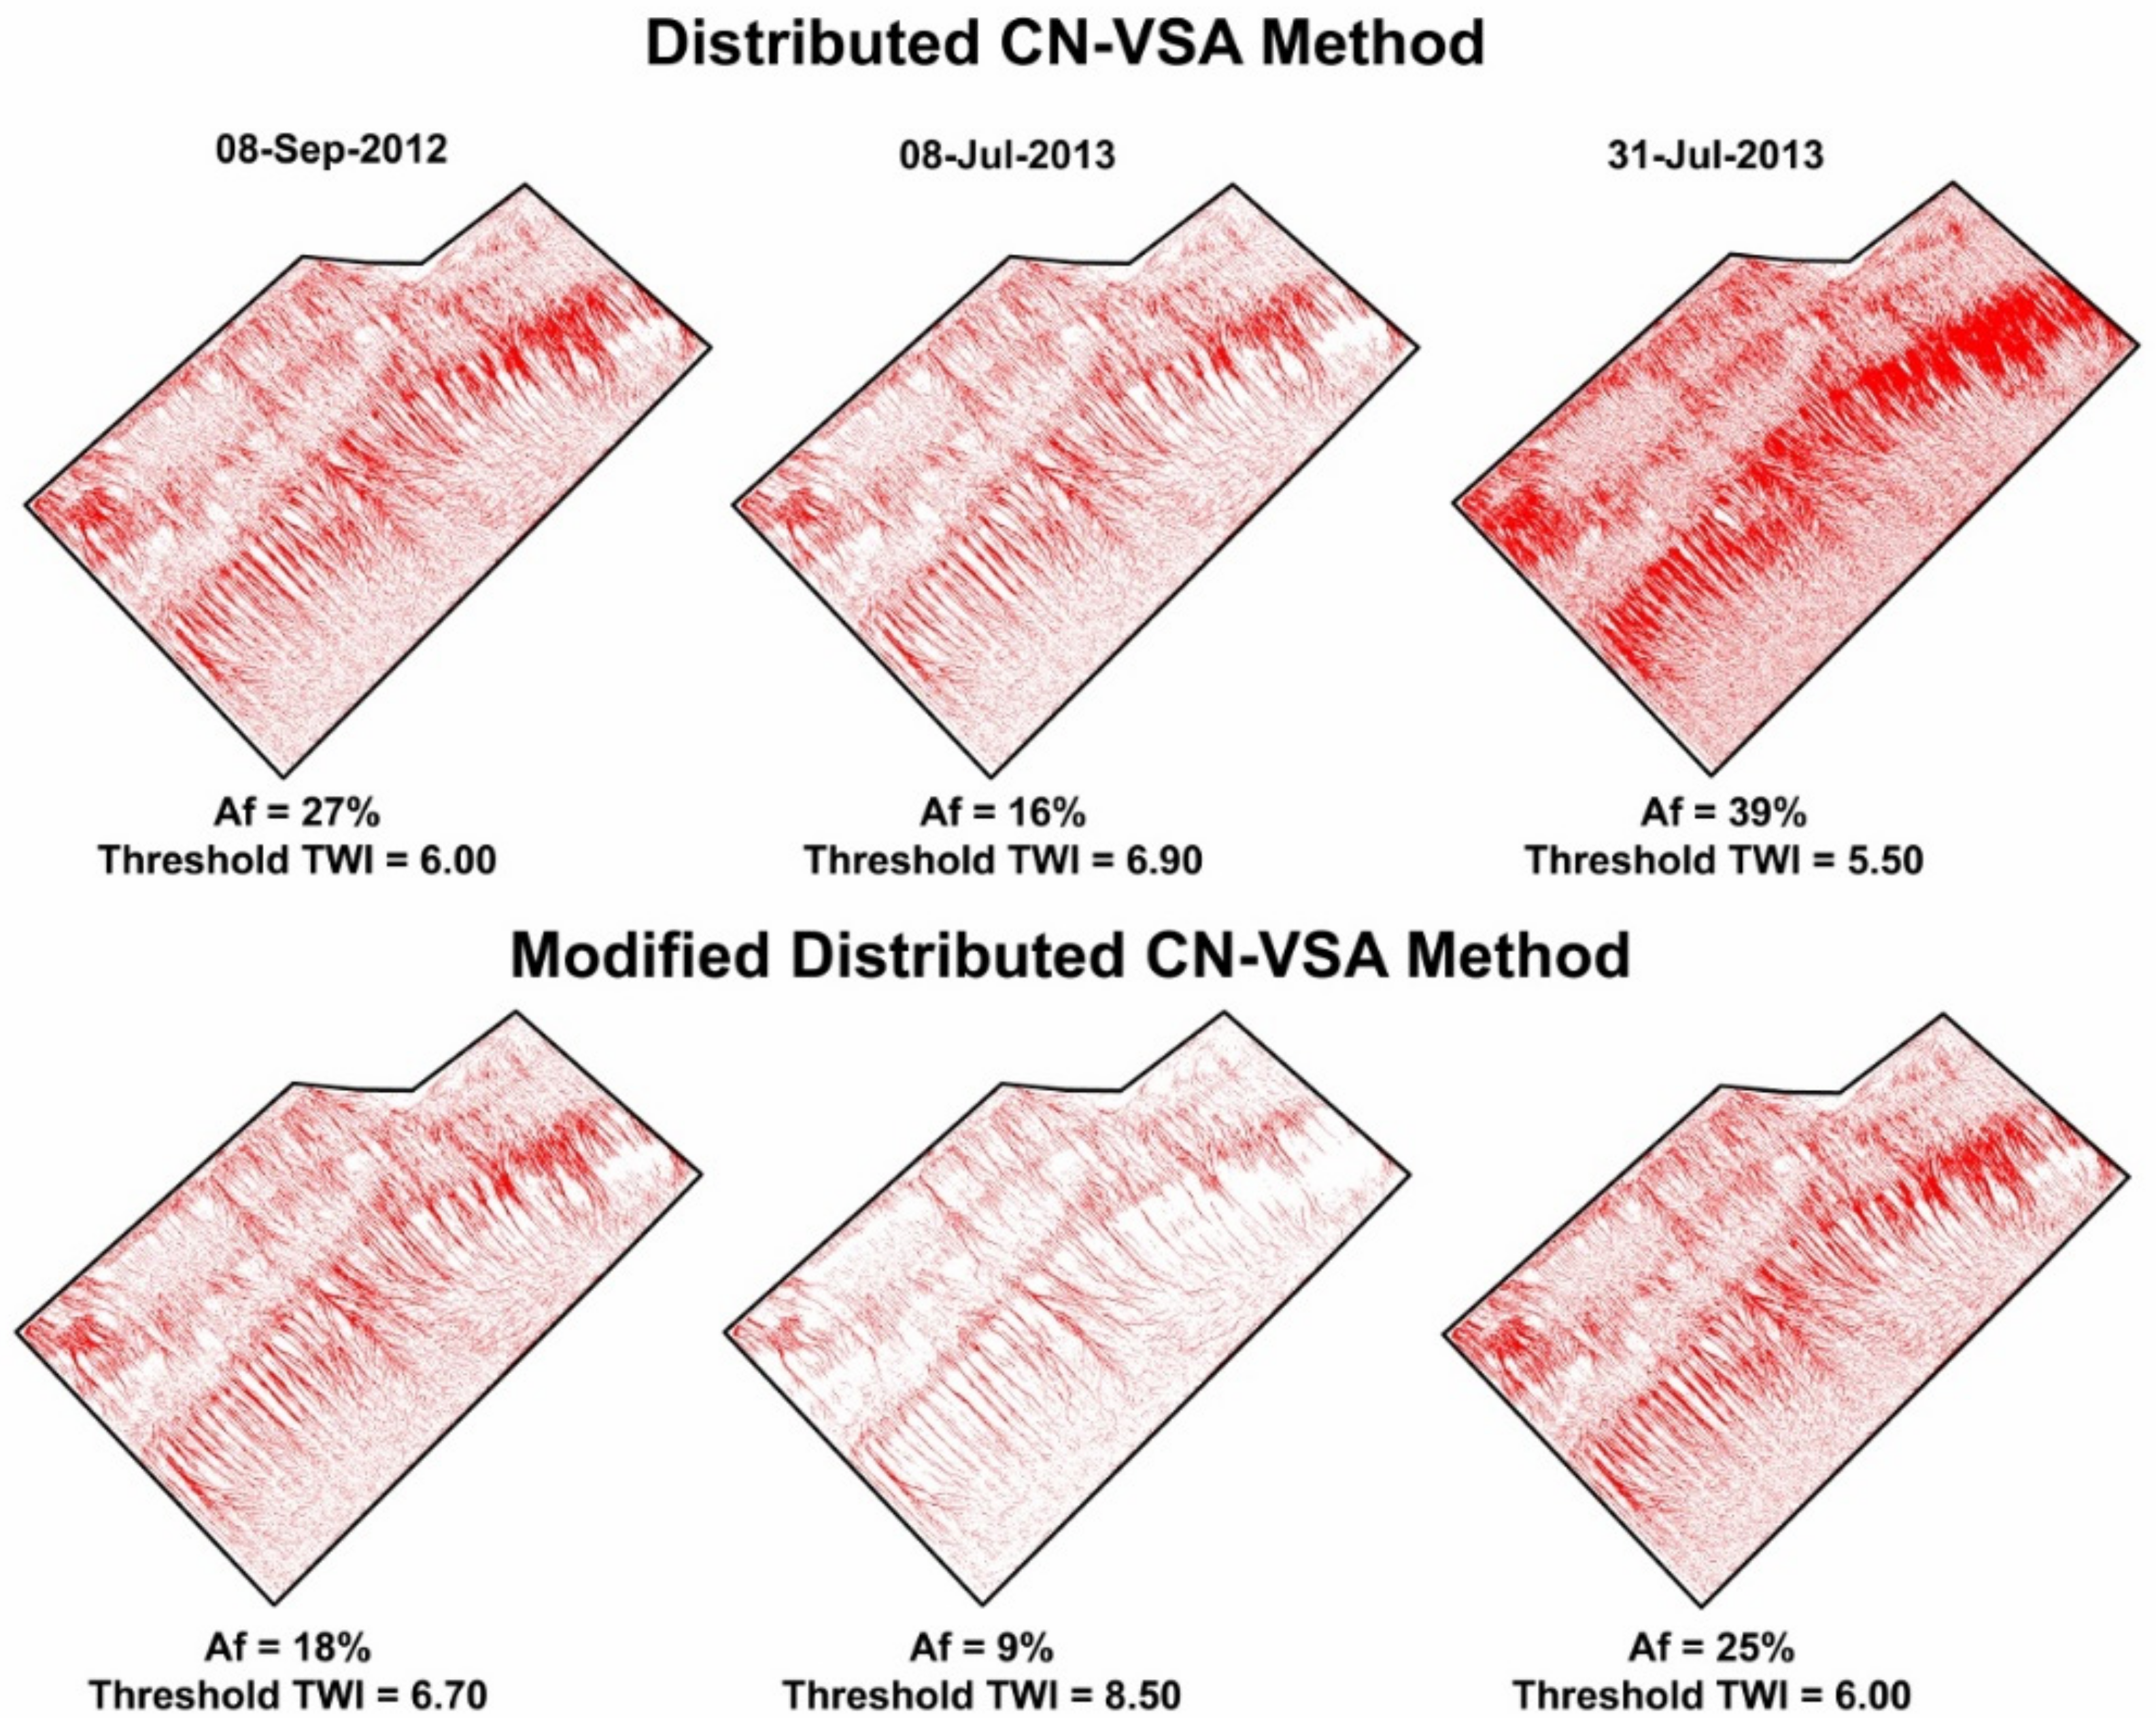
For the summer season, the average area generating runoff by distributed CN-VSA method was 27% (16 to 39%) and by modified distributed CN-VSA was 17% (9 to 25%). Similarly, Figure 12 displays the aerial distribution of and the locations of runoff-generating areas for the three summer rainfall events simulated by distributed CN–VSA method and the modified distributed CN–VSA method.
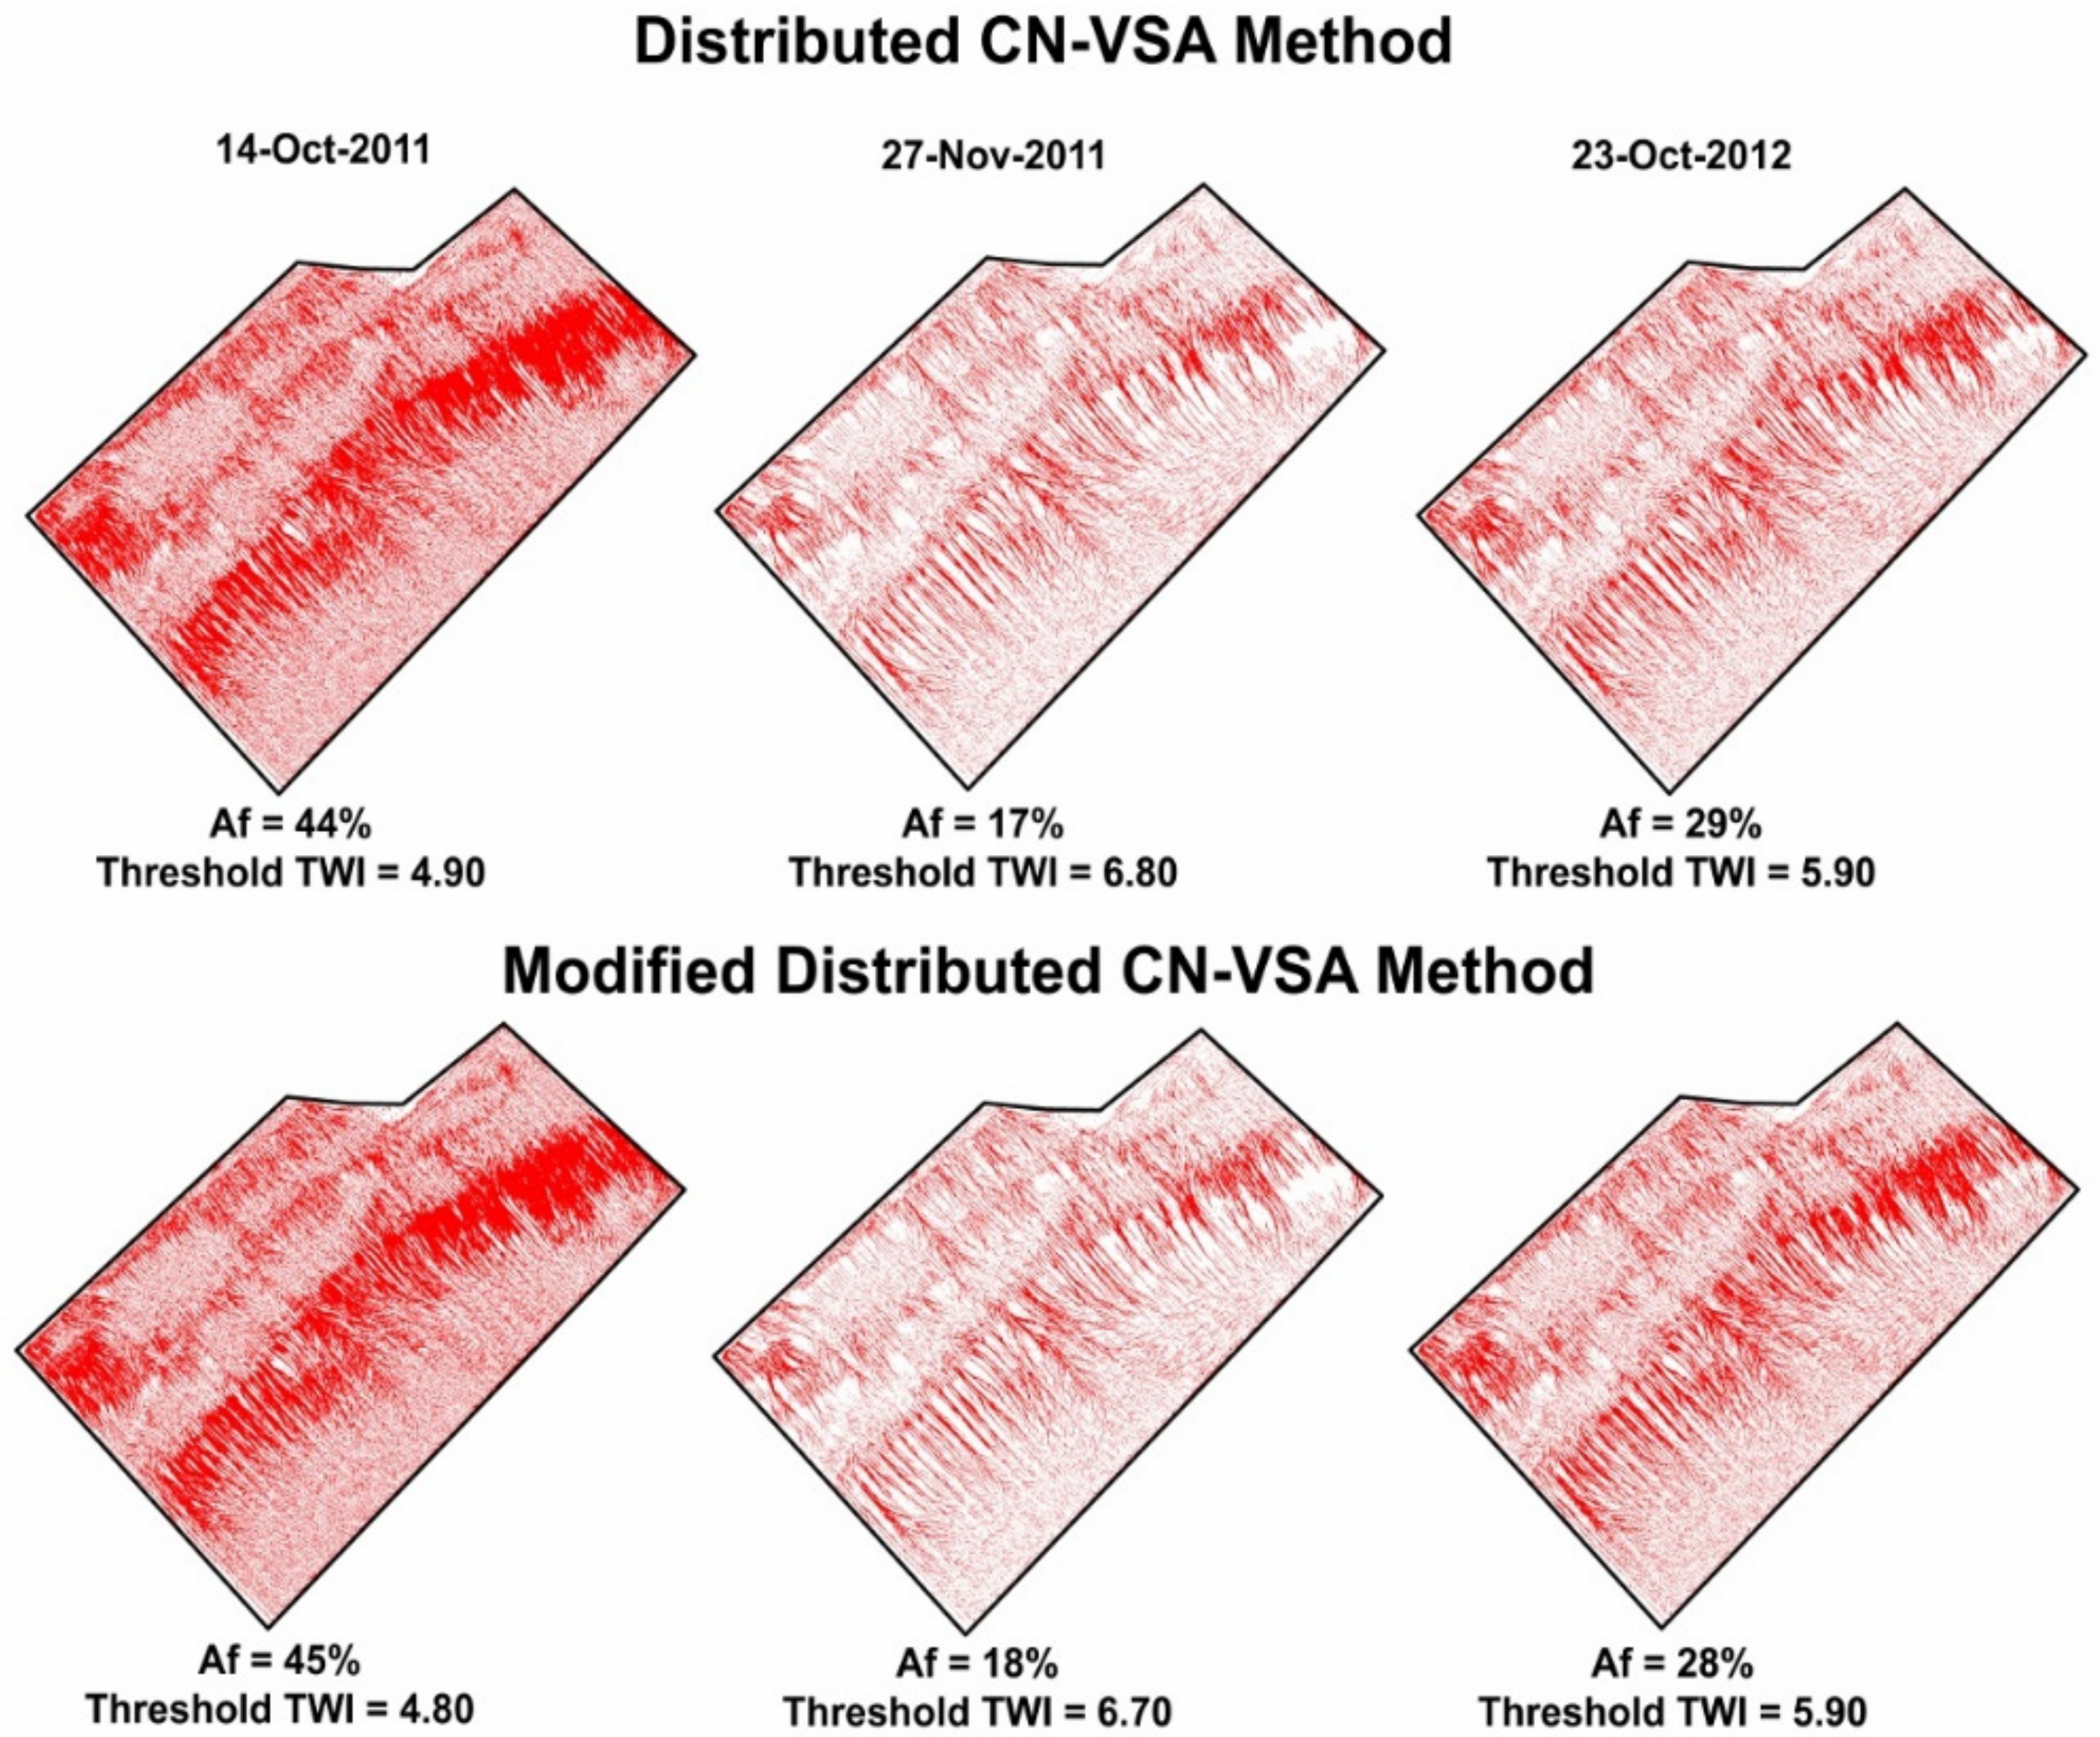
For the fall season, both the distributed CN-VSA method and modified distributed CN-VSA method estimated 30% of the watershed area was generating the runoff (Figure 13). The range of area generating runoff and the areal distribution of runoff for the distributed CN-VSA method (17 to 44%) and modified distributed CN-VSA method (18 to 45%) was also similar.

4. Conclusions

This study presents a modified distributed CN-VSA method that is an improvement of the distributed CN-VSA method commonly used in watershed models to predict runoff amount for watersheds where saturation excess is a dominant runoff generating process. This study is one of the pioneering field-validated research that shows why the modified distributed CN-VSA method is a significant improvement over the traditional distributed CN-VSA approach to estimate runoff amount. The new approach is potentially more accurate for mapping of the runoff generating area, mainly due to the added consideration for the significant seasonal variations of the VSAs. Further, the new modified distributed CN–VSA method can be potentially be easily integrated with existing hydrological models to predict runoff volumes and correctly map runoff-generating areas in watersheds where runoff is generated by saturation excess processes.
The suggested novel approach of using seasonally variable potential maximum retention ‘S’ values, instead of constant annual value, would improve the calculation of direct runoff amount and identify contributing areas in the watersheds. The spatial distribution of potential runoff-generating areas would help implement agricultural BMPs in addressing high sediment and nutrient pollution issue from non-point-sources. It is also recommended to validate the new approach in diverse watersheds with a wide range of sizes, topography, soils, land use, and climatic conditions.

Author Contributions

Conceptualization: K.P., R.R., P.G., and B.G.; data curation: K.P.; formal analysis: K.P. and S.A.; funding acquisition: R.R., P.G. and B.G.; investigation: K.P.; methodology: K.P., R.R., P.G., S.A., and B.G.; supervision: R.R., P.G., and B.G.; writing (initial draft): K.P., R.R., P.G., and B.G.; writing (review and editing): K.P., R.R., P.G., S.A., and B.G. All authors have read and agreed to the published version of the manuscript.

Funding

This research was funded by the Ontario Ministry of the Environment, Conservation and Parks, and by the Ontario Ministry of Agriculture, Food and Rural Affairs.

Data Availability Statement

Conflicts of Interest

The authors declare no conflict of interest.

References

  1. Dunne, T. Field studies of hillslope flow processes. Hillslope Hydrol. 1978, 227–293. [Google Scholar]
  2. Qiu, Z. Variable Source Pollution: Turning science into action to manage and protect critical source areas in landscapes. J. Soil Water Conserv. 2010, 65, 137A–141A. [Google Scholar] [CrossRef]
  3. Ward, R.C. On the response to precipitation of headwater streams in humid areas. J. Hydrol. 1984, 74, 171–189. [Google Scholar] [CrossRef] [Green Version]
  4. Cheng, X.; Shaw, S.B.; Marjerison, R.D.; Yearick, C.D.; Degloria, S.D.; Walter, M.T. Improving risk estimates of runoff producing areas: Formulating variable source areas as a bivariate process. J. Environ. Manag. 2014, 137, 146–156. [Google Scholar] [CrossRef] [Green Version]
  5. DeLay, E.; Gharabaghi, B. A review of low-grade weirs as an agri-environmental best management practice in the Elginfield Municipal Drain watershed, Ontario, Canada. J. Soil Water Conserv. 2018, 73, 42A–48A. [Google Scholar] [CrossRef] [Green Version]
  6. Niraula, R.; Kalin, L.; Srivastava, P.; Anderson, C.J. Identifying critical source areas of nonpoint source pollution with SWAT and GWLF. Ecol. Model. 2013, 268, 123–133. [Google Scholar] [CrossRef]
  7. Amanjot, S.; Rudra, R.P.; Ahmed, S.I.; Das, S.; Gharabaghi, B. Application of CANWET and HSPF for TMDL evaluation under Southern Ontario conditions. In Proceedings of the Watershed Management to Meet Water Quality Standards and TMDLS (Total Maximum Daily Load), San Antonio, TX, USA, 10–14 March 2007; American Society of Agricultural and Biological Engineers: St. Joseph, MI, USA, 2007; p. 35. [Google Scholar]
  8. Singh, A.; Rudra, R.P.; Gharabaghi, B. Evaluation of CANWET model for hydrologic simulations for upper Cana-gagigue Creek watershed in southern Ontario. Can. Biosyst. Eng. 2012, 54, 1.7–1.18. [Google Scholar] [CrossRef]
  9. Thompson, J.; Cassidy, R.; Doody, D.G.; Flynn, R. Predicting critical source areas of sediment in headwater catchments. Agric. Ecosyst. Environ. 2013, 179, 41–52. [Google Scholar] [CrossRef]
  10. Fiori, A.; Romanelli, M.; Cavalli, D.; Russo, D. Numerical experiments of streamflow generation in steep catchments. J. Hydrol. 2007, 339, 183–192. [Google Scholar] [CrossRef]
  11. Gevaert, A.I.; Teuling, A.J.; Uijlenhoet, R.; Delong, S.B.; Huxman, T.; Pangle, L.; Breshears, D.D.; Chorover, J.; Pelletier, J.D.; Saleska, S.R.; et al. Hillslope-scale experiment demonstrates the role of convergence during two-step saturation. Hydrol. Earth Syst. Sci. 2014, 18, 3681–3692. [Google Scholar] [CrossRef] [Green Version]
  12. Smith, R.E.; Goodrich, D.C. Rainfall Excess Overland Flow. In Encyclopedia of Hydrological Sciences; Wiley: Hoboken, NJ, USA, 2006. [Google Scholar]
  13. Clark, J.; Dunne, T.; Leopold, L.B. Water in Environmental Planning; Macmillan: Basingstoke, UK, 1978. [Google Scholar]
  14. Horton, R.E. The Role of infiltration in the hydrologic cycle. Trans. Am. Geophys. Union 1933, 14, 446–460. [Google Scholar] [CrossRef]
  15. Ahmed, S.I.; Rudra, R.P.; Gharabaghi, B.; MacKenzie, K.; Dickinson, W.T. Within-Storm Rainfall Distribution Effect on Soil Erosion Rate. Int. Sch. Res. Not. 2012, 2012, 1–7. [Google Scholar] [CrossRef] [Green Version]
  16. Frankenberger, J.R.; Brooks, E.S.; Walter, M.T.; Steenhuis, T.S. A GIS-based variable source area hydrology model. Hydrol. Process. 1999, 13, 805–822. [Google Scholar] [CrossRef]
  17. Todd, W.M.; Walter, M.F.; Brooks, E.S.; Steenhuis, T.S.; Boll, J.; Weiler, K. Hydrologically sensitive areas: Variable source area hydrology implications for water quality risk assessment. J. Soil Water Conserv. 2000, 55, 277–284. [Google Scholar]
  18. Das, S.; Rudra, R.; Goel, P.; Gharabaghi, B.; Gupta, N. Evaluation of AnnAGNPS in cold and temperate regions. Water Sci. Technol. 2006, 53, 263–270. [Google Scholar] [CrossRef] [PubMed]
  19. Chapi, K.; Rudra, R.P.; Ahmed, S.I.; Khan, A.A.; Gharabaghi, B.; Dickinson, W.T.; Goel, P.K. Spatial-Temporal Dynamics of Runoff Generation Areas in a Small Agricultural Watershed in Southern Ontario. J. Water Resour. Prot. 2015, 7, 14–40. [Google Scholar] [CrossRef] [Green Version]
  20. Amerman, C.R. The use of unit-Source watershed data for runoff prediction. Water Resour. Res. 1965, 1, 499–507. [Google Scholar] [CrossRef]
  21. Beven, K.J.; Kirkby, M.J. A physically based, variable contributing area model of basin hydrology/Un modèle à base physique de zone d’appel variable de l’hydrologie du bassin versant. Hydrol. Sci. Bull. 1979, 24, 43–69. [Google Scholar] [CrossRef] [Green Version]
  22. Wigmosta, S.M.; Vail, L.W.; Lettenmaier, D.P. A distributed hydrology-vegetation model for complex terrain. Water Resour. Res. 1994, 30, 1665–1679. [Google Scholar] [CrossRef]
  23. Steenhuis, T.; Van Der Molen, W. The Thornthwaite-Mather procedure as a simple engineering method to predict recharge. J. Hydrol. 1986, 84, 221–229. [Google Scholar] [CrossRef]
  24. Zollweg, J.A.; Gburek, W.J.; Steenhuis, T.S. SMoRMod—A GIS-integrated Rainfall-runoff Model. Trans. ASAE 1996, 39, 1299–1307. [Google Scholar] [CrossRef]
  25. Pradhan, N.R.; Ogden, F.L. Development of a one-parameter variable source area runoff model for ungauged basins. Adv. Water Resour. 2010, 33, 572–584. [Google Scholar] [CrossRef]
  26. Easton, Z.M.; Fuka, D.R.; Walter, M.T.; Cowan, D.M.; Schneiderman, E.M.; Steenhuis, T.S. Re-conceptualizing the soil and water assessment tool (SWAT) model to predict runoff from variable source areas. J. Hydrol. 2008, 348, 279–291. [Google Scholar] [CrossRef]
  27. Schneiderman, M.E.; Steenhuis, T.S.; Thongs, D.J.; Easton, Z.M.; Zion, M.S.; Neal, A.L.; Mendoza, G.F.; Walter, M.T. Incorporating variable source area hydrology into a curve-number-based watershed model. Hydrol. Process. Int. J. 2007, 21, 3420–3430. [Google Scholar] [CrossRef]
  28. Liu, Y.; Yang, W.; Yu, Z.; Lung, I.; Gharabaghi, B. Estimating Sediment Yield from Upland and Channel Erosion at A Watershed Scale Using SWAT. Water Resour. Manag. 2015, 29, 1399–1412. [Google Scholar] [CrossRef] [Green Version]
  29. Gupta, A.; Rudra, R.; Gharabahi, B.; Daggupati, P.; Goel, P.; Shukla, R. Predicting the Impact of Drainage Ditches upon Hydrology and Sediment Loads Using KINEROS 2 Model: A Case Study in Ontario. Can. Biosyst. Eng. 2018, 60, 1.1–1.15. [Google Scholar] [CrossRef]
  30. Gupta, A.K.; Rudra, R.P.; Gharabaghi, B.; Goel, P.K.; Sebti, S.; Shukla, R.; Daggupati, P. A Modeling Approach for Evaluating Watershed-scale Water Quality Benefits of Vegetative Filter Strip—A Case Study in Ontario. Appl. Eng. Agric. 2019, 35, 271–281. [Google Scholar] [CrossRef]
  31. Jason, M. Testing a Method for Predicting Variable Source Areas of Runoff Generation. Master’s Thesis, Cornell University, Ithaca, NY, USA, 2008. [Google Scholar]
  32. Collick, A.S.; Fuka, D.R.; Kleinman, P.J.A.; Buda, A.R.; Weld, J.L.; White, M.J.; Veith, T.L.; Bryant, R.B.; Bolster, C.H.; Easton, Z.M. Predicting phosphorus dynamics in complex terrains using a variable source area hydrology model. Hydrol. Process. 2015, 29, 588–601. [Google Scholar] [CrossRef] [Green Version]
  33. Mishra, S.K.; Singh, V.P. Soil Conservation Service Curve Number (SCS-CN) Methodology; Springer Science & Business Media: Berlin, Germany, 2003; Volume 42. [Google Scholar]
  34. Mishra, S.K.; Singh, V.P. Long-term hydrological simulation based on the Soil Conservation Service curve number. Hydrol. Process. 2004, 18, 1291–1313. [Google Scholar] [CrossRef]
  35. Mishra, S.K.; Jain, M.K.; Bhunya, P.K.; Singh, V.P. Field Applicability of the SCS-CN-Based Mishra?Singh General Model and its Variants. Water Resour. Manag. 2005, 19, 37–62. [Google Scholar] [CrossRef]
  36. Ponce, V.M.; Hawkins, R.H. Runoff Curve Number: Has It Reached Maturity? J. Hydrol. Eng. 1996, 1, 11–19. [Google Scholar] [CrossRef]
  37. Soulis, K.X.; Valiantzas, J.D.; Dercas, N.; Londra, P.A. Analysis of the runoff generation mechanism for the investigation of the SCS-CN method applicability to a partial area experimental watershed. Hydrol. Earth Syst. Sci. Discuss. 2009, 6, 1. [Google Scholar]
  38. Qiu, Z.; Walter, M.T.; Hall, C. Managing variable source pollution in agricultural watersheds. J. Soil Water Conserv. 2007, 62, 115–122. [Google Scholar]
  39. Steenhuis, S.T.; Winchell, M.; Rossing, J.; Zollweg, J.A.; Walter, M.F. SCS runoff equation revisited for variable-source runoff areas. J. Irrig. Drain. Eng. 1995, 121, 234–238. [Google Scholar] [CrossRef]
  40. Lyon, S.W.; Walter, M.T.; Gérard-Marchant, P.; Steenhuis, T.S. Using a topographic index to distribute variable source area runoff predicted with the SCS curve-number equation. Hydrol. Process. 2004, 18, 2757–2771. [Google Scholar] [CrossRef]
  41. Soulis, K.X.; Valiantzas, J.D. SCS-CN parameter determination using rainfall-runoff data in heterogeneous water-sheds—The two-CN system approach. Hydrol. Earth Syst. Sci. 2012, 16, 1001–1015. [Google Scholar] [CrossRef] [Green Version]
  42. Wall, G.J. Temporal pattern of erosion and fluvial sedimentation in the Great Lakes Basin. Geosci. Can. 1976, 3, 158–163. [Google Scholar]
  43. Detty, J.M.; McGuire, K.J. Topographic controls on shallow groundwater dynamics: Implications of hydrologic connectivity between hillslopes and riparian zones in a till mantled catchment. Hydrol. Process. 2010, 24, 2222–2236. [Google Scholar] [CrossRef]
  44. Hewlett, D.J.; Hibbert, A.R. Factors affecting the response of small watersheds to precipitation in humid areas. For. Hydrol. 1967, 1, 275–290. [Google Scholar]
  45. Anderson, M.G.; Kneale, P.E. The influence of low-angled topography on hillslope soil-water convergence and stream discharge. J. Hydrol. 1982, 57, 65–80. [Google Scholar] [CrossRef]
  46. O’Loughlin, E.M. Prediction of Surface Saturation Zones in Natural Catchments by Topographic Analysis. Water Resour. Res. 1986, 22, 794–804. [Google Scholar] [CrossRef]
  47. Rodríguez-Iturbe, I.; Valdés, J.B. The geomorphologic structure of hydrologic response. Water Resour. Res. 1979, 15, 1409–1420. [Google Scholar] [CrossRef] [Green Version]
  48. Xue, L.; Bao, R.; Meixner, T.; Yang, G.; Zhang, J. Influences of topographic index distribution on hydrologically sensitive areas in agricultural watershed. Stoch. Environ. Res. Risk Assess. 2014, 28, 2235–2242. [Google Scholar] [CrossRef]
  49. Hassan, Q.K.; Bourque, C.P.-A.; Meng, F.-R.; Cox, R.M. A Wetness Index Using Terrain-Corrected Surface Temperature and Normalized Difference Vegetation Index Derived from Standard MODIS Products: An Evaluation of Its Use in a Humid Forest-Dominated Region of Eastern Canada. Sensors 2007, 7, 2028–2048. [Google Scholar] [CrossRef] [PubMed] [Green Version]
  50. Moore, D.I.; Gessler, P.E.; Nielsen, G.A.E.; Peterson, G.A. Soil attribute prediction using terrain analysis. Soil Sci. Soc. Am. J. 1993, 57, 443–452. [Google Scholar] [CrossRef]
  51. Western, A.W.; Grayson, R.B.; Blöschl, G.; Willgoose, G.R.; McMahon, T.A. Observed spatial organization of soil moisture and its relation to terrain indices. Water Resour. Res. 1999, 35, 797–810. [Google Scholar] [CrossRef] [Green Version]
  52. Yong, B.; Ren, L.-L.; Hong, Y.; Gourley, J.J.; Chen, X.; Zhang, Y.-J.; Yang, X.-L.; Zhang, Z.-X.; Wang, W.-G. A novel multiple flow direction algorithm for computing the topographic wetness index. Hydrol. Res. 2012, 43, 135–145. [Google Scholar] [CrossRef]
  53. Hawkins, H.R.; Ward, T.J.; Woodward, D.E.; van Mullem, J.A. (Eds.) Curve Number Hydrology: State of the Practice; American Society of Civil Engineers: Reston, VA, USA, 2008. [Google Scholar]
  54. USDA; SCSCN. Soil Conservation Service National Engineering Handbook; United States Department of Agriculture: Washington, DC, USA, 1972.
  55. Mockus, V. Estimation of total (and peak rates of) surface runoff for individual storms. Exhibit A in Appendix B. In Terims Survey Report (Neosho) River Watershed; USDA: Washington, DC, USA, 1949. [Google Scholar]
  56. Boughton, W.; Stone, J. Variation of runoff with watershed area in a semi-arid location. J. Arid. Environ. 1985, 9, 13–25. [Google Scholar] [CrossRef]
  57. Shaw, S.B.; Walter, M.T. Improving runoff risk estimates: Formulating runoff as a bivariate process using the SCS curve number method. Water Resour. Res. 2009, 45, wr006900. [Google Scholar] [CrossRef] [Green Version]
  58. Ling, L.; Yusop, Z. A micro focus with macro impact: Exploration of initial abstraction coefficient ratio (λ) in Soil Conservation Curve Number (CN) methodology. IOP Conf. Ser. Earth Environ. Sci. 2014, 18, 012121. [Google Scholar] [CrossRef]
  59. Grabs, T.; Seibert, J.; Bishop, K.; Laudon, H. Modeling spatial patterns of saturated areas: A comparison of the topographic wetness index and a dynamic distributed model. J. Hydrol. 2009, 373, 15–23. [Google Scholar] [CrossRef] [Green Version]
  60. Mukherjee, S.; Mukherjee, S.; Garg, R.; Bhardwaj, A.; Raju, P.L.N. Evaluation of topographic index in relation to terrain roughness and DEM grid spacing. J. Earth Syst. Sci. 2013, 122, 869–886. [Google Scholar] [CrossRef] [Green Version]
  61. Qin, C.-Z.; Zhu, A.-X.; Pei, T.; Li, B.-L.; Scholten, T.; Behrens, T.; Zhou, C.-H. An approach to computing topographic wetness index based on maximum downslope gradient. Precis. Agric. 2011, 12, 32–43. [Google Scholar] [CrossRef]
  62. Sörensen, R.; Zinko, U.; Seibert, J. On the calculation of the topographic wetness index: Evaluation of different methods based on field observations. Hydrol. Earth Syst. Sci. 2006, 10, 101–112. [Google Scholar] [CrossRef] [Green Version]
  63. Kirkby, J.M.; Weyman, D.R. Measurements of Contributing Area in Very Small Drainage Basins; University of Bristol, Department of Geography: Bristol, UK, 1971. [Google Scholar]
  64. Barling, R.D.; Grayson, R.B.; Moore, I.D. A quasi-dynamic wetness index for characterizing the spatial distribution of zones of surface saturation and soil water content. Water Resour. Res. 1994, 30, 1029–1044. [Google Scholar] [CrossRef]
  65. Hjerdt, K.N.; McDonnell, J.J.; Seibert, J.; Rodhe, A. A new topographic index to quantify downslope controls on local drainage. Water Resour. Res. 2004, 40, wr003130. [Google Scholar] [CrossRef] [Green Version]
  66. Florinsky, I.V. Digital Terrain Analysis in Soil Science and Geology; Academic Press: Amsterdam, The Netherlands, 2012; 379p. [Google Scholar]
  67. Quinn, P.F.; Beven, K.J.; Lamb, R. The in(a/tan/β) index: How to calculate it and how to use it within the topmodel framework. Hydrol. Process. 1995, 9, 161–182. [Google Scholar] [CrossRef]
  68. Alberto, P. GIS Based Chemical Fate Modeling: Principles and Applications; John Wiley & Sons: Hoboken, NJ, USA, 2014. [Google Scholar]
  69. Buchanan, B.; Easton, Z.M.; Schneider, R.; Walter, M.T. Incorporating Variable Source Area Hydrology into a Spatially Distributed Direct Runoff Model 1. JAWRA J. Am. Water Resour. Assoc. 2012, 48, 43–60. [Google Scholar] [CrossRef]
  70. Wolock, D.M.; McCabe, G.J. Comparison of Single and Multiple Flow Direction Algorithms for Computing Topographic Parameters in TOPMODEL. Water Resour. Res. 1995, 31, 1315–1324. [Google Scholar] [CrossRef]
  71. Kishorkumar, P. Mapping and Modeling of Variable Source Areas in a Small Agricultural Watershed. Ph.D. Thesis, University of Guelph, Guelph, ON, Canada, 2015. [Google Scholar]
  72. Lindsay, J. Whitebox Geospatial Analysis Tools; The University of Guelph: Guelph, ON, Canada, 2009. [Google Scholar]
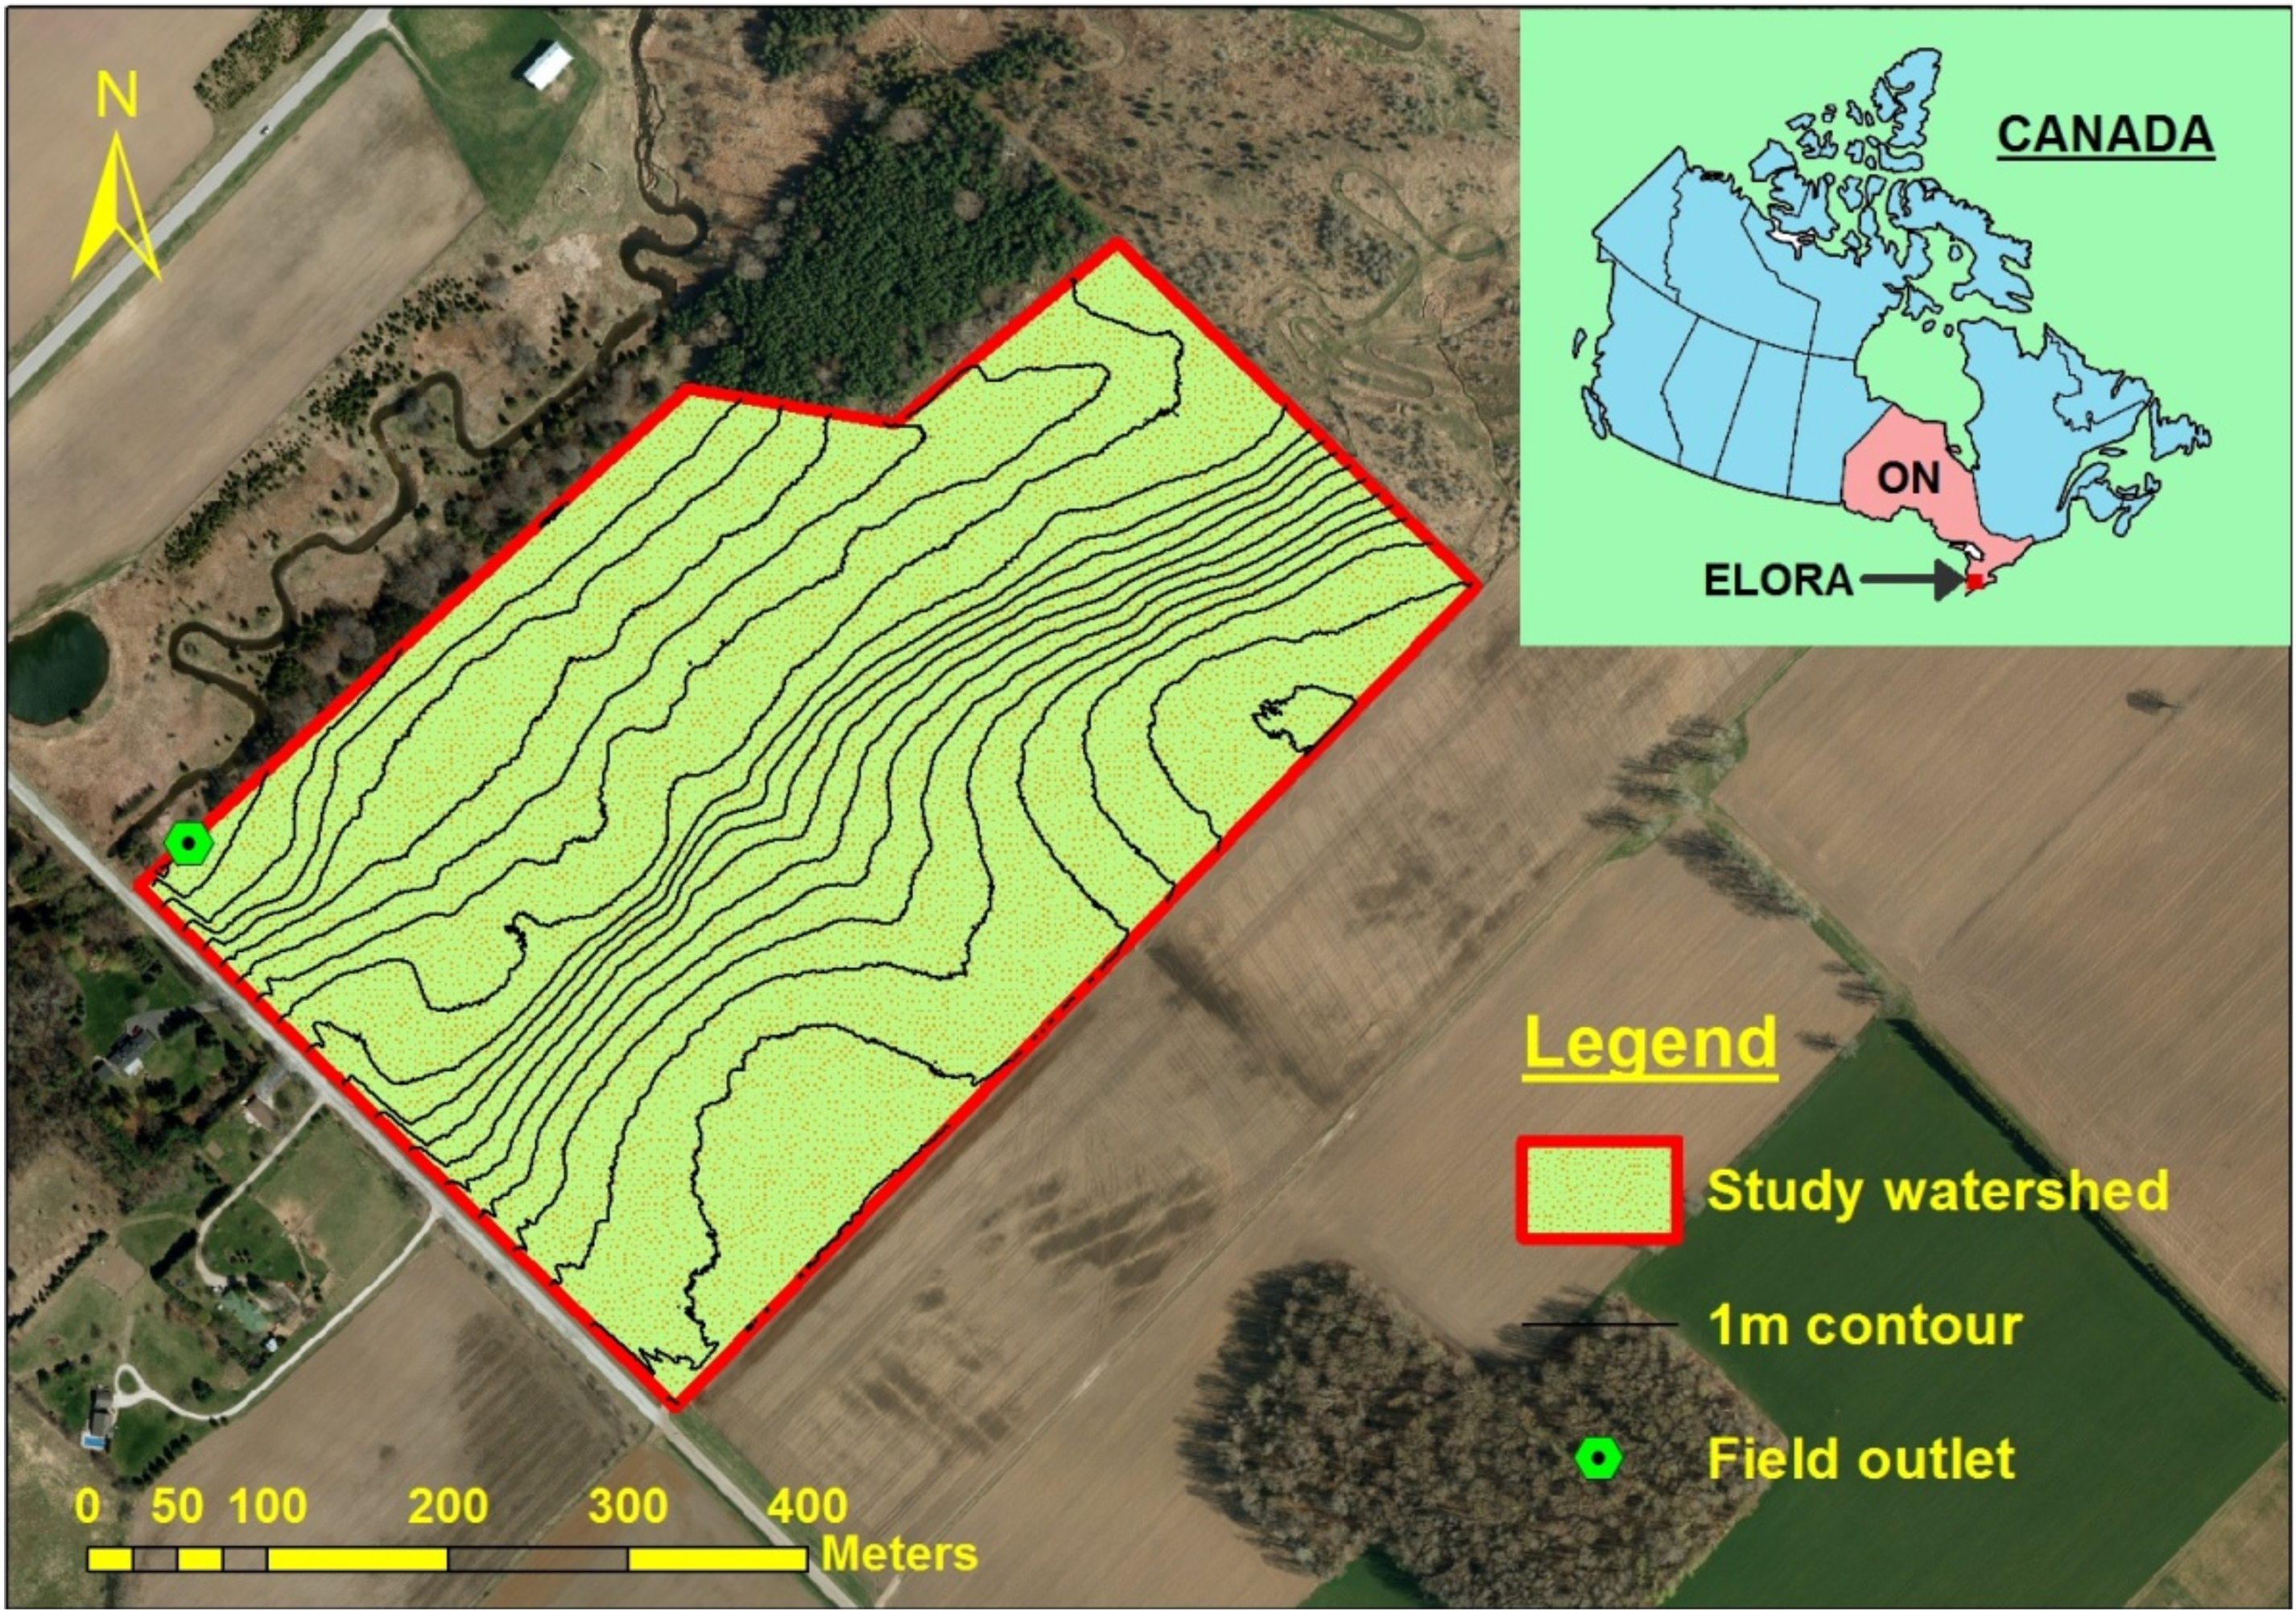
Figure 1. The layout of the study watershed at Elora Research Centre, Elora Ontario.
Water 13 01270 g001
Figure 2. Topographic wetness index map of study watershed.
Water 13 01270 g002
Figure 3. Distributed CN-VSA method step 1: A line graph between runoff amount (Q) and effective precipitation (Pe) to compute S (potential maximum retention).
Water 13 01270 g003
Figure 4. Distributed CN-VSA method—step 2: a line graph between Pe (effective precipitation) and S (potential maximum retention) to determine Af (fraction of runoff-generating area).
Water 13 01270 g004
Figure 5. Distributed CN-VSA method—step 3: the relationship between Af (fraction of runoff generating area) and TWI (topographic wetness index) developed using TWI map to compute λ from Af determined in step 2.
Water 13 01270 g005
Figure 6. Distributed CN-VSA method—step 4: identification of spatial location of saturated areas in a watershed using TWI map and threshold λ.
Water 13 01270 g006
Figure 7. Application of the distributed CN–VSA method using nine rainfall events for three seasons.
Water 13 01270 g007
Figure 8. Application of the modified distributed CN–VSA method using nine rainfall events for three seasons.
Water 13 01270 g008
Figure 9. Comparison of the surface runoff simulated by the distributed CN–VSA method with the observed runoff for three seasons.
Water 13 01270 g009
Figure 10. Comparison of the surface runoff simulated by the modified distributed CN–VSA method with the observed runoff for three seasons.
Water 13 01270 g010
Figure 11. Comparison of spatial distribution of surface runoff estimated by distributed CN–VSA method and modified distributed CN–VSA method for spring rainfall events.
Water 13 01270 g011
Figure 12. Comparison of spatial distribution of runoff estimated by distributed CN–VSA method and modified distributed CN–VSA method of summer rainfall events.
Water 13 01270 g012
Figure 13. Comparison of spatial distribution of runoff estimated by distributed CN–VSA method and modified distributed CN–VSA method for fall rainfall events.
Water 13 01270 g013
Table 1. Comparison of the runoff simulated by distributed CN-VSA method and modified distributed CN-VSA method with observed runoff.
Date Obs. Distributed CN-VSA MethodMod. Distributed CN-VSA Method
Pe [a]Q [b]S [c] Af [d]QMean ErrorS AfQMean Error
(mm)(m3)(mm)(%)(m3)(mm)(%)(m3)
Spring
3-May-1227.523214112331963−75248583451511
10-May-1312.371180112184814831829
28-May-1336.14319611237289148624844
Summer
8-September-1220.6578411227120551318418804352
8-July-1310.12183112163501849197
31-July-1330.761056112392594184252112
Fall
14-October-1143.483596112444136303104454230358
27-November-1111.895861121743710418463
23-October-1220.85745112281262104291307
[a] The part of precipitation that contributes to surface runoff. [b] Runoff depth in mm. [c] Potential maximum retention in mm. [d] The fraction of runoff generating area.
Publisher’s Note: MDPI stays neutral with regard to jurisdictional claims in published maps and institutional affiliations.