Article

Numerical Analysis of Free-Surface Flows over Rubber Dams

1
Department of Civil Engineering, National Central University, 300 Jhong-Da Road, Jhong-Li, Taoyuan 32001, Taiwan
2
Institute of Hydrological and Oceanic Science, National Central University, 300 Jhong-Da Road, Jhong-Li, Taoyuan 32001, Taiwan
*
Author to whom correspondence should be addressed.
Water 2021, 13(9), 1271; https://doi.org/10.3390/w13091271
Submission received: 28 February 2021 / Revised: 13 April 2021 / Accepted: 22 April 2021 / Published: 30 April 2021
(This article belongs to the Section Hydraulics and Hydrodynamics)

Abstract

:
This study integrates a large eddy simulation (LES) model and volume of fluid (VOF) method to simulate the free-surface flows over inflexible circular-crested dams of different shapes. The simulated water depths and pressures on the dam surface are validated by the results of laboratory experiments. Then the numerical model examines the effects of the water depths and the Reynolds number on the hydrodynamic force and the discharge coefficient. The simulation results reveal that the time-averaged drag coefficient decreases as the downstream water depth H2 increases, while the influence of water depth H2 on the lift coefficients is less significant. Furthermore, the discharge coefficients of circular and elliptical dams, computed from the simulated velocity profiles over the crest of the dam, agree with the formulae suggested by previous studies when the downstream depth H2/H1 < 0.90. In contrast, the discharge coefficient of a tear-shape dam is slightly larger than those of circular dams.

1. Introduction

Circular-crested low-head dams, such as rubber dams, are widely used around the world for water supply, irrigation, flood control, scour protection, and tidal barrier [1,2]. The advantages of this kind of dam are low construction cost, easy installation, and they can be used for flow measurement. In recent years, interest in using rubber dams in developing countries has substantially grown as the rubber membrane became more durable [3]. Nevertheless, rubber dams that are installed on a rigid base of the channel bed could still be damaged by torrential flows [4]. Therefore, hydrodynamic loading is one of the essential parameters in the design of rubber dams.
The rubber dam can be classified as air- and water-inflatable dams. The major advantages of air-inflatable rubber dams are short construction time and fast filling the dam by air pumps. The disadvantage of an air-inflatable dam is flow-induced vibration is more severe than the water-inflatable dam, owing to the light-weight of air. Hence, the air-inflatable dam needed to be deflated before floods. The cost of a water-inflatable rubber dam is higher than an air-inflatable dam but still lower than a traditional dam. The major advantages of water-inflatable dams are more unyielding and minimal vibration.
Wu and Plaut [5] used a two-dimensional boundary element method to examine the vibration and stability of an inflatable rubber dam and discovered that the equilibrium state of a circular dam is unstable if the structural damping is too small. Chanson [4] reviewed deflated and inflated rubber dams in several unstable flow conditions and demonstrated that the structural design of the rubber dam must consider the fluid-structure instability to avoid the damage.
Chanson [6] mentioned that the nappe adherence at the downstream side of the rubber dam might lead to flow instability and failure of the dam. Chanson [7] analyzed the wall pressure distribution and nappe trajectory of circular dams with deflectors and found that the deflectors can reduce the adherence pressure and avoid the dams’ instability. Hager [8,9] measured the velocity profiles at the crest of a circular weir and suggested a formula for the discharge coefficient. Ramamurthy et al. [1] applied a momentum analysis to study the discharge coefficient of the circular-crested weir and compared the results of the flume experiment. Chanson and Montes [10] used flume experiments to examine the influence of inflow conditions on the discharge coefficients of circular-crested weirs. Their results indicated that the upstream ramp did not affect the discharge coefficient and energy dissipation; however, the inflow condition has a substantial impact on the flow properties at the crest of circular weirs.
Heidarpour and Chamani [11] employed potential flow theory to derive the velocity profile and discharge coefficients of different types of circular weirs. They verified their model with the results of flume experiments. Bagheri and Heidarpour [12] used an irrotational vortex theory to determine the effects of the circulation and weir curvature on the discharge rate over circular-crested weirs and suggested a new formula for the discharge coefficient.
Schmocker et al. [13] used flume experiments to study the discharge coefficient of circular-crested weirs with various combinations of upstream and downstream angles. Their results indicated that the upstream weir face angle has only a small effect on the discharge coefficient; however, the discharge coefficient increased significantly as the downstream weir face angle increased. Naghavi et al. [14] used a computational fluid dynamics (CFD) model to simulate the pressure and velocity distributions of circular weirs. Their results show that the locations of critical flow and nappe separation depend on the weir size and inflow conditions. Cheraghi-Shirazi et al. [15] used a three-dimensional numerical model to analyze the fluid-structure interaction of an inflatable rubber dam under different flow conditions and internal pressures and concluded that the discharge coefficient is dependent on the upstream water depth and foot width of the dam.
Yuce et al. [16] used a Reynolds stress turbulence model to study the flows over cylindrical weirs of different diameters and inclination angles. Their simulation results showed that the flow pattern was affected by the inclination angle to the flow direction and that the increment of inclination angle increased the downstream velocity, thus increasing the absolute value of the negative pressure at the inward end of the weir. Cheraghi-Shirazi et al. [17] used a fluid-structure interaction approach to study flexible rubber dams, and their results indicated that the hydraulic flow characteristics over the equilibrium shape of the flexible rubber dam are analogous to those of the rigid circular-crested weirs.
The above experimental and numerical studies focused on the flow pattern and discharge coefficient of circular rubber dams. They did not provide the essential drag and lift coefficients for the structural design of the rubber dams. Moreover, the effect of the dam shape on the discharge rate needs to be considered. This study employs a large eddy simulation (LES) model and the volume of fluid (VOF) method to investigate the hydrodynamic loading and discharge rate of circular-crested dams of different shapes. A series of numerical simulations examine the effects of the water depth and Reynolds number on the hydrodynamic loads and the discharge coefficients of the circular, elliptical, and tear-shape dams.

2. Numerical Model

This study used two- and three-dimensional large eddy simulation (LES) models to simulate the free-surface flows over inflexible, circular dams of different shapes. The fluid motion was simulated by solving the filtered continuity equation and the Navier–Stokes equations [18,19]:
u i ¯ x i = 0
ρ u i ¯ t + ρ u i u j ¯ x j = P ¯ x i + ρ g δ i 3 + x j [ μ e f f ( u i ¯ x j + u j ¯ x i ) ]
where u is the fluid velocity; P is the pressure; the over-bar represents that the quantity is the spatially filtered value [20]; subscripts i, j = 1, 2, 3 represent the x, y, z directions, respectively; t is the time; ρ is the density of the fluid; g is the gravitational acceleration; δ is the Kronecker delta; and μeff is the effective viscosity, defined as:
μeff = μ + μSGS
where μ is the dynamic viscosity of the water, and μSGS is the viscosity of the sub-grid scale turbulence. In this study, the sub-grid scale turbulence was modeled using the dynamic model of Lilly–Smagorinsky [21]:
μ S G S = ρ ( C s Δ s ) 2 [ 2 S ¯ i j S ¯ i j ] 1 / 2
where Cs is the Smagorinsky coefficient, Sij is the filtered rate of strain tensor [22]:
S ¯ i j = 1 2 ( u i ¯ x j + u j ¯ x i )
and Δs is the characteristic length of the spatial filter. For two- and three-dimensional flows, the characteristic length is calculated, respectively, as:
Δ s = 2 ( Δ x Δ z ) 1 / 2
Δ s = ( Δ x Δ y Δ z ) 1 / 3
where Δx, Δy, and Δz are the grid size in the x, y, and z directions. In this study, the value of the Smagorinsky coefficient was set as Cs = 0.30 for two-dimensional flows and Cs = 0.15 for three-dimensional flows. In addition, the projection method [23] was used to decouple the velocity and pressure in the Navier–Stokes equations and to solve the Poisson pressure equation (PPE). For the unsteady flow simulation, the time derivative term used the forward difference scheme.
The kinematics of the water surface was solved by the volume of fluid (VOF) method [24]. The volume fraction fm occupied by the water in a grid cell can be described by:
f m t + x j ( f m u j ¯ ) = 0
The computational cell is full of water when the volume fraction fm = 1, and the cell is partially occupied by water when 0 < fm < 1. The wall function is used to calculate the velocity near the channel bed:
U ( z ) u * = 1 κ ln ( z + ) + A
z + = z u * ν
where z is the vertical distance from the channel bed to the cell center; κ (= 0.41) is the von Karman constant; u* is the shear velocity; and the coefficient A = 17, as suggested by Cabot and Moin [25]. Based on the velocity profile upstream of the dam, the friction velocity can be calculated as u* = 0.0074 m/s. The grid size near the channel bed is about Δz = 2 mm for Grid 2. Therefore, the distance from the channel bed to the cell center closest to the bed is z = Δz/2 = 1 mm, and the dimensionless distance z+ = zu*/ν = 7.4.
The numerical solver was modified from the open-source software Truchas, which was developed by Los Alamos National Laboratory [26]. The same code has been used to study liquid sloshing in a baffled tank [27], free-surface flows over rectangular bridge deck [28], circular pipeline [29], and cylinder array [30]. In this study, the convergence criterion was set as 106 for the momentum equation. The Courant number was set as Cr = 0.85, and the average time step was Δt = 9.0 × 10⁴ s. The simulation results before the dimensionless time τ = tV1/D1 = 15 (normalized by the upstream velocity V1 and the diameter D1 of the circular dam) were discarded to exclude the initial transient results from the numerical simulation. The time-averaged velocity and pressure were calculated from the simulation results between the dimensionless time τ = 15–30.

3. Model Validation

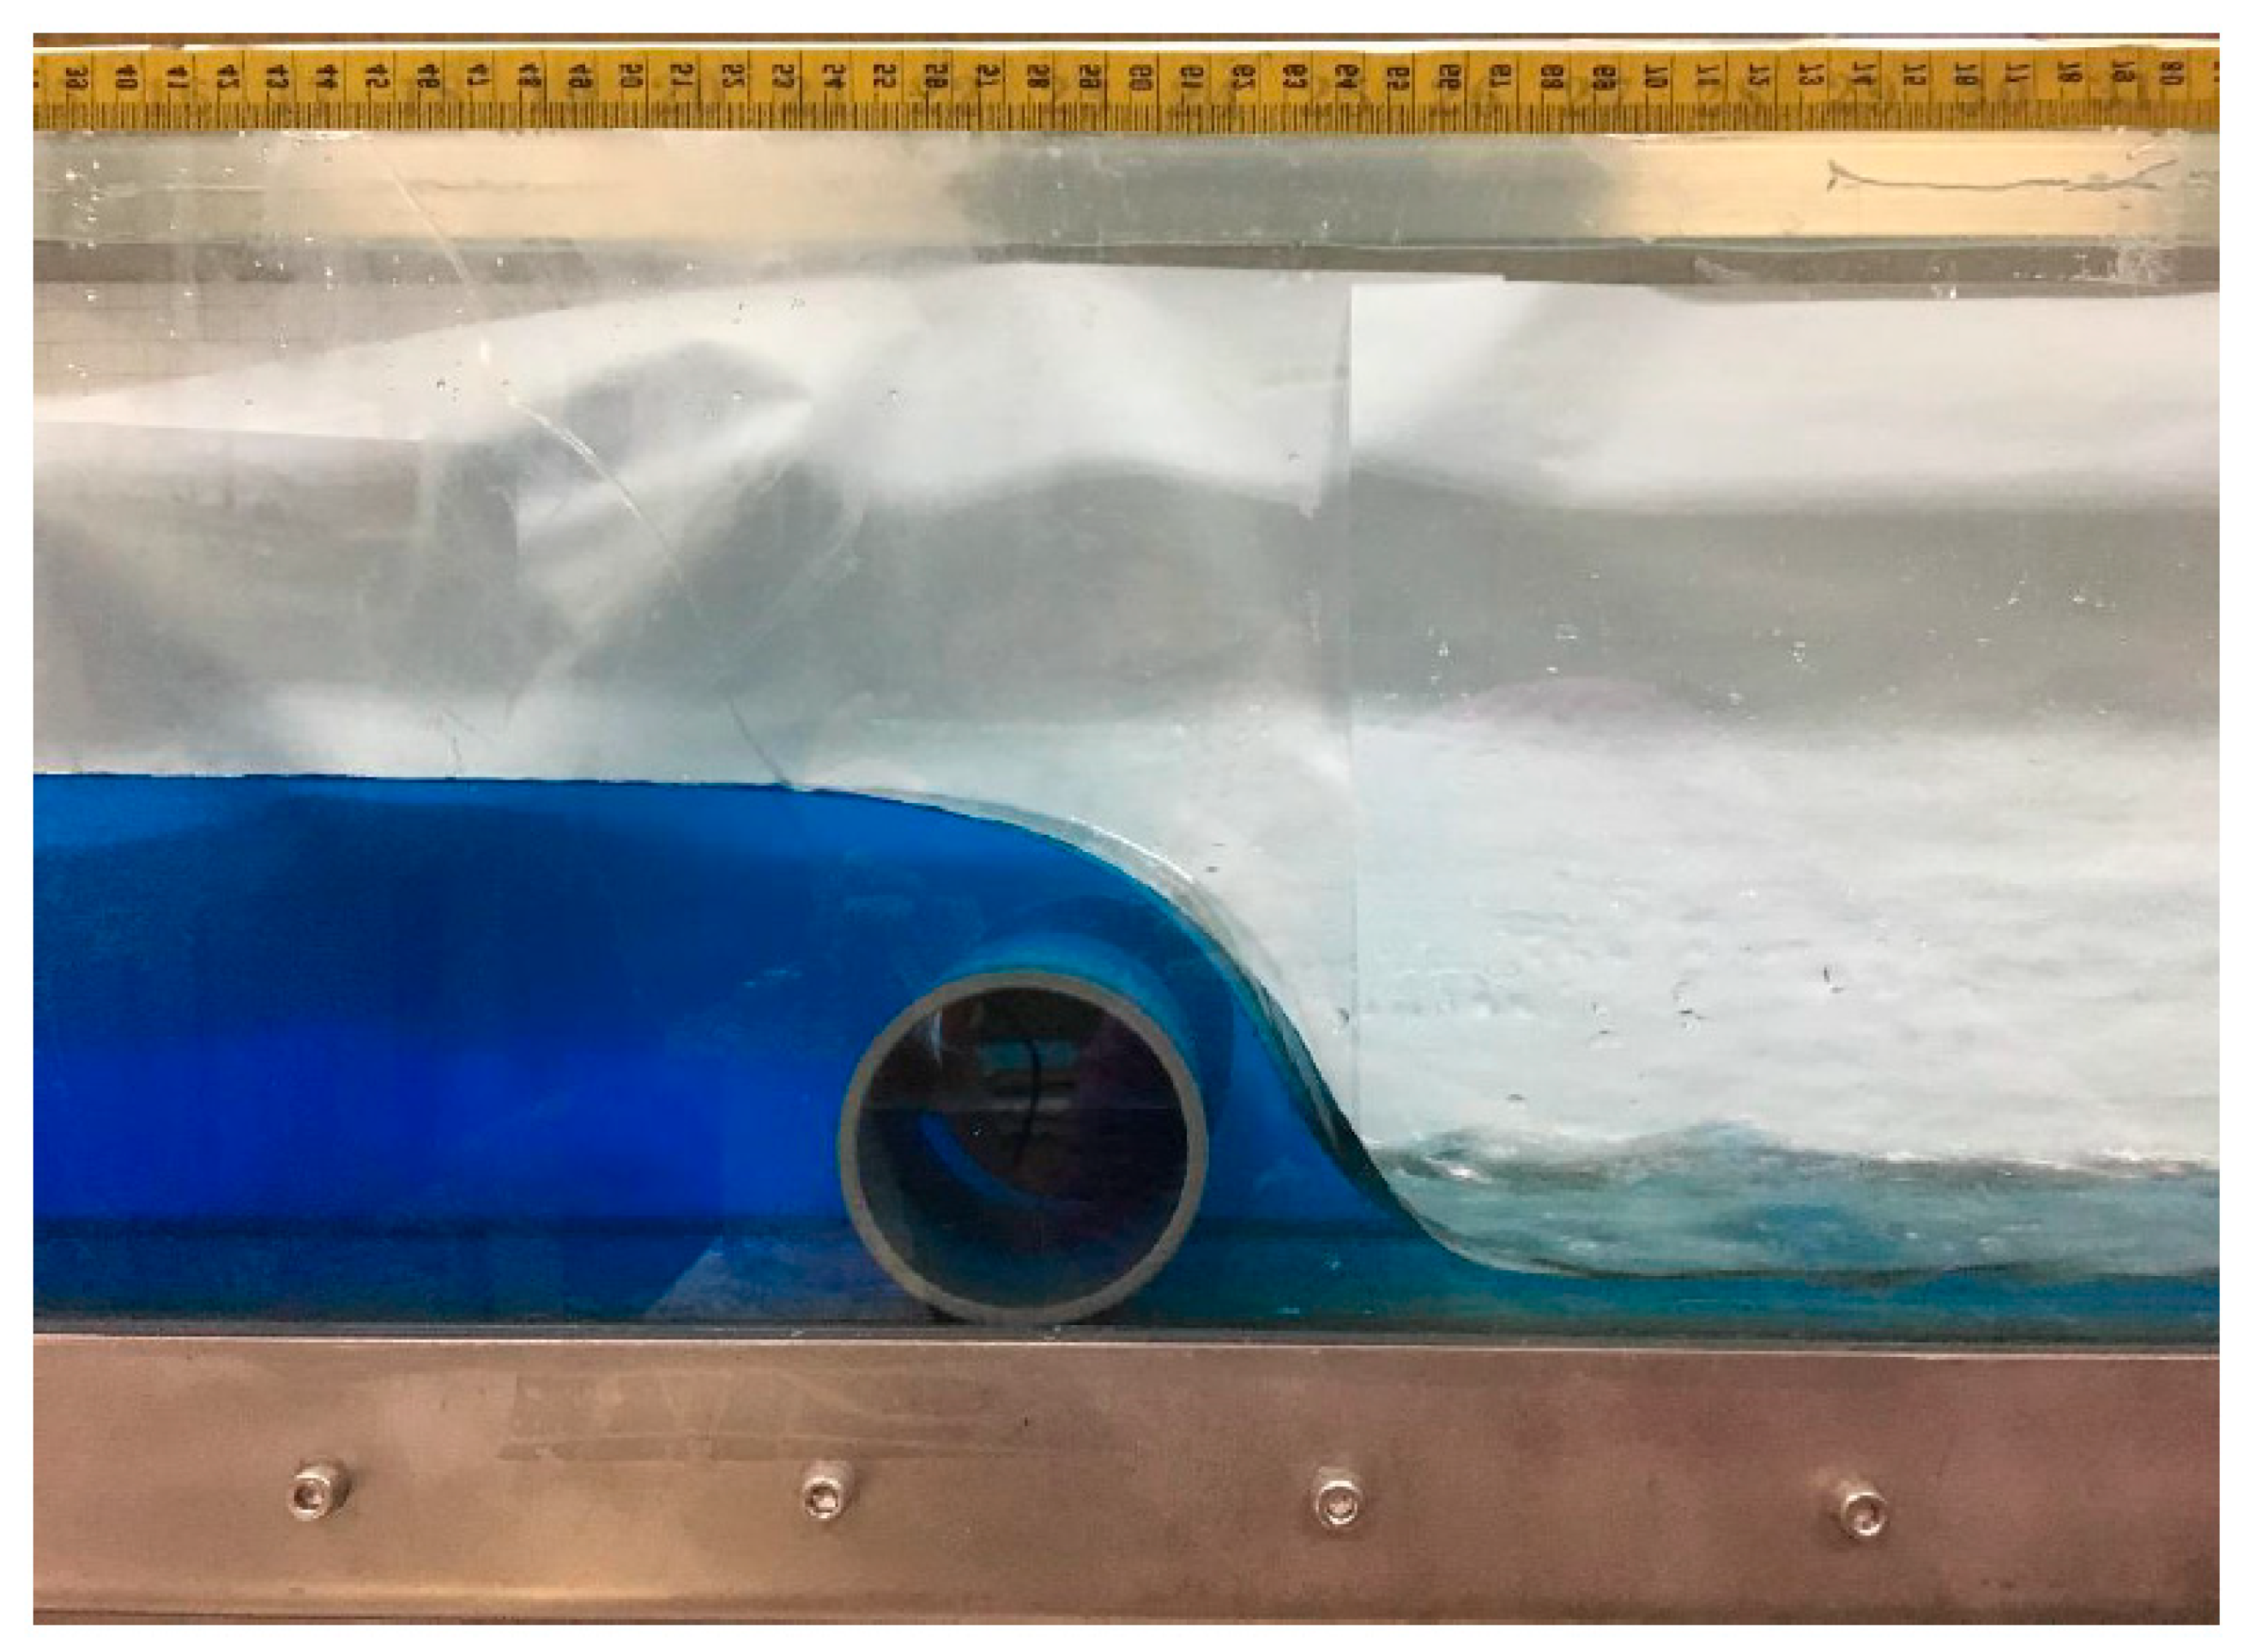
The accuracy of the present large eddy simulation (LES) model was checked by comparing the simulation results with that of flume experiments. The laboratory experiments were conducted in a circulating water flume with a rectangular cross-section (1.10 m in length, 0.12 m in width). A smooth, circular cylinder (diameter D1 = 0.076 m, width W = 0.12 m) was installed in the middle of the flume (see Figure 1 and Figure 2). The discharge rate Q was measured by a 90° V-notch weir. The water depths were measured along the centreline of the flume by a point gauge with a resolution of 0.1 mm.
In the flume experiment, the upstream and downstream water depth were H1 = 0.109 m = 1.44 D1 and H2 = 0.0104 m = 0.137 D1, respectively. The upstream velocity V1 = 0.115 m/s, the upstream Froude no. Fr1 = V1/(gH1)1/2 = 0.11, and the Reynolds number Re = V1D1/ν = 8740.
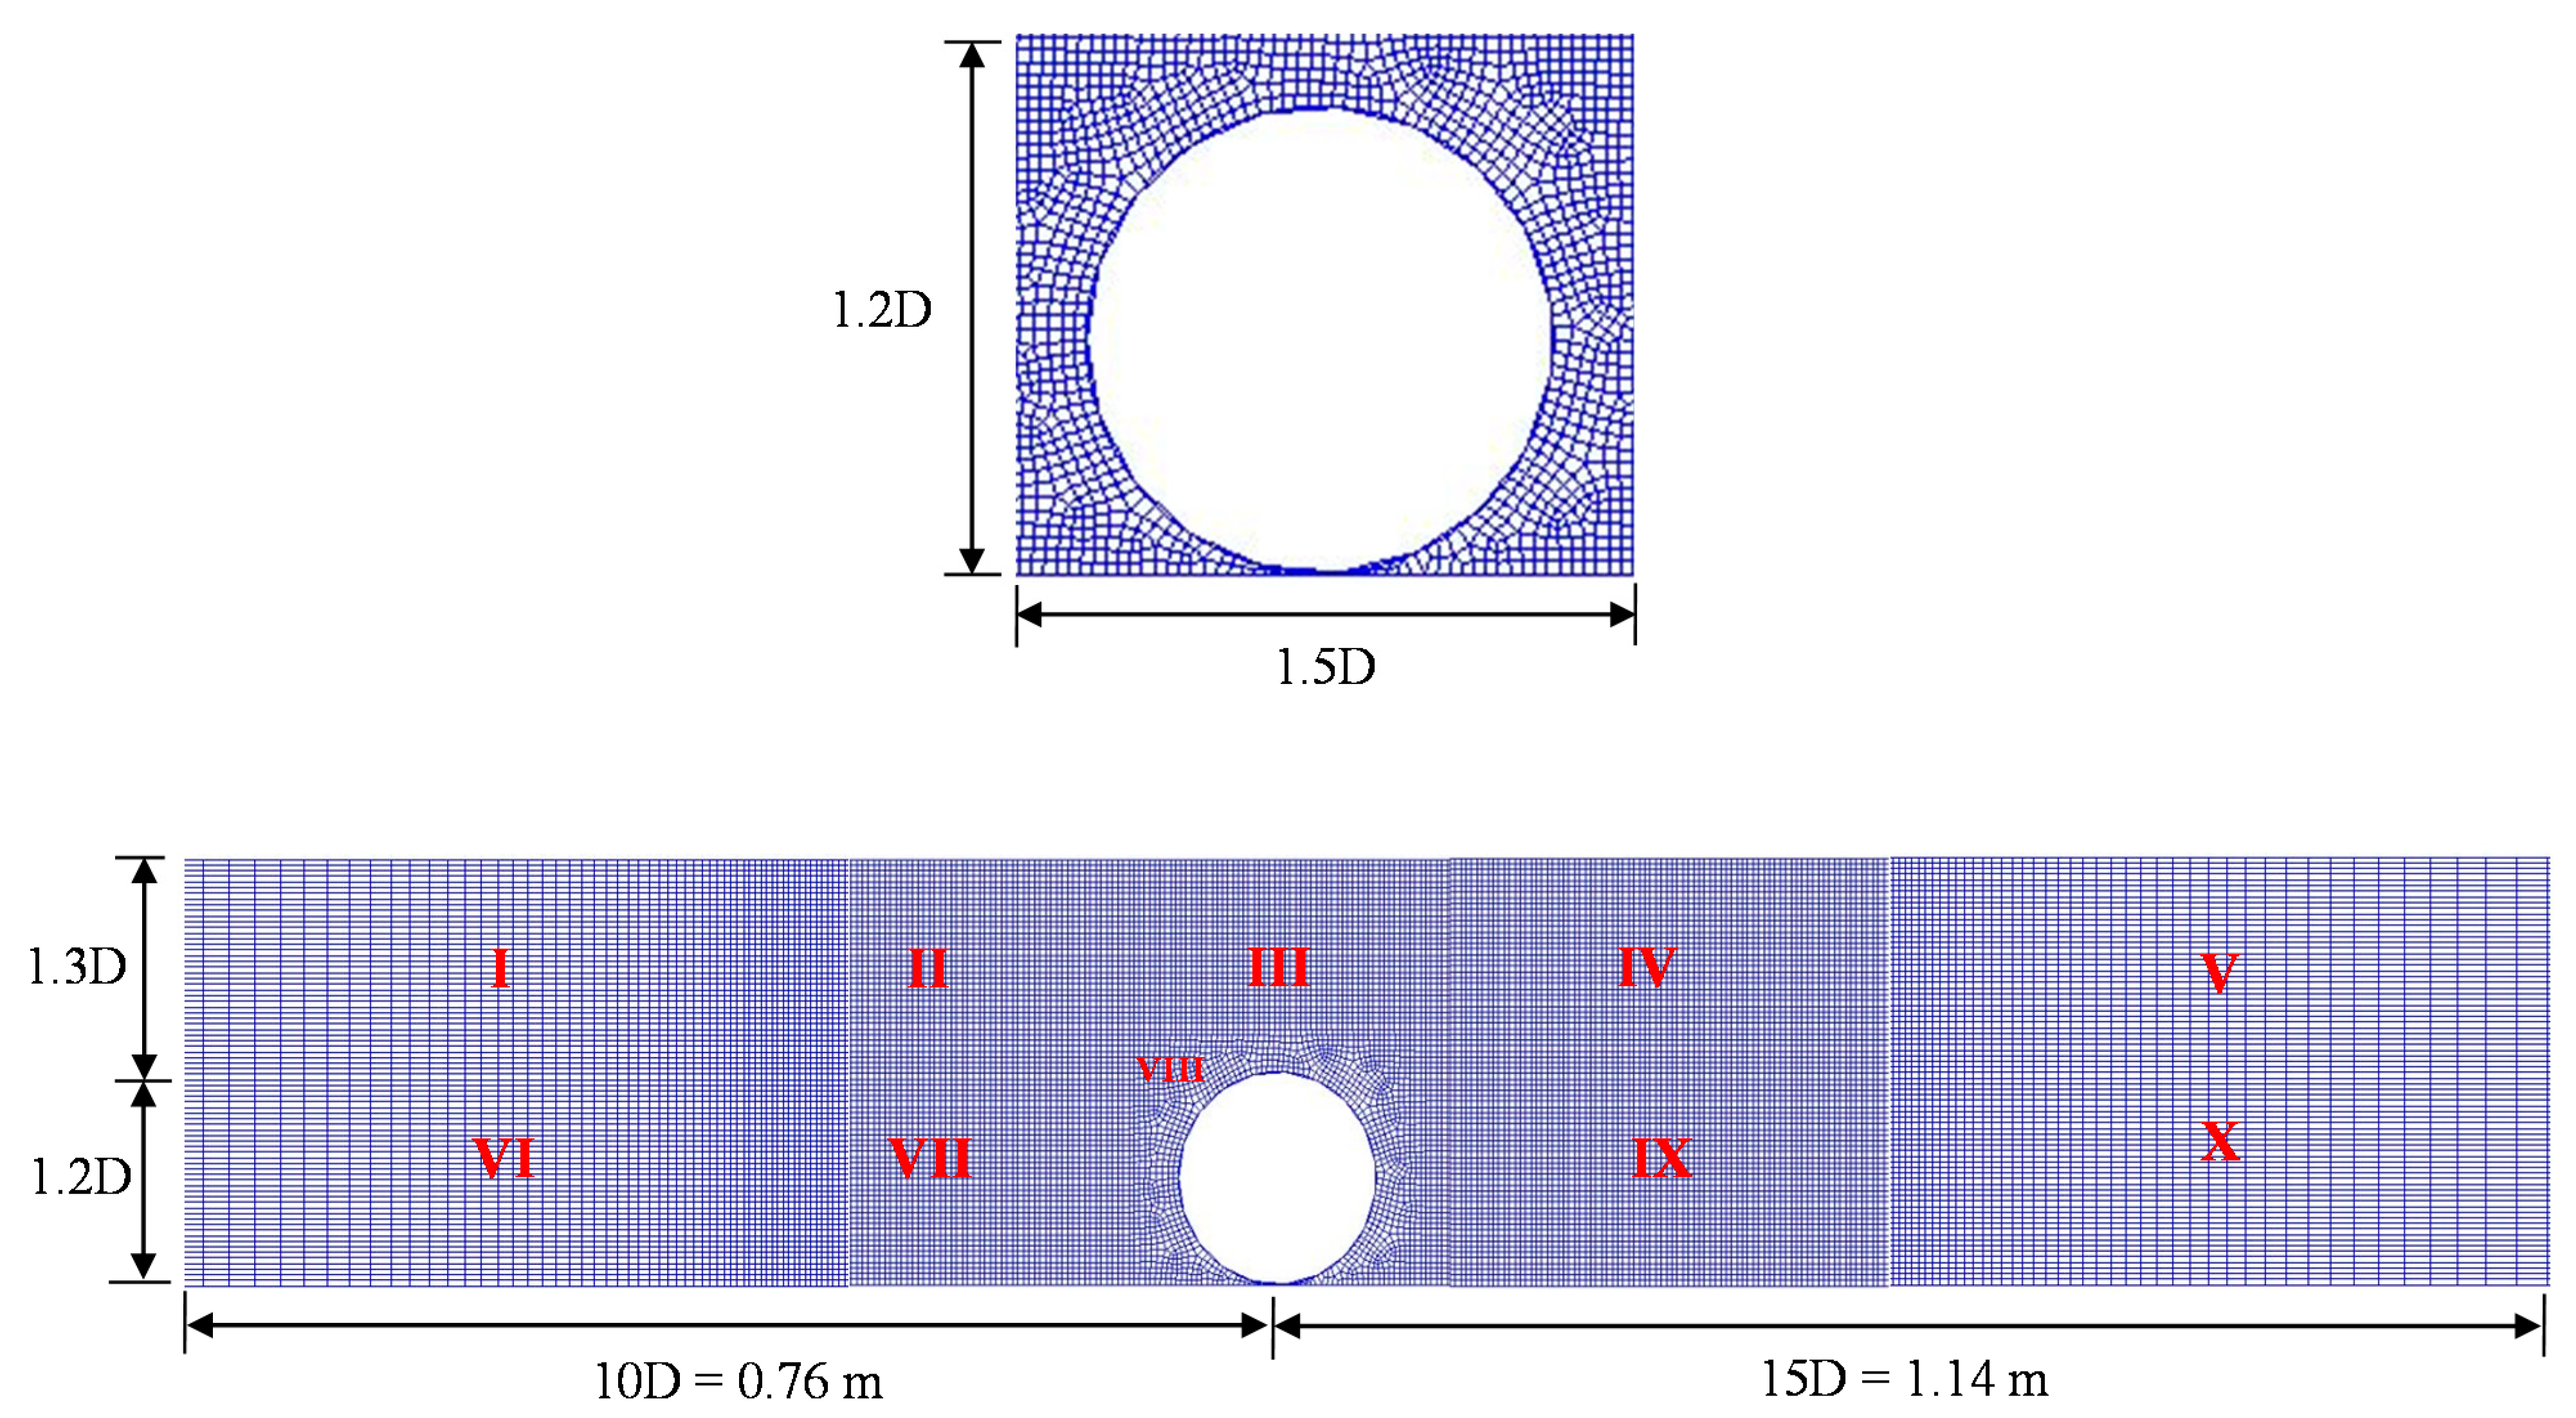
Figure 3 shows the computational domain and grid arrangement. The entire computational domain was divided into 10 zones, and Zone VIII, where the dam was located, adopted a non-structured grid with the smallest grid size, 0.026 D1. For Zones I, VI, V, and X, non-uniform grids were used, and the stretching ratio was 1.04. The bottom boundary was set as the no-slip boundary condition, the lateral boundaries were set as the free-slip boundary condition, and the downstream boundary was set as zero-gradient for stream-wise velocity [22,28].
For the validation case (A1), the velocity distribution at the inlet boundary was set as:
V ( z ) V 1 = ( z δ ) α       z < δ V ( z ) = V 1            z δ
where V1 = 0.115 m/s is the velocity outside the boundary layer; δ = 0.1H1 is the thickness of the boundary layer, and the exponent α = 0.2. Since the boundary layer thickness δ was much smaller than the upstream water depth, H1, the approaching flow was close to a uniform flow. Figure 4 demonstrates that the predicted water depths hp by different computational grids are all very close to the measured water depth hm. Grids 1–3 are two-dimensional grids used by the 2D LES model, while Grid 4 is a three-dimensional grid computed by the 3D LES model. The average error between the predicted and measured water depths are defined as:
Δ h = 1 n i = 1 n | h m ( x i ) h p ( x i ) | h m ( x i )
where n is the number of measured water depth hm. Table 1 summarizes the relative errors Δh of different computational grids. As can be seen in Table 1, the result of the three-dimensional model was not outstandingly better than that of the two-dimensional models; this demonstrates that the non-uniformity of the wake flow in the y-direction (span-wise direction) did not affect the integral features on the mid-plane of the cylinder. Therefore, Grid 2 (120 grid points around the dam surface) was used for the rest of the simulation to save computing time.
The pressures on the surface of the circular dam were measured by a pressure transducer (Fox, TR49). The measuring range of the transducer is 0–5000 Pa, with a resolution of 25 Pa. The sampling duration was 100 s, and the sampling frequency was 10 Hz. The total pressures (including hydrostatic and dynamic pressure) on the dam surface were measured at locations θ = 0°, 90°, and 180°. The pressure coefficient is defined as:
C p = P 1 2 ρ V 1 2
where P is the total pressure on the dam surface; ρ is the density of the water; and V1 is the undisturbed upstream velocity. The total pressure can be separated into the hydrostatic pressure Pstat and the dynamic pressure Pd.
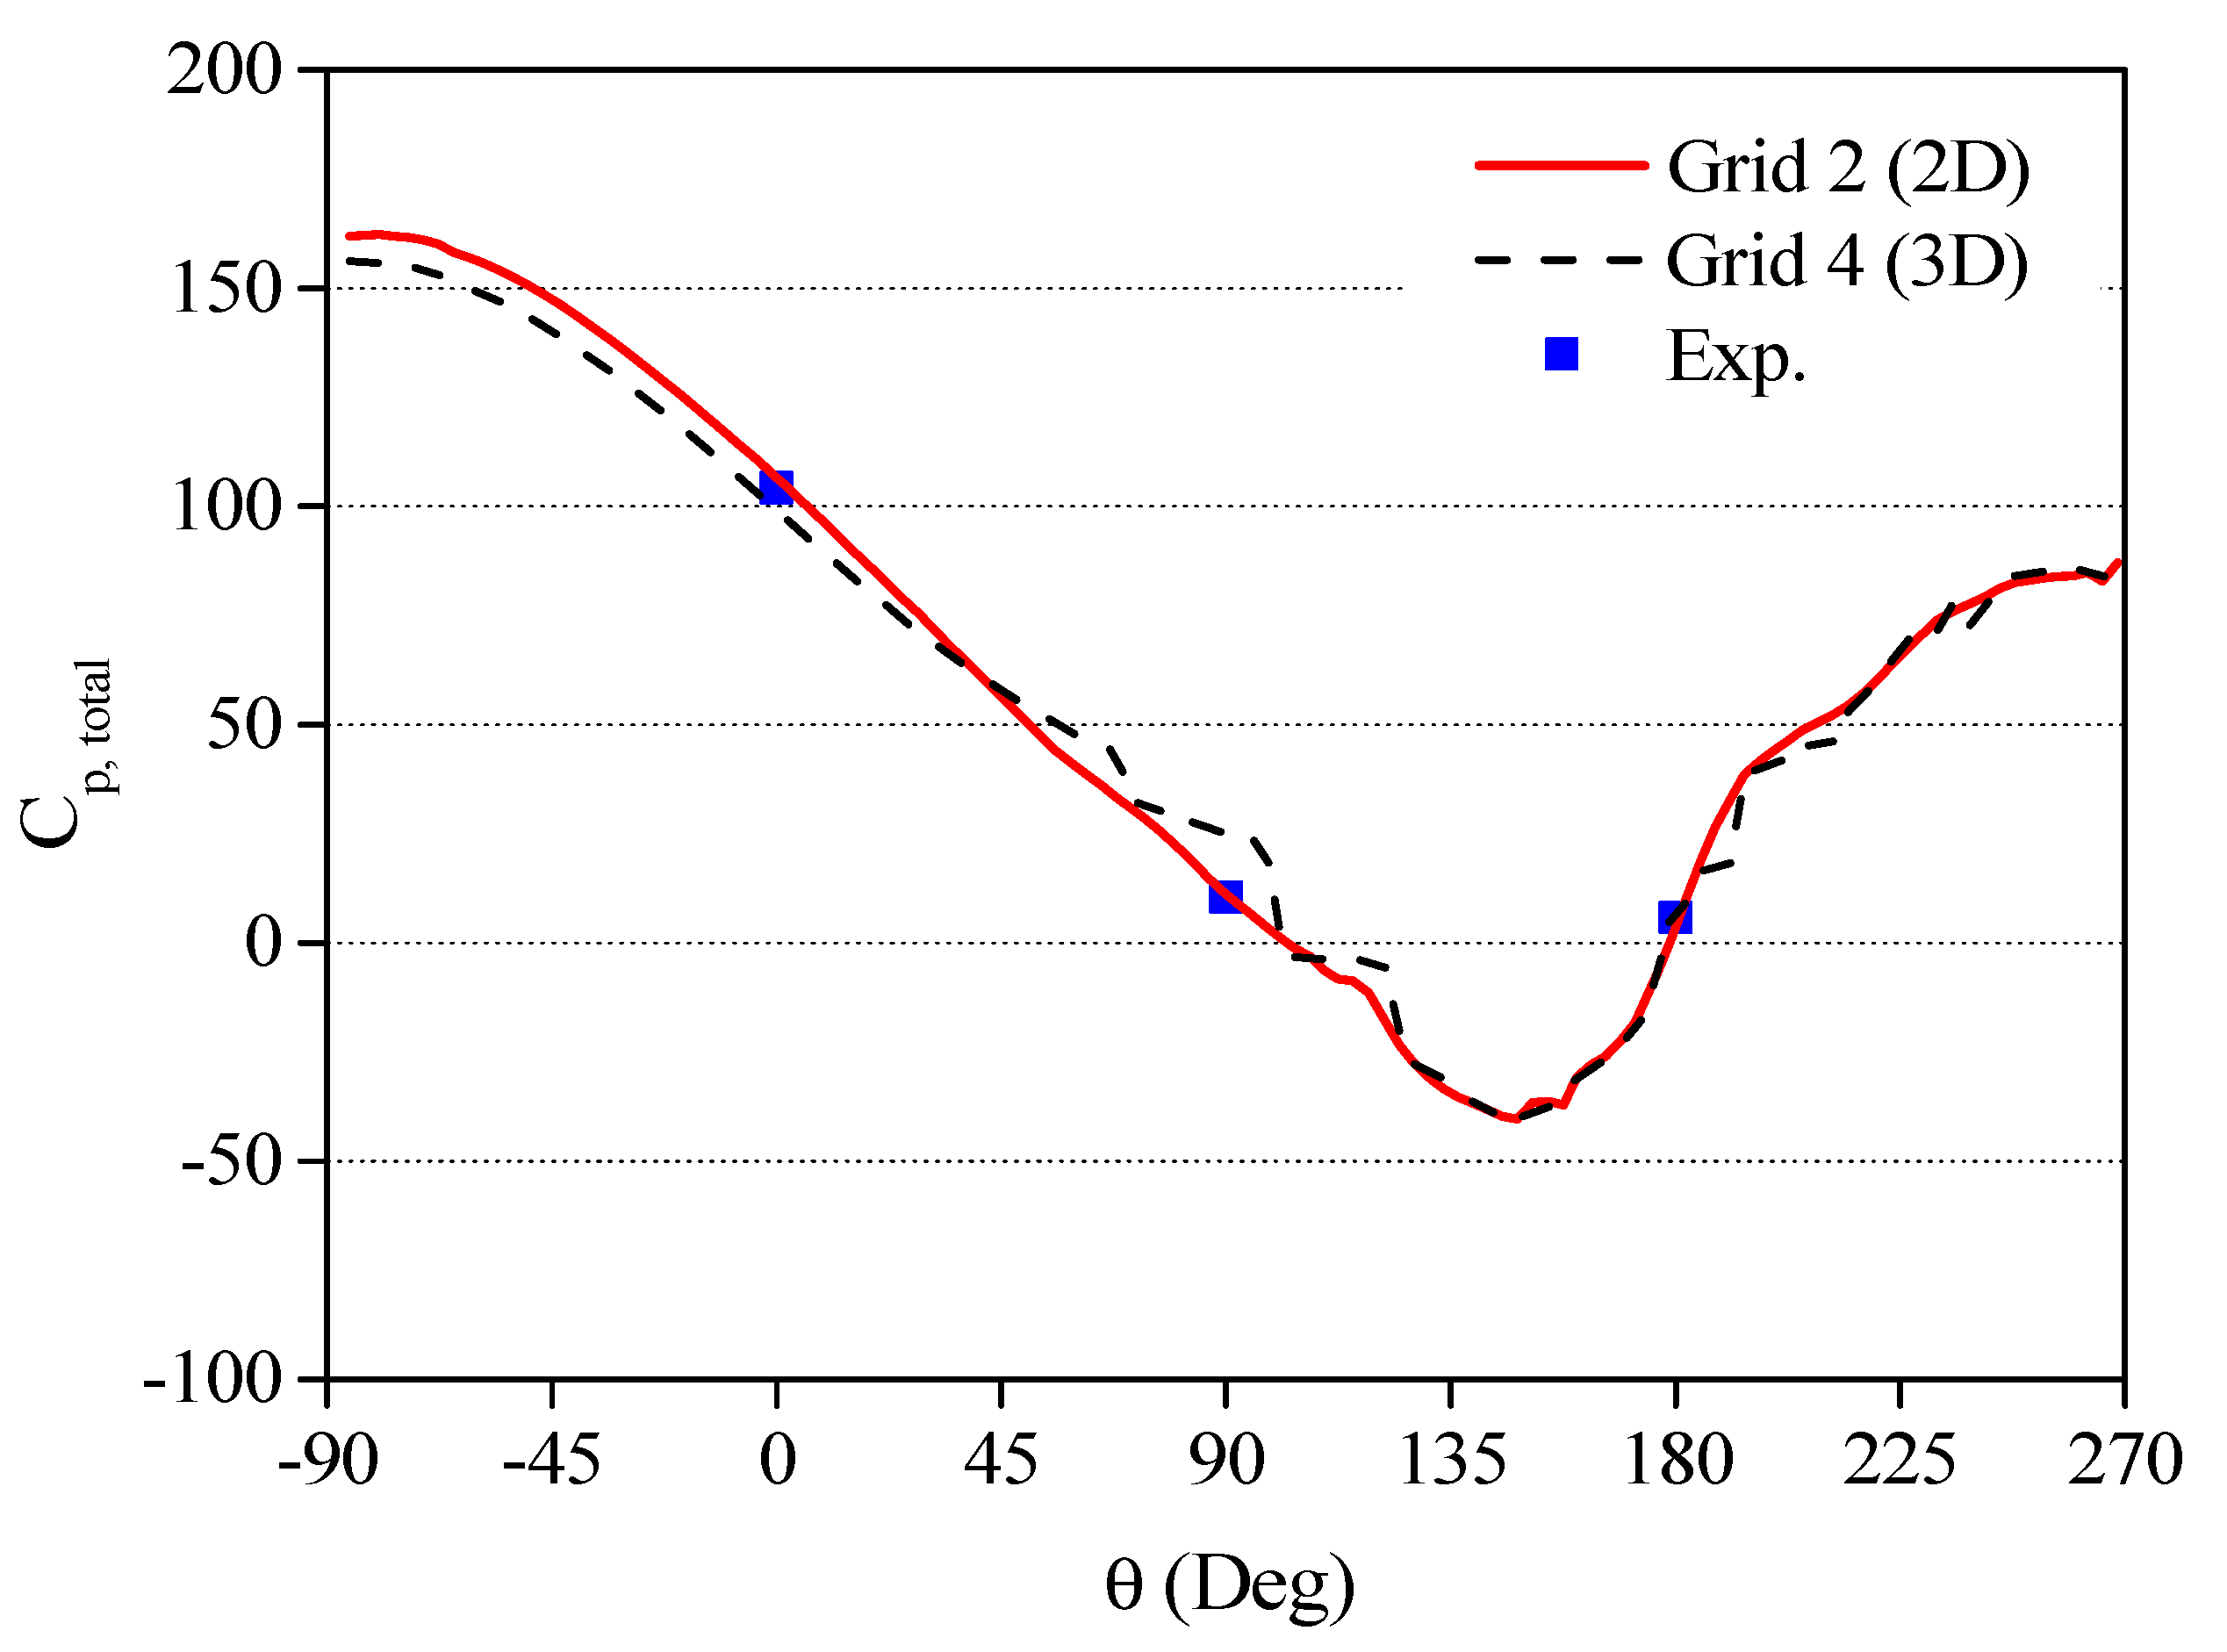
Figure 5 compares the measured and predicted time-averaged total pressure coefficients, Cp, on the dam surface of the validation case (Case A1). The maximum pressure occurred at the location θ = −90° due to the hydrostatic pressure was the largest near the upstream channel bed. The pressure coefficient was negative between θ = 90°–180°, owing to the large velocity on the top and leeward side of the circular dam. In addition, the difference between the measured and predicted time-averaged pressure coefficients by Grid 2 was 3.2–6.3%. Note that the predicted pressures by the two- and three-dimensional (Grid 4) LES model were very close. The good agreement between the measured and predicted pressures validates the accuracy of the present LES model.
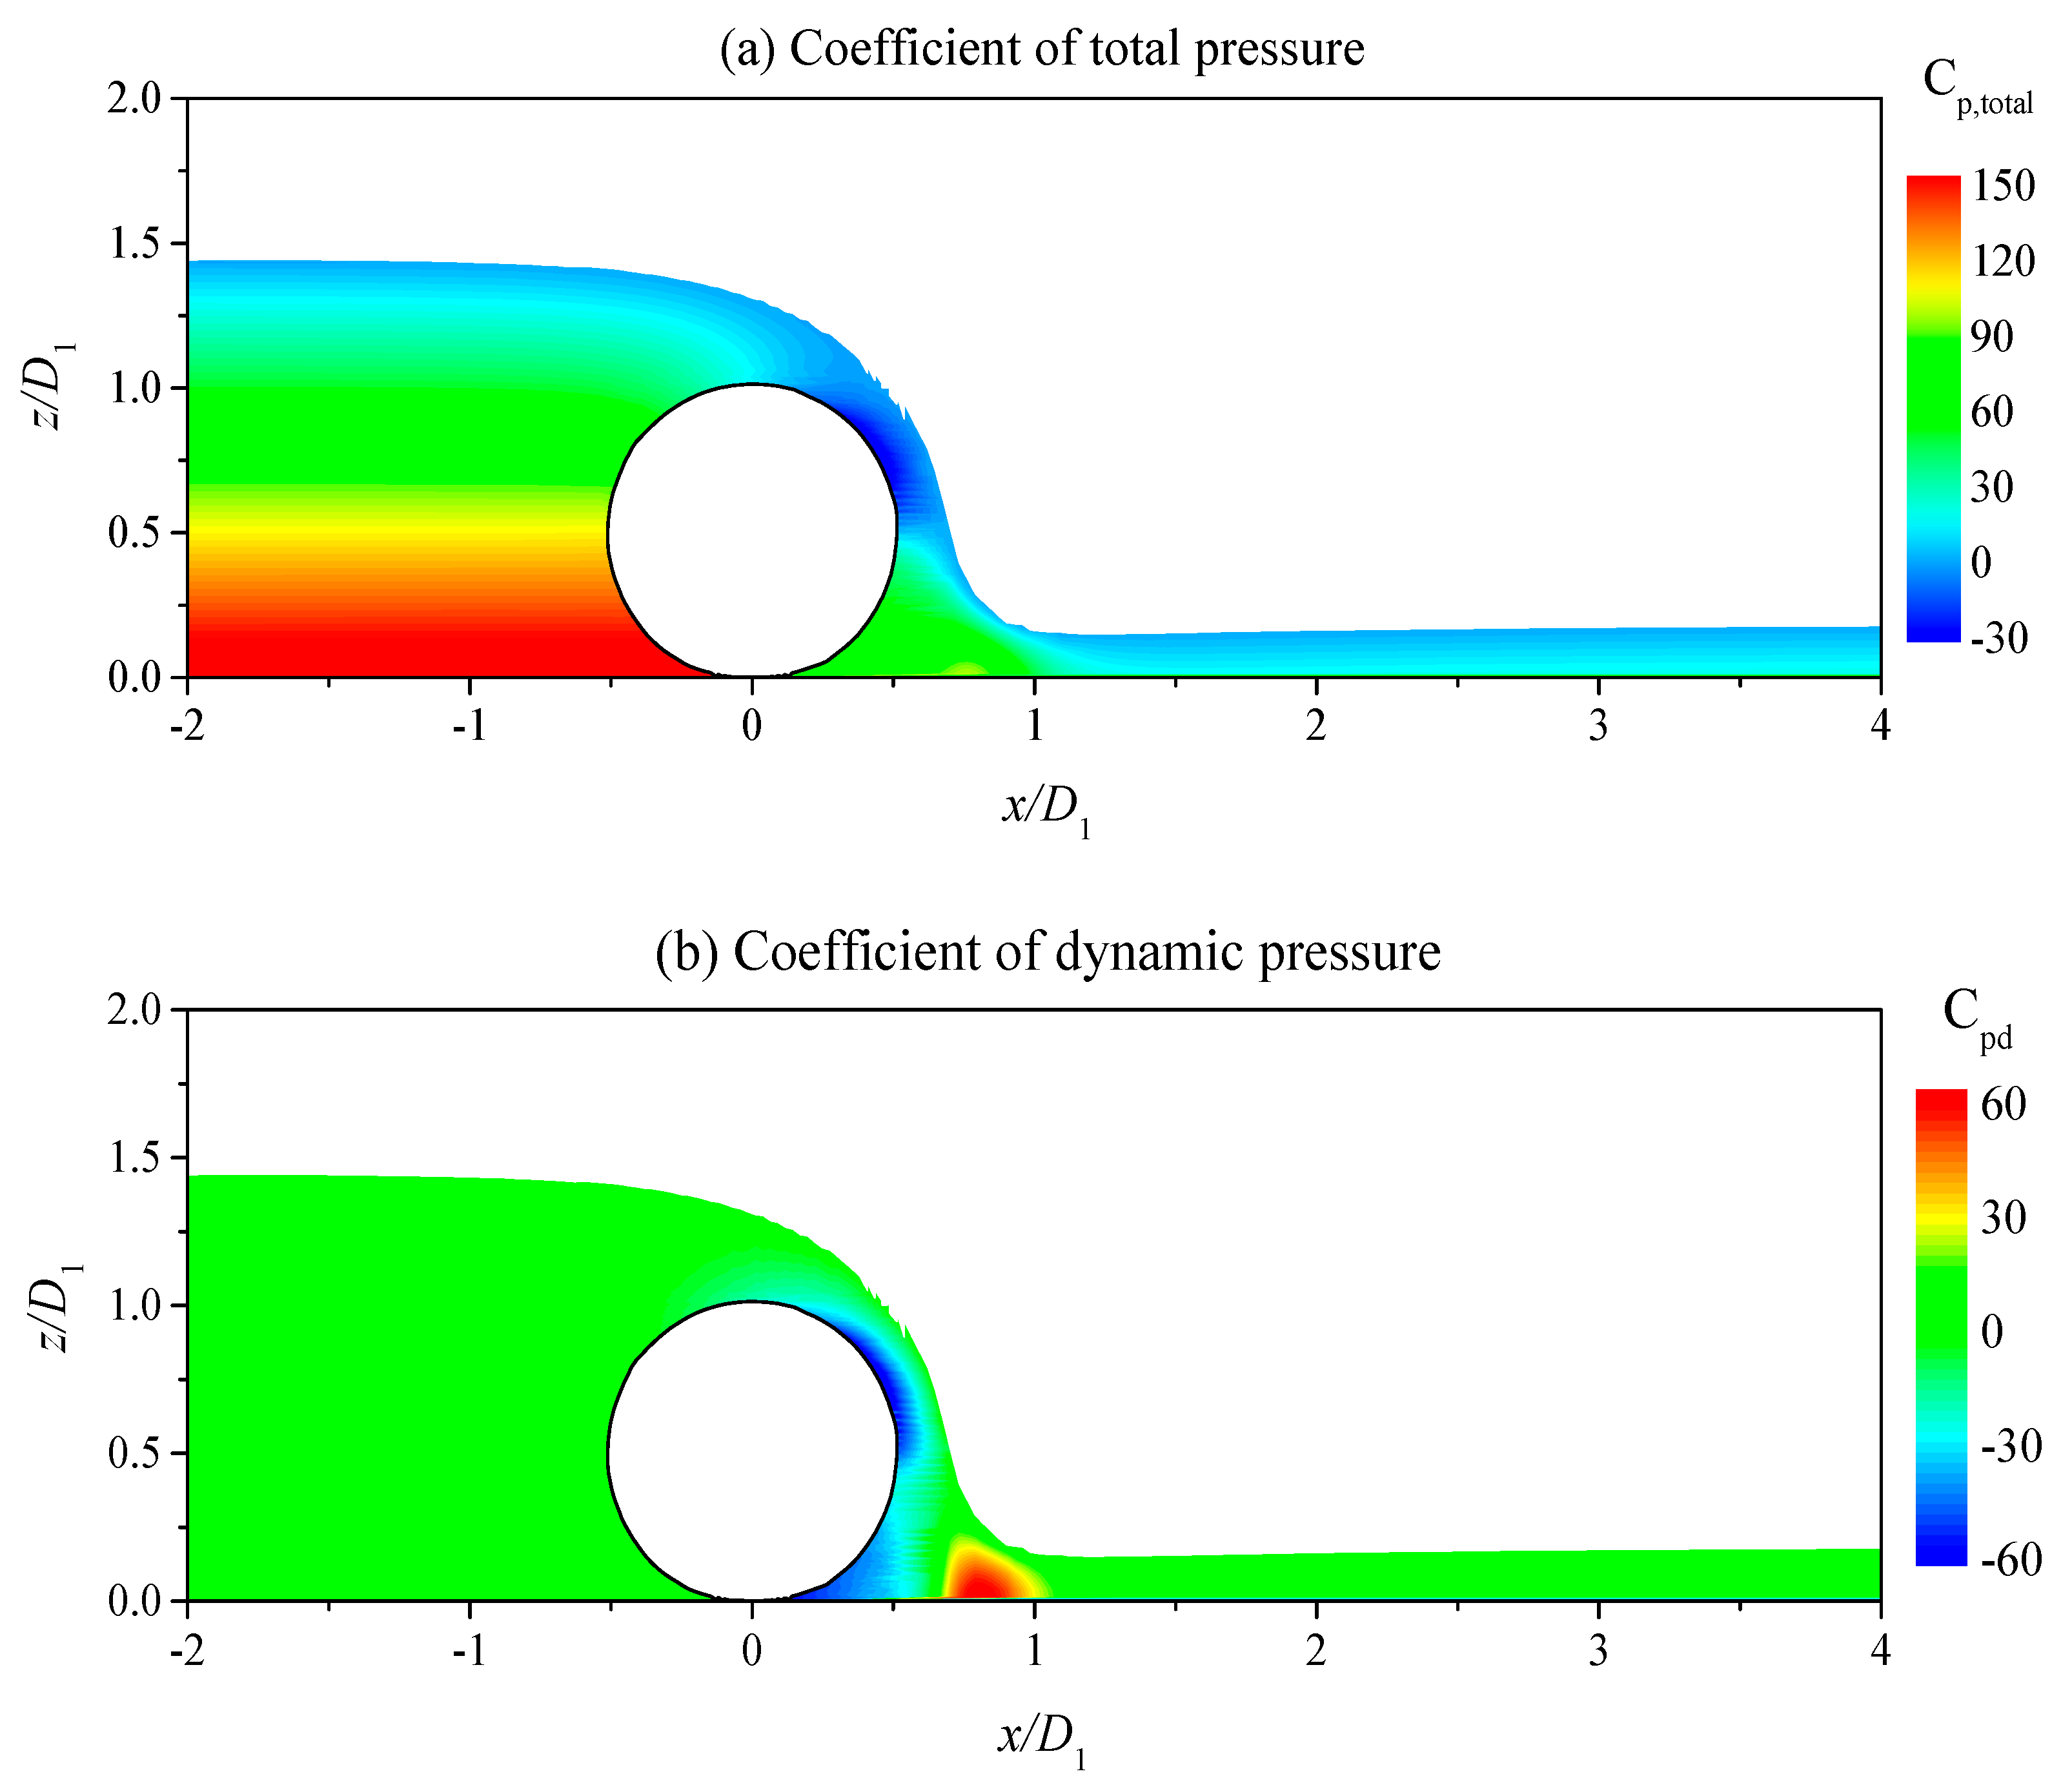
For the validation case, the time-averaged total and dynamic pressure coefficients on the mid-plane of the dam are shown in Figure 6a,b, respectively. The negative (suction) pressure on the leeward side of the dam was caused by the nappe flow over the circular dam. In addition, notice the large positive dynamic pressure on the channel bed downstream of the dam, resulting from the high-speed jet flow descending from the dam. If the channel bed were an erodible bed, scouring would occur downstream of the dam.
By neglecting the viscous stress on the dam surface, the time-averaged drag and lift of the dam were calculated from the simulated pressure on the dam surface:
F D = i = 1 n P ( θ i ) cos θ i ( W R Δ θ )
F L = i = 1 n P ( θ i ) sin θ i ( W R Δ θ )
where θi is the angle; n (= 120) is the number of angular locations (grid points) on the dam surface; R is the radius of the dam; and W is the dam width. The dimensionless drag coefficient, CD, is defined as:
C D = F D 1 2 ρ V 1 2 A
where FD is the drag acting on the dam, and A = WD1 is the projected area of the circular dam. The lift coefficient, CL, is defined as:
C L = F L 1 2 ρ V 1 2 A
The dimensionless buoyancy experienced by the circular dam can be calculated as:
C B = F B 1 2 ρ V 1 2 A = π D 1 g 2 V 1 2

4. Results and Discussion

4.1. Hydrodynamic Loading

The validated large eddy simulation model was used to examine the effects of the downstream water depth and Reynolds number on the hydrodynamic force and discharge coefficients of the circular dam. For Cases A1–A7, the diameter of the circular dam D1 = 0.076 m, upstream water depth H1 = 0.109 m, and velocity V1 = 0.115 m/s were identical to that of the flume experiment. However, the downstream water depth varied in the range of H2 = 0.010 m–0.107 m (depth ratio H2/H1 = 0.10–0.98). Therefore, the downstream velocity V2 = 0.117–1.21 m/s, and the downstream Froude number was Fr2 = 0.12–3.53.
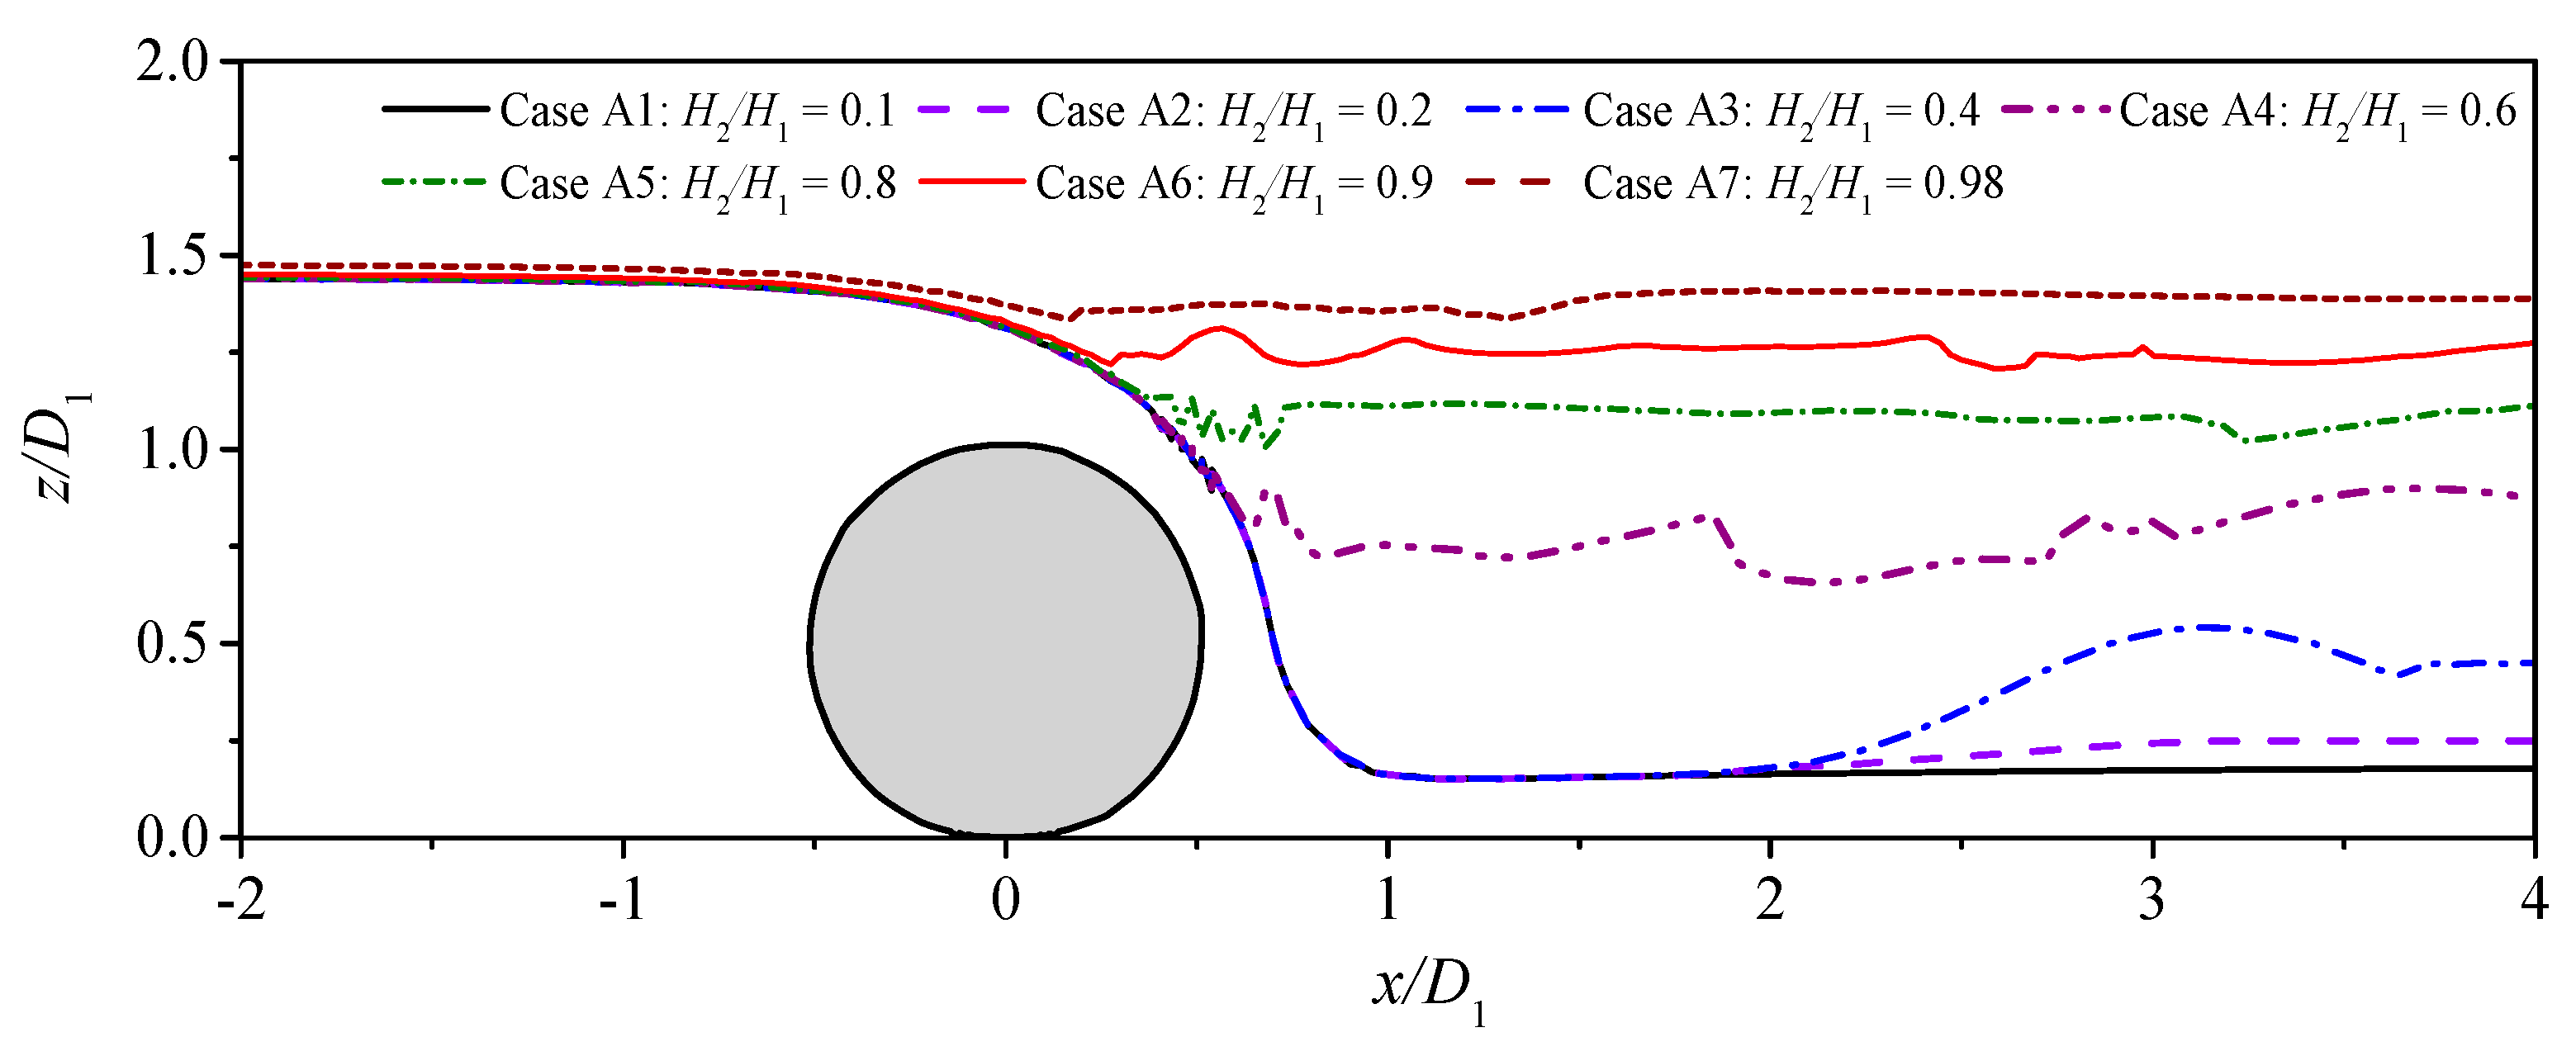
Figure 7 shows the variations of water depths of Case A1–Case A7 (different depth ratios H2/H1). Note that it only shows the simulated water depths in the range of x/D1 = −2.0–4.0, while the downstream boundary is set at x/D1 = 15. When the depth ratio H2/H1 ≤ 0.2, the upstream flow conditions were sub-critical flows, while the downstream conditions were super-critical flows. The water surface dropped rapidly right behind the dam. As the downstream water depth H2 increased, the downstream conditions became sub-critical flows, and the water surface was disturbed by the strong turbulence behind the dam. The disturbance lessened, and the water surface gradually became smoother as it goes downstream.
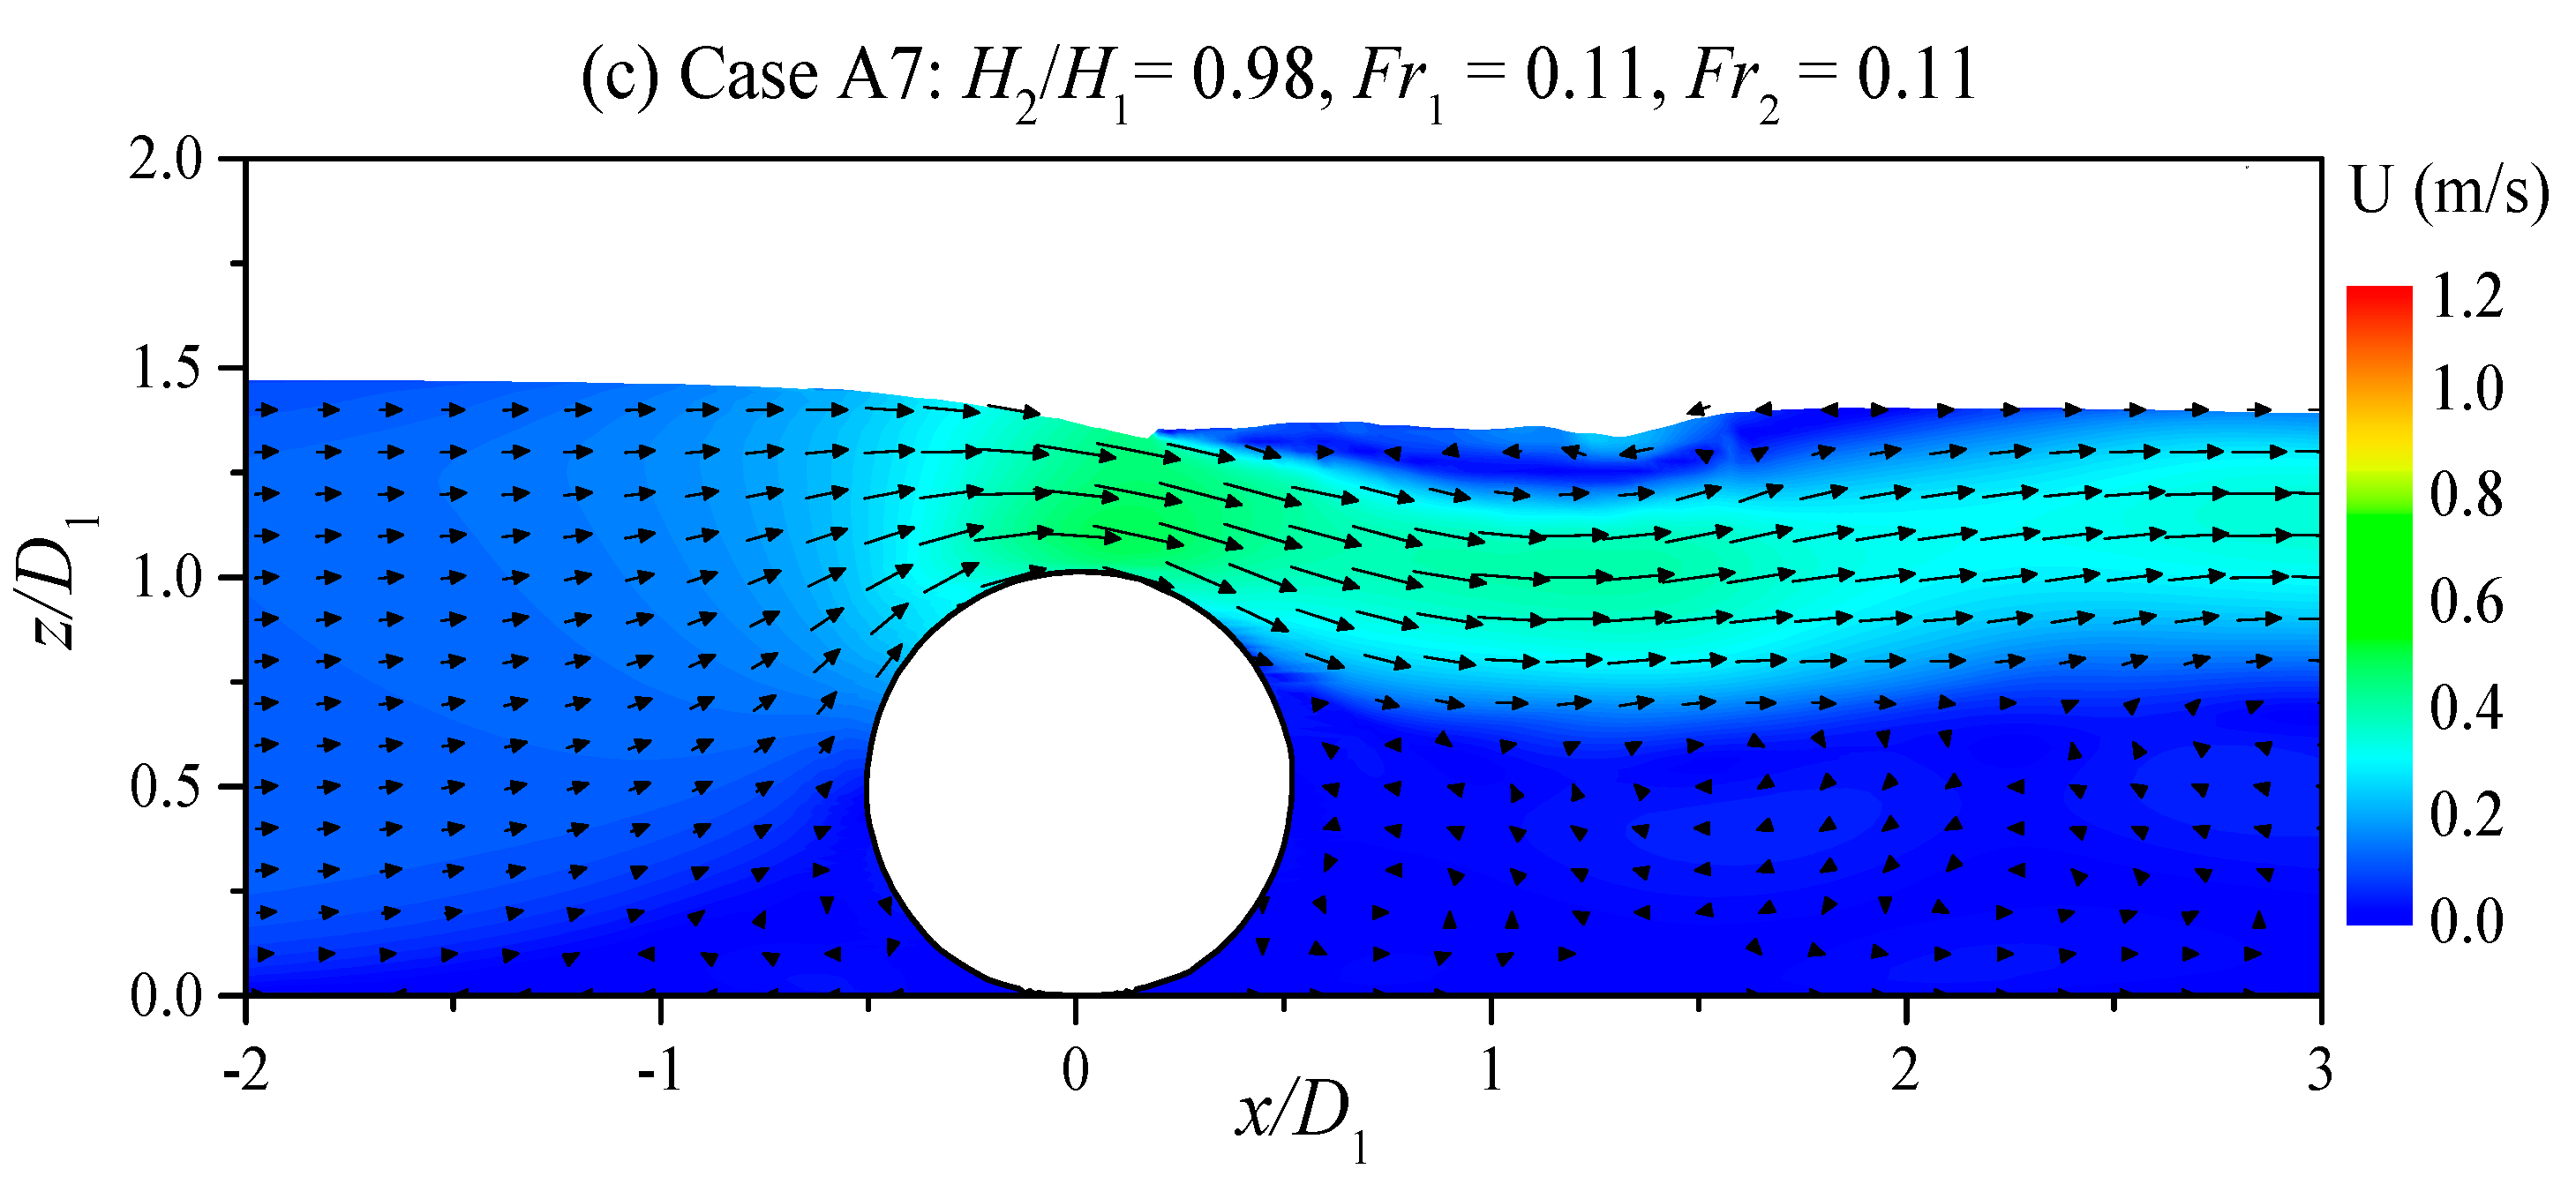
Figure 8 illustrates the time-averaged velocity vectors on the mid-plane of the dam for three different depth ratios, H2/H1 = 0.2, 0.6, and 0.98. The flow conditions distinctly differed when the water depth H2 changed. When the depth ratio H2/H1 = 0.2, there was a downward jet flow on the leeward side of the dam, and the downstream was a super-critical flow. In contrast, a submerged hydraulic jump (a high-speed flow near the channel bed and a reversed flow near the water surface) occurred in the wake of the dam when H2/H1 = 0.6. When the depth ratio H2/H1 = 0.98, the water flowed horizontally over the dam, and the high-speed flow stayed close to the free surface.
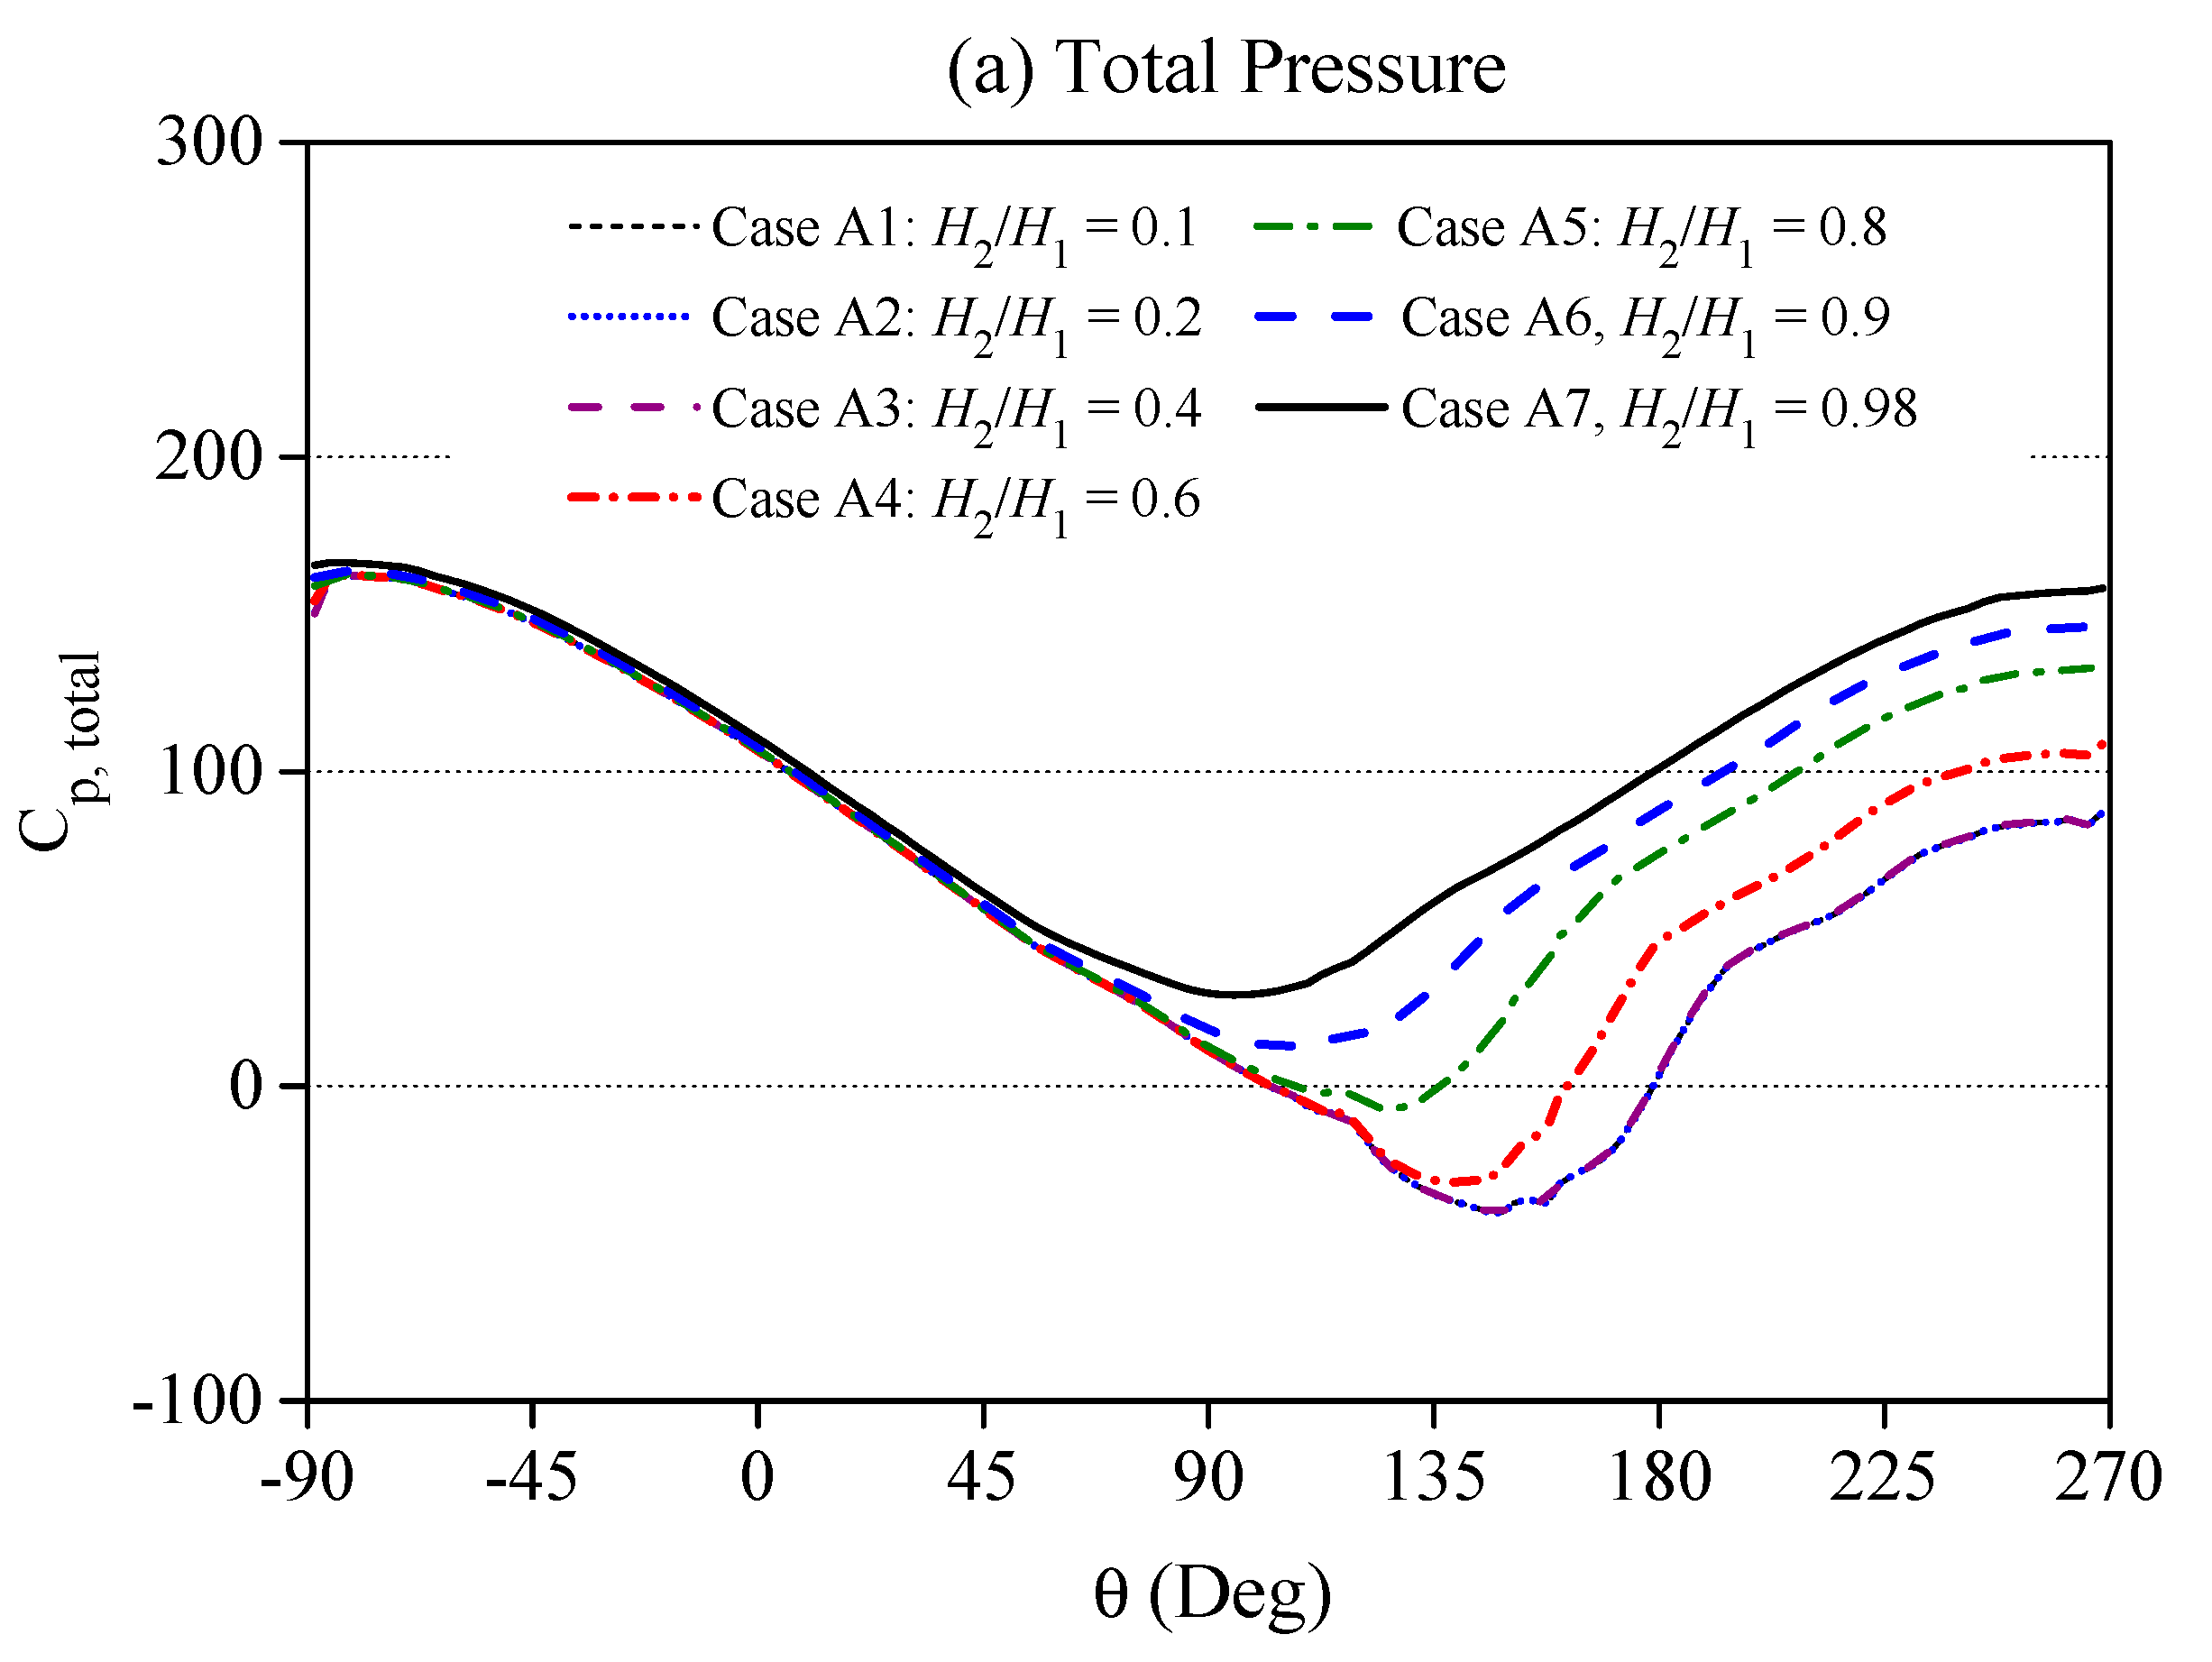
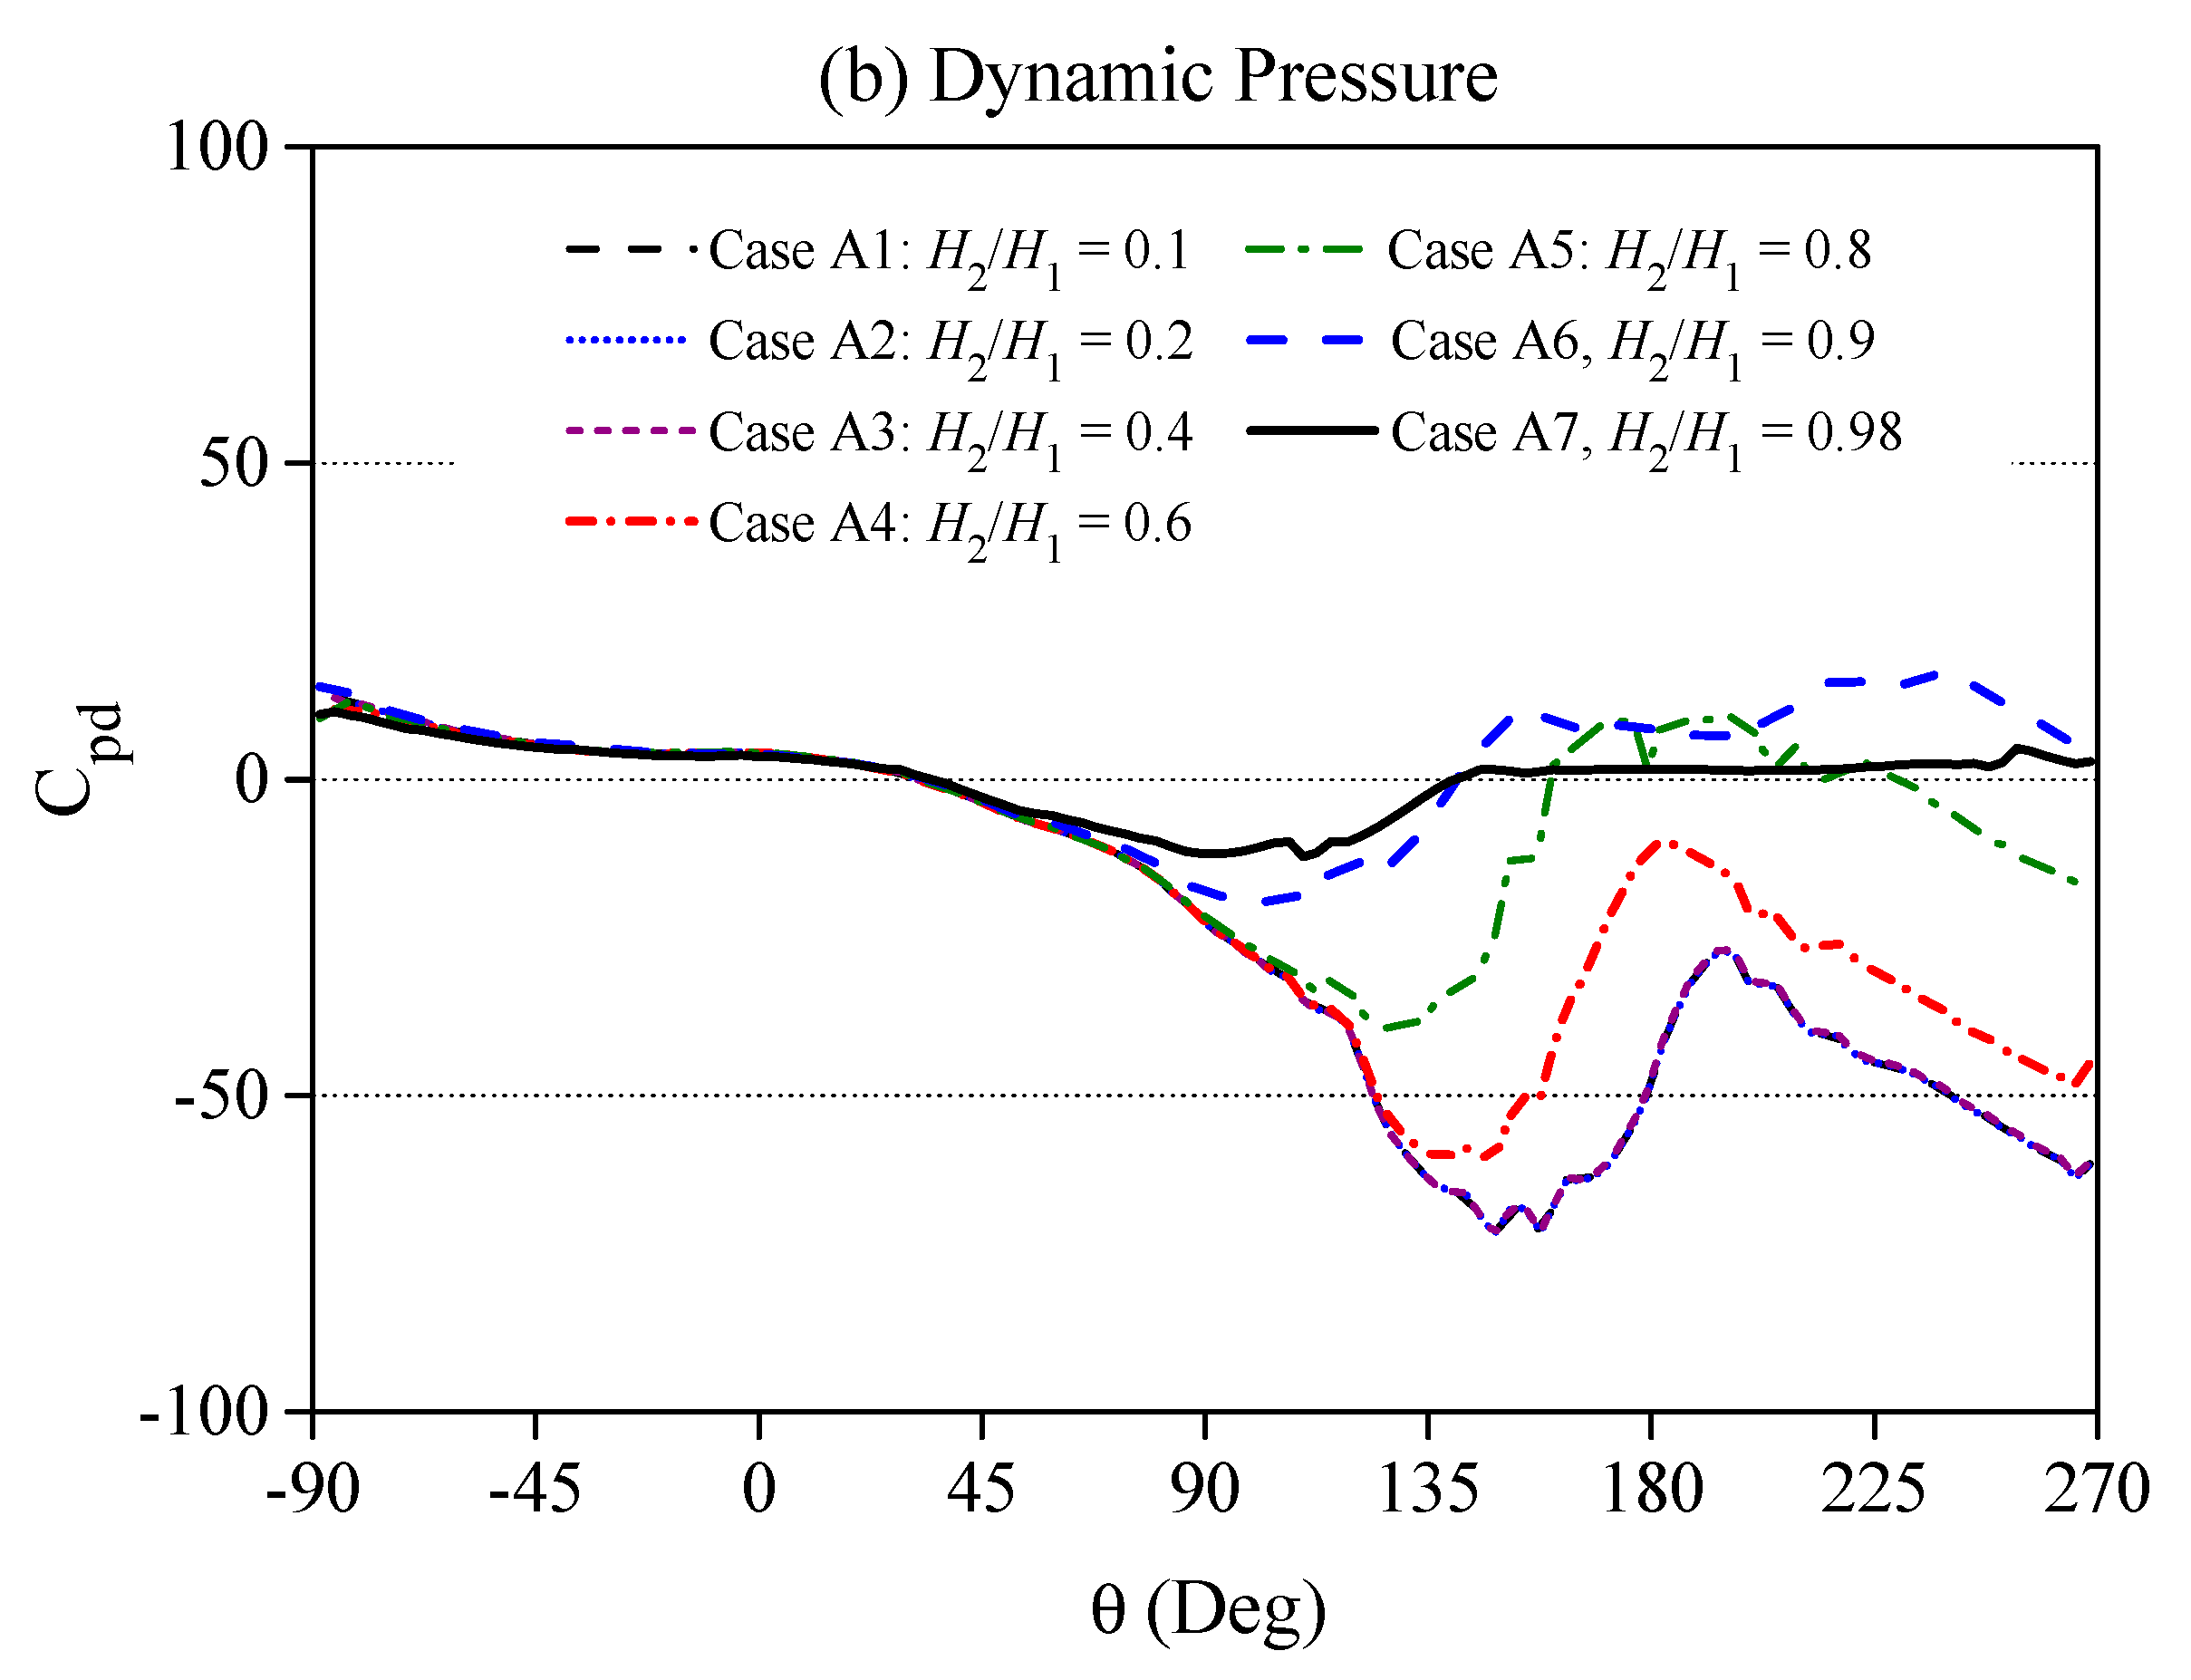
Figure 9 depicts the total, Cp total, and dynamic pressure coefficients, Cpd, on the centerline of the dam surface for different depth ratios. The total and dynamic pressures on the frontal side (θ = −90°–30°) of the dam were identical since the upstream water depths; subsequently, the hydrostatic pressures were the same for different depth ratios. The leeward total pressures increased as the downstream depths increased owing to the hydrostatic pressure. The leeward dynamic pressures for the cases of H2/H1 = 0.1, 0.2, and 0.4 (see Figure 9b) were identical due to the similar downstream flow conditions. The negative dynamic pressure (caused by the nappe flow) on the leeward side of the dam increased as the depth ratio H2/H1 decreased. Notice that the location of the maximum suction shifted from θ = 90° to θ = 150° as the depth H2 decreased due to the change of the flow attachment. The simulated pressure distribution can be used for the structural design of the rubber dams.
Besides Equation (14), the fluid drag of the dam also can be computed by the momentum integration method. In steady, two-dimensional flows, the momentum equation of the channel flow is:
ρ g H 1 2 2 W ρ g H 2 2 2 W F D = ρ [ 0 H 2 V 2 2 ( z ) d A 0 H 1 V 1 2 ( z ) d A ]
where FD is the drag acting upon the water flow by the dam; V1(z) and V2(z) are the stream-wise velocities up- and downstream of the dam, respectively. Assuming that the up- and downstream are both uniform flows, and the bed friction is negligible, the drag is equal to:
F D = ρ g W 2 ( H 1 2 H 2 2 ) + ρ Q ( V 1 V 2 )
where the discharge rate in the channel Q = V1H1W = V2H2W. The first term on the right-hand side of Equation (20) represents the difference between the up- and downstream hydrostatic pressures, and the second term on the right-hand side is the net momentum fluxes.
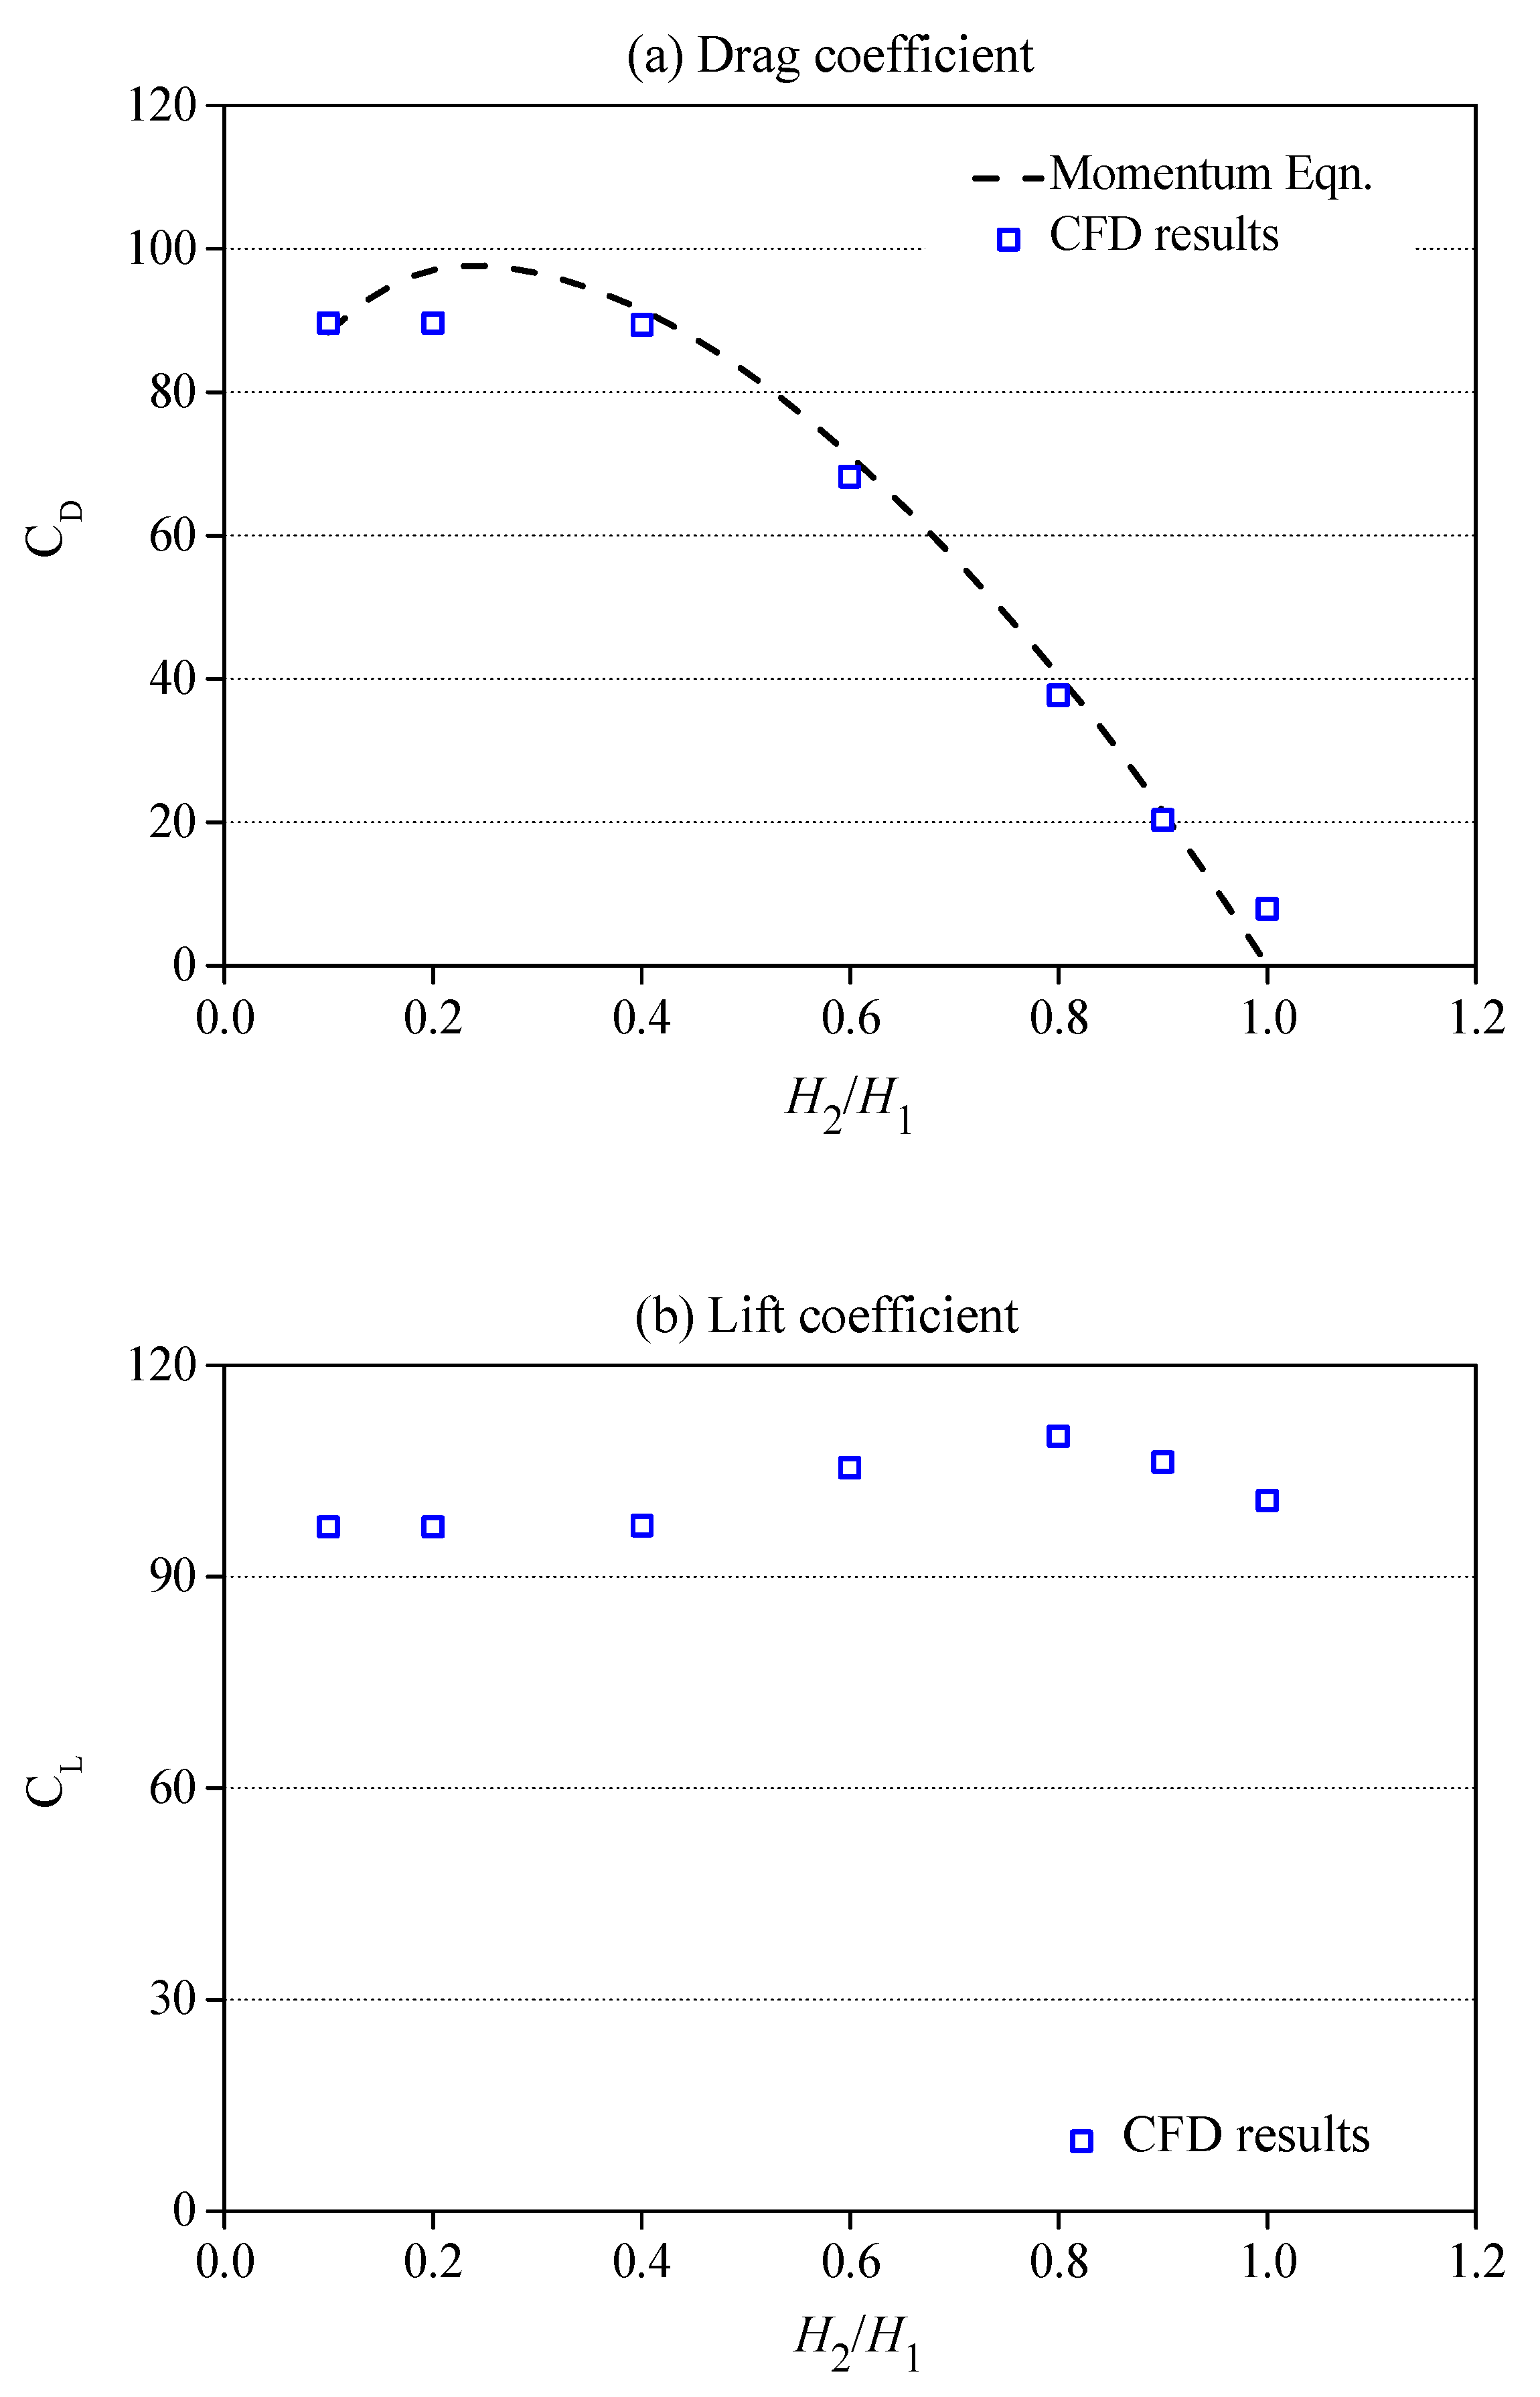
The time-averaged drag coefficients, computed by Equation (20), were plotted against the depth ratio H2/H1 in Figure 10a. The average relative error between the drag coefficients computed by the momentum integration method and from the simulated total pressures was 6.5%. This validated the present LES model to compute the drag of the dam. Notice that the drag coefficients (from the LES model) were almost the same (CD = 89.5) when the depth ratio H2/H1 ≤ 0.40. This large drag was caused by the difference between the up- and downstream hydrostatic pressures. When H2/H1 > 0.40, the drag coefficient CD (and the difference of hydrostatic pressure) steadily decreased with the increasing downstream water depth H2.
Nonetheless, it is difficult to apply the momentum integration method to compute the lift coefficient of the dam. Figure 10b reveals that the time-averaged lift coefficients, computed from the LES results, were in the range of CL = 97–110. The dimensionless buoyancy CB = 88.6 for different downstream depths; therefore, the lift coefficients without the buoyancy (without the hydrostatic pressure) CL – CB = 8.5–21.4. The reason that the lift coefficients of large depth ratios (H2/H1 > 0.60) were slightly larger than those of small depth ratios (H2/H1 ≤ 0.40) is due to the maximum negative pressures occurred on the top side, rather than on the leeward side of the dam when downstream depth H2 was large.
The height of full-size prototype rubber dams is in the range of 1.0–6.0 m; hence, the Reynolds number is much larger than that of a scaled-down model dam. In order to examine the effect of Reynolds number Re = V1D1/ν on the hydrodynamic loading of the circular dam, the surface pressure on a circular cross-section, with the diameter D1 = 3.0 m, was simulated by the present LES model. The scale ratio of the full-size dam to the model dam is 39.5. The up- and downstream water depths were set as: H1 = 4.30 m and H2 = 0.41 m; the up- and downstream velocities V1 = 0.45 m/s and V2 = 4.72 m/s. Hence, the depth ratios, H2/H1 = 0.095, H1/D1 = 1.43 and the Froude number Fr1 = 0.07, were close to those of the validation case (Case A1). The upstream was a sub-critical flow, and the downstream was a super-critical flow.
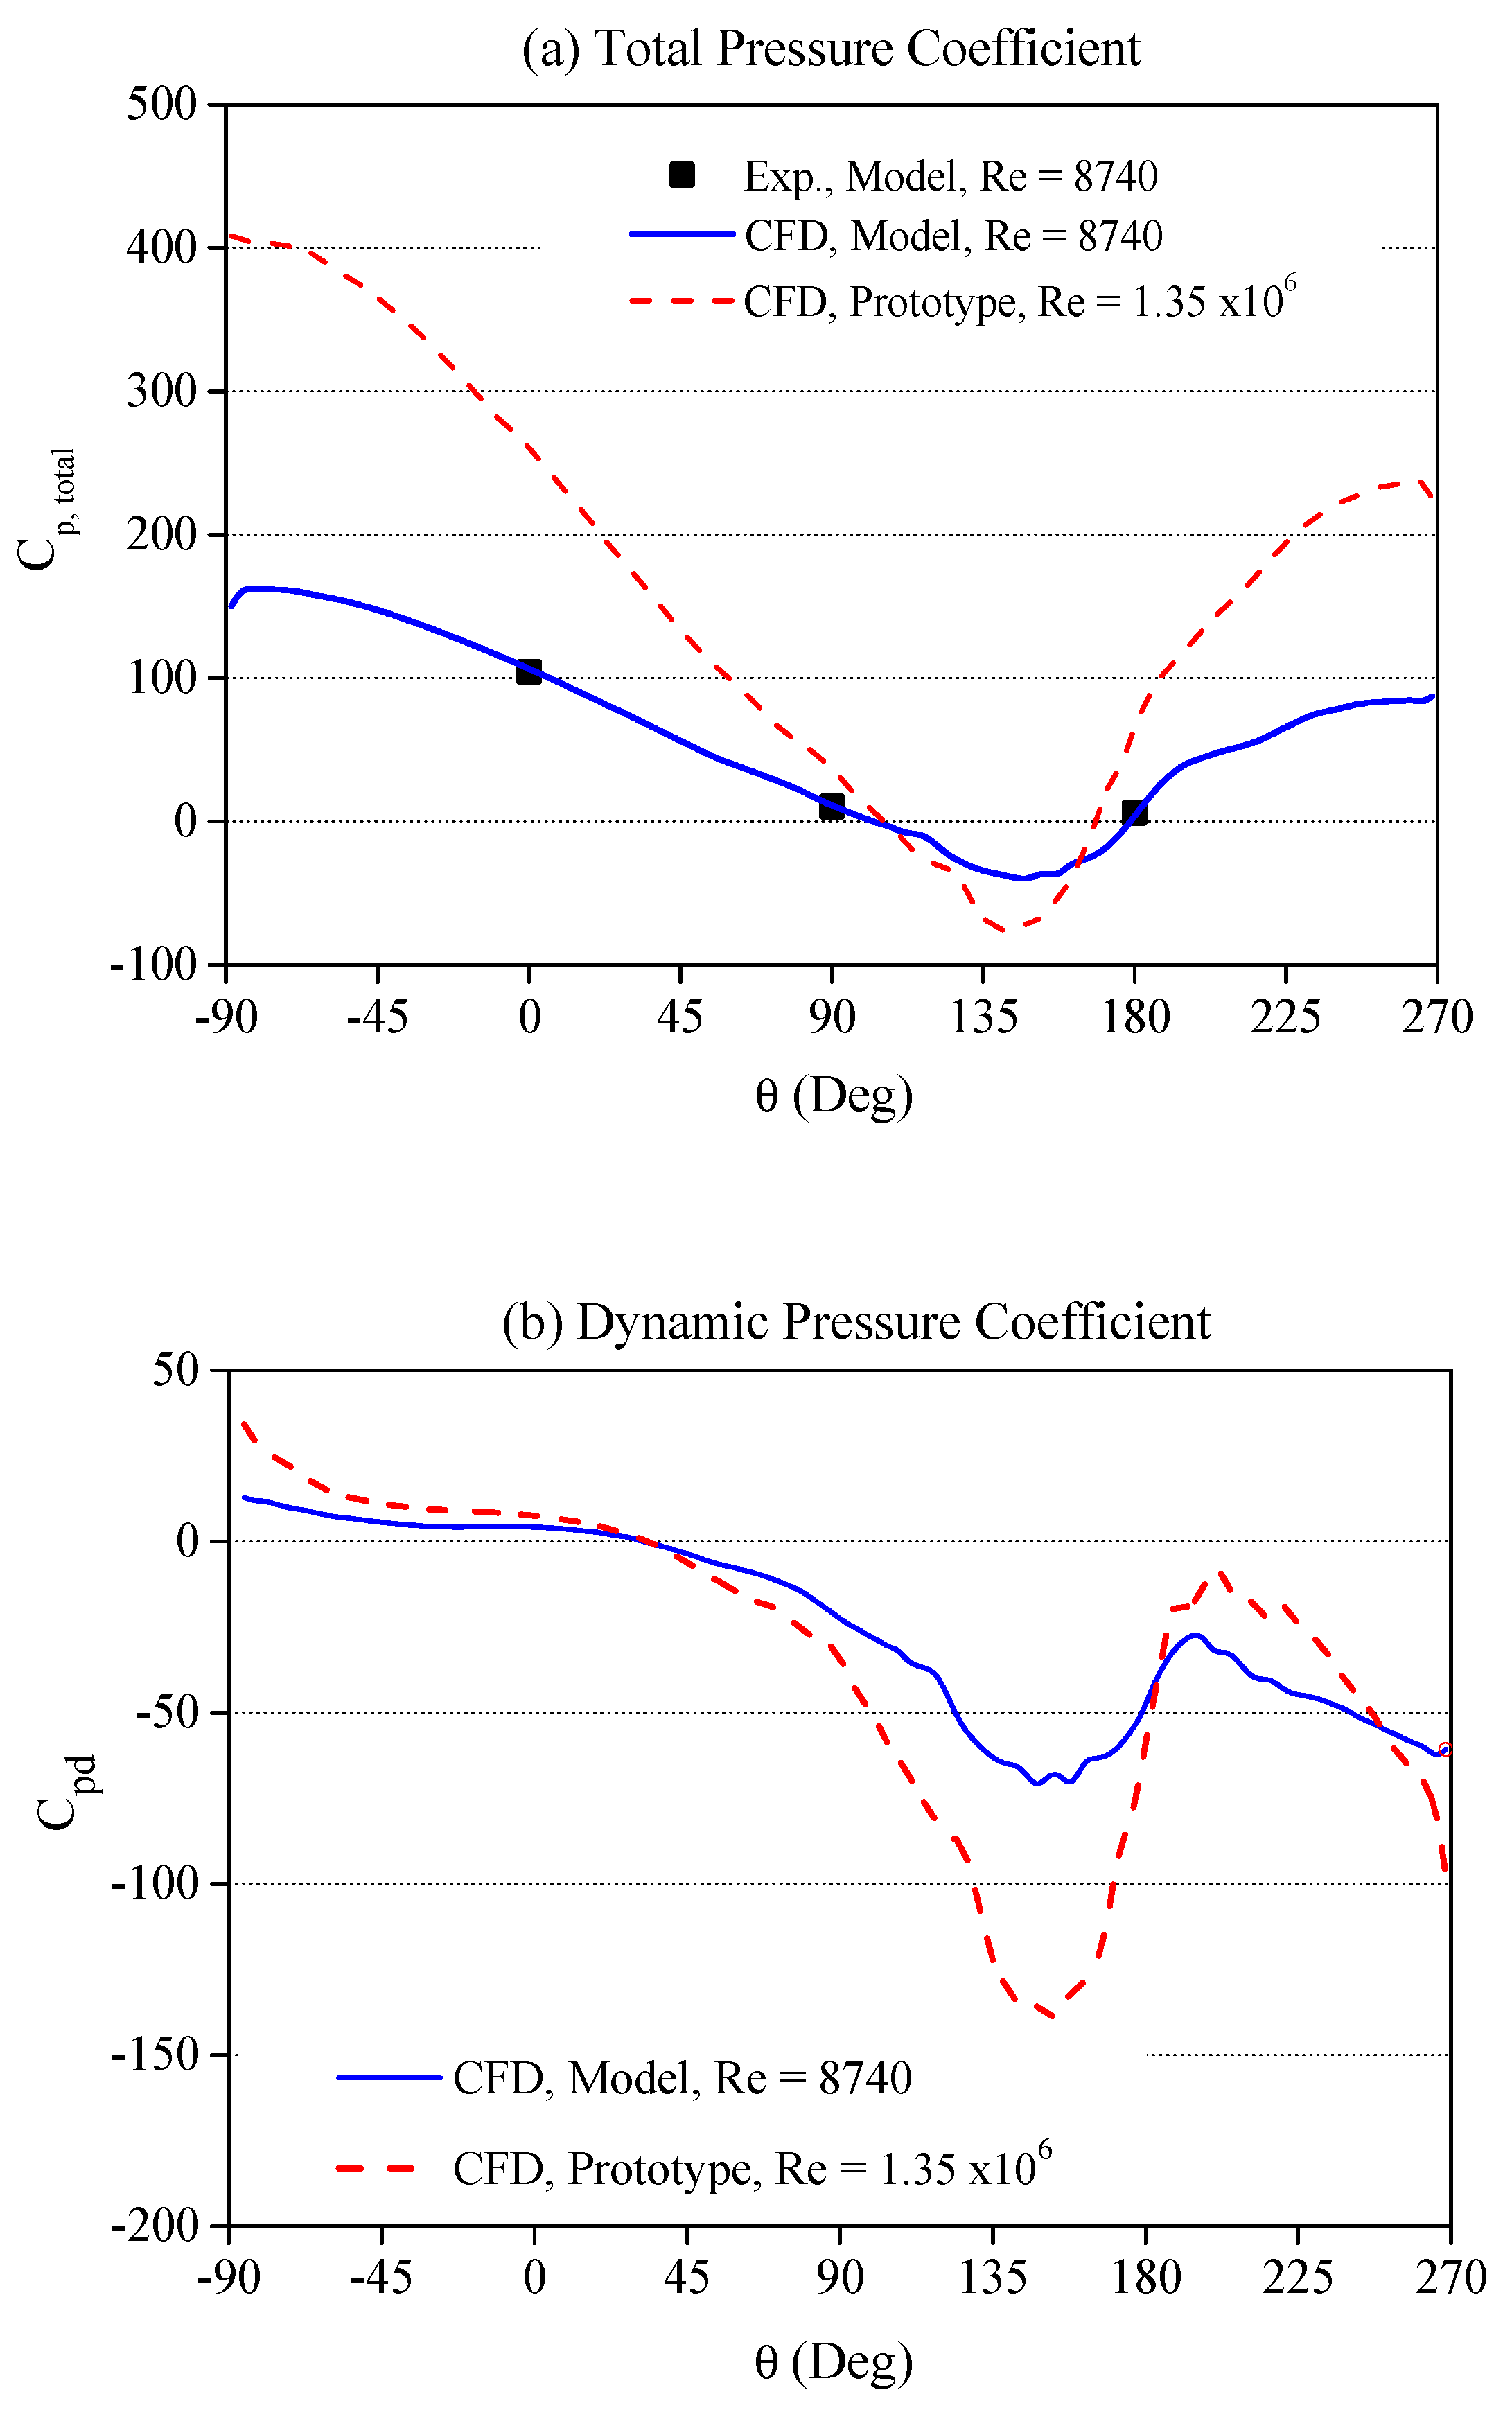
Figure 11 compares the simulated surface pressures on the centerline of the scaled-down flume model (Re = 8740) and that of the full-size dam (Re = 1.35 × 10⁶). As can be seen in Figure 11a, the total pressure in front of the full-size prototype dam was much larger than that of the scaled-down model owing to the difference in hydrostatic pressure. Figure 11b illustrates that the maximum suction pressure occurred at the angular location of 145° (on the leeward side of the dam). In contrast, the suction pressure of the prototype dam was much larger than that of the scaled-down model, resulting from the velocity of the nappe flow over the prototype dam was larger than that of the scaled-down model. Furthermore, the drag and lift coefficients (CD = 249 and CL = 272) of the prototype dam were different from that of the scaled-down model (CD = 89.5 and CL = 97). The lift coefficients without the dimensionless buoyancy were CL–CB = 8.5 and 43.9 for scaled-down and prototype dam, respectively. In other words, the dimensionless force coefficients obtained from the scaled-down model experiments are not applicable to the full-size circular dams due to the Reynolds number effect. The present numerical model can be used to compute the dynamic loading of the full-size dams for the purpose of structural design.

4.2. Discharge Coefficient

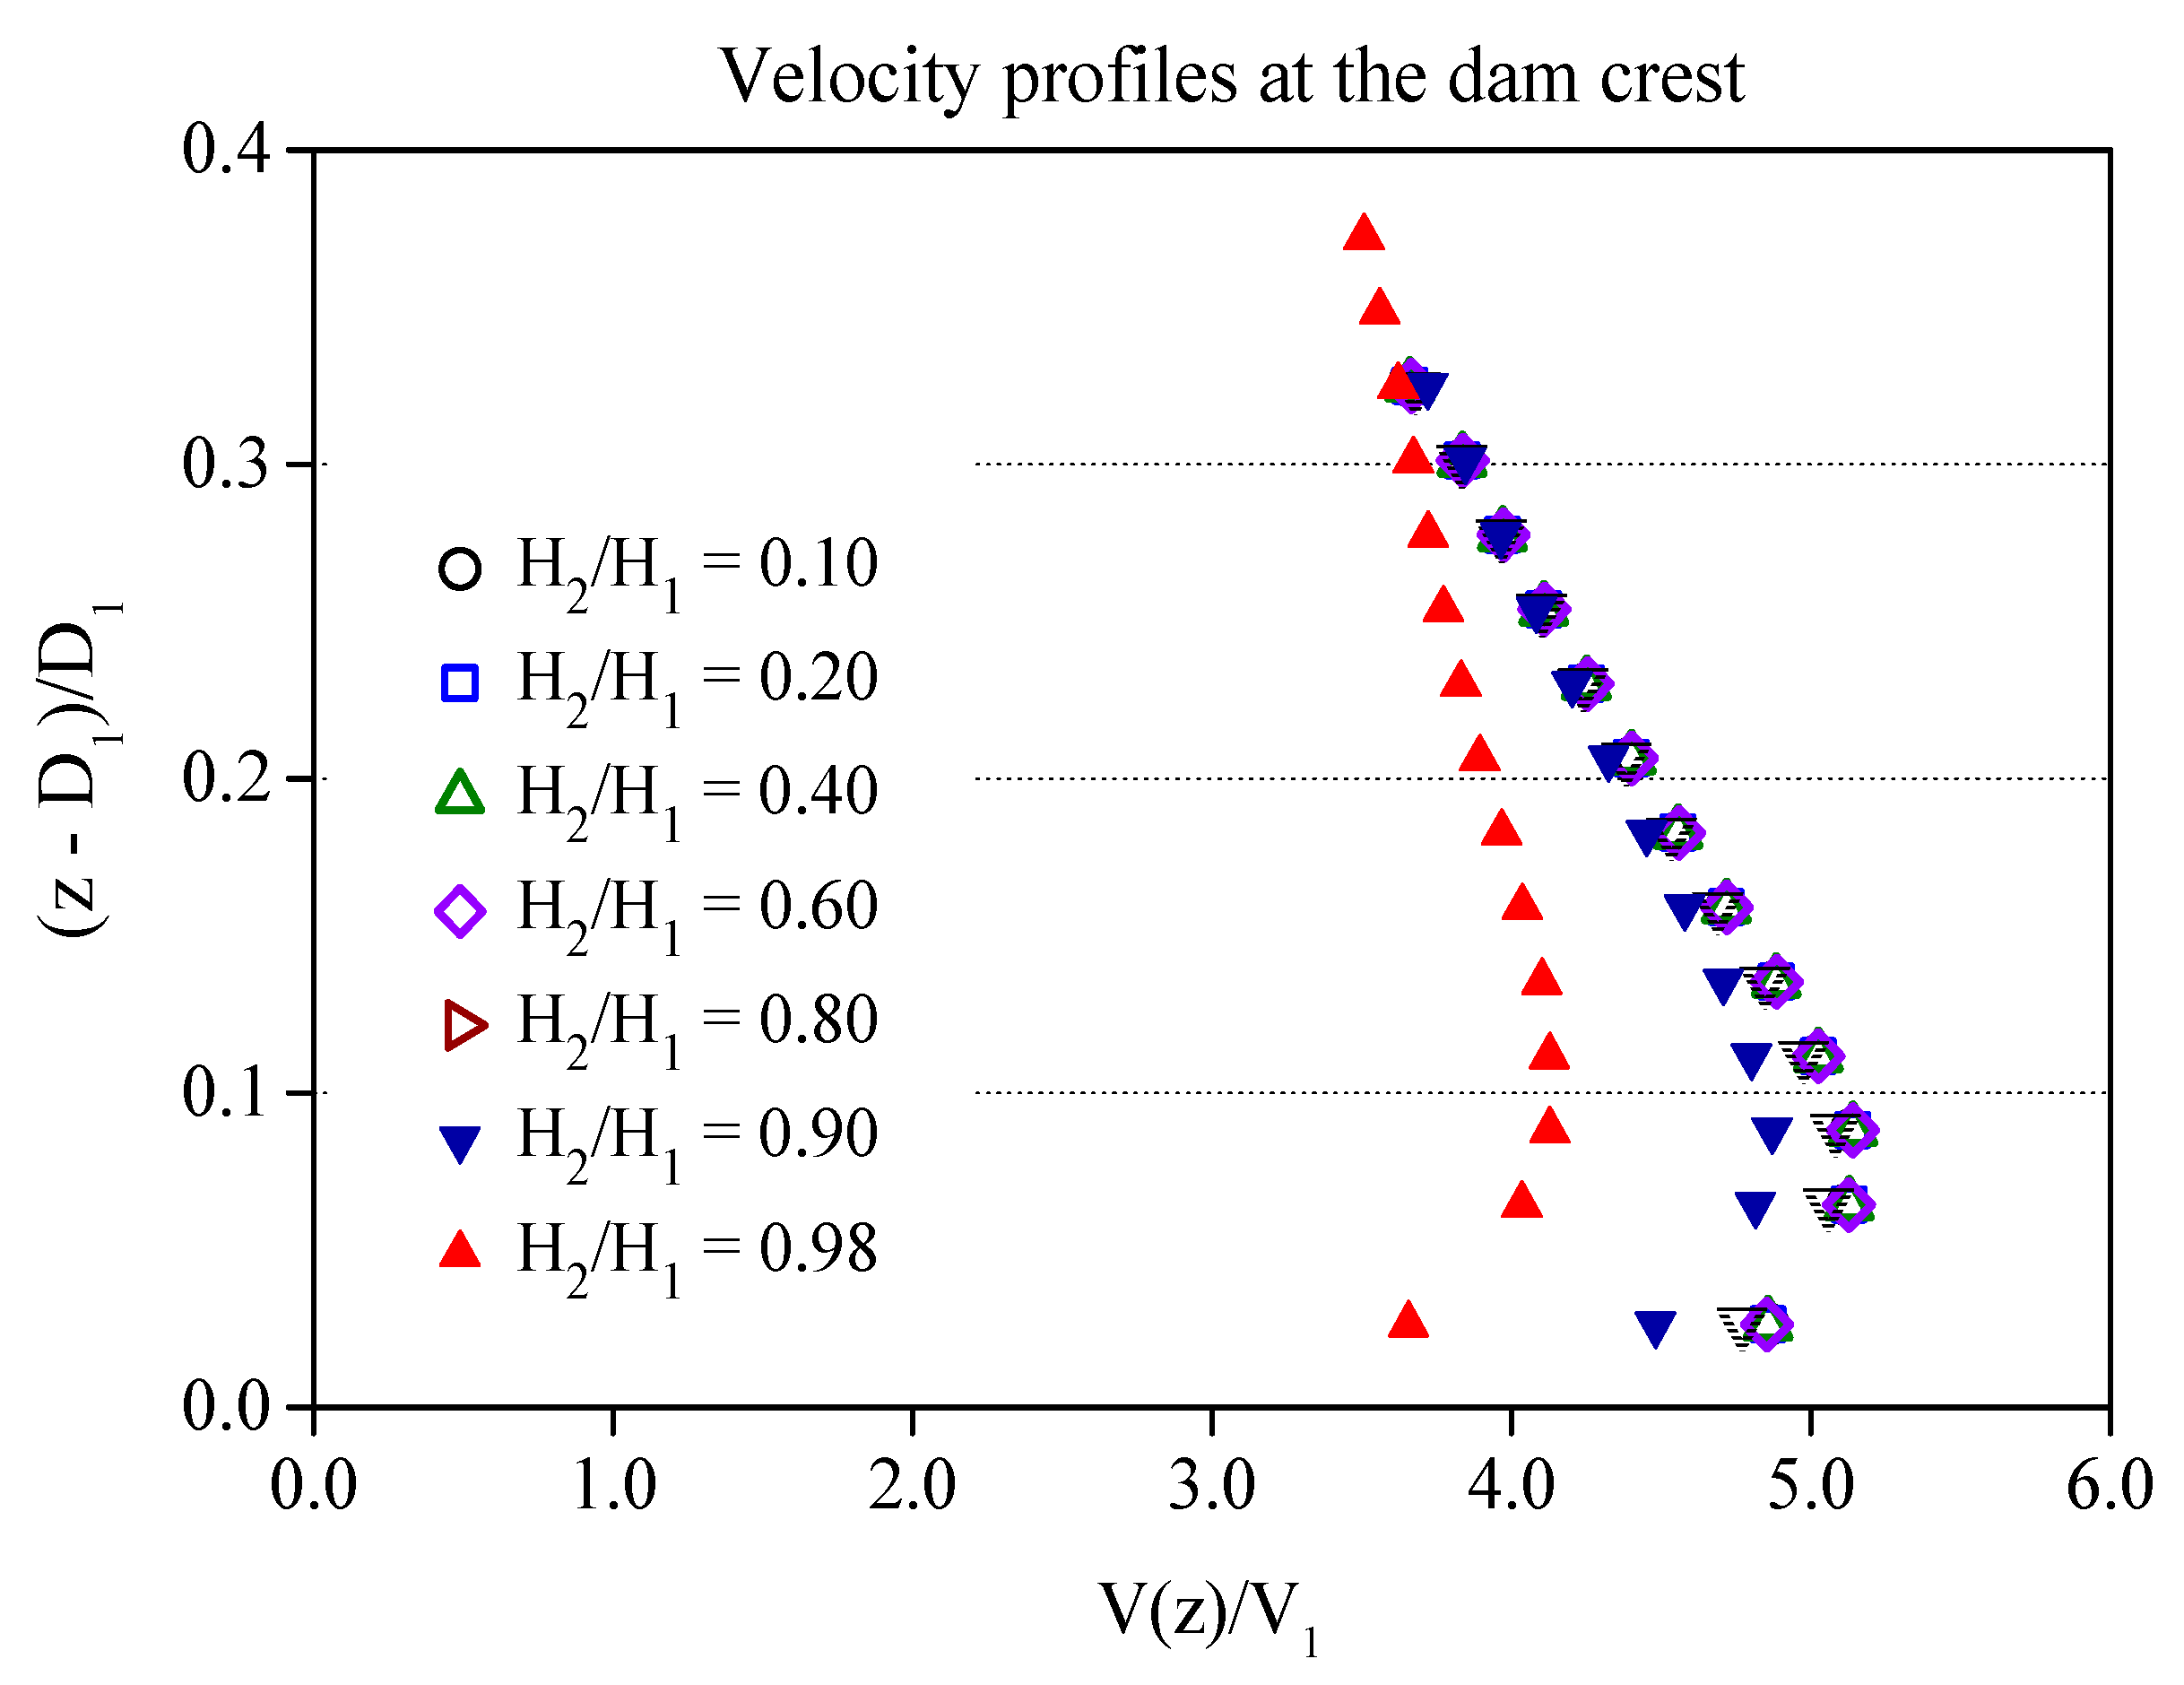
One of the advantages of circular-crested dams is they can be used for flow measurement. The profiles of time-averaged horizontal velocity above the crest (x = 0) of the circular dam under different depth ratios are shown in Figure 12. The velocity profiles were similar to the experimental results of Heidarpour and Chamani [11] and close to each other when the depth ratio H2/H1 < 0.90. Notice that the velocities, due to the boundary layer at the dam surface, decreased as it approached the dam crest. In contrast, the horizontal velocities became smaller for the depth ratio H2/H1 = 0.90 and 0.98, under the same upstream flow condition. The depth-averaged velocity Vc and water depth hc above the dam crest are used to compute the Froude number at the dam crest, Frc = Vc/(ghc)0.5 = 0.96 and 0.81 when H2/H1 = 0.90 and 0.98, respectively. In other words, they did not reach the critical flow condition at the dam crest.
The discharge rates, Q, were computed by integrating the horizontal velocities above the dam crest. The discharge coefficient then can be computed by the following equation:
C d = Q g 1 / 2 ( 2 3 h u ) 3 / 2 W
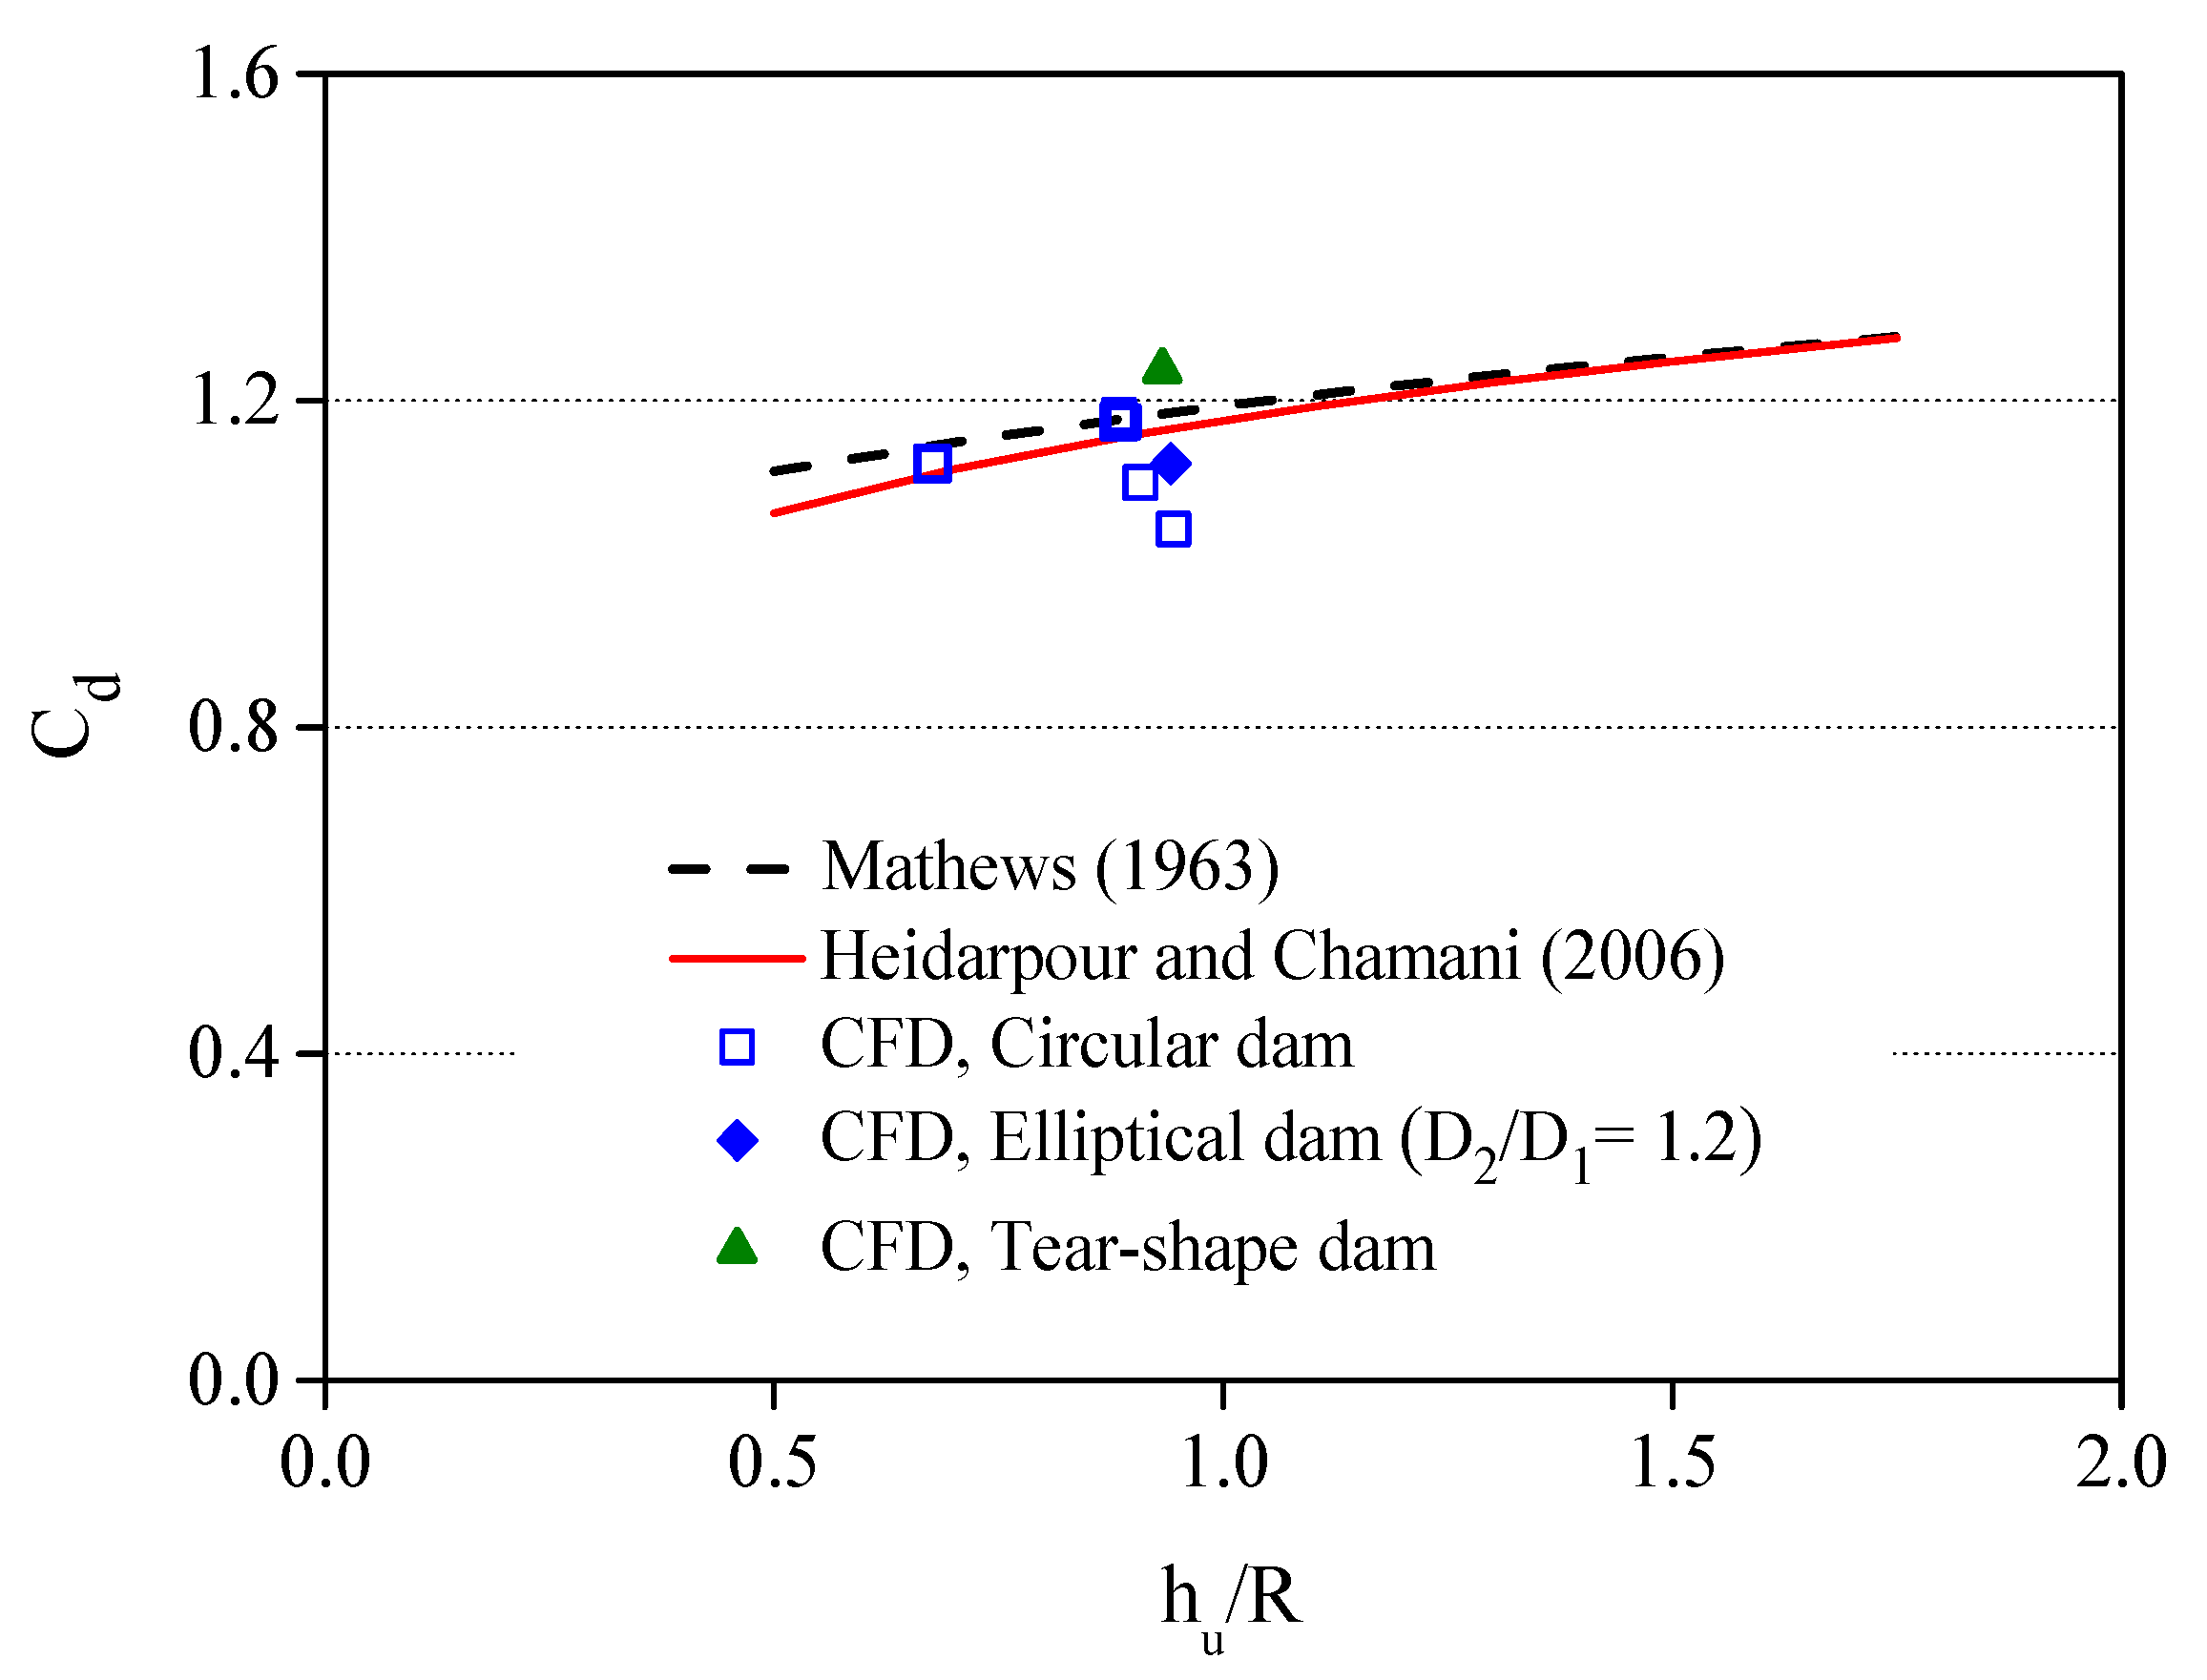
where hu is the upstream (x/D1 = −5) head above the dam crest. The discharge coefficients of the circular dam are plotted against the upstream head in Figure 13. The formulae suggested by Heidarpour and Chamani [11] and Matthew [31] for the discharge coefficients are also plotted in the figure for comparison. As can be seen, the discharge coefficient Cd = 1.18 for H2/H1 ≤ 0.80 is very close to the curves suggested by Heidarpour and Chamani [11] and Matthew [31]. However, the discharge coefficients (Cd = 1.10 and 1.04) for the cases of H2/H1 = 0.90 and 0.98 are lower than the curves. The reduced discharge coefficient is resulting from the flow condition above the dam crest not being critical flow when H2/H1 0.90. In other words, the formulae for discharge coefficients will over-estimate the discharge rate when the downstream water depth close to the upstream depth (the Froude number at the dam crest, Frc < 1.0).
The compressibility of an inflatable rubber dam can be analyzed by using the bulk modulus Ev of the dam body:
Δ P E v = Δ V V
where ΔP is the pressure change, and ΔV/V is the change rate of the total volume V. If the rubber dam is water-inflatable, the bulk modulus of the dam body will be close to water Ev = 2.19 × 10⁹ N/m2. When the pressure variation on the dam surface is ΔP = 10,000 Pa (about 1 m depth of water over the dam), the change rate of dam volume is about ΔV/V = 4.4 × 10⁻⁶. If the rubber dam is air-inflatable, the bulk modulus of the dam body will be around Ev = 1 × 10⁵ N/m2 (close to air). Under the same pressure change ΔP = 10,000 Pa, the change rate of the dam volume is about ΔV/V = 10%. Therefore, the dam’s height will decrease due to the hydrostatic pressure, and the dam shape becomes an elliptical when water flows over the dam.
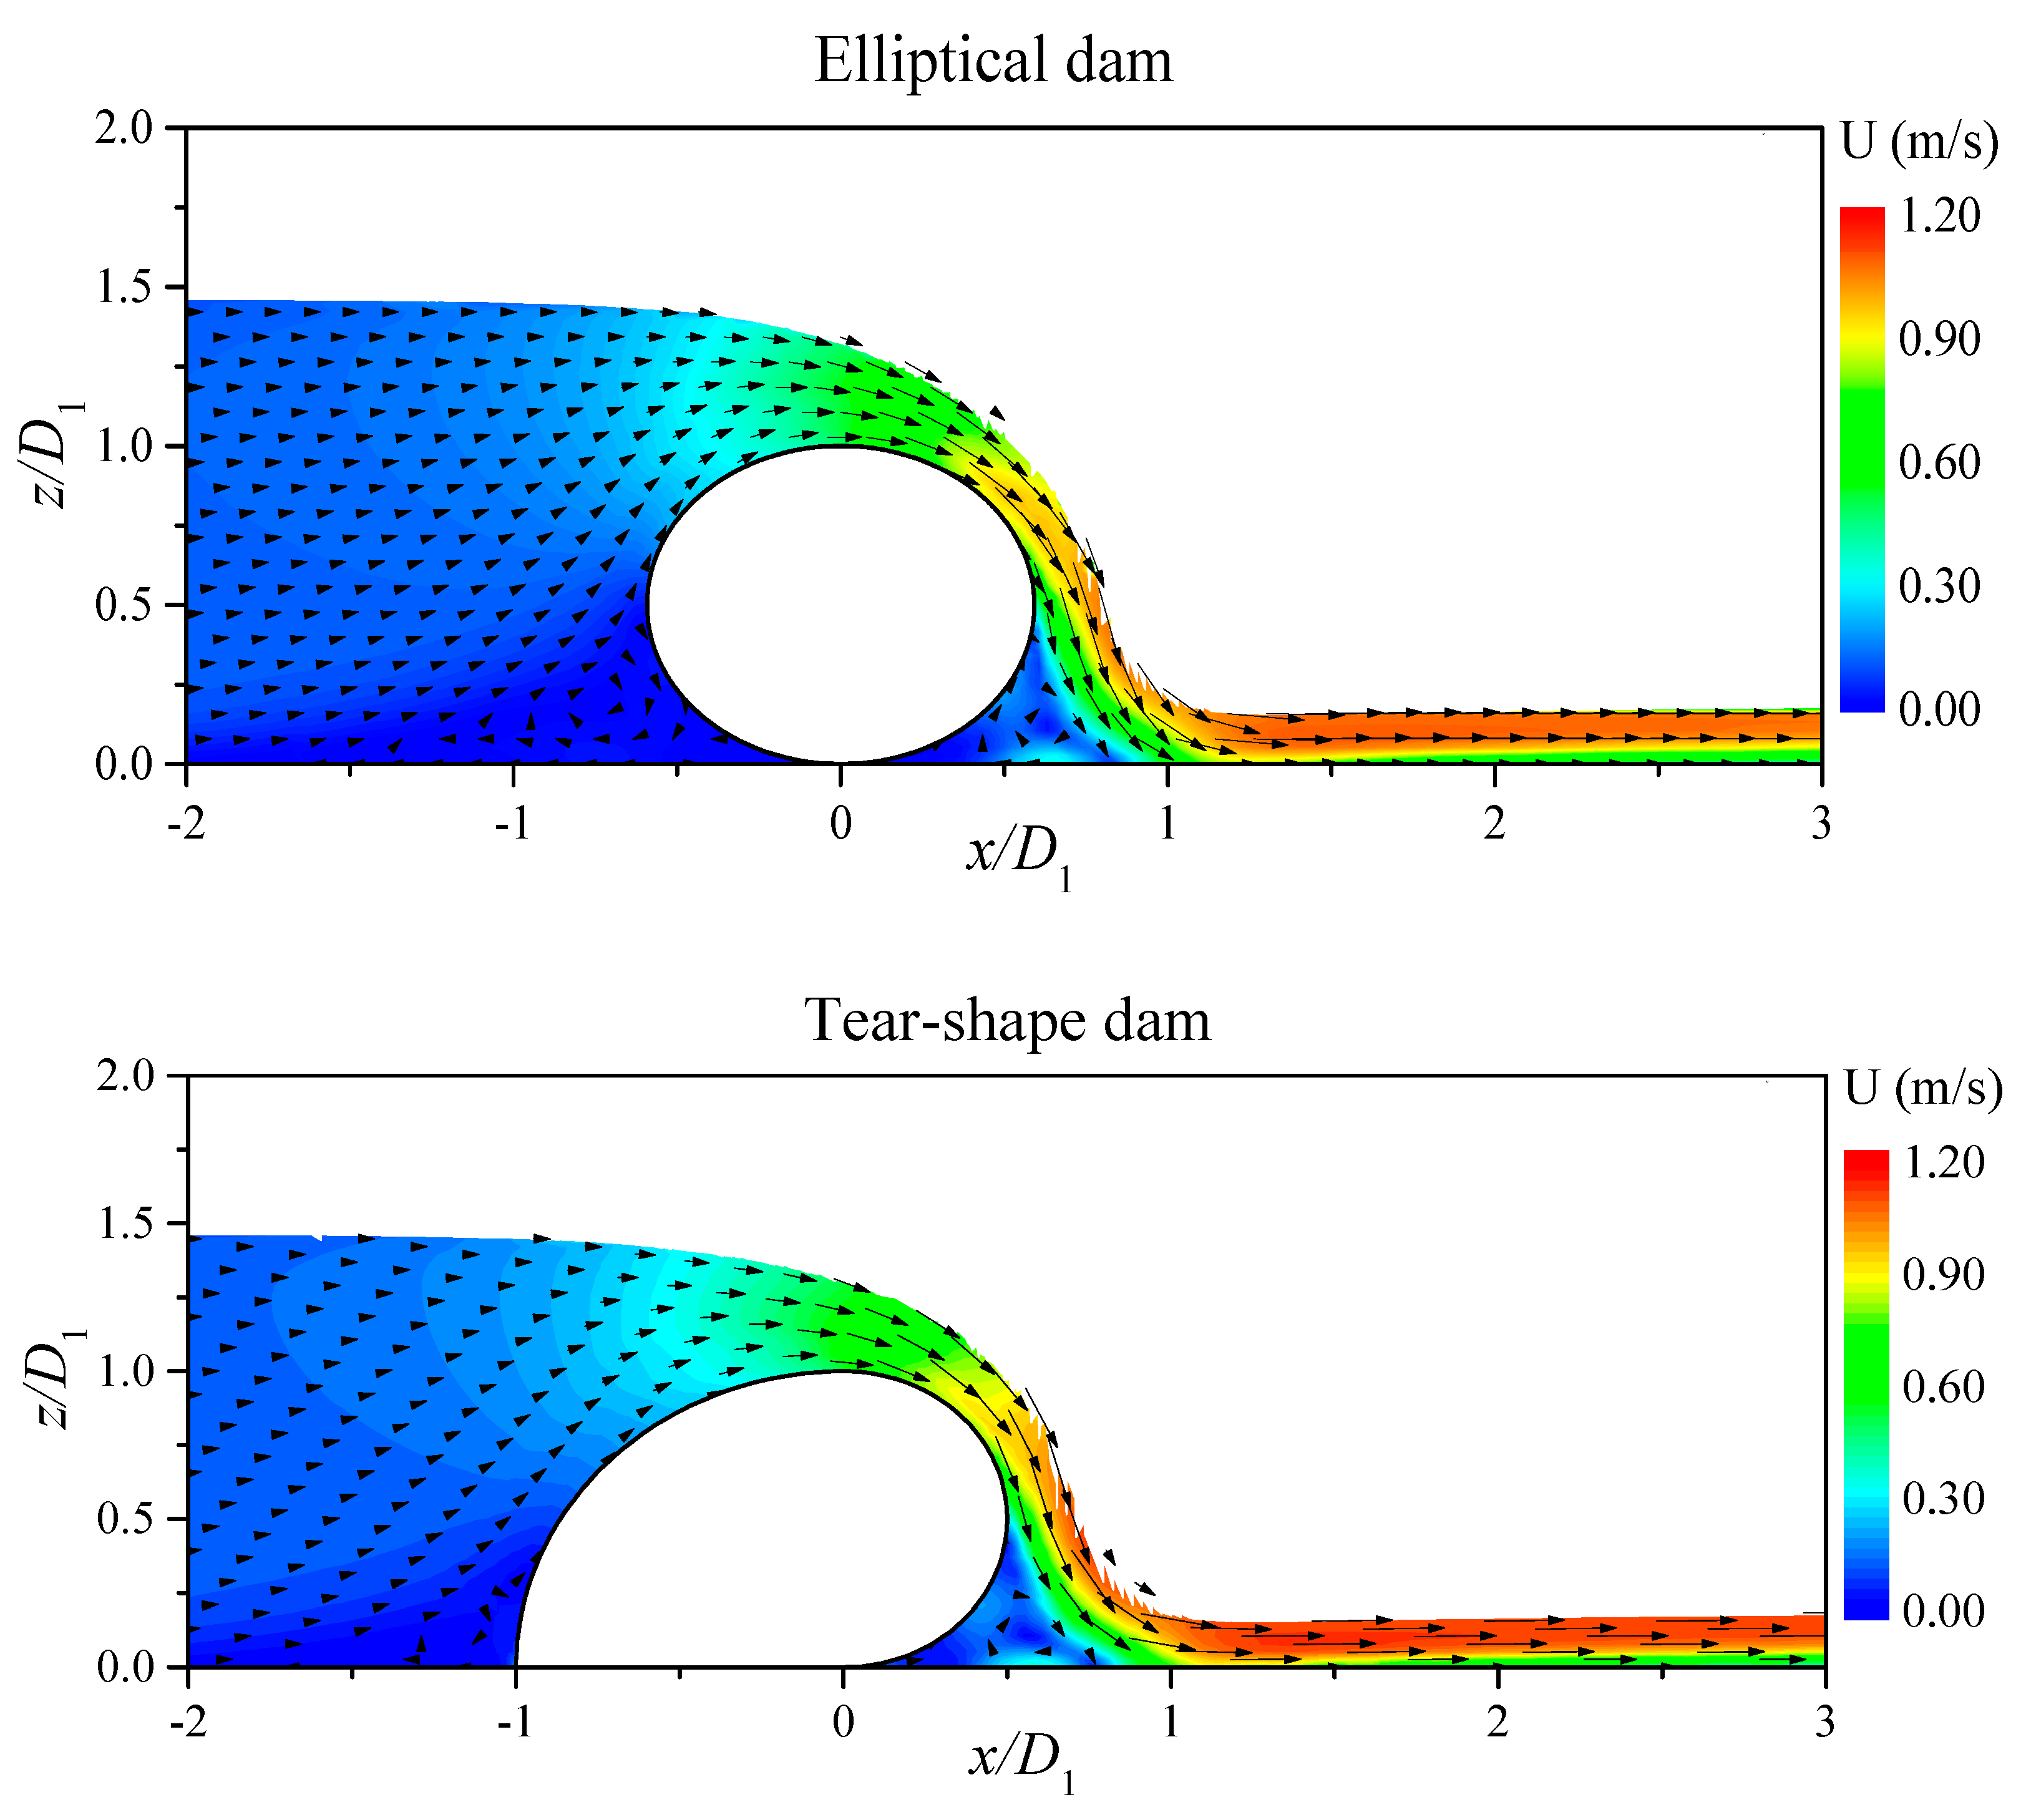
Therefore, the present numerical model is used to simulate free-surface flows over rubber dams of two different shapes. The first one is a smooth, cylindrical dam with an elliptical cross-section. The vertical diameter (height) of the elliptical dam is D1 = 0.076 m, and the horizontal diameter D2 = 1.2D1 = 0.091 m. The second one is a tear-shape dam, with height D1 = 0.076 m and length L = 0.114 m, with the frontal part a concave curve and the leeward part a semi-circular shape. The upstream water depth is 0.109 m, velocity is 0.115 m/s, and the downstream water depth is 0.0104 m, identical to the validation case (Case A1).
The simulated water depths over the circular dam, elliptical dam (D2/D1 = 1.2), and tear-shape dam are compared in Figure 14. Due to the leeward curves of the circular and tear-shape dams are the same, the nappe flows over these two dams are quite similar. Nonetheless, the water surface on the leeward part of the elliptical dam is different from that of the circular dam. The time-averaged velocity vectors over elliptical and tear-shape dams are shown in Figure 15. As can be seen, the downstream flow fields of the elliptical and tear-shape dams are very similar. In contrast, the tear-shape dam did not have the re-circulating flows in front of the dam, such as those in the circular and elliptical dams. In other words, the tear-shape dam could prevent sediment accumulation upstream of the dam.

5. Concluding Remarks

This study incorporated a large eddy simulation (LES) model and the volume of fluid (VOF) method to investigate the free-surface flows over rigid circular-crested dams of different shapes. The simulated water depth and surface pressures were validated by the results of flume experiments. The numerical model was then used to examine the influences of water depth, the Reynolds number, and dam shape on the hydrodynamic forces and discharge coefficients of circular rubber dams.
The simulation results revealed that the drag coefficient increased as the downstream water depth H2 decreased, owing to the difference in hydrostatic pressures of the up- and down-stream flows. In addition, the drag coefficients calculated from the simulated surface pressures were very close to the drag coefficients computed by the momentum integration method. On the other hand, the lift coefficient increased slightly when the downstream depth H2 increased, resulting from the negative uplift pressure on the dam crest. Furthermore, the dimensionless force coefficients of full-size dams are larger than those of scaled-down dam models due to the difference in the Reynolds number.
The discharge coefficients, computed from the time-averaged velocities over the crest of the circular and elliptical dams, agree well with the formulae suggested by Hager [8] and Heidarpour and Chamani [11] when the downstream water depth H2/H1 < 0.9. Nevertheless, their formulae over-estimate the discharge coefficient when the downstream depth H2/H1  0.90, owing to the flow condition above the dam crest not being critical flow. In addition, the discharge coefficient of the tear-shape dam is slightly larger than those of circular dams. In brief, the present numerical model can simulate the hydrodynamic loading and discharge rate of full-size rubber dams of any shape to avoid the scale effect of flume experiments.

Author Contributions

Conceptualization, supervision, project administration, writing, review and editing, funding acquisition: C.-R.C.; Methodology and software: T.-R.W.; Validation, formal analysis, visualization, investigation: T.T.T.T.; All authors have read and agreed to the published version of the manuscript.

Funding

The funding was from the Ministry of Science and Technology (MOST) of the Republic of China, Taiwan, under grant no. 107-2221-E-008-016.

Data Availability Statement

The experimental and numerical results are available when requested.

Conflicts of Interest

The authors have no conflict of interest.

References

  1. Ramamurthy, A.S.; Vo, N.-D. Characteristics of Circular-Crested Weir. J. Hydraul. Eng. 1993, 119, 1055–1062. [Google Scholar] [CrossRef]
  2. Zhang, X.Q.; Tam, P.W.M.; Zheng, W. Construction, operation, and maintenance of rubber dams. Can. J. Civ. Eng. 2002, 29, 409–420. [Google Scholar] [CrossRef] [Green Version]
  3. Saleh, A.F.M.; Mondal, M.S. Performance evaluation of rubber dam projects of Bangladesh in irrigation development. Irrig. Drain. 2001, 50, 237–248. [Google Scholar] [CrossRef]
  4. Chanson, H. A review of the overflow of inflatable flexible membrane dams. Aust. Civ. Eng. Trans. 1997, 39, 107–116. [Google Scholar]
  5. Wu, P.-H.; Plaut, R. Analysis of the vibrations of inflatable dams under overflow conditions. Thin-Walled Struct. 1996, 26, 241–259. [Google Scholar] [CrossRef] [Green Version]
  6. Chanson, H.; Tam, P.W.M. Discussion and Closure: Use of Rubber Dams for Flood Mitigation in Hong Kong. J. Irrig. Drain. Eng. 1998, 124, 181–184. [Google Scholar] [CrossRef]
  7. Chanson, H. Hydraulics of rubber dam overflow: A simple design approach. In Proceedings of the 13th Australasian Fluid Mechanics Conference, Melbourne, Australia, 13–18 December 1998; pp. 255–258. [Google Scholar]
  8. Hager, W.H. Critical flow condition in open channel hydraulics. Acta Mech. 1985, 54, 157–179. [Google Scholar] [CrossRef]
  9. Hager, W.H. Discussion of “Characteristics of Circular-Crested Weirs” by A.S. Ramamurthy and N.-D. Vo (1993, 119). J. Hydraul. Eng. 1994, 120, 1494–1495. [Google Scholar] [CrossRef]
  10. Chanson, H.; Montes, J.S. Overflow Characteristics of Circular Weirs: Effects of Inflow Conditions. J. Irrig. Drain. Eng. 1998, 124, 152–162. [Google Scholar] [CrossRef] [Green Version]
  11. Heidarpour, M.; Chamani, M. Velocity distribution over cylindrical weirs. J. Hydraul. Res. 2006, 44, 708–711. [Google Scholar] [CrossRef]
  12. Bagheri, S.; Heidarpour, M. Overflow characteristics of circular-crested weirs. J. Hydraul. Res. 2010, 48, 515–520. [Google Scholar] [CrossRef]
  13. Schmocker, L.; Halldórsdóttir, B.R.; Hager, W.H. Effect of Weir Face Angles on Circular-Crested Weir Flow. J. Hydraul. Eng. 2011, 137, 637–643. [Google Scholar] [CrossRef]
  14. Naghavi, B.; Esmaili, K.; Yazdi, J.; Vahid, F.K. An experimental and numerical study on hydraulic characteristics and theoretical equations of circular weirs. Can. J. Civ. Eng. 2011, 38, 1327–1334. [Google Scholar] [CrossRef]
  15. Cheraghi-Shirazi, N.; Kabiri-Samani, A.; Boroomand, B. Numerical analysis of rubber dams using fluid–structure interactions. Flow Meas. Instrum. 2014, 40, 91–98. [Google Scholar] [CrossRef]
  16. Yuce, M.I.; Al-Babely, A.A.; Al-Dabbagh, M.A. Flow simulation over oblique cylindrical weirs. Can. J. Civ. Eng. 2015, 42, 389–407. [Google Scholar] [CrossRef]
  17. Cheraghi-Shirazi, N.; Kabiri-Samani, A.; Boroomand, B. Flow field over the rubber dams based on fluid-structure interactions. J. Civ. Eng. 2017, 49, 141–144. [Google Scholar] [CrossRef]
  18. Deardorff, J.W. A numerical study of three-dimensional turbulent channel flow at large Reynolds numbers. J. Fluid Mech. 1970, 41, 453–480. [Google Scholar] [CrossRef]
  19. Pope, S.B. Turbulent Flows; Cambridge University Press: Cambridge, UK, 2000. [Google Scholar]
  20. O’Neil, J.; Meneveau, C. Subgrid-scale stresses and their modelling in a turbulent plane wake. J. Fluid Mech. 1997, 349, 253–293. [Google Scholar] [CrossRef]
  21. Smagorinsky, J. General circulation experiments with the primitive equations: I. The basic experiment. Mon. Weather Rev. 1963, 91, 99–164. [Google Scholar] [CrossRef]
  22. Rodi, W.; Constantinescu, G.; Stoesser, T. Large Eddy Simulation in Hydraulic; CRC Press: Boca Raton, FL, USA, 2013. [Google Scholar]
  23. DeLong, M. Two Examples of the Impact of Partitioning with Chaco and Metis on the Convergence of Additive-Schwarz Preconditioned FGMRES; Technical Report LA-UR-97-4181; Los Alamos National Laboratory: Los Alamos, NM, USA, 1997. [Google Scholar]
  24. Hirt, C.; Nichols, B. Volume of fluid (VOF) method for the dynamics of free boundaries. J. Comput. Phys. 1981, 39, 201–225. [Google Scholar] [CrossRef]
  25. Cabot, W.; Moin, P. Approximate Wall Boundary Conditions in the Large-Eddy Simulation of High Reynolds Number Flow. Flow Turbul. Combust. 2000, 63, 269–291. [Google Scholar] [CrossRef]
  26. Korzekwa, D.A. Truchas—A multi-physics tool for casting simulation. Int. J. Cast Met. Res. 2009, 22, 187–191. [Google Scholar] [CrossRef]
  27. Chu, C.-R.; Wu, Y.-R.; Wu, T.-R.; Wang, C.-Y. Slosh-induced hydrodynamic force in a water tank with multiple baffles. Ocean Eng. 2018, 167, 282–292. [Google Scholar] [CrossRef]
  28. Chu, C.-R.; Chung, C.-H.; Wu, T.-R.; Wang, C.-Y. Numerical analysis of free surface flow over a submerged rectangular bridge deck. J. Hydraul. Eng. 2016, 142. [Google Scholar] [CrossRef]
  29. Chu, C.-R.; Lin, Y.-A.; Wu, T.-R.; Wang, C.-Y. Hydrodynamic force of circular cylinder close to the water surface. Comput. Fluids 2018, 171, 154–165. [Google Scholar] [CrossRef]
  30. Wu, T.-R.; Vuong, T.-H.-N.; Lin, J.-W.; Chu, C.-R.; Wang, C.-Y. Three-Dimensional Numerical Study on the Interaction between Dam-Break Wave and Cylinder Array. J. Earthq. Tsunami 2018, 12, 1–35. [Google Scholar] [CrossRef] [Green Version]
  31. Matthew, G.D. On the influence of the curvature, surface tension and viscosity on flow over round-crested weirs. Proc. Inst. Civil Eng. 1963, 25, 511–524. [Google Scholar] [CrossRef]
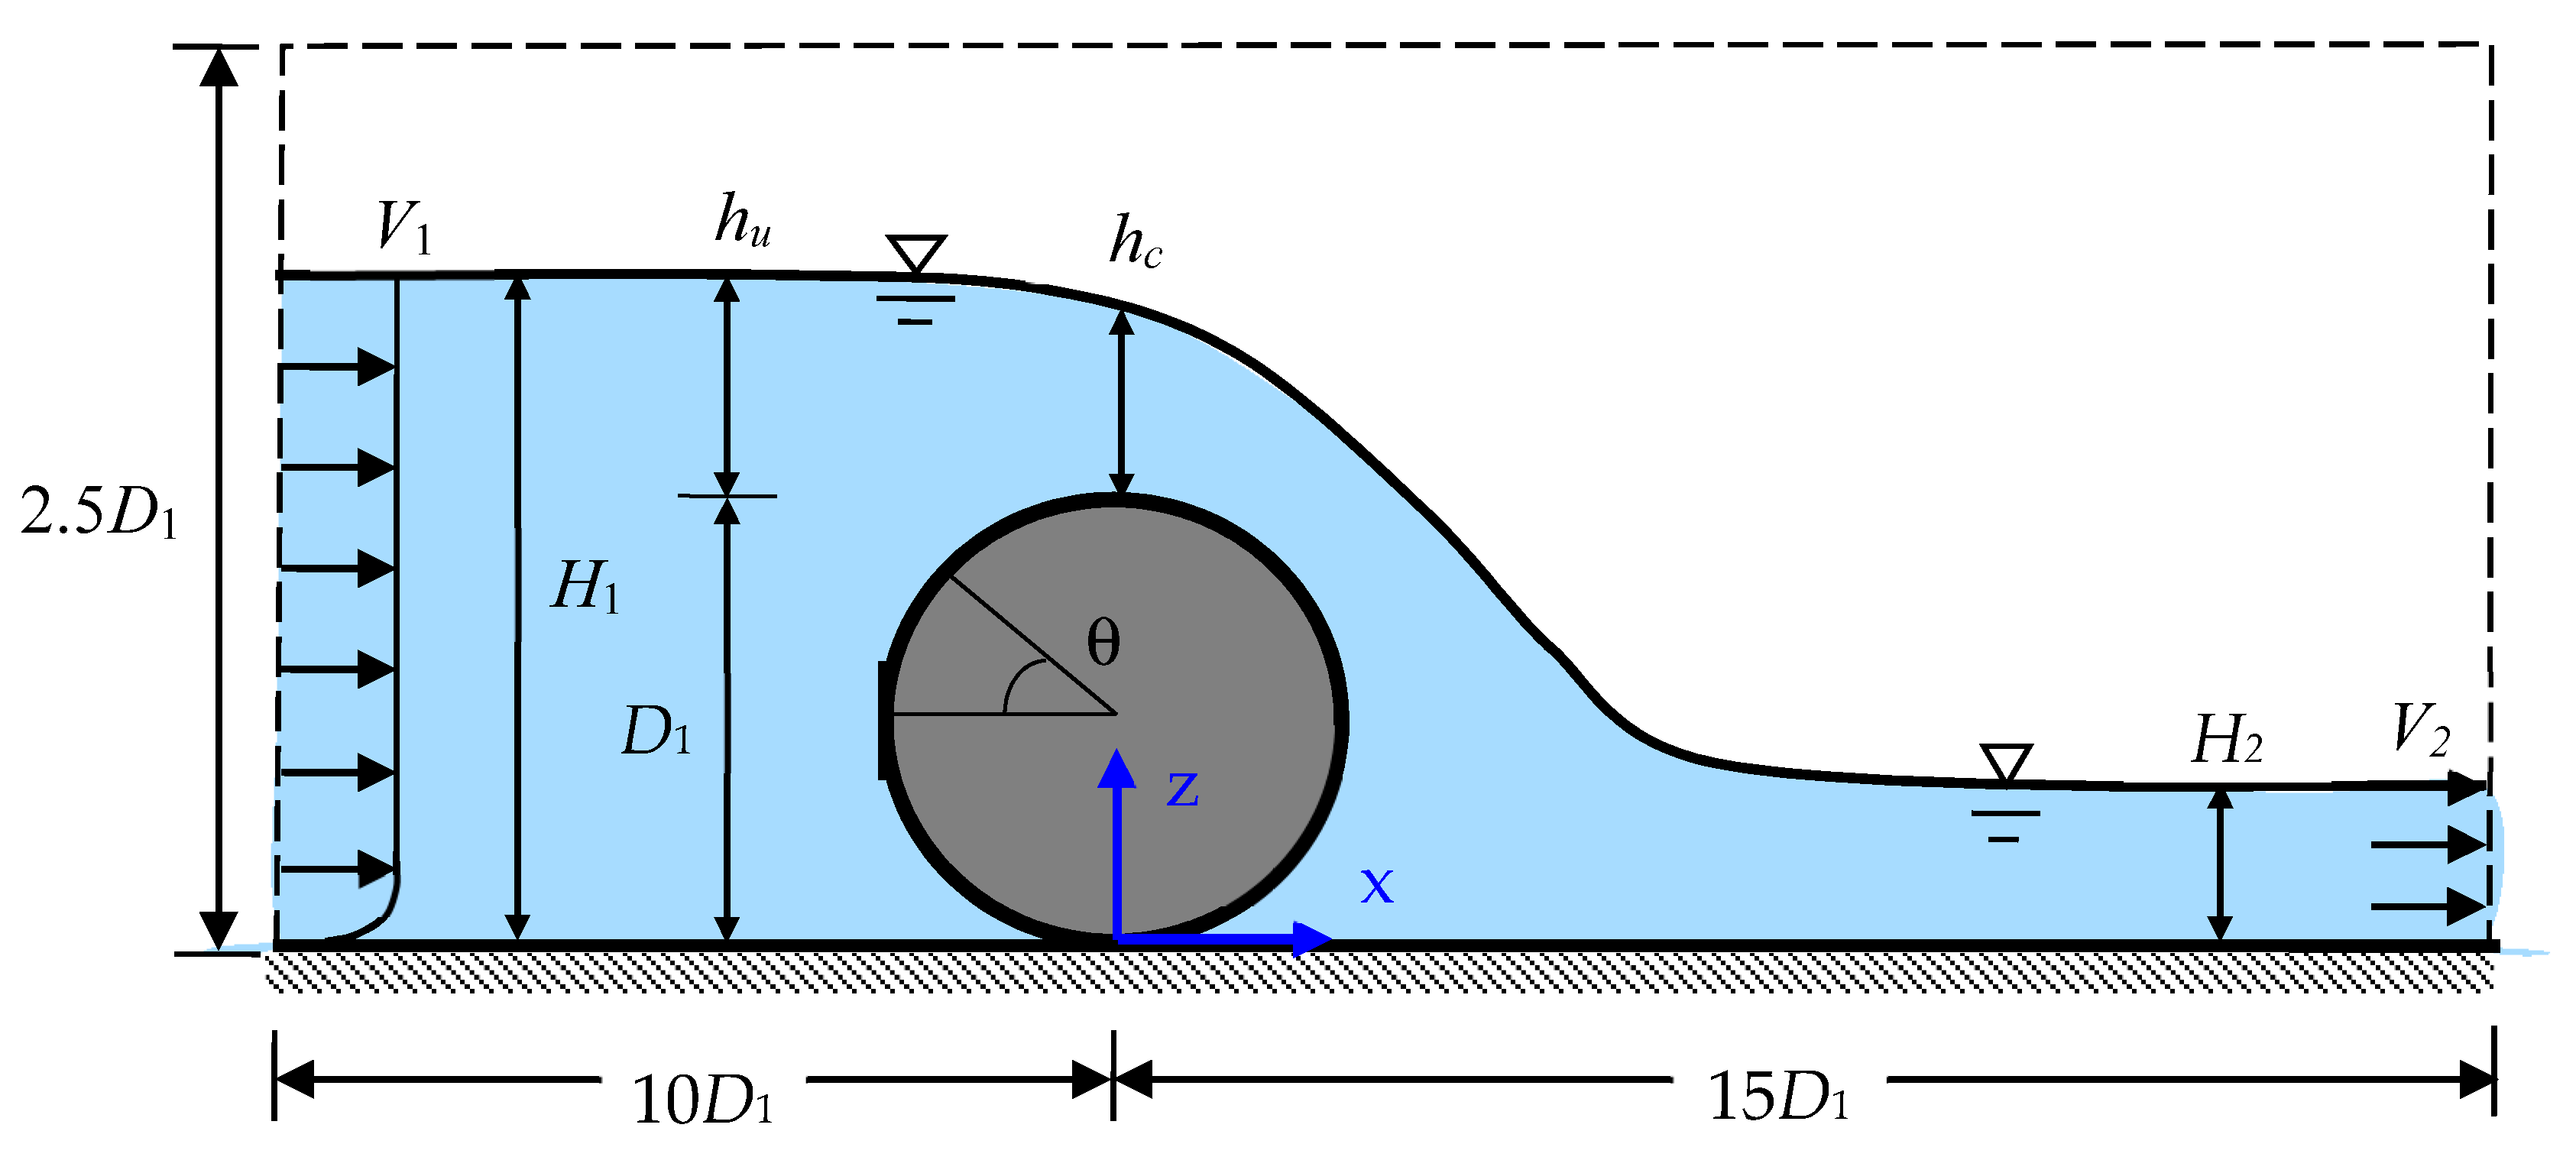
Figure 1. Schematic diagram of the circular dam and flow parameters.
Water 13 01271 g001
Figure 2. Photograph of the circular dam model in the flume experiment.
Water 13 01271 g002
Figure 3. Computational domain and grid arrangement for the circular dam (D is the diameter of the dam).
Water 13 01271 g003
Figure 4. Comparison of measured and simulated water surfaces by different computational grids for the validation case (Case A1).
Water 13 01271 g004
Figure 5. Comparison of measured and predicted pressure coefficients on the surface of the circular dam for the validation case (Case A1).
Water 13 01271 g005
Figure 6. Distribution of pressure coefficients on the centerline of the circular dam for the validation case (Case A1). (a) Total pressure; (b) dynamic pressure.
Water 13 01271 g006
Figure 7. Variation of the water depths over the circular dam of different depth ratios for Cases A.
Water 13 01271 g007
Figure 8. Time-averaged velocity vectors on the mid-plane the circular dam under different downstream depths. (a) H2/H1 = 0.2; (b) H2/H1 = 0.6; (c) H2/H1 = 0.98.
Water 13 01271 g008aWater 13 01271 g008b
Figure 9. Pressure coefficients on the surface of the circular dam under different depth ratios. (a) Total pressure; (b) dynamic pressure.
Water 13 01271 g009aWater 13 01271 g009b
Figure 10. Relationship between the depth ratio and force coefficients (a) drag coefficient; (b) lift coefficient.
Water 13 01271 g010
Figure 11. Comparison of simulated pressure coefficients on the surfaces of scaled-down model and prototype circular dams. (a) Total pressure; (b) dynamic pressure.
Water 13 01271 g011
Figure 12. Profiles of time-averaged horizontal velocity above the crest (x = 0) of the circular dam of different depth ratios.
Water 13 01271 g012
Figure 13. Relationship between the discharge coefficient and upstream water head of different dam shapes, R = D1/2 is the radius of the dam.
Water 13 01271 g013
Figure 14. Comparison of the simulated water depths for the circular, elliptical, and tear-shape dams.
Water 13 01271 g014
Figure 15. Time-averaged velocity vectors on the central plane of the elliptical and tear-shape dams.
Water 13 01271 g015
Table 1. Simulation results of the validation case by different computational grids.
TitleGrid 1 (2D)Grid 2 (2D)Grid 3 (2D)Grid 4 (3D)
Total grid no.104,048159,212233,859955,272
Grid no. on the cylinder surface90120150120
Grid size near
the cylinder
2.65 mm2.0 mm1.60 mm2.0 mm
Smallest grid sizeΔx = 3 mm
Δz = 3 mm
Δx = 2 mm
Δz = 2 mm
Δx = 1.5 mm
Δz = 1.5 mm
Δx = 2 mm
Δy = 5 mm
Δz = 2 mm
Water surface
Δh
8.53%5.59%5.06%6.97%
Force coeff.CDCLCDCLCDCLCDCL
89.795.589.688.593.193.190.397.8
CPU time18 h26 h40 h768 h
The flow parameters are: H1 = 0.109 m, V1 = 0.115 m/s, H2 = 0.0104 m, V2 = 1.21 m/s.
Publisher’s Note: MDPI stays neutral with regard to jurisdictional claims in published maps and institutional affiliations.