Abstract
The impact of ponds by urbanization has been widely discussed on the landscape scale. However, relatively few studies have explored the spatial differentiation of pond landscapes across urban-rural gradients in rapidly urbanising areas. In this study, we applied the DeepLabv3+ network to perform a semantic segmentation on Google Map images to extract ponds in the Pearl River Delta (PRD) region, China; then we employed geographic information systems to analyse the ponds changes in 665 towns along an urban-rural gradient in the PRD. Results indicate that there are clear differences in landscapes between the urban core, urban, peri-urban, agricultural, and forested zone in terms of pond area and size. In total, 57.84% and 31.33% of the ponds are distributed in the peri-urban and agricultural zone, respectively; fewer ponds are present at either end of the urban-rural gradient. Owing to the legacy effects of historical land use and river systems, urban and peri-urban zone in the central and western parts of the PRD are still rich in ponds. We propose that management measures should be implemented according to the characteristics of different pond landscapes.
1. Introduction
Ponds are small wetlands that are widely distributed globally and have multiple values and functions [1,2]. For example, ponds are the main sources of human aquatic protein production [3] and are hot spots for carbon cycling and landscape-scale biochemical processes [4,5,6]. Ponds are important freshwater habitats for a variety of organisms, such as invertebrates and birds [7,8,9,10,11,12], and provide valuable ecosystem services such as agricultural irrigation, flood alleviation, urban rainwater storage, and pollutant interception [13,14]. The importance of ponds has been widely recognised in recent years, with the development of initiatives such as the European Pond Conservation Network (EPCN) project (launched in 2004) to conserve ponds and their biodiversity in changing landscapes [15]. However, in many parts of the world, pond conservation is still excluded from environmental policies and legislation [2,16,17]. Of course, partly derived from the expansion of ponds, as the main aquaculture water bodies, may cause negative environmental impacts. For example, a study showed that shellfish ponds may lead to an increase in CO2 emissions in China [18].
Conservation and management of ponds in human-dominated landscapes is a key challenge [2]. In the process of urbanisation, drastic changes in pond landscape can occur. In the Asian coastal zone, aquaculture ponds have been developed as a way of utilising coastal tidal flats [19,20,21,22]. Mao et al. [23] showed that rapid urbanisation processes in China from 1990 to 2010 resulted in considerable loss of wetlands, with losses of reservoir/pond wetlands concentrated in the Bohai Rim Economic Circle and Pearl River Delta (PRD) region. While in Europe and Asia, urbanisation has led to a substantial reduction in the number of ponds [24,25,26,27]. Although the effects of urbanisation on pond landscapes have been well studied, research has focused on the temporal dynamics of pond landscapes, while the spatial differentiation of these landscapes across urban-rural gradients is not fully understood. The research of Burgin et al. [28] on wetland landscapes (including reservoirs/dams and swamps/wetlands) in northwestern Sydney, Australia, found that the surface area, nearest neighbour distance, and morphological complexity of wetland landscapes changed significantly during the transition from natural to agricultural and urban landscapes. Is there a similar pattern for rapidly urbanizing regions?
Taking the PRD region as an example, we discuss the changing characteristics of pond landscapes in rapidly urbanising areas, which gradually transition from core urban zone with high human activity to less impacted forested zone. Ponds in the PRD region have a long history, especially mulberry dike-pond and sugarcane dike-pond systems [29]. Over the past 40 years, the PRD region has experienced the fastest urbanisation rate in China, with large shifts in land use towards urban agglomerations. Large areas of agricultural and forestland have been occupied by urban construction, and ecological land with conservation value has been greatly reduced [30]. Ponds in the PRD have also been affected, and dynamic changes in the landscape are obvious. Many researchers have used Landsat MSS/TM/OLI multitemporal satellite data and Geographic Information Systems (GIS) to reveal the dynamics of pond landscapes at different scales [31,32,33,34,35]. For example, Ye [33] showed that from 1992 to 2006, a large amount of cultivated land in the western agricultural area of the PRD was converted into ponds, while Shunde, Nanhai, Dongguan, and other areas in Foshan City with rich pond landscapes saw significant shrinkage of ponds as a result of urban expansion. Li et al. [31] analysed trends in landscape fragmentation in Shunde District, Foshan City, by constructing an area-weighted base pond invasion index. They revealed a gradual increase in fragmentation with urban expansion from 1978 to 2016. These previous studies show that the pond landscape in the PRD has undergone dramatic changes during the urbanisation process, with obvious temporal heterogeneity. However, less attention has been paid to changes in the spatial patterns of ponds in the transition to urban and agricultural zone from a macro perspective.
Our preliminary field investigation found that ponds and urban and rural landscapes form a complex interlaced mosaic in the PRD region (Figure 1), which poses great challenges for the conservation and management of pond landscape. Owing to the scale of the area and limited scope of existing field research, it was impossible to conduct a large-scale field study of the urban-rural gradient. Deep learning has achieved very impressive success in solving image processing problems [36,37,38]. Here DeepLabv3+ architecture is adopted to mapping the ponds with the aim to analyze the landscape distribution characteristics of ponds in the PRD region.
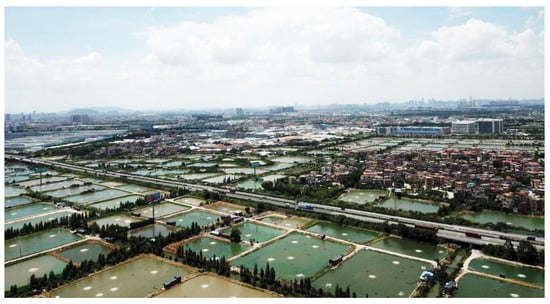
Figure 1.
An example of ponds in the Pearl River Delta (PRD) region, China: ponds of Leliu, Shunde District, Foshan City (photo taken using a drone in 16 July 2021: courtesy of Long Yang).
In this study, we aimed to explore the spatial differentiation in pond landscapes across an urban-rural gradient in the PRD. The objectives of this study were as follows: (1) at the urban agglomeration level, to analyse the overall landscape distribution across the urban-rural gradient in the PRD, (2) to further analyse the spatial distribution characteristics of this gradient for different cities and towns, based on field investigation, and (3) to determine the factors influencing pond landscapes across the urban-rural gradient and understand variation in landscape management requirements.
2. Materials and Methods
2.1. Study Area
The PRD region is in Southeast China (Figure 2) and includes nine cities, namely Guangzhou, Shenzhen, Zhuhai, Foshan, Dongguan, Huizhou, Zhongshan, Jiangmen, and Zhaoqing, with a total land area of 54,770 km2, a total resident population of 78.2354 million, and a regional Gross Domestic Product (GDP) of 8952.393 billion yuan in 2020 [39]. The PRD has seen some of the fastest urbanisation in China over the past 40 years. Since China’s reform and opening-up, urban construction land has almost tripled [40]. The PRD plain has a dense water network with many branches and eight inlets that flow into the South China Sea. The delta is affected by both runoff and tidal currents. The PRD has one of the highest river densities in the world (average density of 0.9 km/km2) and a water surface area percentage of 20%. The periphery is a hilly/mesa landscape, while the central plain area is flat, with a slope of 0.1–0.2% and elevation <20 m [41]. The area has a subtropical monsoon climate, with average annual precipitation of approximately 2000 mm concentrated in the warm season. Historically, the plain has experienced frequent floods and waterlogging as a result of the low-lying terrain, staggered river networks, undulating flood peaks, and reciprocating tides.
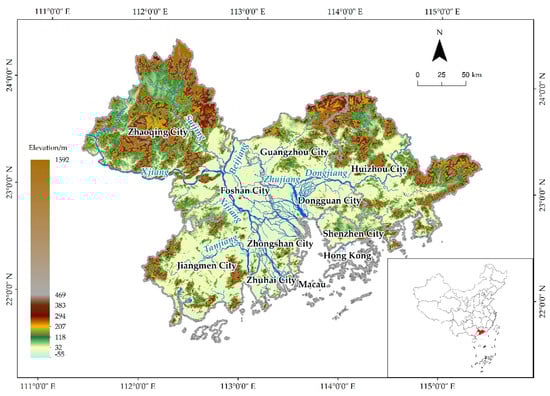
Figure 2.
Elevation of the Pearl River Delta region (PRD).
The use of ponds in PRD has a long history. After the Northern Song Dynasty (A.D. 960–1127), the construction of dikes, waterlogging control, reclamation of coastal sand fields, and social and economic development led to concentrated pond areas in the central and western parts of the PRD [42]. Traditionally ponds are primarily used for aquaculture and providing irrigation water to the surrounding dike crops in PRD. It is an integrated land use that adapts to low-lying terrain and environmental changes [29,43]. Since the reform and opening-up, these integrated agriculture-aquaculture systems have gradually declined, but the PRD still has one of the highest concentrations of aquaculture ponds in China as well as the coastal zone of Asia [44].
2.2. Data Sources and Processing
2.2.1. Google Imagery
For large-scale pond mapping, the Google satellite imagery was first downloaded via link (https://mt1.google.com, accessed on 10 January 2022), and then reconstructed into large-scale images of each PRD county. The zoom level was set to 16 and the spatial resolution of the images was about 2.4 m. The images covering the entire PRD region occupy approximately 205 × 142 k pixels.
2.2.2. Ponds Labels
In this study, the pond labels we adopted cover the whole city of Guangzhou. These labels were manually delineated according to high-resolution optical images of Google Maps and Bing Maps from 2017 to 2019. According to ponds labels, there were 74,188 ponds in Guangzhou city.
2.3. Ponds Extraction Method and Evaluation Metrics
2.3.1. Ponds Extraction Method
To combine a deep model for semantic segmentation with OBIA, this study adopts the DeepLabv3+ network architecture (Chen et al., 2018). It uses a spatial pyramid pooling module and an encoder-decoder structure for image semantic segmentation, where the former captures multi-scale contextual information by pooling features at different resolutions, while the latter captures sharper object boundaries (Figure 2). DeepLabv3+ extends DeepLabv3 and uses the spatial pyramid pooling (SPP) module on the encoder-decoder structure. The encoder extracts rich semantic information, and the decoder recovers fine object edges. The encoder allows atrous convolution to be employed at arbitrary resolutions.
The ponds extraction adopted the DeepLabV3+ architecture. In the input data preparation stage. The images for each county were clipped into image tiles of 512 × 512 pixels. Among them, there was 128 pixel-wide redundancy between each of the two tiles, for both training and testing sets. At the same time, the label tiles corresponding to the image tiles also use the same settings. During the model training stage. We performed the semantic segmentation based on the DeepLabv3+ with ResNet50 backbone and cross entropy loss function. The default parameters are used. The learning rate is set to 0.002, the batch size is set to 8, and the number of iterations is 40,000.
2.3.2. Evaluation Metrics
The ponds extraction results were evaluated by 4 general standard metrics including Accuracy (Acc), mean Accuracy (mAcc), Intersection over Union (IoU) and mean Intersection over Union (mIoU). The definitions and formulas of these indicators are listed in Table 1.

Table 1.
Evaluation metrics of ponds extraction accuracy.
2.4. Urban-Rural Gradient Classification Method
The town was used as the unit of analysis of classification of pond landscapes across an urban-rural gradient. The classification was based on land use and landscape patterns, which have recently been proposed for urban-rural gradient classification based on town-level units in metropolitan areas [45]; this method is conducive to resource management and conservation policy analysis [45,46].
Referring to Kaminski et al. [45,46], urban-rural gradient classification was carried out for 665 towns in the PRD. The process included three steps:
- Indicator selection, including three land use cover indicators and four landscape model variable indicators: construction land (X1), construction land core area (X2), construction land islet (X3), woodland (X4), woodland core area (X5), woodland islet (X6), and cultivated land (X7). The landscape model variable indicators (X2, X3, X5 and X6) were analysed using the GuidosToolbox (GTB3.0) software [47]. The proportion (%) of the total land area of the town represented by each land use was used for analysis. The above data were based on interpretation of the 2020 Remote Sensing Monitoring Data Set of China Multi-Period Land Use/Cover Change Data Set, with a spatial resolution of 30 m.
- Principal component analysis (PCA): SPSS software (IBM, Armonk, NY, USA) was used to conduct a PCA on the above seven indicators, and take the index whose initial eigenvector is larger than 1 as the principal component.
- Grouping and clustering: based on the results of the PCA, the Spatial Analyst extension module of ArcGIS 10.2 (ESRI, Redlands, CA, USA) was applied for grouping and clustering (using grouping rules that are not constrained by space), and the 665 towns were divided into five types alone the urban-rural gradient. According to the urbanisation characteristics of the PRD, these were urban core, urban, peri-urban, agricultural, and forest zone. The gradual transition from the urban core to the forest represents a gradual reduction in the influence of human activities on the landscape.
2.5. Quantification of Spatial Differentiation
The landscape index is the principal means for quantitative analysis of landscape spatial patterns, and reflects the composition and spatial configuration characteristics of landscape structure [48]. With reference to relevant studies on the pond landscape [49,50] and data accuracy, three landscape indices were selected: total area of patch type (CA), number of patches (NP) and mean patch area (MPS), which reflect the area and size of the pond. Quantification of the indicators was achieved and the results were visualized using ArcGIS 10.2 (ESRI, Redlands, CA, USA).
3. Results
3.1. Assessment of Ponds Mapping Result
The final ponds mapping results using DeeplabV3+ were shown in Figure 3 (shown by local spot). From a visual inspection of the results, most of the ponds were identified successfully. Although the shapes, colours, and locations of ponds vary widely, the extraction method can achieve good identification results for different ponds. We also noticed that some partially separated ponds were identified as one pond due to the small spacing.
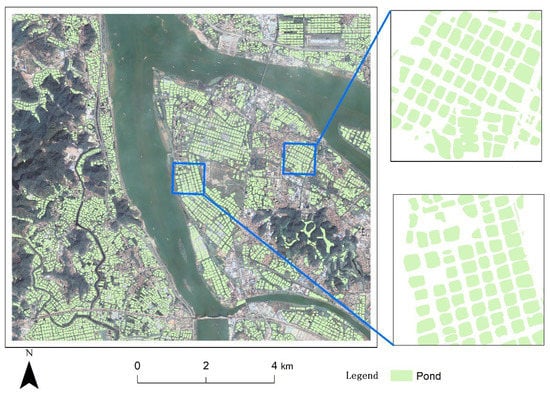
Figure 3.
Mapping of ponds in the PRD (local spot, in Junan, Shunde District, Foshan City).
To quantitatively assess the ponds mapping results, we used a testing dataset with 2000 randomly selected patches for accuracy assessment.
It can be seen in Table 2 and Table 3 that DeeplabV3+ methods exhibited significant results in each metric. The IoU of ponds reached 89.02%, which shows that it is feasible to use the data to analyze the pond’s landscape pattern. Since there are only two categories of pond and background, and the area of background is much larger than that of ponds, the results of mAcc and mIoU are relatively high.
Table 2.
Evaluation of single class extraction result.
Table 3.
Evaluation of averaged class extraction result.
3.2. Urban-Rural Gradient Division of PRD with Towns as Units and Overall Characteristics of the Pond Landscape
According to GIS cluster analysis, the 665 towns in the PRD along the urban-rural gradient from the core area to the periphery are divided into the urban core, urban, peri-urban, agricultural, and forest zone (Figure 4). There are 100 towns in the urban core area (15.04%), 118 towns in the urban zone (17.74%), 156 towns in the peri-urban zone (23.46%), 144 towns in the agricultural zone 21.65%), and 147 towns in forest zone (22.11%). In terms of the spatial distribution, the built-up areas of cities in the PRD include the Guangzhou–Foshan–Zhongshan–Jiangmen and Shenzhen–Dongguan contiguous areas. The urban zone of Zhaoqing, Huizhou, and Zhuhai are relatively independent and small in scale. Except for some towns in Jiangmen and Zhaoqing, the peri-urban area connects the two major metropolitans to form a large-scale metropolitan.
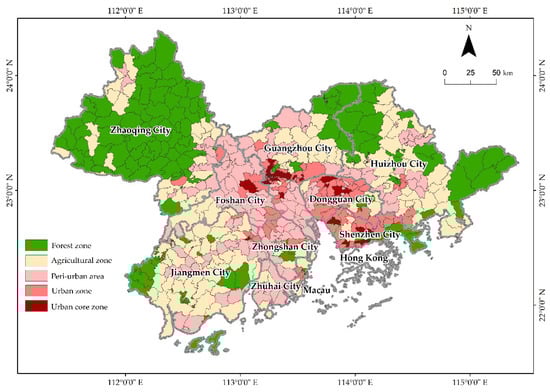
Figure 4.
The urban-rural gradient distribution map of the PRD with 665 towns as the units of analysis.
There were 426,909 ponds landscape patches in the PRD, with a total area of 2304.86 km2 and an average patch area of 0.54 hm2. Figure 5 show that from the urban core to the forest area at the outermost edge, the pond landscape in the PRD changes significantly. The peri-urban and agricultural zone in the PRD overall had the most ponds, and the urban core and forest zone at either end of the urban-rural gradient had the fewest ponds. The CA for ponds in the peri-urban and agricultural zones are 1333.15 km2 and 722.13 km2, accounting for 57.84% and 31.33% of the total area of delta pond patches, respectively (Figure 5a).
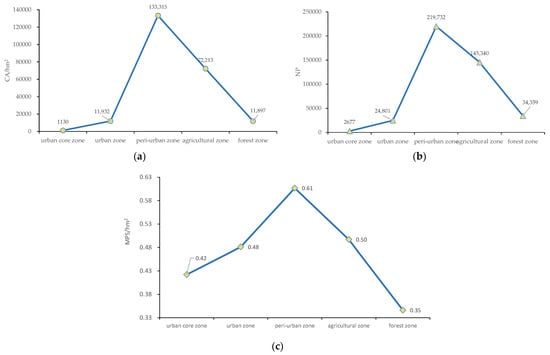
Figure 5.
(a) Total area of pond landscape patches (CA); (b) number of patches (NP) and (c) mean patch area (MPS) along an urban-rural gradient in the PRD.
NP and MPS reflect the fragmentation patterns of landscape patches [48]. These values were combined with the CA index to assess the degree of fragmentation of pond patches. Figure 5b,c show that the peri-urban area has the largest mean patch area (0.61 hm2) and NP (219,732). The number of ponds in the forest zone is more than that in the urban core and urban zone, and the MPS is smaller, indicating that the ponds in the forest zone are more fragmented.
3.3. Spatial Differentiation of Pond Landscapes across the Urban-Rural Gradient in the PRD with Towns as Units
To further reveal the spatial differentiation of the pond landscape in the PRD, the pond patch landscape indices of CA, NP and MPS were calculated for 665 towns in 9 cities. The ArcGIS 10.2 natural breakpoint method divided each calculation result into five levels. Thus, the change in the pond landscape index along the urban-rural gradient in each town could be clearly depicted.
Table 4 and Figure 6 show that towns with the highest CA grade (>2399 hm2) are all located in the peri-urban zone, which is mainly located along the main and tributaries of Xijiang and Beijiang in the central and western parts of the PRD. Towns with CA of 1412–2399 hm2 are also mainly located in the peri-urban zone (71.43%), followed by the agricultural zone (28.57%), most of them located in the coastal zone of Jiangmen, Zhuhai, and Guangzhou. In general, the CA of ponds in towns in the central and western parts of the PRD is higher than that in the eastern part of the PRD. Ponds in the eastern part of the PRD are mainly located in towns in the southwestern part of Huizhou.
Table 4.
Number of towns in the Pearl River Delta classified by pond total area (CA).
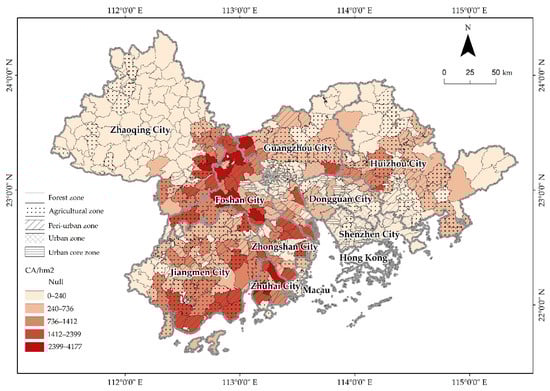
Figure 6.
Spatial variation in pond total area (CA) across the urban-rural gradient (urban core to forest) in the PRD.
According to the CA for ponds, the urban-rural gradient characteristics of the pond landscape in the nine cities of the PRD can be roughly divided into the following three types: (1) the peri-urban zones have the largest area of ponds, such as Foshan, Guangzhou, Zhongshan, Zhuhai, (2) the peri-urban zones and agricultural zones have more ponds, such as Huizhou, Jiangmen, Zhaoqing, (3) there are fewer ponds in general, among which the urban zones have more ponds, such as Shenzhen and Dongguan (Figure 7).
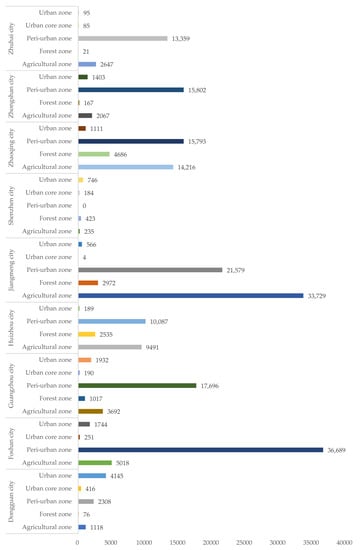
Figure 7.
Total area of pond landscape patches (CA) along an urban-rural gradient of nine cities in the PRD.
The NP index results show that towns with the largest number of pond patches (>4010) are mainly distributed in the urban and peri-urban zone of Foshan City (Figure 8a). The next highest numbers (2348 < NP < 4010) are mainly distributed in towns in the western part of Jiangmen City, west of Zhuhai City, south of Zhaoqing City, and east of Huizhou City. The MPS index showed that the average patch area in the peri-urban and agricultural zone in the central and western coastal zone was the largest (MPS > 1.79 hm2) (Figure 8b).
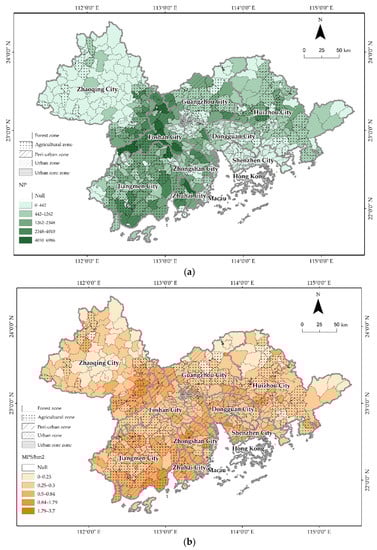
Figure 8.
Spatial variation in (a) number of pond patches (NP) and (b) mean patch area (MPS) across an urban-rural gradient (urban core to forest) in the PRD.
4. Discussion
4.1. Influence of Natural Environment and Human Activities on Spatial Differentiation in Pond Landscapes across an Urban-Rural Gradient
Our results show that moving from urban core to forest, the pond landscape in the PRD reflects a significant urban-rural gradient. This landscape pattern is influenced by both human activities and natural conditions (Figure 9).
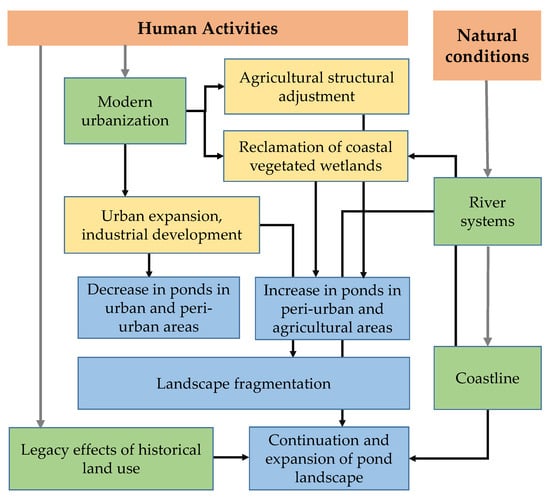
Figure 9.
Influence of human activities and natural conditions on the spatial heterogeneity of the pond landscape across an urban-rural gradient in the PRD.
Urbanisation, including urban expansion and industrial development, is the leading cause of wetland loss [24,25,26,27]. The area of ponds in the urban core and urban zone of the PRD is 1130 and 11,932 hm2, representing only 0.85% and 8.95% of that in the peri-urban zone, respectively. Some urban zone in the river network area of the PRD Plain historically had abundant pond landscapes, but currently, only a few are left, such as Tianhe District, Panyu District of Guangzhou City, Dongguan City, Xiaolan Town, Dongfeng Town in the north of Zhongshan City, Foshan City, Daliang Street, Ronggui Street, Shunde District, Nanzhuang Town, and Chancheng District. Although the area of ponds in the urban area of the PRD was smaller than that in the more peri-urban zone, it was still slightly larger than that in the forest zone. The characteristics of this urban-rural gradient is roughly the same as the distribution of wetland landscapes in northwestern Sydney, Australia [28]. Under the influence of urbanisation, the fragmentation of agricultural landscapes also exhibits urban-rural variation [51]. We found that ponds in the urban core area and forest zone are more fragmentation than in other zones.
Previous studies on the dynamic changes in pond landscapes in the PRD have shown that although many ponds have disappeared in the process of urbanisation, farmland and garden with low economic benefits have been transformed into aquaculture ponds with high economic benefits [31,33,34,35]. This study reveals that 57.84% of the ponds in the PRD are in the peri-urban zone, forming a peak area in the urban-rural gradient. This peak may be partly attributable to the shift in agricultural structure in these areas. The PRD is currently breeding high-value fish, such as California perch, yellow catfish, and eels. The economic returns are substantially greater for aquaculture than for some agricultural lands, such as arable. The increase in land rent in the peri-urban zone may also have accelerated the transformation of agricultural land into aquaculture.
The influence of historical land use on current and future uses, i.e., the legacy effect, can be seen in coupled human and natural systems [52,53] and is an important factor in landscape structure [48]. The use of ponds in the PRD can be traced back to the mid-Tang dynasty (776–835). Over the past thousand years, the people of the PRD have created a variety of integrated agriculture–aquaculture systems such as mulberry dike–, fruit dike–, and sugarcane dike-pond systems, which are well-adapted to low-lying terrain and natural disasters [29]. In the middle and late Ming Dynasty (A.D. 1436–1644), in the central and western parts of the PRD, a concentrated dike-pond system existed in Shunde, Nanhai, and Zhongshan, Foshan City [42]. Over time, these areas have gradually become more urbanised but retain more ponds than some other urban. In Shunde and Nanhai in Foshan, local farmers have mastered freshwater aquaculture techniques, which have been passed down from generation to generation. Farmers have been actively developing aquaculture in the surrounding areas since the 1990s, under the pressure of sharp reductions in local agricultural land availability and rising rents [54]. These factors may partly explain the wide distribution of pond landscapes in Taishan City, Sanshui District, Nansha District, and Sihui in the central and western parts of the PRD.
Additionally, pond distribution is closely associated with river systems and coastal zone. The urban and rural pond landscapes are generally more abundant in areas with rich water resources and flat open coastal zone, such as the confluence of the Xijiang, Beijiang, and Suijiang rivers and along the main stream of the Xijiang River, as well as the central and western coastal plains.
4.2. Influence of Urban-Rural Gradient Landscape Heterogeneity on Pond Conservation and Management
Compared with a single pond, pond conservation at the landscape level has higher protection significance, for example, promoting the connectivity of the pond and other large habitat networks, etc. [2,17,55]. Along the urban-rural gradient, the landscape of ponds in the PRD has undergone significant changes, and correspondingly, different requirements have been proposed for the conservation and management of ponds. Previous studies have suggested that it is difficult to establish large-scale natural wetlands, forests, and other traditional conserved areas in urban and coastal plains. Ponds are a key component of regional ecological networks and biodiversity hotspots while also providing local people with a variety of ecological services [56]. For example, the multifunctional role of ponds in urban has been highlighted in Taiwan’s Taoyuan area and in Sydney, Australia [28,57]. Our results show that the pond landscapes in Shunde, Nanhai, and Zhongshan, Foshan City have certain advantages and should be considered an important element of urban landscapes and ecological security [58]. Although China has not yet proposed a conservation plan for pond landscapes in urban at the national level, local governments have recognised the important role of ponds. For example, in 2019, the Foshan Municipal Government had announced that it planned to build 16 ‘WanMu’ parks (area > 666.67 hm2) and 18 ‘QianMu’ parks (area > 66.67 hm2), of which 13 and 7 ponds will be reconstructed and restored, respectively, mainly relying on pond landscapes.
In the PRD urban agglomeration, ponds are mainly distributed in the peri-urban and agricultural zone in the suburbs of cities. Villages and towns in the PRD, such as Shunde, Nanhai, and Zhongshan, have developed manufacturing industries. The industrial areas and ponds are intertwined. Certain industries, such as the metal production industry, may affect pond water quality. In addition, the PRD and the Hong Kong and Macau Special Administrative Regions are accelerating the construction of world-class Bay Area urban agglomerations, and the current peri-urban and agricultural areas may gradually be incorporated into urban areas. For example, Leping Town, Sanshui District, Foshan City, located in a peri-urban zone, has the highest area of ponds and is currently planning to build a 100 billion RMB industrial development area. Such towns need to coordinate urban development and pond landscape conservation.
The potential value of ponds as biodiversity hotspots in agricultural landscapes has been highlighted in a recent study of pond belts in the North-eastern United States [59]. Our research shows that the proportion of ponds in the agricultural zone of the PRD is 31.33%, second only to that in the peri-urban zone (57.84%). Although ponds in the agricultural zone of the PRD are mainly used for aquaculture and supplying irrigation water, they may be key biodiversity areas.
4.3. Mapping of Ponds in the PRD and Future Directions
Recent studies mapping aquaculture ponds in coastal areas of Asia showed that most of the aquaculture ponds are located within 15 km of the coastline [60], with obvious natural gradient characteristics. This study used DeepLabv3+ architecture to extract ponds and analyse the urban-rural gradient characteristics of the pond landscape and found that 57.84% of the ponds are distributed in the peri-urban zone in the PRD.
The landscape across the urban-rural gradient is dynamic [54], and its shape, structure, and function will change with time [27]. In the future, additional time-series data should be used to study dynamic changes in pond landscapes. Our investigation has revealed that the PRD has a rich and diverse pond landscape. In addition to aquaculture ponds, vegetable-based fishponds, ‘fengshui ponds’, and landscape ponds are found around urban and rural settlements. A more detailed description of the diverse pond landscape structure in the PRD was beyond the scope of this study. In general, the spatial form and configuration of a landscape are important factors affecting landscape function and ecological processes [4,61]. In the future, detailed research on the physical and chemical properties of pond landscapes in the PRD will be necessary [2].
5. Conclusions
Using DeepLabv3+ architecture to analyse the landscape distribution in the PRD, this study showed that from the urban core to the peripheral forest area, the pond landscape in the PRD shows clear spatial differentiation across the urban-rural gradient. The peak area of pond patches appeared in the peri-urban zone, accounting for 57.84%, and the proportion of pond patches in the agricultural zone was 31.33%, second only to that in the peri-urban zone. In general, there were fewer ponds at either end of the urban-rural gradient, with higher patch fragmentation. Owing to the historical land use and natural conditions, the central and western regions of the PRD and coastal zone had more ponds than other areas. Human activities, such as urbanisation, agricultural structure adjustment, and historical land use, as well as natural conditions, such as river system and coastline distribution, influence the spatial patterns of pond landscapes. Ponds occupy the largest area in the peri-urban zone; however, the peri-urban zone is the most vulnerable to urbanisation and is the most difficult to conserve and manage.
Author Contributions
Conceptualization, G.H., H.J. and C.C.; methodology, H.J., C.C., X.L. and Y.L.; software, H.J. and X.L.; formal analysis, H.J. and C.C.; investigation, G.H., C.C., Y.L. and X.L.; data curation, H.J., X.L. and Y.L.; visualization, C.C. and X.L.; writing—original draft preparation, C.C. and H.J.; writing—review and editing, C.C., H.J., X.L., G.H., Y.L. and W.J. All authors have read and agreed to the published version of the manuscript.
Funding
This research was funded partially by GDAS’ Project of Science and Technology Development, grant numbers 2020GDASYL-20200301003, partially by the Guangdong Province Agricultural Science and Technology Innovation and Promotion Project under, grant number 2022KJ102, and Key Special Project for Introduced Talents Team of Southern Marine Science and Engineering Guangdong Laboratory (Guangzhou), grant number GML2019ZD0301, and the Provincial Science and Technology Program of Guangdong Province, grant number 2019B020208002, and the Science and Technology Program of Guangdong, grant number 2021B1212100006, and GDAS’ Project of Science and Technology Development, grant numbers 2020GDASYL-20200103007.
Institutional Review Board Statement
Not applicable.
Informed Consent Statement
Not applicable.
Data Availability Statement
The data presented in this study are available on request from the corresponding author.
Acknowledgments
We thank Shoubao Geng, Shaoxiong Yuan and Jianhui Xu for their suggestions on the initial idea of the study and the writing process, and Shaotao Lin and Shaoxiong Yuan for technical support with ArcGIS for analysis. We also thank the Geographical Science Data Center of the Greater Bay Area (http://www.gbageodata.cn/ accessed on 10 January 2022) for providing the relevant data for this study.
Conflicts of Interest
The authors declare no conflict of interest.
References
- Biggs, J.; von Fumetti, S.; Kelly-Quinn, M. The importance of small waterbodies for biodiversity and ecosystem services: Implications for policy makers. Hydrobiologia 2017, 793, 3–39. [Google Scholar] [CrossRef]
- Hill, M.J.; Greaves, H.M.; Sayer, C.D.; Hassall, C.; Milin, M.; Milner, V.S.; Marazzi, L.; Hall, R.; Harper, L.R.; Thornhill, I.; et al. Pond ecology and conservation: Research priorities and knowledge gaps. Ecosphere 2021, 12, e03853. [Google Scholar] [CrossRef]
- Edwards, P. Aquaculture environment interactions: Past, present and likely future trends. Aquaculture 2015, 447, 2–14. [Google Scholar] [CrossRef]
- Cheng, F.Y.; Basu, N.B. Biogeochemical hotspots: Role of small water bodies in landscape nutrient processing. Water Resour. Res. 2017, 53, 5038–5056. [Google Scholar] [CrossRef]
- Gilbert, P.J.; Cooke, D.A.; Deary, M.; Taylor, S.; Jeffries, M.J. Quantifying rapid spatial and temporal variations of CO2 fluxes from small, lowland freshwater ponds. Hydrobiologia 2017, 793, 83–93. [Google Scholar] [CrossRef]
- Holgerson, M.A.; Raymond, P.A. Large contribution to inland water CO2 and CH4 emissions from very small ponds. Nat. Geosci. 2016, 9, 222–226. [Google Scholar] [CrossRef]
- Ruggiero, A.; Cereghino, R.; Figuerola, J.; Marty, P.; Angelibert, S. Farm ponds make a contribution to the biodiversity of aquatic insects in a French agricultural landscape. Comptes Rendus Biol. 2008, 331, 298–308. [Google Scholar] [CrossRef]
- Casanova, M.T.; DouglasHill, A.; Brock, M.A.; Muschal, M.; Bales, M. Farm ponds in New South Wales, Australia: Relationship between macrophyte and phytoplankton abundances. Mar. Freshw. Res. 1997, 48, 353–360. [Google Scholar] [CrossRef]
- Cereghino, R.; Ruggiero, A.; Marty, P.; Angelibert, S. Biodiversity and distribution patterns of freshwater invertebrates in farm ponds of a south-western French agricultural landscape. Hydrobiologia 2008, 597, 43–51. [Google Scholar] [CrossRef]
- Swartz, T.M.; Miller, J.R. Managing farm ponds as breeding sites for amphibians: Key trade-offs in agricultural function and habitat conservation. Ecol. Appl. 2019, 29, e01964. [Google Scholar] [CrossRef]
- Davies, S.R.; Sayer, C.D.; Greaves, H.; Siriwardena, G.M.; Axmacher, J.C. A new role for pond management in farmland bird conservation. Agric. Ecosyst. Environ. 2016, 233, 179–191. [Google Scholar] [CrossRef]
- Froneman, A.; Mangnall, M.J.; Little, R.M.; Crowe, T.M. Waterbird assemblages and associated habitat characteristics of farm ponds in the Western Cape, South Africa. Biodivers. Conserv. 2001, 10, 251–270. [Google Scholar] [CrossRef]
- Riley, W.D.; Potter, E.C.E.; Biggs, J.; Collins, A.L.; Jarvie, H.P.; Jones, J.I.; Kelly-Quinn, M.; Ormerod, S.J.; Sear, D.A.; Wilby, R.L.; et al. Small Water Bodies in Great Britain and Ireland: Ecosystem function, human-generated degradation, and options for restorative action. Sci. Total Environ. 2018, 645, 1598–1616. [Google Scholar] [CrossRef] [PubMed]
- Wisser, D.; Frolking, S.; Douglas, E.M.; Fekete, B.M.; Schumann, A.H.; Voeroesmarty, C.J. The significance of local water resources captured in small reservoirs for crop production—A global-scale analysis. J. Hydrol. 2010, 384, 264–275. [Google Scholar] [CrossRef]
- European Pond Conservtion Network. Available online: https://www.europeanponds.org/ (accessed on 25 December 2021).
- Chen, W.J.; He, B.; Nover, D.; Lu, H.M.; Liu, J.; Sun, W.; Chen, W. Farm ponds in southern China: Challenges and solutions for conserving a neglected wetland ecosystem. Sci. Total Environ. 2019, 659, 1322–1334. [Google Scholar] [CrossRef]
- Hill, M.J.; Hassall, C.; Oertli, B.; Fahrig, L.; Robson, B.J.; Biggs, J.; Samways, M.J.; Usio, N.; Takamura, N.; Krishnaswamy, J.; et al. New policy directions for global pond conservation. Conserv. Lett. 2018, 11, e12447. [Google Scholar] [CrossRef]
- Ouyang, X.; Lee, S.; Wang, W. The ‘Perfect’ Conversion: Dramatic Increase in CO2 Efflux from Shellfish Ponds and Mangrove Conversion in China. Sustainability 2021, 13, 13163. [Google Scholar] [CrossRef]
- Ren, C.; Wang, Z.; Zhang, Y.; Zhang, B.; Chen, L.; Xi, Y.; Xiao, X.; Doughty, R.B.; Liu, M.; Jia, M.; et al. Rapid expansion of coastal aquaculture ponds in China from Landsat observations during 1984–2016. Int. J. Appl. Earth Obs. Geoinf. 2019, 82, 101902. [Google Scholar] [CrossRef]
- Duan, Y.; Tian, B.; Li, X.; Liu, D.; Sengupta, D.; Wang, Y.; Peng, Y. Tracking changes in aquaculture ponds on the China coast using 30 years of Landsat images. Int. J. Appl. Earth Obs. Geoinf. 2021, 102, 102383. [Google Scholar] [CrossRef]
- Chen, W.; Li, T.; Zhang, L.; Zhang, H.; Yan, M.; Du, Y. Change monitoring of aquaculture ponds on the west bank of Ha Long Bay based on remote sensing technology and analysis of its impact on production-living-ecological land. Bull. Surv. Mapp. 2020, 9, 66–71. [Google Scholar]
- Duan, Y.; Li, X.; Zhang, L.; Liu, W.; Liu, S.a.; Chen, D.; Ji, H. Detecting spatiotemporal changes of large-scale aquaculture ponds regions over 1988-2018 in Jiangsu Province, China using Google Earth Engine. Ocean. Coast. Manag. 2020, 188, 105144. [Google Scholar] [CrossRef]
- Mao, D.; Wang, Z.; Wu, J.; Wu, B.; Zeng, Y.; Song, K.; Yi, K.; Luo, L. China’s wetlands loss to urban expansion. Land Degrad. Dev. 2018, 29, 2644–2657. [Google Scholar] [CrossRef]
- Boothby, J. Pond conservation: Towards a delineation of pondscape. Aquat. Conserv. Mar. Freshw. Ecosyst. 1997, 7, 127–132. [Google Scholar] [CrossRef]
- Fang, W.-T.; Chou, J.-Y.; Lu, S.-Y. Simple Patchy-Based Simulators Used to Explore Pondscape Systematic Dynamics. PLoS ONE 2014, 9, e86888. [Google Scholar] [CrossRef] [PubMed]
- Huang, S.-L.; Lee, Y.-C.; Budd, W.W.; Yang, M.-C. Analysis of Changes in Farm Pond Network Connectivity in the Peri-Urban Landscape of the Taoyuan Area, Taiwan. Environ. Manag. 2012, 49, 915–928. [Google Scholar] [CrossRef] [PubMed]
- Wang, Z.; Zhu, G. A Study on Characteristic Changes and Causes of Pond Landscape Systems in the Process of Urbanization. Acta Sci. Nat. Univ. Pekin. 2017, 53, 701–709. [Google Scholar] [CrossRef]
- Burgin, S.; Franklin, M.J.M.; Hull, L. Wetland Loss in the Transition to Urbanisation: A Case Study from Western Sydney, Australia. Wetlands 2016, 36, 985–994. [Google Scholar] [CrossRef]
- Lo, C.P. Environmental impact on the development of agricultural technology in China: The case of the dike-pond (‘jitang’) system of integrated agriculture-aquaculture in the Zhujiang Delta of China. Agric. Ecosyst. Environ. 1996, 60, 183–195. [Google Scholar] [CrossRef]
- Wang, X.; Yan, F.; Zeng, Y.; Chen, M.; Su, F.; Cui, Y. Changes in Ecosystems and Ecosystem Services in the Guangdong-Hong Kong-Macao Greater Bay Area since the Reform and Opening Up in China. Remote Sens. 2021, 13, 1611. [Google Scholar] [CrossRef]
- Li, F.; Liu, K.; Tang, H.; Liu, L.; Liu, H. Analyzing Trends of Dike-Ponds between 1978 and 2016 Using Multi-Source Remote Sensing Images in Shunde District of South China. Sustainability 2018, 10, 3504. [Google Scholar] [CrossRef]
- Liu, K.; Wang, S.; Xie, L.; Zhuang, J. Spatial Evolution Analysis of Dike-Pond Systems in Foshan City. Trop. Geogr. 2008, 28, 513–517. [Google Scholar] [CrossRef]
- Ye, C. Change Characteristics and Spatial Types of Dike-pond in the Pearl River Delta. J. East China Inst. Technol. 2013, 36, 315–322. [Google Scholar] [CrossRef]
- Lin, M.; Feng, R.; Ji, S. Analysis on mode change and landscape pattern of the Dike-pond agriculture in Zhongshan. Guangdong Agric. Sci. 2014, 41, 184–197. [Google Scholar] [CrossRef]
- Xiao, W.; Gong, J.; Wei, X. Spatio-temporal change and its driving factors of dike-pond landscape in Zhongshan, 1980–2015. Ecol. Sci. 2019, 38, 64–73. [Google Scholar] [CrossRef]
- Guo, Y.; Liu, Y.; Oerlemans, A.; Lao, S.; Wu, S.; Lew, M.S. Deep learning for visual understanding: A review. Neurocomputing 2016, 187, 27–48. [Google Scholar] [CrossRef]
- Kamilaris, A.; Prenafeta-Boldu, F.X. Deep learning in agriculture: A survey. Comput. Electron. Agric. 2018, 147, 70–90. [Google Scholar] [CrossRef]
- Zhao, Z.-Q.; Zheng, P.; Xu, S.-T.; Wu, X. Object Detection With Deep Learning: A Review. IEEE Trans. Neural Netw. Learn. Syst. 2019, 30, 3212–3232. [Google Scholar] [CrossRef]
- Province, S.B.O.G. Statistical Yearbook of Guangdong Province 2021; China Statistic Press: Beijing, China, 2021. [Google Scholar]
- Hu, P.; Li, F.; Hu, D.; Sun, Y.; Chen, X. Spatial and temporal characteristics of urban expansion in Pearl River Delta urban agglomeration from 1980 to 2015. Acta Ecol. Sin. 2021, 41, 7063–7072. [Google Scholar] [CrossRef]
- Xu, Z. The River System Landscape and Structural Problems of the Pearl River Delta. Chin. Landsc. Archit. 2009, 25, 54–58. [Google Scholar] [CrossRef]
- Committee, F.R. The Pearl River Delta Agricultural Records (Preliminary Draft); The Writing Group of The Pearl River Delta Agricultural Records of Foshan Revolutionary Committee: Foshan, China, 1976. [Google Scholar]
- Kenneth Ruddle, G.Z. Integrated Agriculture-Aquaculture in South China: The Dike-Pond System of the Zhujiang Delta; Cambridge University Press: Cambridge, MA, USA, 1987. [Google Scholar]
- Ottinger, M.; Clauss, K.; Kuenzer, C. Large-Scale Assessment of Coastal Aquaculture Ponds with Sentinel-1 Time Series Data. Remote Sens. 2017, 9, 440. [Google Scholar] [CrossRef]
- Kaminski, A.; Bauer, D.M.; Bell, K.P.; Loftin, C.S.; Nelson, E.J. Using landscape metrics to characterize towns along an urban-rural gradient. Landsc. Ecol. 2021, 36, 2937–2956. [Google Scholar] [CrossRef]
- Cai, Z.; Fang, C.; He, Q.; Yan, J.; Gao, D.; Liu, Z. Urban-rural Gradient Identification and Ecosystem Service Response in the Main Urban Area of anchang Based on Landscape Clustering. Res. Environ. Sci. 2021, 35, 806–817. [Google Scholar] [CrossRef]
- Vogt, P.; Riitters, K. GuidosToolbox: Universal digital image object analysis. Eur. J. Remote Sens. 2017, 50, 352–361. [Google Scholar] [CrossRef]
- Wu, J. Landscape Ecology: Pattern, Process, Scale and Hierarchy; Higher Education Press: Beijing, China, 2007. [Google Scholar]
- Li, Y.; You, L.; Chen, Y.; Huang, J. Spatial-temporal characteristics of multi-pond landscape change and their driving factors in the Chaohu Basin, China. Acta Ecol. Sin. 2018, 38, 6280–6291. [Google Scholar] [CrossRef][Green Version]
- Liu, X.; Chen, J.; Wang, J. Variations and Influencing Factors of Urban Ponds in Guangzhou’s Rapid Urbanization Zone. Urban Insight 2017, 49, 50–60. [Google Scholar] [CrossRef]
- Jiang, P.; Chen, D.; Li, M. Farmland landscape fragmentation evolution and its driving mechanism from rural to urban: A case study of Changzhou City. J. Rural. Stud. 2021, 82, 1–18. [Google Scholar] [CrossRef]
- Liu, J.; Hull, V.; Carter, N.; Viña, A.; Yang, W. Framing sustainability of coupled human and natural systems. In Pandas and People: Coupling Human and Natural Systems for Sustainability; Oxford University Press: Oxford, UK, 2016; Volume 33. [Google Scholar] [CrossRef]
- Liu, J.; Dietz, T.; Carpenter, S.; Alberti, M.; Folke, C.; Moran, E.; Pell, A.; Deadman, P.; Kratz, T.; Lubchenco, J.; et al. Complexity of Coupled Human and Natural Systems. Science 2007, 317, 6. [Google Scholar] [CrossRef]
- Li, L.; Lei, G.; Lin, M.; Li, J. Development Status and Countermeasures of Extension Agriculture in Shunde District, Foshan City. S. China Rural. Area 2012, 28, 22–30. [Google Scholar] [CrossRef]
- Boothby, J. Framing a strategy for pond landscape conservation: Aims, objectives and issues. Landsc. Res. 1999, 24, 67–83. [Google Scholar] [CrossRef]
- Knapp, S.; Schmauck, S.; Zehnsdorf, A. Biodiversity Impact of Green Roofs and Constructed Wetlands as Progressive Eco-Technologies in Urban Areas. Sustainability 2019, 11, 5846. [Google Scholar] [CrossRef]
- Chou, R.J.; Wu, C.T.; Huang, F.T. Fostering Multi-Functional Urban Agriculture: Experiences from the Champions in a Revitalized Farm Pond Community in Taoyuan, Taiwan. Sustainability 2017, 9, 2097. [Google Scholar] [CrossRef]
- Han, X.; Yu, K.; Li, D.; Wang, S. Building the Landscape Security Pattern Of Dike-Pond System With Urban Functions—A Case of Magang Part of Shunde District, Foshan City. Areal Res. Dev. 2008, 27, 107–110. [Google Scholar] [CrossRef]
- Swartz, T.M.; Miller, J.R. The American Pond Belt: An untold story of conservation challenges and opportunities. Front. Ecol. Environ. 2021, 19, 501–509. [Google Scholar] [CrossRef]
- Ottinger, M.; Bachofer, F.; Huth, J.; Kuenzer, C. Mapping Aquaculture Ponds for the Coastal Zone of Asia with Sentinel-1 and Sentinel-2 Time Series. Remote Sens. 2022, 14, 153. [Google Scholar] [CrossRef]
- Van Meter, K.J.; Basu, N.B. Signatures of human impact: Size distributions and spatial organization of wetlands in the Prairie Pothole landscape. Ecol. Appl. 2015, 25, 451–465. [Google Scholar] [CrossRef]


Publisher’s Note: MDPI stays neutral with regard to jurisdictional claims in published maps and institutional affiliations. |
© 2022 by the authors. Licensee MDPI, Basel, Switzerland. This article is an open access article distributed under the terms and conditions of the Creative Commons Attribution (CC BY) license (https://creativecommons.org/licenses/by/4.0/).