Research on Mooring System Design for Kulluk Platform in Arctic Region
Abstract
:1. Introduction
2. Theoretical Background
2.1. Calculation Method of Wave Loads
2.2. Analysis Method of Ice Loads
2.2.1. The Empirical Formula of ISO (The International Organization for Standardization)
- Crushing failure of ice
- 2.
- Flexure failure of ice
2.2.2. Finite Element Method
- Ice-structure contact algorithm
- 2.
- Fluid-structure interaction algorithm
2.2.3. Discrete Element Method
3. Comparison of Ice Load Calculation Methods
4. Numerical Model and Environmental Conditions
5. Hydrodynamic Analysis of the Kulluk Platform
6. Ice Load Calculation of the Kulluk Platform
7. Results and Discussion
7.1. Influence of Load Direction on Mooring System
7.2. Influence of the Number of Mooring Lines on the Mooring System
7.3. Influence of the Number of Connection Points on the Mooring System
7.4. Influence of the Angle between Mooring Lines on the Mooring System
8. Conclusions
- (1)
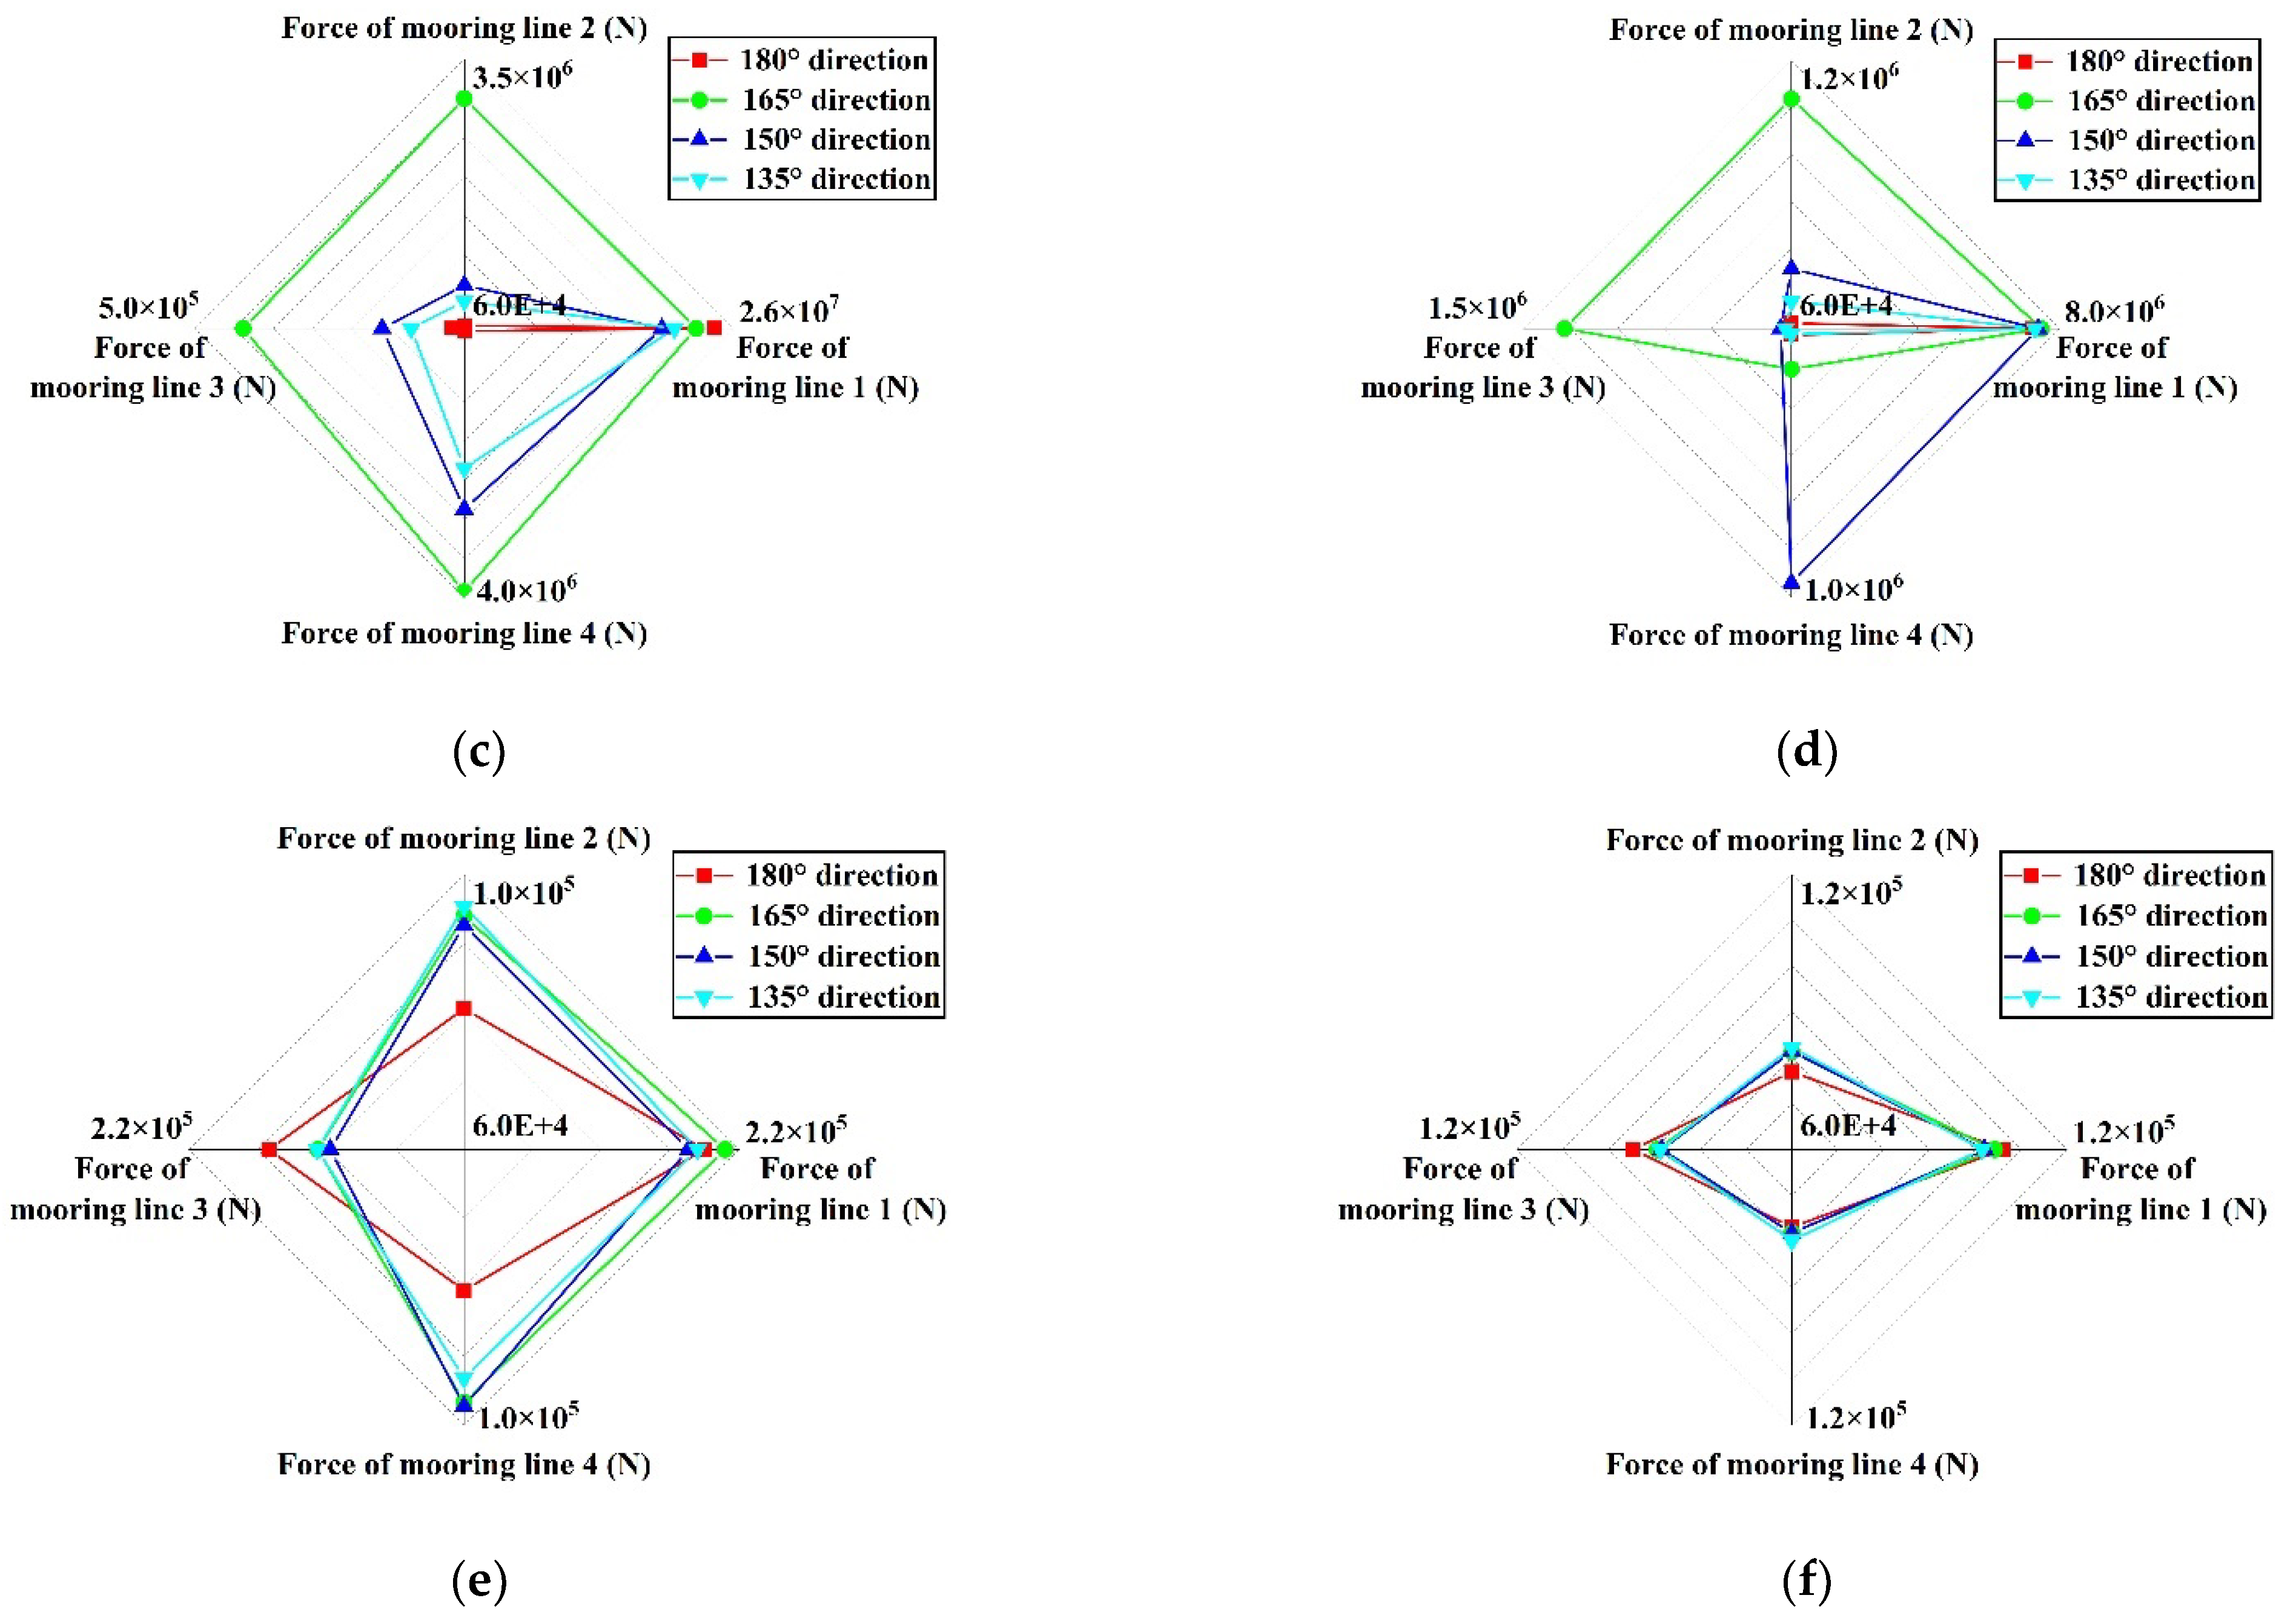
- The influence of level ice load on platform motion and mooring system tension is much more significant than that of wave and broken ice floes load. Ongoing ice management exists in actual offshore operations. It can control loads of the mooring lines and keep the mooring system’s tension and the platform’s motion within an acceptable range.
- (2)
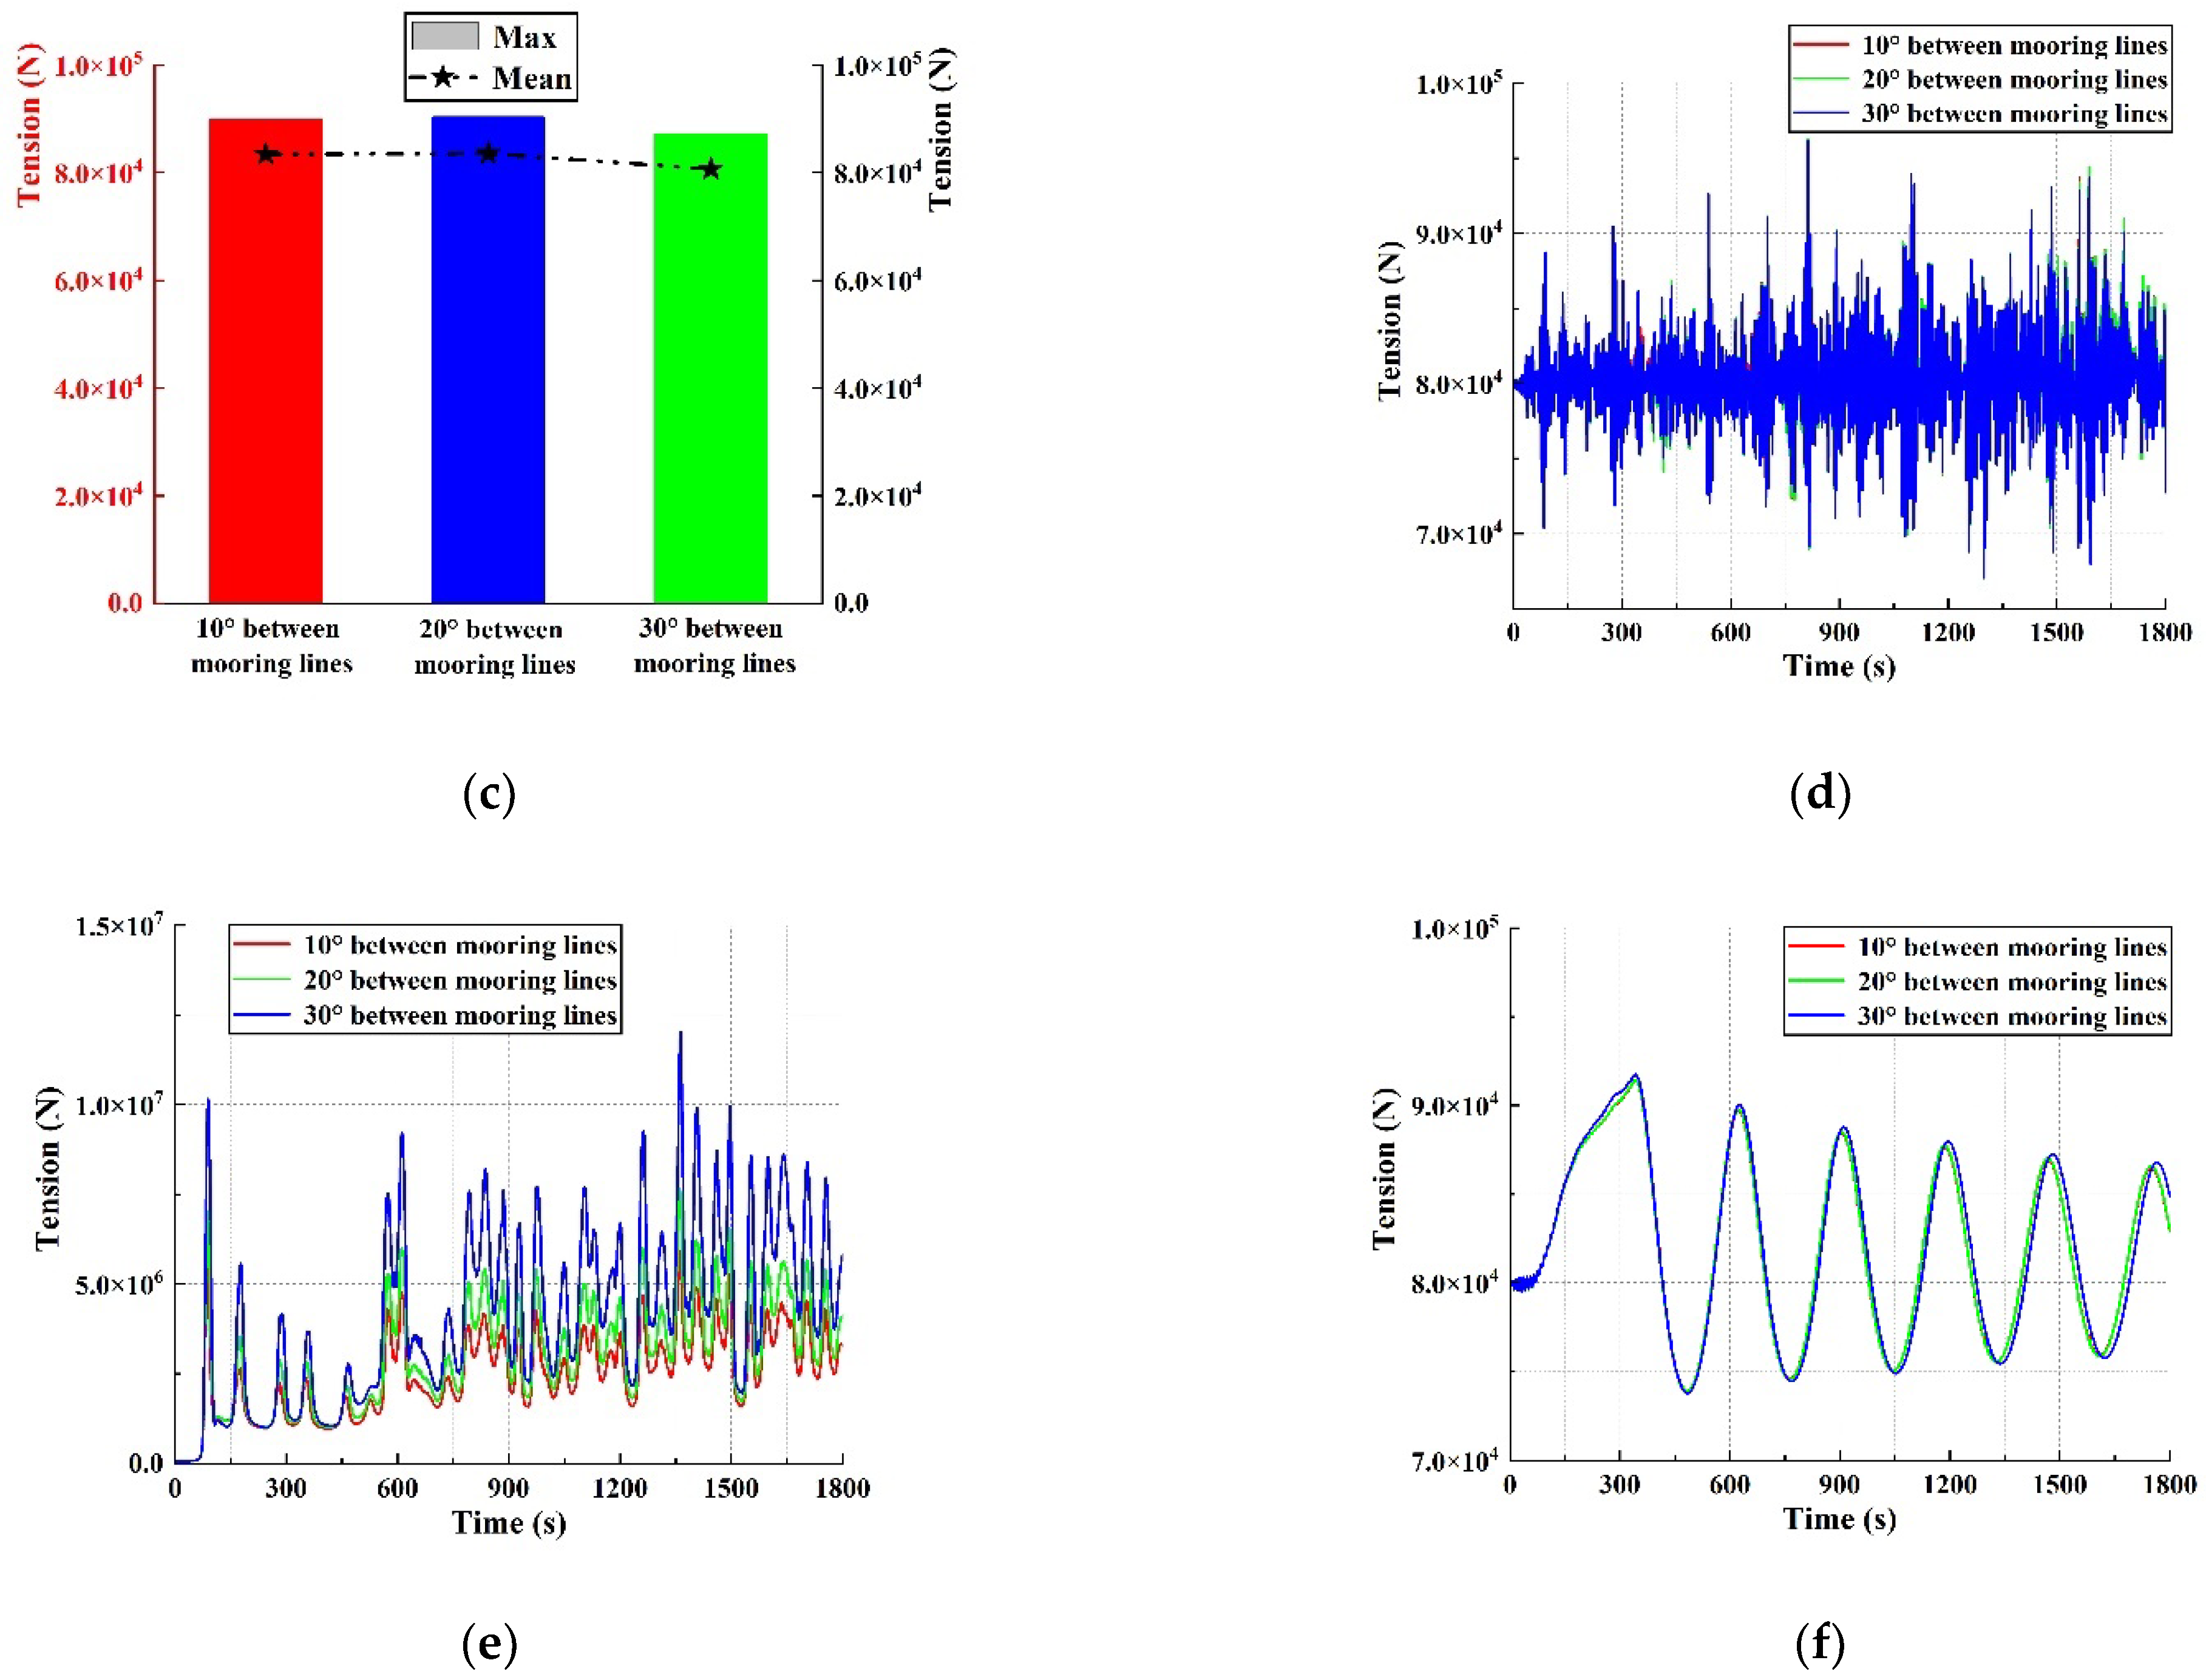
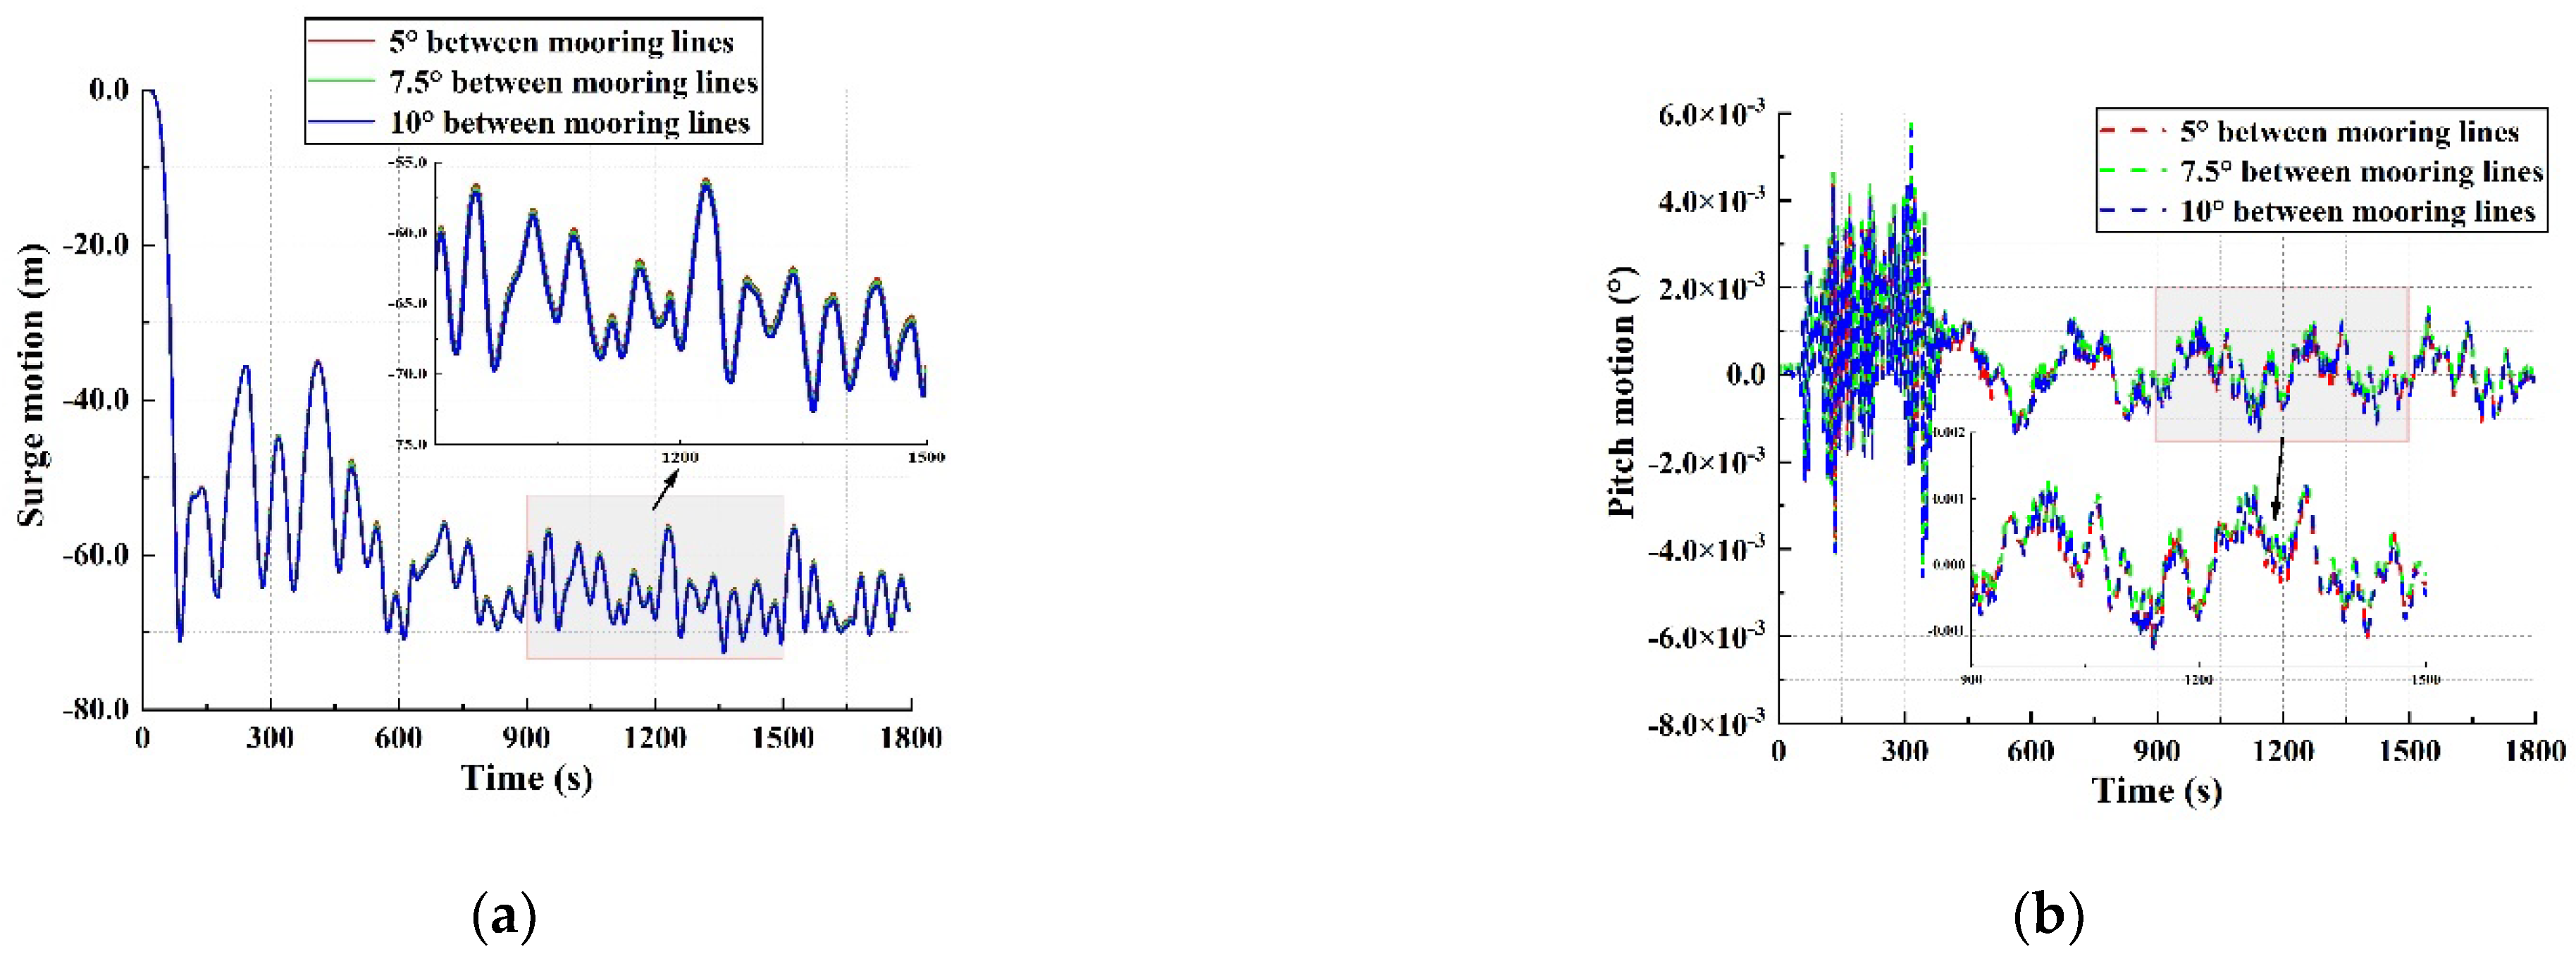
- For the dynamic response of the mooring system of the Kulluk platform, the load direction is not the decisive factor. The number of mooring lines, the number of connecting points, and the angle between the mooring lines all affect the tension of the mooring lines and the platform’s motion to a certain extent. Mooring lines with more numbers have the best positioning effect, and each mooring line has the lowest tension and the highest safety. When the dynamic response difference is less than 1%, the final design is determined based on the actual construction costs and offshore operations conditions.
- (3)
- The final design scheme is determined as twelve mooring lines, four connecting points, and with an angle between the mooring lines of 10°. Under wave and broken ice floes conditions, the surge motion of the coupling system is less than 10% of the working water depth, and the pitch motion is less than 5°, which well satisfies the relevant design requirement of offshore platforms. The platform is suitable for both ice-free and ice-covered seasons and can be used for year-round offshore operations.
Author Contributions
Funding
Data Availability Statement
Acknowledgments
Conflicts of Interest
References
- Hamilton, J.M. The Challenges of Deep-Water Arctic Development. In Proceedings of the Twenty-First International Offshore and Polar Engineering Conference, Maui, HI, USA, 19–24 June 2011. [Google Scholar]
- Donald, L.G.; Kenneth, J.B.; Ronnald, R.C.; Arthur, G.; David, W.H.; Timothy, R.K.; Thomas, E.M.; Janet, K.P.; Christopher, J.S.; John, H.S.; et al. Assessment of undiscovered oil and gas in the Arctic. Science 2009, 324, 1175–1179. [Google Scholar]
- Wright, B. Full Scale Experience with Kulluk Stationkeeping Operations in Pack Ice (With Reference to Grand Banks Developments). In PERD/CHC Report 25–44; National Research Council: Ottawa, ON, Canada, 2000. [Google Scholar]
- Zhou, L.; Su, B.; Riska, K.; Moan, T. Numerical simulation of moored structure station keeping in level ice. Cold Reg. Sci. Technol. 2012, 71, 54–66. [Google Scholar] [CrossRef]
- Sayed, M.; Barker, A. Numerical Simulations of Ice Interaction with a Moored Structure. In Proceedings of the Offshore Technology Conference, Houston, TX, USA, 2–5 May 2011. [Google Scholar]
- Wang, J.Y.; Derradji-Aouat, A. Numerical assessment for stationary structure (Kulluk) in moving broken ice. In Proceedings of the 21st International Conference on Port and Ocean Engineering under Arctic Conditions, POAC, Montréal, QC, Canada, 10–14 July 2011. [Google Scholar]
- Du, J.F.; Chang, A.T.; Wang, S.Q.; Sun, M.Y.; Wang, J.R.; Li, H.J. Multi-mode reliability analysis of mooring system of deep-water floating structures. Ocean. Eng. 2019, 192, 106517. [Google Scholar] [CrossRef]
- Garrett, D.L. Coupled analysis of floating production systems. Ocean. Eng. 2005, 32, 802–816. [Google Scholar] [CrossRef]
- Montasir, O.A.; Yenduri, A.; Kurian, V.J. Effect of mooring line configurations on the dynamic responses of truss spar platforms. Ocean. Eng. 2015, 96, 161–172. [Google Scholar] [CrossRef]
- Mohapatra, S.C.; Guedes Soares, C. Effect of Mooring Lines on the Hydroelastic Response of a Floating Flexible Plate Using the BIEM Approach. J. Mar. Sci. Eng. 2021, 9, 941. [Google Scholar] [CrossRef]
- Horrigmoe, G.; Andersen, R. Nonlinear finite element analysis of ice-structure interaction at varying strain rates. In Proceedings of the Fourth International Offshore and Polar Engineering Conference, Osaka, Japan, 10–15 April 1994. [Google Scholar]
- Edmond, H.H.; Sveinung, L. Modelling floating offshore units moored in broken ice: Comparing simulations with ice tank tests. Cold Reg. Sci. Technol. 1999, 29, 107–119. [Google Scholar]
- Liu, Z.H.; Jørgen, A.; Sveinung, L. Plasticity based material modelling of ice and its application to ship–iceberg impacts. Cold Reg. Sci. Technol. 2011, 65, 326–334. [Google Scholar] [CrossRef]
- Liu, L.; Ji, S.Y. Ice load on floating structure simulated with dilated polyhedral discrete element method in broken ice field. Appl. Ocean. Res. 2018, 75, 53–65. [Google Scholar] [CrossRef]
- Peyrot, A.H.; Goulois, A.M. Analysis of Cable Structures. Comput. Struct. 1979, 10, 805–813. [Google Scholar]
- Sødahl, N. Design and Analysis of Flexible Risers; The Norwegian Institute of Technology: Trondheim, Norway, 1991. [Google Scholar]
- Faltinsen, O.M. Sea Loads on Ships and Offshore Structures; Cambridge University Press: Cambridge, UK, 1990. [Google Scholar]
- DNV. Sesam User Manual Sesam Manager. 2018. Available online: https://www.dnv.com/services/strength-assessment-of-offshore-structures-sesam-software-1068?&utm_campaign=structure_sesam&utm_source=google&utm_medium=cpc&gclid=EAIaIQobChMInITk2sGE-AIVAcuWCh3XcQyxEAAYASAAEgKNB_D_BwE&gclsrc=aw.ds (accessed on 15 May 2022).
- DNV. SESAM User Manual WADAM. DNV Software Report No.: 92-7052. 2017. Available online: https://www.dnv.com/services/strength-assessment-of-offshore-structures-sesam-software-1068?&utm_campaign=structure_sesam&utm_source=google&utm_medium=cpc&gclid=EAIaIQobChMInITk2sGE-AIVAcuWCh3XcQyxEAAYASAAEgKNB_D_BwE&gclsrc=aw.ds (accessed on 15 May 2022).
- SINTEF Ocean. SIMO 4.16.0 User Guide. 11 May 2019. Available online: https://sesam.dnv.com/status/simo/status/simo-release-notes_4.16.1.pdf (accessed on 15 May 2022).
- Zhang, A.B.; Chuang, Z.J.; Liu, S.W.; Zhou, L.; Qu, Y.; Lu, Y. Dynamic performance optimization of an arctic semi-submersible production system. Ocean. Eng. 2022, 244, 110353. [Google Scholar] [CrossRef]
- ISO 19906; Petroleum and Natural Gas Industries-Arctic Offshore Structures. 2nd ed. ISO: Geneva, Switzerland, 2019.
- Hallquist, J.O. LS-DYNA Theoretical Manual; Livermore Software Technology Corporation: Livermore, CA, USA, 2006. [Google Scholar]
- Wang, C.; Hu, X.H.; Tian, T.P.; Guo, C.Y.; Wang, C.H. Numerical simulation of ice loads on a ship in broken ice fields using an elastic ice model. Int. J. Nav. Archit. Ocean. Eng. 2020, 12, 414–427. [Google Scholar] [CrossRef]
- Guo, C.Y.; Zhang, Z.T.; Tian, T.P.; Li, X.Y.; Zhao, D.G. Numerical simulation on the resistance performance of ice-going container ship under brash ice conditions. China Ocean. Eng. 2018, 32, 546–556. [Google Scholar] [CrossRef]
- Shen, H.H.; Hibler, W.D.; Lepparanta, M. On applying granular flow theory to a deforming broken ice field. Acta Mech. 1986, 63, 143–160. [Google Scholar] [CrossRef]
- Potyondy, D.O.; Cundall, P.A. A bonded-particle model for rock. Int. J. Rock Mech. Min. Sci. 2004, 41, 1329–1364. [Google Scholar] [CrossRef]
- Campbell, C.S. Stress-controlled elastic granular shear flows. J. Fluid. Mech. 2005, 539, 273–297. [Google Scholar] [CrossRef] [Green Version]
- Wang, Y.; Tonon, F. Calibration of a discrete element model for intact rock up to its peak strength. Int. J. Numer. Anal. Methods Geomech. 2010, 34, 447–469. [Google Scholar] [CrossRef]
- Mollon, G.; Zhao, J. Fourier–Voronoi-based generation of realistic samples for discrete modelling of granular materials. Granul. Matter 2012, 14, 621–638. [Google Scholar] [CrossRef]
- Maruo, H. The drift of a body floating on waves. J. Ship Res. 1960, 4, 1–10. [Google Scholar]
- Pinkster, J.A.; van Oortmerssen, G. Computation of the first and second-order wave forces on oscillating bodies in regular waves. In Proceedings of the 2nd International Conference on Numerical Ship Hydrodynamics, Berkeley, CA, USA, 19–21 September 1977; pp. 136–159. [Google Scholar]


| Mass Density | Young’s Modulus | Poisson’s Ratio |
|---|---|---|
| 7850 kg/m3 | 206 Gpa | 0.3 |
| Mass Density | Shear Modulus | Yield Stress | Plastic Hardening Modulus | Bulk Modulus | Failure Pressure | Plastic Failure Strain |
|---|---|---|---|---|---|---|
| 900 kg/m3 | 2.2 Gpa | 2.12 Mpa | 4.26 Gpa | 5.26 Gpa | −4 Mpa | 0.35 |
| State Equation | Density | Viscosity Coefficient | Failure Pressure | |
|---|---|---|---|---|
| Air | *EOS_LINEAR_POLYNOMIAL | 1.25 kg/m3 | 1.74 × 10⁻⁵ | −10 Mpa |
| Water | *EOS_GRUNEISEN | 1000 kg/m3 | 0.9 × 10⁻³ | −10 Mpa |
| Parameter | Symbol | Value | Unit |
|---|---|---|---|
| Elastic modulus | E | 1.0 | GPa |
| The density of water | ρw | 1035.0 | kg/m3 |
| The density of ice | ρi | 920.0 | kg/m3 |
| The friction coefficient of particle element | μb | 0.25 | — |
| The friction coefficient between sea ice and structure | μs | 0.25 | — |
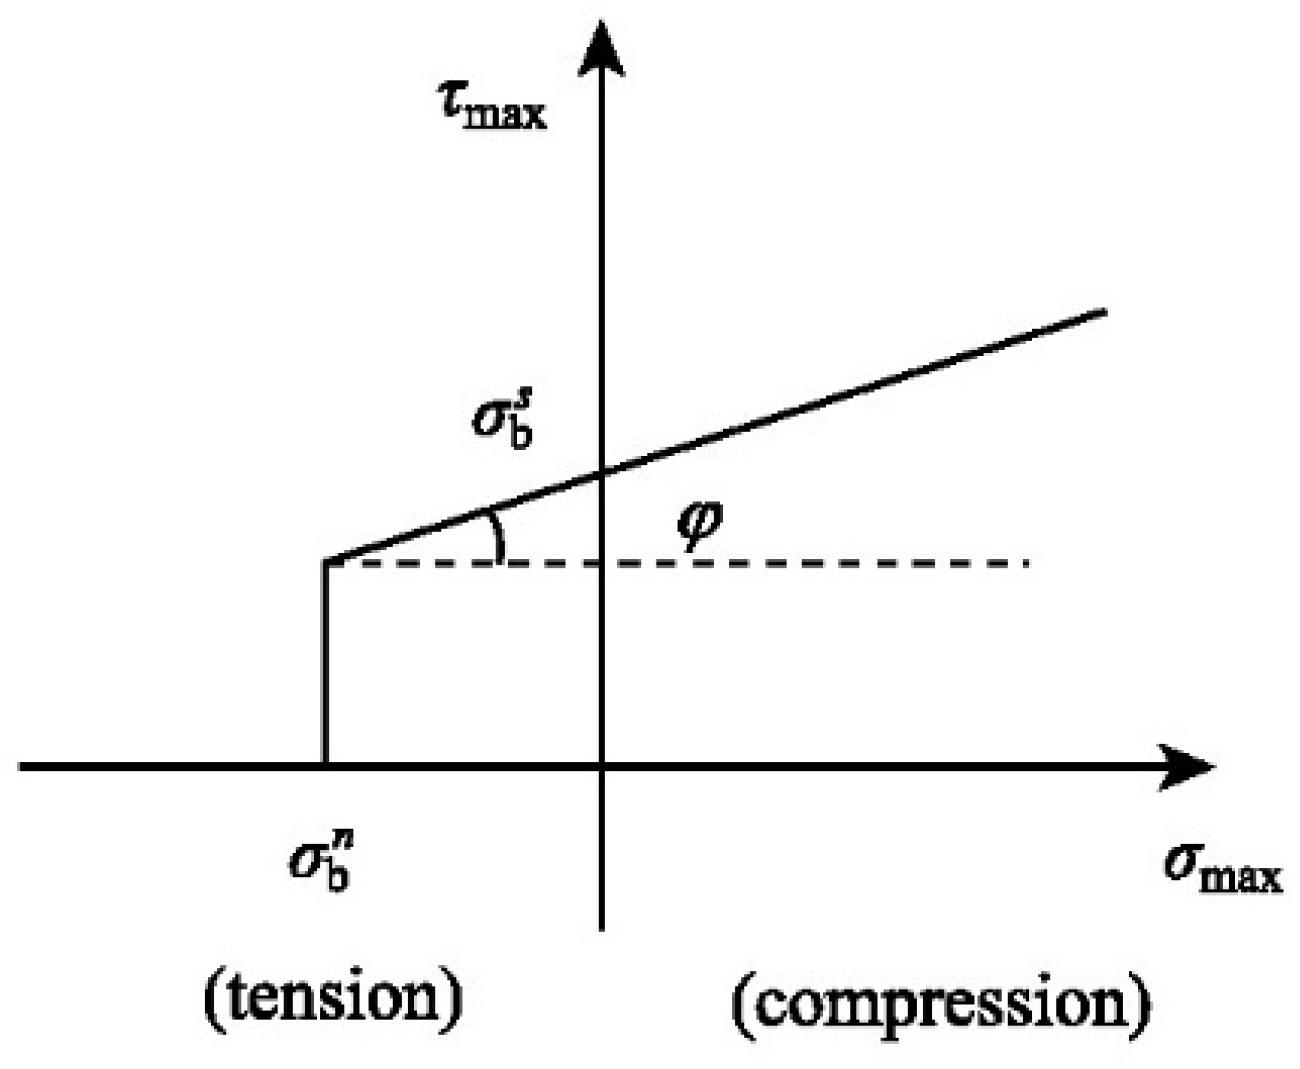
| Particle normal bond strength | σbn | 1.57 | — |
| Particle tangential bond strength | σbs | 1.57 | — |
| Particle compression strength | σc | 2.53 | MPa |
| Ice Speed (m/s) | Empirical Formula | |||||||
|---|---|---|---|---|---|---|---|---|
| 0.1 | 0.2 | 0.3 | 0.4 | 0.5 | Average Value | Standard Deviation | ||
| DEM—cylinder structure | 6007.58 kN | 6983.78 kN | 7717.35 kN | 8386.42 kN | 9063 kN | 7273.78 kN | 1124.58 | 26,343.32 kN |
| FEM—cylinder structure | 9043.24 kN | 13,120.88 kN | 18,343.52 kN | 19,272.79 kN | 20,634.68 kN | 16,083.02 kN | 4343.61 | |
| DEM—cone structure | 4959.72 kN | 5285.41 kN | 5625.54 kN | 5981.75 kN | 6018.99 kN | 5574.28 kN | 406.83 | 6600 kN |
| FEM—cone structure | 2869.34 kN | 3451.97 kN | 4971.67 kN | 5863.48 kN | 6226.38 kN | 4676.57 kN | 1316.32 | |
| Parameter | Value | Unit |
|---|---|---|
| Top diameter | 81 | m |
| Diameter at waterline | 67.5 | m |
| Bottom diameter | 60 | m |
| Depth | 18.4 | m |
| Draft | 11.5 | m |
| Displacement | 28,000 | m3 |
| Cone angle | 31.4 | ° |
Publisher’s Note: MDPI stays neutral with regard to jurisdictional claims in published maps and institutional affiliations. |
© 2022 by the authors. Licensee MDPI, Basel, Switzerland. This article is an open access article distributed under the terms and conditions of the Creative Commons Attribution (CC BY) license (https://creativecommons.org/licenses/by/4.0/).
Share and Cite
Zhang, A.; Chuang, Z.; Liu, S.; Chang, X.; Hou, L.; He, Z.; Liu, S. Research on Mooring System Design for Kulluk Platform in Arctic Region. Water 2022, 14, 1762. https://doi.org/10.3390/w14111762
Zhang A, Chuang Z, Liu S, Chang X, Hou L, He Z, Liu S. Research on Mooring System Design for Kulluk Platform in Arctic Region. Water. 2022; 14(11):1762. https://doi.org/10.3390/w14111762
Chicago/Turabian StyleZhang, Aobo, Zhenju Chuang, Shewen Liu, Xin Chang, Lixun Hou, Zhen He, and Shiqi Liu. 2022. "Research on Mooring System Design for Kulluk Platform in Arctic Region" Water 14, no. 11: 1762. https://doi.org/10.3390/w14111762
APA StyleZhang, A., Chuang, Z., Liu, S., Chang, X., Hou, L., He, Z., & Liu, S. (2022). Research on Mooring System Design for Kulluk Platform in Arctic Region. Water, 14(11), 1762. https://doi.org/10.3390/w14111762


