Article

Estimating Suspended Sediment Fluxes from the Largest Glacial Lake in Svalbard to Fjord System Using Sentinel-2 Data: Trebrevatnet Case Study

1
Alfred Jahn Cold Regions Research Centre, Institute of Geography and Regional Development, University of Wroclaw, 50-137 Wroclaw, Poland
2
Polar-Geo Lab, Department of Geography, Faculty of Science, Masaryk University, 61137 Brno, Czech Republic
3
Geography and Environment, Loughborough University, Loughborough LE11 3TU, UK
*
Author to whom correspondence should be addressed.
Water 2022, 14(12), 1840; https://doi.org/10.3390/w14121840
Submission received: 29 April 2022 / Revised: 27 May 2022 / Accepted: 1 June 2022 / Published: 7 June 2022
(This article belongs to the Special Issue Sediment Dynamics in Coastal and Marine Environment)

Abstract

:
Glacier-fed hydrological systems in high latitude regions experience high seasonal variation in meltwater runoff. The peak in runoff usually coincides with the highest air temperatures which drive meltwater production. This process is often accompanied by the release of sediments from within the glacier system that are transported and suspended in high concentrations as they reach the proglacial realm. Sediment-laden meltwater is later transported to the marine environment and is expressed on the surface of fjords and coastal waters as sediment plumes. Direct monitoring of these processes requires complex and time-intensive fieldwork, meaning studies of these processes are rare. This paper demonstrates the seasonal dynamics of the Trebrevatnet lake complex and evolution of suspended sediment in the lake and sediment plumes in the adjacent Ekmanfjorden. We use the Normalized Difference Suspended Sediment Index (NDSSI) derived from multi-temporal Sentinel-2 images for the period between 2016–2021. We propose a new SSL index combining the areal extent of the sediment plume with the NDSSI for quantification of the sediment influx to the marine environment. The largest observed sediment plume was recorded on 30 July 2018 and extended to more than 40 km2 and a SSL index of 10.4. We identified the greatest sediment concentrations in the lake in the beginning of August, whereas the highest activity of the sediment plumes is concentrated at the end of July. The temporal pattern of these processes stays relatively stable throughout all ablation seasons studied. Sediment plumes observed with the use of optical satellite remote sensing data may be used as a proxy for meltwater runoff from the glacier-fed Trebrevatnet system. We have shown that remote-sensing-derived suspended sediment indexes can (after proper in situ calibration) serve for large scale quantification of sediment flux to fjord and coastal environments.

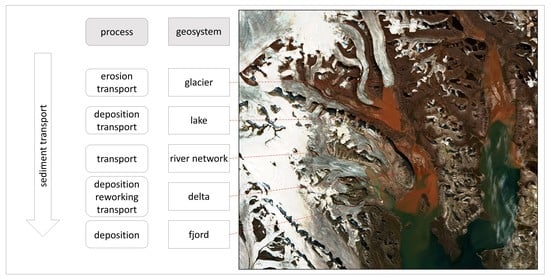
Graphical Abstract

1. Introduction

1.1. Sediment Plumes

Sediment plumes are common features in the fjords and coastal waters of the archipelago of Svalbard [1]. They regularly surface in the summer months between June–August and are a product of meltwater runoff suspending sediment produced during the process of erosion at the ice-bed interface, and lateral areas of glaciers and ice caps [2], or from the remobilisation of previously deposited sediment in the proglacial realm [3]. Sediment plumes can form at the margins of marine-terminating glaciers, where buoyant sediment-laden water sourced from the englacial and subglacial channel networks is evacuated [4]. They can surface at multiple locations across a glacier calving front and, dependent on their magnitude, extend substantial distances into fjords [5]. However, not all sediment plumes are linked to marine-terminating glacier systems, with a large number being formed from glacier-fed subaerial rivers. These are often thinner plumes, as they are delivered onto the fjord surface; as a result they are smaller in scale, but still transport significant volumes of sediment-laden meltwater to fjords and coastal environments [6]. Sediment plumes can impact upon a number of processes, dependent on whether they form at marine-terminating glaciers or from terrestrial glacier-fed rivers, and their size, including calving and submarine melt rates [7], marine biogeochemistry [8], fjord circulation [9], glaciomarine sedimentation [10] and marine and bird life [11].
Our understanding of sediment plumes in Svalbard comes from a combination of modelling [12,13], surface observations [2,14] and the collection of oceanographic data in areas close to where they form [15]. Remote sensing datasets are often used to supplement in situ measurements, but because of the climate regime of the archipelago, cloud cover is very often a limiting factor [16,17]. More recently, higher temporal and spatial resolution datasets, such as Sentinel-2 have been launched, providing improved coverage of the region. These improvements allow us to better understand the behaviour of sediment plumes over shorter time periods [18,19].
Sediment plumes have been well studied in Svalbard, with a large number of in situ studies in two of the most well-known fjord complexes, Isfjorden and Kongsfjorden. However, there have also been studies undertaken in other areas of the archipelago, such as Austfonna in the far Northeast [13]. This research has focussed on various aspects of the glaciological and oceanographic realm, including using sediment plumes to determine volumes of meltwater being delivered to fjords by a marine-terminating glacier [1], to calculate sedimentation rates at a glacier ice front [10], to better understand rapid changes in subglacial hydrology linked to supraglacial processes [14], and more recently using CTD instruments attached to Ringed Seals to understand plume behaviour [20].
Sediment plumes occur as a result of enhanced meltwater runoff. The main source of water available for runoff is connected to the melting of glaciers. Glacier melt is highly dependent on atmospheric conditions and is also affected by long-term climate fluctuations [21]. In Svalbard, the climate is changing on average 2–6 times faster than in other regions of the world. [22,23]. This is demonstrated mainly through the intensive transformation of the landscape, of which glaciers and (especially in recent years) glacial lakes are an important element. Changes in glacier mass balance based on oblique aerial photographs dating from the 1930s have recently been published by a team led by Geyman et al. [24]. This study showed a correlation between areas where temperatures have increased the most over recent decades and where the greatest glacier recession has occurred. Overall, the glacierized area of Svalbard has decreased by about 14.8% [24]. Retreating glaciers leave space in the proglacial area for the development of glacial lakes, the largest number of which on Svalbard are moraine-dammed lakes (52%) [25]. Moraine dams, due to their unconsolidated structure, are dams that are often subject to seasonal changes. It is also common for dams to collapse due to melt-out of dead ice found within them [26]. This can lead to seasonal drainage of moraine-dammed lakes or, in certain situations, to catastrophic Glacial Lakes Outburst Floods (GLOFs). The retreat of glaciers after the Little Ice Age (LIA) led to the development of a large number of glacial lakes that often serve as deposition centres for fine grained fluvio-glacial sediments in Svalbard [27].

1.2. Production and Transport of Sediment

The enhanced melting of Svalbard glaciers and ice caps during the Holocene has released large amounts of sediment previously eroded by the flow of ice over its bedrock. Meltwater has consequently transported the material from land to the coast where it has started to be deposited, reworked, and transported along the shore. One of the most striking and visible examples of such processes is the formation of delta systems. Lønne and Nemec [28] describe the formation of a delta system during the early phase of the Holocene in central Svalbard. The timing of the delta system’s formation was very likely related to the phase of intensive deglaciation between 3000–9000 BP [29]. The greatest sediment transport period occurred during “peak water” when meltwater production was highest [30]. After this point, runoff has steadily declined and so has the transport capacity of glacier-fed rivers. The largest delta systems were formed in the head of Svalbard’s fjords. The relatively shallow environment and protection from the erosive action of waves and long-shore currents created favourable conditions for sediment deposition [31]. Svalbard has a high elevation gradient with potential for transporting a large amount of material towards the coast. This, together with relatively intense glacial isostatic uplift after deglaciation, also promoted the progradation of delta systems. A similar trend of delta progradation in recent conditions was observed by Bendixen et al. [32] in western Greenland, where the glaciers are generally much larger and are still on the rising limb of “peak water” [30].
The volume of material transported from land to sea also depends upon the distance it will be entrained for. Generally, the longer the distance to the coast, the smaller the volume of material that will reach this point. Zajączkowski [33] also demonstrated the difference in the source providing the material, as well as in the bed topography of the fjord, using Adventfjorden and Kongsfjorden, Svalbard as examples. Whereas the sediment transport over the shallow tidal flat of a delta was relatively short and resulted in reactivation of previously deposited material, the transport distances in a marine-terminating glacier-dominated fjord were substantially longer. Zajączkowski and Włodarska-Kowalczuk [34] reported the highest concentration (826 mg L−1) of suspended sediments at the edge of the tidal flat and over the upper slope of the delta in Adventfjorden. Kim et al. [35] reported possible progradation of a delta system in Dicksonfjorden which is very likely linked to high input of suspended sediments from the large glacier-fed basin. Lateral movements of sediment spits were reported in only a short period of time.

1.3. Using Remote Sensing to Detect Suspended Sediment in Fjords and Coastal Waters

Apart from a handful of in situ research campaigns, direct monitoring of sediment transport in the Arctic is often restricted by logistical and financial barriers. Satellite remote sensing is therefore widely used for monitoring and assessment of the quality of surface waters and the dynamics of the hydrosphere [36], with more specific studies taking place in the Arctic region [37,38,39]. Early studies focused on the relationship between reflectance coefficients obtained from the analysis of satellite images and the concentration of suspended sediments, as well as other water quality parameters [39]. Initially, Landsat satellites were key satellites for this type of research. However, with the addition of Sentinel, they are now often used together. In addition, a number of previous studies successfully used data from the MODIS satellite [40]. However, the problem of the latter is its spatial resolution (250 m per pixel), which makes it unsuitable for research in shallow bays, rivers, lakes, and other relatively spatially limited water bodies.
Finding the relationship between suspended sediment concentration (SSC) in water and surface reflectance was a key step in using remote sensing data. In this case, research on detecting indicators of the SSC in water, as well as the calculation of chlorophyll-a, were key (e.g., [41,42]). The reflection coefficient of solar radiation in the visible and infrared parts of the spectrum and the amount of sediment in the water can be directly related. In general, the higher the SSC, the higher the reflectance coefficient in the specific spectrum [43].
The system for calculating many of the above indicators is based on the selection of the necessary combination of channel reflectivity. To begin with, an image undergoes pre-processing, including atmospheric correction, more often by the DOS method [44]. Then, the values of the raster pixels (digital numbers) are converted into the spectral reflectivity coefficient [45,46].
In order to accurately calculate different environmental indicators, it is usually necessary to use the coefficients obtained as a result of in situ sampling. The necessary coefficients are then calculated using a linear regression method that compares in situ data with remote-sensing-derived measurements [45]. However, the sequence of data over one single study site can provide us with reasonable outcomes, even without in situ calibration. The obtained index cannot be attributed to an absolute value of SSC, but multi-temporal comparison is possible. A similar operation is performed, for example, when calculating the vegetation index NDVI [47].

1.4. Aims

The study aims to bridge the gap between scarce in situ measurements and a lack of regular monitoring programs on suspended sediment transport from glaciated basins in the Arctic. For that purpose, we use publicly available remote sensing datasets i.e., Sentinel-2 and a derived index that will be used as a proxy for SSC in water. The settings of the study basin which includes three glaciers, the largest proglacial lake of Svalbard Trebrevatnet and adjacent Ekmanfjorden offers a unique opportunity to study sediment transport processes in their complexity. We present an assessment of the suspended sediment transport through the Trebrevatnet lake system down to the fjord environment, where vast sediment plumes are observed. We provide an analysis of seasonal fluctuations in observed sediment transport-related features as well as meltwater production variability effects on lake areal extent. Variability of observed parameters is also compared with air temperature records as a key factor influencing meltwater production.

1.5. Study Site

Trebrevatnet and Ekmanfjorden are located in central Spitsbergen. They are situated in the northernmost part of Isfjorden, the largest fjord system of Svalbard (Figure 1). Ekmanfjorden is a deep fjord system that is surrounded by relatively high mountain ranges covered by ice caps, with abundant glaciers flowing towards the fjord. The bedrock of the study area is primarily sedimentary rock, namely the Old Red Sandstone of the Devonian period [48] which is responsible for the distinct reddish colour of the glacio-fluvial sediments in the area. Trebrevatnet itself is dammed by a large frontal moraine that marked the position of glacier fronts during the Little Ice Age maximum dated to around 1900 in central Svalbard [49]. The climate of this region of Svalbard is considered as continental dry, with milder summer temperatures and cold winter temperatures [50]. The fjord experiences prolonged periods of sea ice cover with the break-up of sea ice usually occurring during early June. These conditions are, however, quickly changing with ongoing climate change, with higher local air temperatures resulting in a decline in sea ice extent [51]. The actual average air temperature at the closest monitoring site in Petuniabukta (Billefjorden) was reported to be in the range from −3.7 °C near the coast to −8.4 °C at the peak of Mumien (773 m.a.s.l.) [52]. Mean monthly air temperatures exceeding 0 °C were usually recorded from mid-June to September [53].
Trebrevatnet is the largest frontal-moraine dammed lake in the entire agrchipelago. Its development is linked to the recession of three glaciers: Holmströmbreen, Morabreen and Orsabreen. The maximum glaciation of this area, which occurred at the end of the LIA, is estimated to have been around the turn of the 19th and 20th centuries. The visible terminal moraine which forms the dam of the lake has an average height of 69 m above sea level. The difference between the top of the moraine dam and the lake (situated 17 m a.s.l.) is therefore about 52 m. The outlet of the lake through the previously described dam is located in the south-eastern margin and is about 57 metres wide and lies at an altitude of about 15 m a.s.l. The first observed reservoir that gave rise to Trebrevatnet was visible on archival aerial photographs dating from 1936, when it had an area of 0.02 km2 (0.66 km perimeter). In the following decades it developed very rapidly, due to the intensive recession of the nearby glaciers, meaning that by the 1990s its surface area was already 0.99 km2 (perimeter 10.06 km). The largest lake area was observed in 2013 (August) and was 20.87 km2 (36 km perimeter) [25]. These data therefore indicate a very extensive lake shoreline that is subject to seasonal fluctuations with an indication of July-August as the period where there is a peak in lake water extent.
In the proglacial zone, which is bounded by a terminal moraine formed during the LIA maximum glacier extent, there are two smaller terminal moraines which provides evidence of historical glacial surges. Farnsworth et al. [54] reported two documented surges at Holmströmbreen and Orsabreen, which occurred consecutively, and two previously undocumented surges at Morabreen and Kyrkjebreen [55]. All glacial surges must have taken place between the 1930s and 2000s. Since the turn of the 21st century, we now have systematic satellite data that rule out such episodes. Nevertheless, all surges show evidence of highly dynamic glaciers, which, combined with the equally dynamic development of Trebrevatnet, results in the delivery of glacio-fluvial sediments to the lake catchment and subsequently to Ekmanfjorden.

2. Materials and Methods

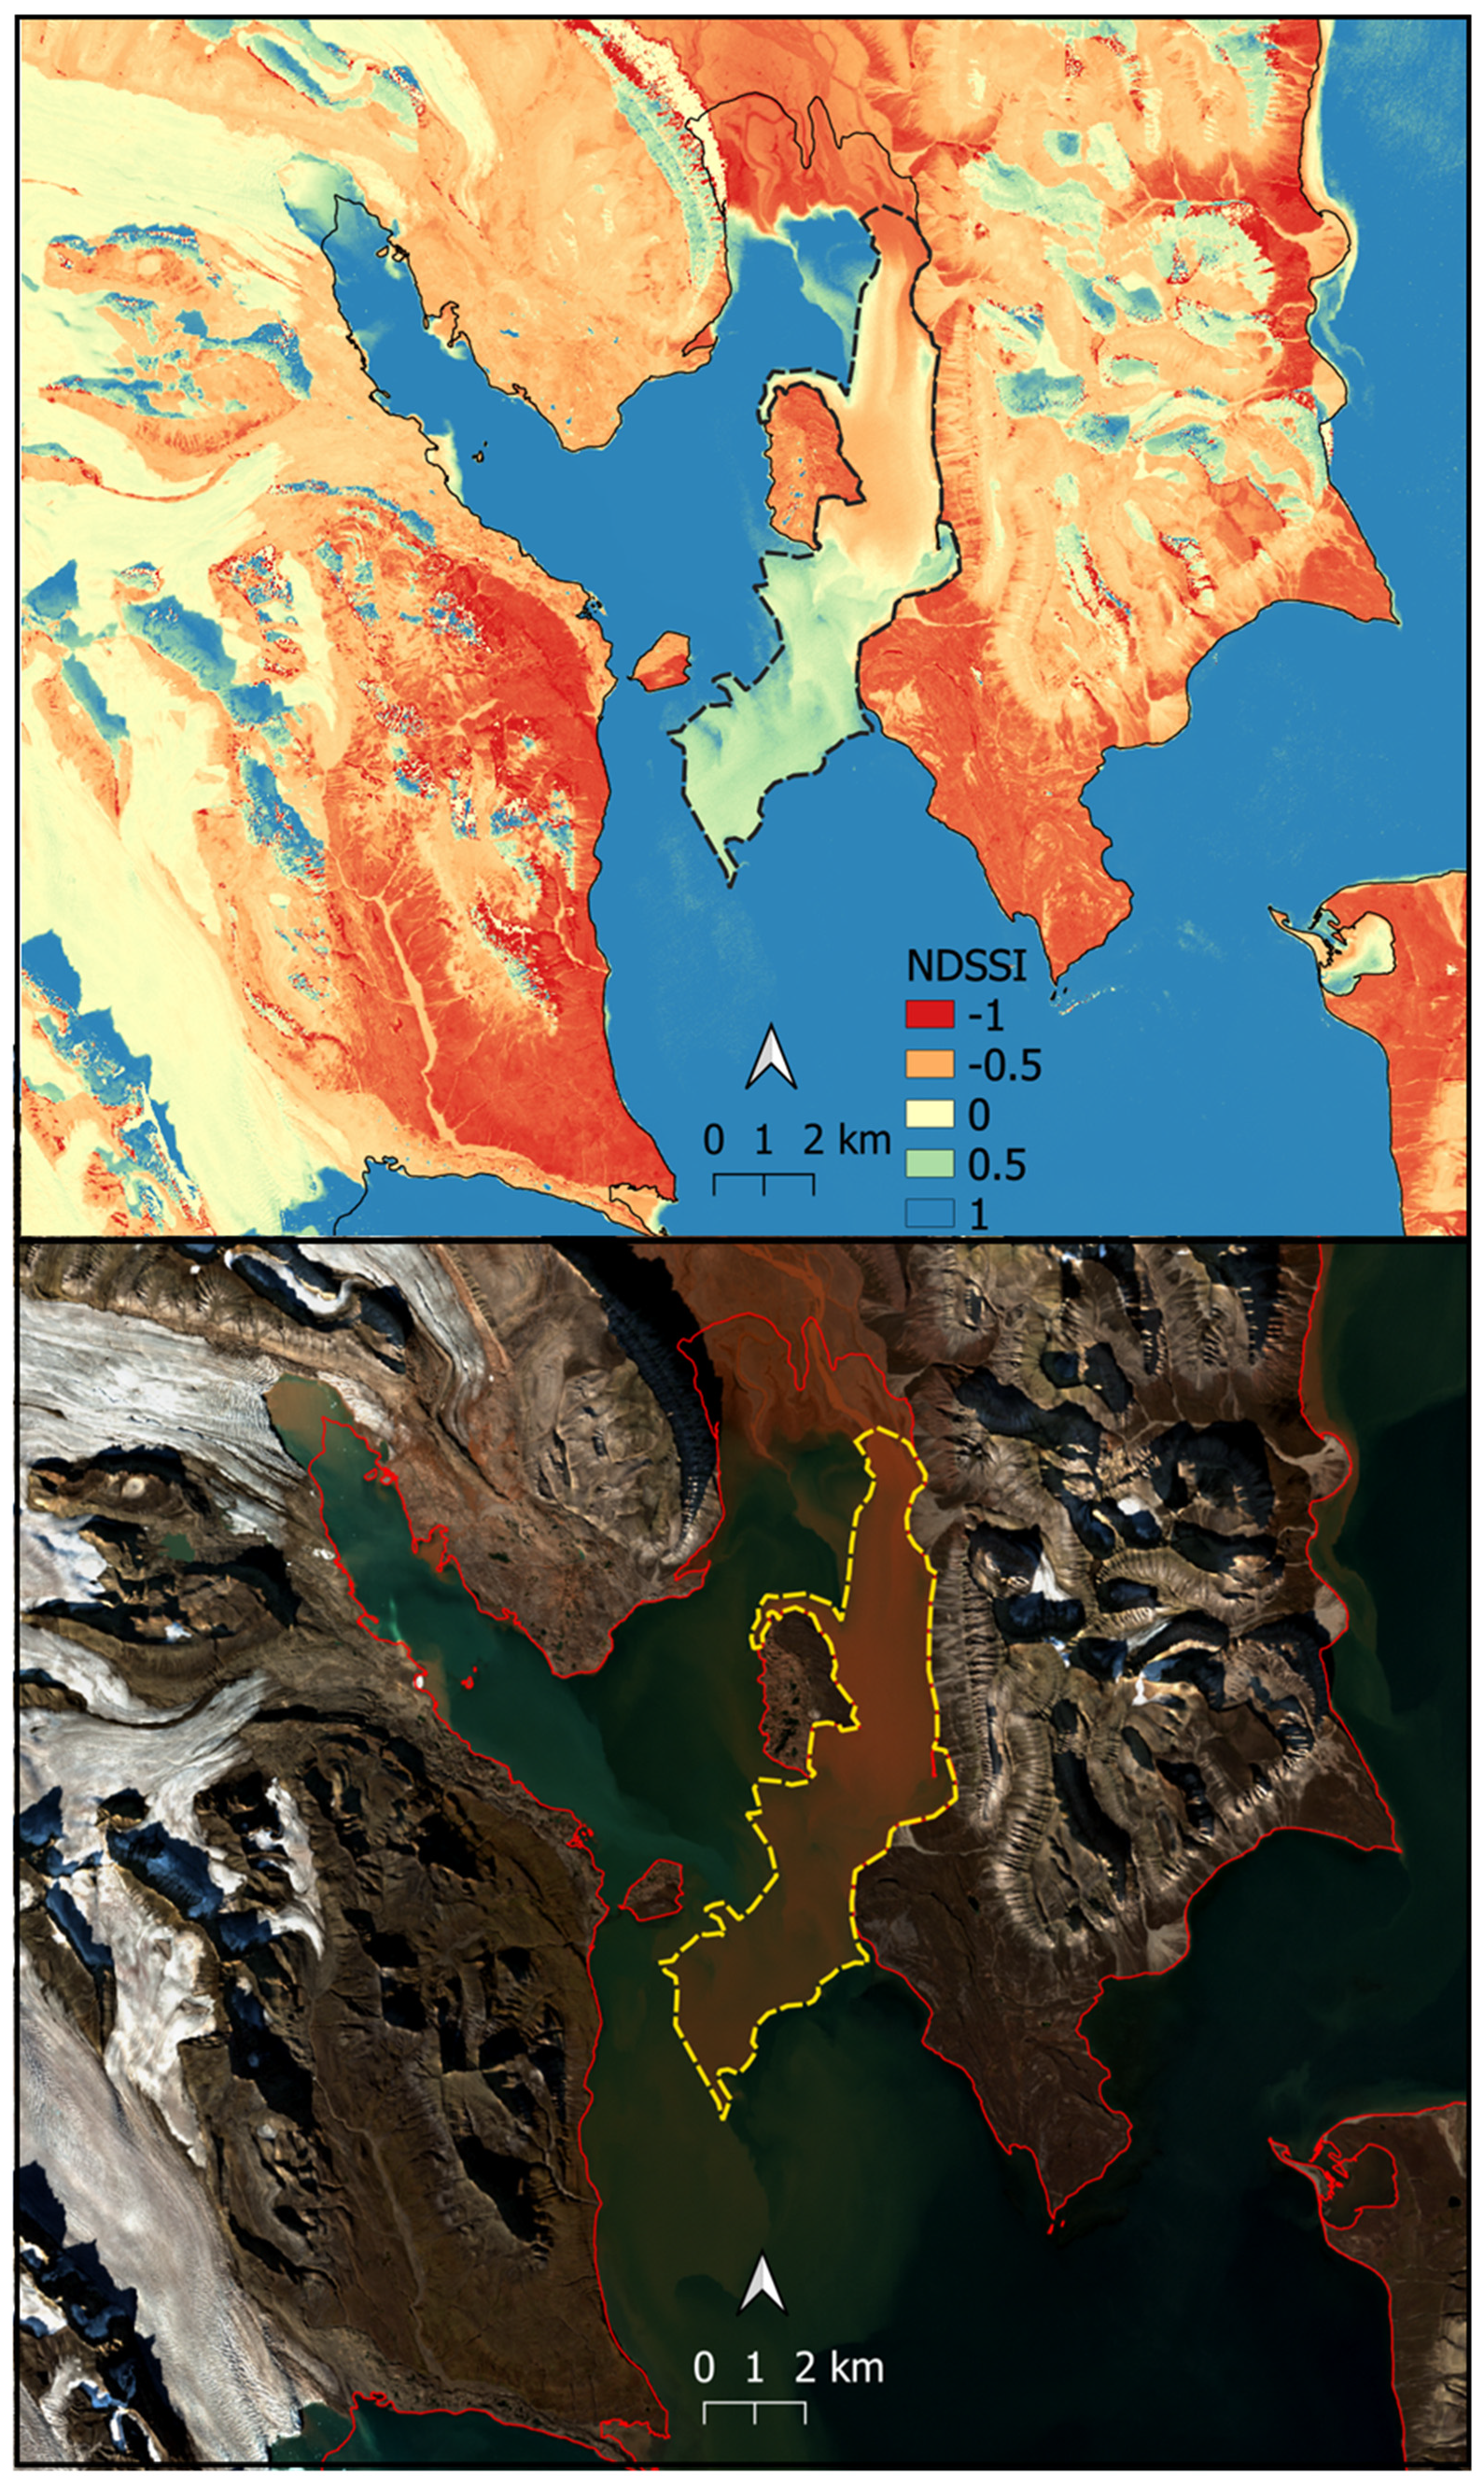
A series of Sentinel-2 (L2) images from 2016–2021 was used to determine SSC at Trebrevatnet and to quantify the SSC and areal extent of sediment plumes in Ekmanfjorden. We used the NDSSI index derived from a combination of bands 2 and 8 from Sentinel-2 (Figure 2). The formula was originally created to calculate the normalized difference vegetation index (NDVI). However, the ratio has since been transformed to calculate the difference in the reflectivity of blue and infrared channels, by their sum:
NDSSI = ρ NIR   ρ BLUE ρ NIR +   ρ BLUE
where, ρ NIR (near-infrared) and ρ BLUE (blue) are the reflectance values of Sentinel Bands 2 and 8 (equivalent to Landsat bands 2 and 5).
Hossain et al. [47] introduced the index with the use of data from the Landsat 7 ETM+ satellite. In this case, the blue channel corresponded to a frequency of 0.450–0.515 µm, near-infrared to about 0.750–0.900 µm. In our study, we decided to use Sentinel-2 (L2) satellite data for their better spatial (10 m) and temporal resolution. To calculate the NDSSI index from Sentinel-2, similar frequency channels were selected (Blue—0.458–0.523, NIR—0.785–0.899 µm). A similar approach was also used by Munir et al. [56]. Then, using QGIS and the Semi-Automatic classification module, atmospheric correction was performed using the DOS method [57]. Raster calculation was then used to obtain final raster images containing index data. This raster image was later masked with the shapefile of lake extent or sediment plume for each date separately and an average value of NDSSI calculated.
The index resulting from the formula is used to estimate SSC in the water and ranges from −1 to 1. The lower the index the higher the SSC. Calibration with in situ measurements is necessary to estimate the absolute values of SSC in the study site. This was, however, not possible, so the average NDSSI index (over the sediment plume area) was considered as a proxy value. To bridge this limitation, we developed an index combining the NDSSI and the areal extent of the plume. The NDSSI index was turned into a 0–1 index of SSC intensity (where 0 is fjord water, 1 is the 100% suspension of sediment in fjord waters). By multiplying the areal extent with the SSC intensity, we obtained a parameter reflecting both the area and SSC. This enables us to compare plumes of different size with different SSCs.
Meteorological data from Adventdalen (operated and provided by UNIS) were used to illustrate the seasonal evolution of air temperature. The original 1-h data were averaged to obtain mean daily air temperature.

3. Results and Discussion

3.1. Suspended Sediment Transport

All the parameters studied show significant seasonal development (Figure 3). NDSSI indexes for both Trebrevatnet lake water and sediment plumes within Ekmanfjorden decreased until the end of July or beginning of August before starting to increase again. The peak of the NDSSI in sediment plumes usually preceded the peak in NDSSI at Trebrevatnet. The later peak in the NDSSI in the lake may be attributed to continual deposition of fine-grained mineral material in the lake, whereas the sediment plumes in the fjord react more rapidly to actual sediment and meltwater input. The seasonal evolution of suspended sediment load (SSL) in Ekmanfjorden corresponds well with the observed sediment transport dynamics from different parts of Svalbard–Kronebreen in NW Svalbard [2,14]; Tunabreen in central Svalbard [2]; and Hansbreen in southern Svalbard [58]. Similar behaviour was observed also in different parts of the Arctic (e.g., [59]).
The combined SSL index (integrating NDSSI and areal extent of the plume) shows very similar seasonal pattern to the NDSSI with the peak in late July or early August. The highest recorded SSL index (11.4) was observed on 30 July 2018. Such a high value can be attributed to the extremely large sediment plume extent (40.5 km2). We argue that by implementing the SSL index as a combination of areal extent of the plume and the NDSSI as a proxy for SSC, it can be considered as a good sign of the intensity of the sediment transport process from land to sea. Both parameters (areal extent and NDSSI) are affected by external factors such as wind and wave actions, offshore currents, and fjord circulation. On one hand, high wind speed and wave action, as well as intense offshore currents, may lead to spreading of the sediment-laden water across a larger area. On the other hand, this may also decrease the SSC. During stable weather and sea conditions the plume may stay within a relatively small area, but with much higher SSC. Thus, the two parameters assessed independently may be misleading. Moreover, the amount of sediment transported to the marine environment is often considered as a good proxy of meltwater runoff production (e.g., [60]). This assumption was used to monitor long term changes of meltwater runoff from the Greenland Ice Sheet [38]. The combination of sediment plume areal extent (used by McGrath et al. [60]) with the NDSSI may lead to more precise estimation of meltwater runoff production in the future.
The relationship between SSL and the lake NDSSI presented in Figure 4 suggests that there is a negative correlation (correlation coefficient = −0.65). The lake serves as a temporary storage of suspended material which is later released to the marine environment. The higher the SSC in the lake, the greater the volume of sediments that are being further transported to the fjord. Even though the two systems—lake and fjord—are connected by an approximately 8 km river network, the correlation is not as high as expected. This is probably due to the large volume of the lake and consequently a delayed reaction of the SSL index. The increased ablation and meltwater production release large volumes of sediment-laden meltwater to the lake which is later transported to the fjord. The increase of the SSL index in the fjord may thus be delayed by several days. The earlier peak of SSL compared to the peak in lake NDSSI could probably be attributed to the earlier peak of meltwater production (corresponding to a peak in air temperature in late July).

3.2. Lake Areal Extent

The overall seasonal dynamics of sediment transport corresponds well with air temperature, a main driver of meltwater production from the complex glacier system. This relationship is similar to other Arctic regions, for example Chu et al. [37] reported significant correlation between positive degree days and SSC observations in multiple fjords around Greenland. The three glaciers above Trebrevatnet not only provide the meltwater but also the sediments that are partly deposited in the lake basin, and partly transported onward to the fjord. The meltwater production and its intensity are also reflected in the lake areal extent (Figure 5). As meltwater production increases, the lake fills and overtops which results in flooding of the shallow shore zones, especially on its western side adjacent to glacier forefields This can lead to the lake areal extent varying between 13.5 km2 and 20 km2 during its maximum water level and areal extent in the peak season (late July). The variability of the areal extent is high throughout the study period with most of the years experiencing only small changes. Lake areal extent reached up to 20 km2 only during the summers of 2016 and 2020. This may, however, be impacted by gaps in the Sentinel-2 image series. The maximum extent of the lake might have been missed due to extensive cloud cover [17] during periods of high meltwater production. This is especially true for a highly variable process such as meltwater runoff, which fluctuates not only from day to day but also within a single day [61,62].
In addition to the increased ablation of the glaciers themselves, which supply water to Trebrevatnet, there is a correlation between the areal extent of the smaller supraglacial lakes, lateral moraine dammed lakes and ice-dammed lakes located in the upper parts of the Trebrevatnet catchment. During the period when Trebrevatnet reached its maximum extent in a given season (i.e., July 2016 and 2020), all lakes located in the upper part of the catchment had either drained completely or visibly decreased in size. This allows us to surmise that during the increased ablation of the glaciers that feed Trebrevatnet, subglacial channels open up to allow the drainage of these lakes, which in turn has led to abrupt filling of Trebrevatnet. It seems probable that these supraglacial lakes and their rapid drainage play a key role in the observed variability in the areal extent of Trebrevatnet. Abrupt drainage of supraglacial and ice-contact lakes are frequently observed in Himalaya [63], Greenland [64], Svalbard [18], the European Alps [65] and even in Antarctica [66].

3.3. Conceptual Model of the Geosystem

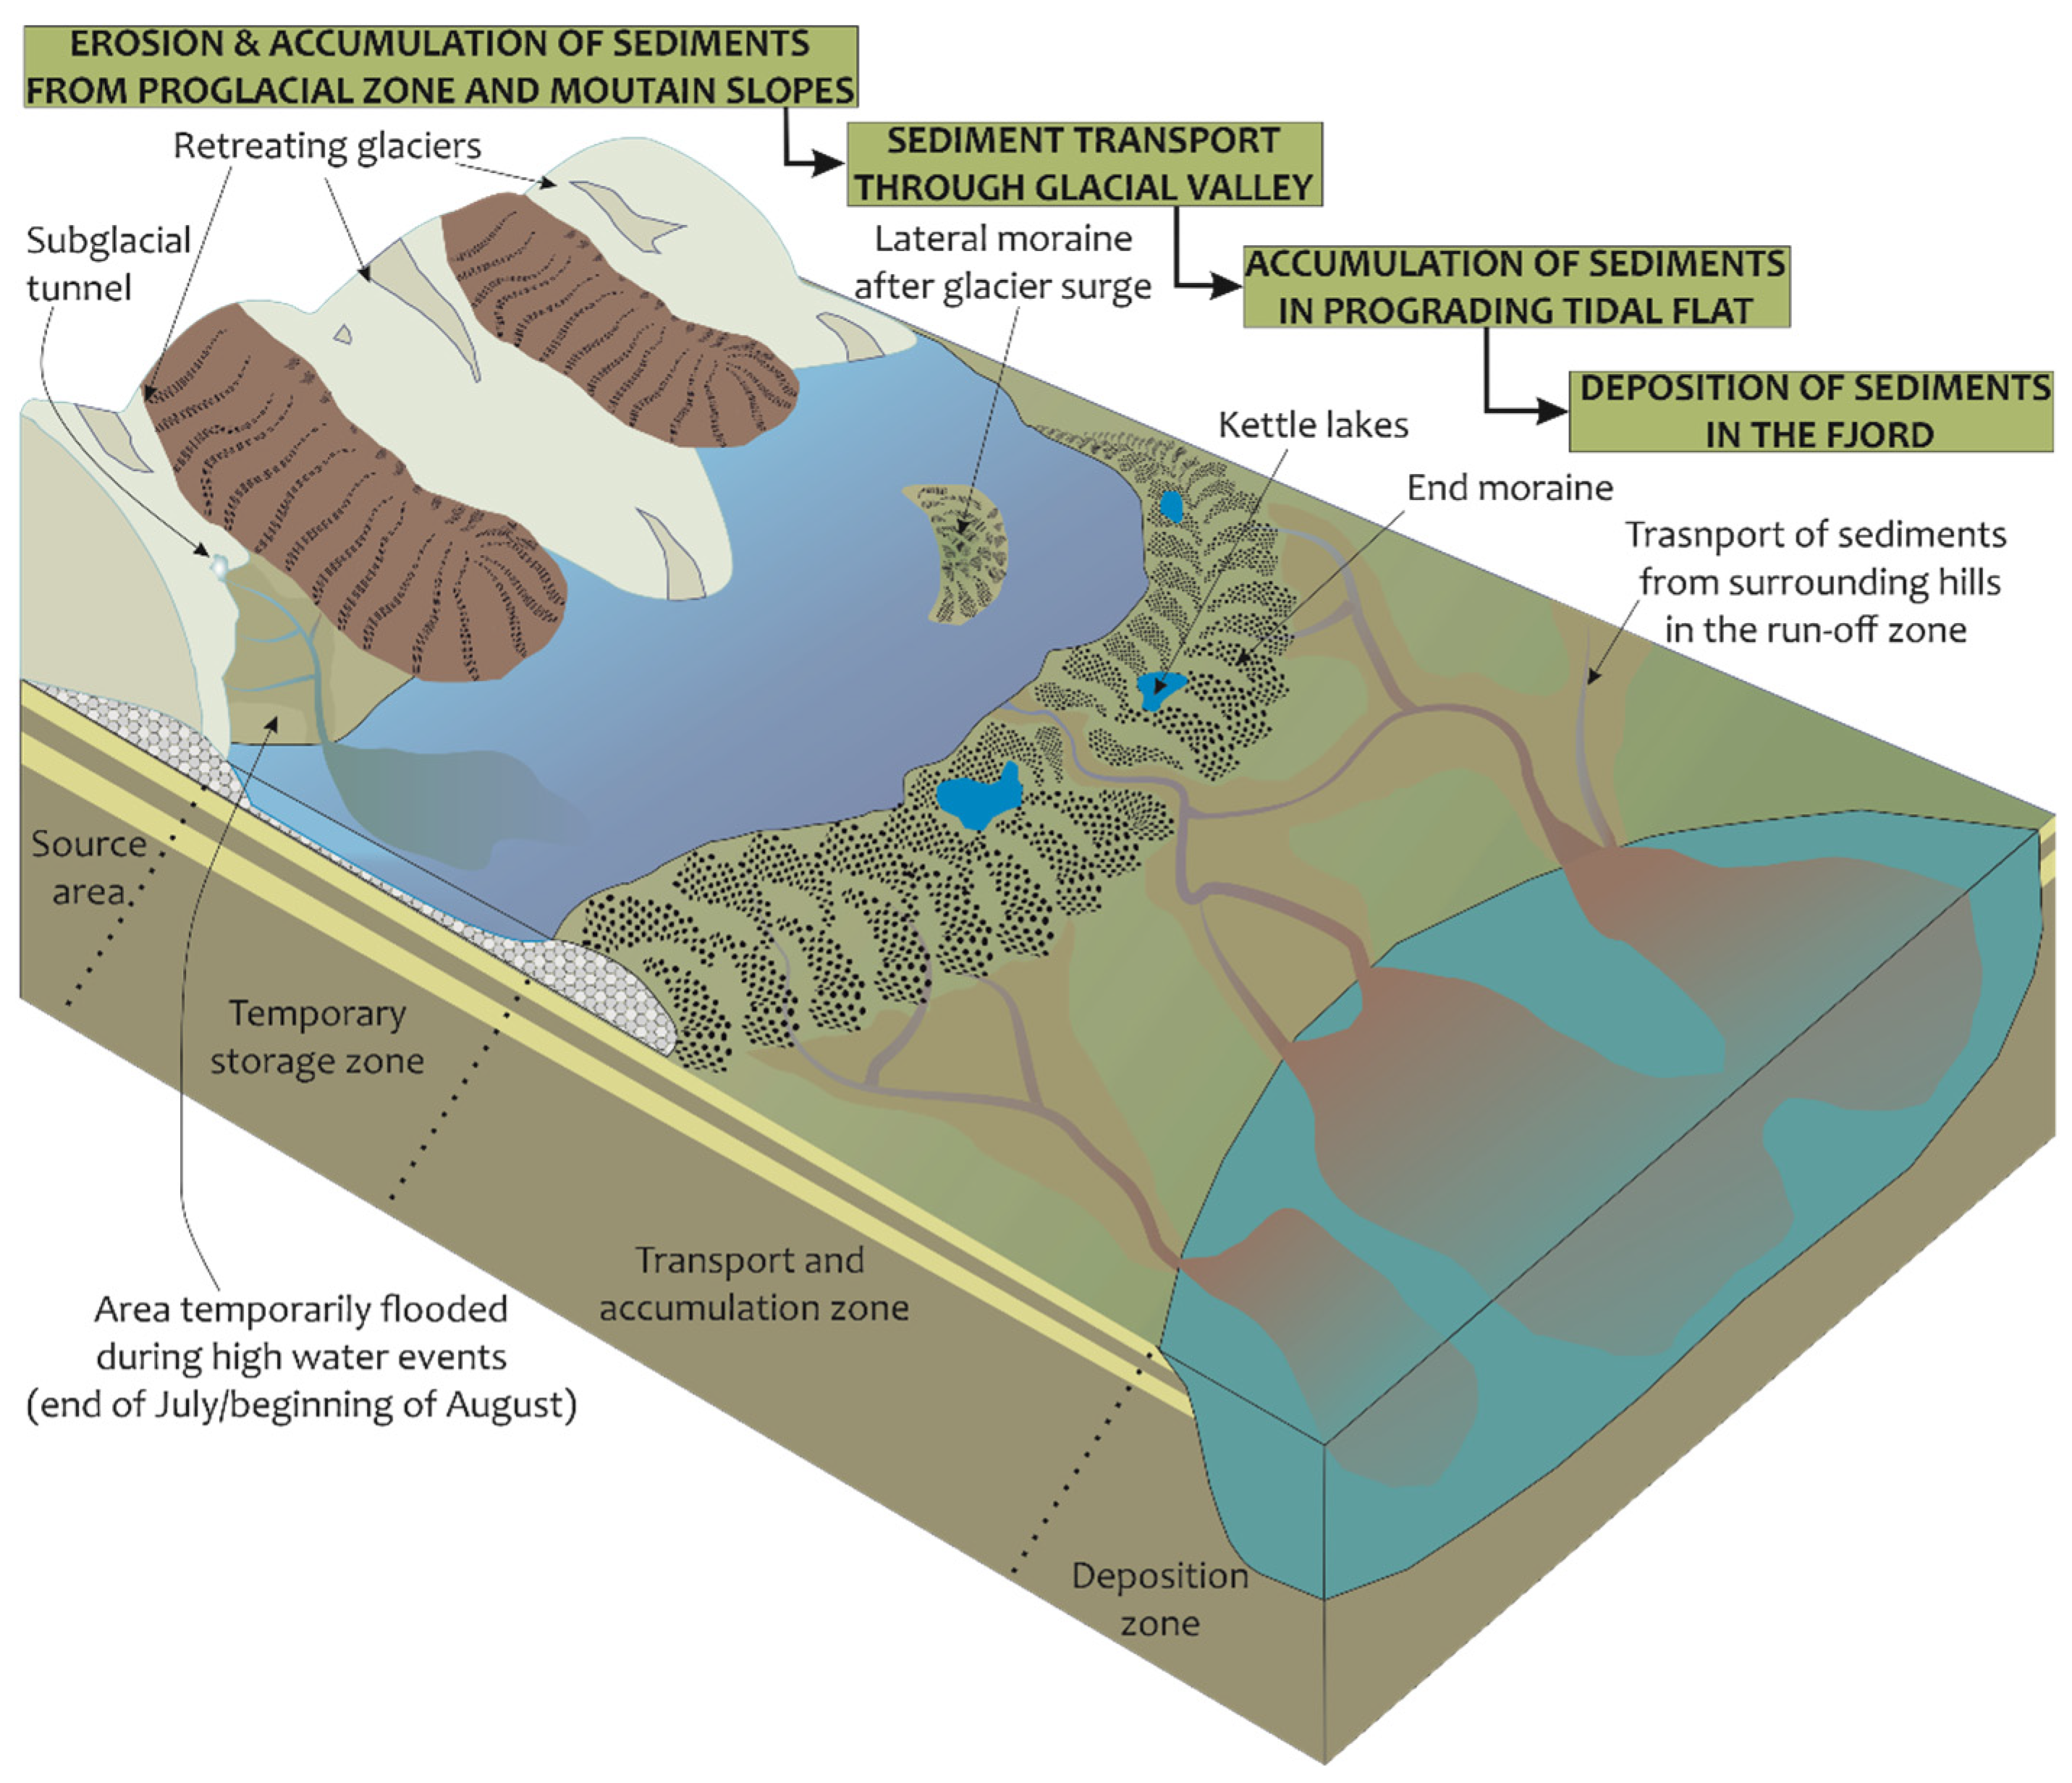
The key element of the functioning of the whole Trebrevatnet geosystem is the glacier. It provides both meltwater and fine-grained sediments. Sediment material is transported mainly through the subglacial conduits and over the deglaciated glacier forelands into the lake. The lake itself serves as a deposition centre where the largest particles are stored. Only the finest particles that stay in suspension are consequently transported towards the fjord. The continuous input of fine-grained material is responsible for development of a vast tide-dominated delta system in the fjord head. The marine environment in the fjord represents the final point at which at which sediment material is deposited. Due to multiple external forcings (wave action, tide currents, wind), suspended sediments spread in the fjord in the form of vast sediment-laden plumes (Figure 6).
The described sediment transport dynamics are driven by glacier meltwater production and the availability of fine-grained sediments eroded and transported by the glacier. However, with ongoing climate warming in Svalbard [51] the glaciers are rapidly melting [24,67]. The increased melting of a glacier is often accompanied by increased runoff until a turning point (i.e., “peak water”) when the glacier is reduced in its extent and volume and can no longer support the increasing runoff—which later decreases [68]. Smaller glaciers are more sensitive to climate fluctuations and have lost more of their mass since the LIA [69]. Glaciers feeding the Trebrevatnet system are large, so it is likely that the runoff will sustain or even increase in the coming decades leading to significant sediment transport from land to sea. However, sediment deposition in the lake basin might be interrupted by abrupt drainage due to instability and continuous melt of the frontal ice-cored moraine [26]. These kind of lake dams are considered to be the most vulnerable to GLOF events [25].

4. Conclusions

Sediment-laden meltwater is transported through a complex hydrologic network and is later released to the marine environment. This process is expressed in the appearance of sediment plumes that are detectable in fjord and coastal waters. In this paper, we have demonstrated the ability to monitor and quantify the transport of sediment from land to sea with the use of multi-temporal optical remote sensing data from Sentinel-2. The NDSSI and derived SSL index proved to be a useful tool to describe the sediment transport dynamics within the glacier-lake-fjord system. Sediment plumes begin to surface in late June or the beginning of July and the peak transport intensity is concentrated between the period at the end of July and the beginning of August in each of the years of the study. The relatively weak correlation between the lake NDSSI and sediment plume SSL index suggests complexity in sediment transport processes and possible lags in transit of sediment material influencing the intensity of sediment plumes in Ekmanfjorden. As glaciers in the Svalbard region recede further, as a result of increasing global temperatures, more complex glacier systems such as the glacier-fed Trebrevatnet will form. It is necessary to understand how meltwater and sediment will be routed from land to sea, as this will not only have impacts on the local fjord environment, but also in communities further afield.

Author Contributions

Conceptualization, J.K.; methodology, J.K., M.D. and J.U.; software, M.D.; validation, J.K., M.D. formal analysis, J.K., I.W. and J.U.; resources, J.K. and I.W.; writing—original draft preparation, J.K., I.W., G.D.T., M.D. and M.C.S.; writing—review and editing, J.K., G.D.T. and M.C.S.; visualization, J.K. and I.W.; supervision, M.C.S.; funding acquisition, M.C.S. All authors have read and agreed to the published version of the manuscript.

Funding

The research leading to these results has received funding from the Norwegian Financial Mechanism 2014–2021: SVELTA—Svalbard Delta Systems Under Warming Climate (UMO-2020/37/K/ST10/02852) based at the University of Wroclaw. This work was also supported by the Masaryk University projects ARCTOS MU (MUNI/G/1540/2019) and MUNI/A/1570/2020.

Institutional Review Board Statement

Not applicable.

Informed Consent Statement

Not applicable.

Data Availability Statement

The remote sensing data used in the study are available from the SentinelHub platform via the EO-browser (https://apps.sentinel-hub.com/eo-browser, accessed on 12 April 2022).

Conflicts of Interest

The authors declare no conflict of interest.

References

  1. Darlington, E.F. Meltwater Delivery from the Tidewater Glacier Kronebreen to Kongsfjorden, Svalbard; Insights from in-situ and Remote-Sensing Analyses of Sediment Plumes. Doctoral Dissertation, Loughborough University, Loughborough, UK, 2015. [Google Scholar]
  2. Schild, K.M.; Hawley, R.L.; Chipman, J.W.; Benn, D.I. Quantifying suspended sediment concentration in subglacial sediment plumes discharging from two Svalbard tidewater glaciers using Landsat-8 and in situ measurements. Int. J. Remote Sens. 2017, 38, 6865–6881. [Google Scholar] [CrossRef]
  3. Porter, P.R.; Vatne, G.; Ng, F.; Irvine-Fynn, T.D. Ice-marginal sediment delivery to the surface of a high-Arctic glacier: Austre Brøggerbreen, Svalbard. Geogr. Ann. Ser. A Phys. Geogr. 2010, 92, 437–449. [Google Scholar] [CrossRef]
  4. Hewitt, I.J. Subglacial plumes. Annu. Rev. Fluid Mech. 2020, 52, 145–169. [Google Scholar] [CrossRef]
  5. Meslard, F.; Bourrin, F.; Many, G.; Kerhervé, P. Suspended particle dynamics and fluxes in an Arctic fjord (Kongsfjorden, Svalbard). Estuar. Coast. Shelf Sci. 2018, 204, 212–224. [Google Scholar] [CrossRef]
  6. Bogen, J.; Bønsnes, T.E. Erosion and sediment transport in High Arctic rivers, Svalbard. Polar Res. 2003, 22, 175–189. [Google Scholar] [CrossRef]
  7. How, P.; Schild, K.M.; Benn, D.I.; Noormets, R.; Kirchner, N.; Luckman, A.; Vallot, D.; Hulton, N.R.; Borstad, C. Calving controlled by melt-under-cutting: Detailed calving styles revealed through time-lapse observations. Ann. Glaciol. 2019, 60, 20–31. [Google Scholar] [CrossRef] [Green Version]
  8. Jørgensen, B.B.; Laufer, K.; Michaud, A.B.; Wehrmann, L.M. Biogeochemistry and microbiology of high Arctic marine sediment ecosystems—Case study of Svalbard fjords. Limnol. Oceanogr. 2021, 66, S273–S292. [Google Scholar] [CrossRef]
  9. Torsvik, T.; Albretsen, J.; Sundfjord, A.; Kohler, J.; Sandvik, A.D.; Skarðhamar, J.; Lindbäck, K.; Everett, A. Impact of tidewater glacier retreat on the fjord system: Modeling present and future circulation in Kongsfjorden, Svalbard. Estuar. Coast. Shelf Sci. 2019, 220, 152–165. [Google Scholar] [CrossRef]
  10. Kehrl, L.M.; Hawley, R.L.; Powell, R.D.; Brigham-Grette, J. Glacimarine sedimentation processes at Kronebreen and Kongsvegen, Svalbard. J. Glaciol. 2011, 57, 841–847. [Google Scholar] [CrossRef] [Green Version]
  11. Lydersen, C.; Assmy, P.; Falk-Petersen, S.; Kohler, J.; Kovacs, K.M.; Reigstad, M.; Steen, H.; Strøm, H.; Sundfjord, A.; Varpe, Ø.; et al. The importance of tidewater glaciers for marine mammals and seabirds in Svalbard, Norway. J. Mar. Syst. 2014, 129, 452–471. [Google Scholar] [CrossRef]
  12. Mugford, R.I.; Dowdeswell, J.A. Modeling glacial meltwater plume dynamics and sedimentation in high-latitude fjords. J. Geophys. Res. Earth Surf. 2011, 116, F01023. [Google Scholar] [CrossRef]
  13. Dowdeswell, J.A.; Hogan, K.A.; Arnold, N.S.; Mugford, R.I.; Wells, M.; Hirst, J.P.P.; Decalf, C. Sediment-rich meltwater plumes and ice-proximal fans at the margins of modern and ancient tidewater glaciers: Observations and modelling. Sedimentology 2015, 62, 1665–1692. [Google Scholar] [CrossRef] [Green Version]
  14. How, P.; Benn, D.I.; Hulton, N.R.J.; Hubbard, B.; Luckman, A.; Sevestre, H.; van Pelt, W.J.J.; Lindbäck, K.; Kohler, J.; Boot, W. Rapidly changing subglacial hydrological pathways at a tidewater glacier revealed through simultaneous observations of water pressure, supraglacial lakes, meltwater plumes and surface velocities. Cryosphere 2017, 11, 2691–2710. [Google Scholar] [CrossRef] [Green Version]
  15. Holmes, F.A.; Kirchner, N.; Kuttenkeuler, J.; Krützfeldt, J.; Noormets, R. Relating ocean temperatures to frontal ablation rates at Svalbard tidewater glaciers: Insights from glacier proximal datasets. Sci. Rep. 2019, 9, 9442. [Google Scholar] [CrossRef] [PubMed]
  16. Marshall, G.J.; Rees, W.G.; Dowdeswell, J.A. Limitations imposed by cloud cover on multitemporal visible band satellite data sets from polar regions. Ann. Glaciol. 1993, 17, 113–120. [Google Scholar] [CrossRef] [Green Version]
  17. Østby, T.I.; Schuler, T.V.; Westermann, S. Severe cloud contamination of MODIS Land Surface Temperatures over an Arctic ice cap, Svalbard. Remote Sens. Environ. 2014, 142, 95–102. [Google Scholar] [CrossRef]
  18. Kavan, J.; Haagmans, V. Brief communication: Hydrologic connectivity of a tidewater glacier characterized with Sentinel-2 satellite images–a case study of Nordenskiöldbreen, Svalbard. Cryosphere Discuss. 2022. preprint. [Google Scholar] [CrossRef]
  19. Tallentire, G.D.; Shiggins, C.J.; Rawlins, L.D.; Evans, J.; Hodgkins, R. Observing relationships between sediment-laden meltwater plumes, glacial melt and a retreating terminus. Int. J. Remote Sens. in prepint.
  20. Everett, A.; Kohler, J.; Sundfjord, A.; Kovacs, K.M.; Torsvik, T.; Pramanik, A.; Boehme, L.; Lydersen, C. Subglacial discharge plume behaviour revealed by CTD-instrumented ringed seals. Sci. Rep. 2018, 8, 13467. [Google Scholar] [CrossRef] [PubMed]
  21. Marshall, S.J. Regime Shifts in Glacier and Ice Sheet Response to Climate Change: Examples From the Northern Hemisphere. Regime Shifts in Glacier and Ice Sheet Response to Climate Change: Examples From the Northern Hemisphere. Front. Clim. 2021, 3, 702585. [Google Scholar] [CrossRef]
  22. Nordli, Ø.; Przybylak, R.; Ogilvie, A.E.J.; Isaksen, K. Long-term temperature trends and variability on Spitsbergen: The extended Svalbard Airport temperature series, 1898–2012. Polar Res. 2014, 33, 21349. [Google Scholar] [CrossRef] [Green Version]
  23. Isaksen, K.; Nordii, Ø.; Førland, E.J.; Łupikasza, E.; Eastwood, D.; Niedźwiedź, T. Recent warming on Spitsbergen—Influence of atmospheric circulation and sea ice cover. J. Geophys. Res. Atmos. 2016, 121, 3446–3464. [Google Scholar] [CrossRef]
  24. Geyman, E.; van Pelt, W.; Maloof, A.; Aas, H.; Kohler, J. Historical glacier change on Svalbard predicts doubling of mass loss by 2100. Nature 2022, 601, 374–379. [Google Scholar] [CrossRef]
  25. Wieczorek, I.; Strzelecki, M.C.; Stachnik, Ł.; Yde, J.C.; Małecki, J. Inventory and classification of the post Little Ice Age glacial lakes in Svalbard. Cryosphere Discuss. 2022. preprint. [Google Scholar] [CrossRef]
  26. Schomacker, A.; Kjaer, K.H. Quantification of dead-ice melting in ice-cored moraines at the high-Arctic glacier Holmstrombreen, Svalbard. BOREAS 2008, 37, 211–225. [Google Scholar] [CrossRef]
  27. Ewertowski, M. Recent transformations in the high-Arctic glacier landsystem, Ragnarbreen, Svalbard. Geogr. Ann. Ser. A Phys. Geogr. 2014, 96, 265–285. [Google Scholar] [CrossRef] [Green Version]
  28. Lønne, I. Nemec WHigh-arctic fan delta recording deglaciation and environment disequilibrium. Sedimentology 2004, 51, 553–589. [Google Scholar] [CrossRef]
  29. Fjeldskaar, W.; Bondevik, S.; Amantov, A. Glaciers on Svalbard survived the Holocene thermal optimum. Quat. Sci. Rev. 2018, 199, 18–29. [Google Scholar] [CrossRef]
  30. Huss, M.; Hock, R. Global-scale hydrological response to future glacier mass loss. Nat. Clim. Chang. 2018, 8, 135–140. [Google Scholar] [CrossRef] [Green Version]
  31. Kvam, M.H. Deposits and Processes on the Tide-Influenced Fjord-Head Delta in Dicksonfjorden, Svalbard. Master’s Thesis, Deptartment of Geosciences, UiT—The Arctic University of Norway, Tromsø, Norway, 2018. [Google Scholar]
  32. Bendixen, M.; Lønsmann Iversen, L.; Anker Bjørk, A.; Elberling, B.; Westergaard-Nielsen, A.; Overeem, I.; Barnhart, K.R.; Khan, S.A.; Box, J.E.; Abermann, J.; et al. Delta progradation in Greenland driven by increasing glacial mass loss. Nature 2017, 550, 101–104. [Google Scholar] [CrossRef]
  33. Zajączkowski, M. Sediment supply and fluxes in glacial and outwash fjords, Kongsfjorden and Adventfjorden, Svalbard. Pol. Polar Res. 2008, 29, 59–72. [Google Scholar]
  34. Zajączkowski, M.; Włodarska-Kowalczuk, M. Dynamic sedimentary environments of an Arctic glacier-fed river estuary (Adventfjorden, Svalbard). I. Flux, deposition, and sediment dynamics. Estuar. Coast. Shelf Sci. 2007, 74, 285–296. [Google Scholar] [CrossRef]
  35. Kim, D.; Jo, J.; Nam, S.; Choi, K. Morphodynamic evolution of paraglacial spit complexes on a tide-influenced Arctic fjord delta (Dicksonfjorden, Svalbard). Mar. Geol. 2022, 447, 106800. [Google Scholar] [CrossRef]
  36. Gholizadeh, M.H.; Melesse, A.M.; Reddi, L. A comprehensive review on water quality parameters estimation using remote sensing techniques. Sensors 2016, 16, 1298. [Google Scholar] [CrossRef] [PubMed] [Green Version]
  37. Chu, V.W.; Smith, L.C.; Rennermalm, A.K.; Forster, R.R.; Box, J.E. Hydrologic controls on coastal suspended sediment plumes around the Greenland Ice Sheet. Cryosphere 2012, 6, 1–19. [Google Scholar] [CrossRef] [Green Version]
  38. Hudson, B.; Overeem, I.; McGrath, D.; Syvistski, J.P.M.; Mikkelsen, A.; Hasholt, B. MODIS observed increase in duration and spatial extent of sediment plumes in Greenland fjords. Cryosphere 2014, 8, 1161–1176. [Google Scholar] [CrossRef] [Green Version]
  39. Dekker, A.; Zamurovic-Nenad, Z.; Hoogenboom, H.; Peter, S. Remote sensing, ecological water quality modelling and in situ measurements: A case study in shallow lakes. Hydrol. Sci. J. 1996, 41, 531–547. [Google Scholar] [CrossRef]
  40. Li, R.R.; Kaufman, Y.J.; Gao, B.C.; Davis, C.O. Remote sensing of suspended sediments and shallow coastal waters. Geoscience and Remote Sensing. IEEE Trans. 2003, 41, 559–566. [Google Scholar] [CrossRef]
  41. Kabir, S.M.I.; Ahmari, H. Evaluating the effect of sediment color on water radiance and suspended sediment concentration using digital imagery. J. Hydrol. 2020, 589, 125189. [Google Scholar] [CrossRef]
  42. Smith, B.; Pahlevan, N.; Schalles, J.; Ruberg, S.; Errera, R.; Ma, R.; Giardino, C.; Bresciani, M.; Barbosa, C.; Moore, T. Chlorophyll-a Algorithm for Landsat-8 Based on Mixture Density Networks. Front. Remote Sens. 2021, 1, 5. [Google Scholar] [CrossRef]
  43. Long, C.M.; Pavelsky, T.M. Remote sensing of suspended sediment concentration and hydrologic connectivity in a complex wetland environment. Remote Sens. Environ. 2013, 129, 197–209. [Google Scholar] [CrossRef] [Green Version]
  44. Rumora, L.; Miler, M.; Medak, D. Impact of Various Atmospheric Corrections on Sentinel-2 Land Cover Classification Accuracy Using Machine Learning Classifiers ISPRS. Int. J. Geo-Inf. 2020, 9, 277. [Google Scholar] [CrossRef] [Green Version]
  45. Trinh, L.; Tarasov, M.K. Evaluation of suspended matter concentrations in surface water of the Tri An water reservoir (Vietnam) using the remote sensing data. Vestn. Mosk. Univ. Seriya 5 Geogr. 2016, 2, 38–43. (In Russian) [Google Scholar]
  46. Peterson, K.T.; Sagan, V.; Sidike, P.; Cox, A.L.; Martinez, M. Suspended Sediment Concentration Estimation from Landsat Imagery along the Lower Missouri and Middle Mississippi Rivers Using an Extreme Learning Machine. Remote Sens. 2018, 10, 1503. [Google Scholar] [CrossRef] [Green Version]
  47. Hossain, A.K.M.; Yafei, J.; Xiaobo, C. Development of Remote Sensing Based Index for Estimating/Mapping Suspended Sediment Concentration in River and Lake Environments. In Proceedings of the 8th International Symposium on Ecohydraulics (ISE 2010) 0435, Zaragoza, Spain, 12–16 September 2010; pp. 578–585. [Google Scholar]
  48. Hjelle, A. The Geology of Svalbard; Norsk Polarinstitutt: Oslo, Norway, 1993; 163p. [Google Scholar]
  49. Szczucinski, W.; Zajczkowski, M.; Scholten, J. Sediment accumulation rates in subpolar fjords–Impact of post-Little Ice Age glaciers retreat, Billefjorden, Svalbard. Estuar. Coast. Shelf Sci. 2009, 85, 345–356. [Google Scholar] [CrossRef]
  50. Przybylak, R.; Arazny, A.; Nordli, O.; Finkelnburg, R.; Kejna, M.; Budzik, T.; Migala, K.; Sikora, S.; Puczko, D.; Rymer, K.; et al. Spatial distribution of air temperature on Svalbard during 1 year with campaign measurements. Int. J. Climatol. 2014, 34, 3702–3719. [Google Scholar] [CrossRef]
  51. Nordli, Ø.; Wyszyński, P.; Gjelten, H.M.; Isaksen, K.; BAupikasza, E.; Nieezwiedz, T.; Przybylak, R. Revisiting the extended Svalbard Airport monthly temperature series, and the compiled corresponding daily series 1898–2018. Polar Res. 2020, 39, 3614. [Google Scholar] [CrossRef]
  52. Ambrožová, K.; Láska, K. Air temperature variability in the vertical profile over the coastal area of Petuniabukta, central Spitsbergen. Pol. Polar Res. 2017, 38, 41–60. [Google Scholar] [CrossRef] [Green Version]
  53. Láska, K.; Witoszová, D.; Prosek, P. Weather patterns of the coastal zone of Petuniabukta, central Spitsbergen in the period 2008–2010. Pol. Polar Res. 2012, 33. [Google Scholar] [CrossRef]
  54. Farnsworth, W.R.; Ingólfsson, Ó.; Retelle, M.; Schomacker, A. Over 400 Previously Undocumented Svalbard Surge-Type Glaciers Identified. Geomorphology 2016, 264, 52–60. [Google Scholar] [CrossRef]
  55. Boulton, G.S.; van der Meer, J.J.M.; Beets, D.J.; Hart, J.K.; Ruegg, G.H.J. The Sedimentary and Structural Evolution of a Recent Push Moraine Complex: Holmströmbreen, Spitsbergen. Dev. Quat. Sci. 2004, 4, 149–180. [Google Scholar] [CrossRef]
  56. Munir, M.; Ramadhan, A.F.; Nastiti, A.; Putri, A.A.; Bawono, M.R.K.S.; Afifah, Z.N.; Wicaksono, P. Utilization of Sentinel-2A imagery For Mapping The dynamics of Total Suspended Sediment at The River Mouth of The Padang City. In Proceedings of the 2019 5th International Conference on Science and Technology (ICST), Yogyakarta, Indonesia, 30–31 July 2019. [Google Scholar] [CrossRef]
  57. Zhang, Z.; He, G.; Wang, X. A practical DOS model-based atmospheric correction algorithm. Int. J. Remote Sens. 2010, 31, 2837–2852. [Google Scholar] [CrossRef]
  58. Moskalik, M.; Cwiakała, J.; Szczucinski, W.; Dominiczak, A.; Głowacki, O.; Wojtysiak, K.; Zagórski, P. Spatiotemporal changes in the 315 concentration and composition of suspended particulate matter in front of Hansbreen a tidewater glacier in Svalbard. Oceanologia 2018, 60, 446–463. [Google Scholar] [CrossRef]
  59. Schild, K.; Hawley, R.; Morriss, B. Subglacial hydrology at Rink Isbræ, West Greenland inferred from sediment plume appearance. Ann. Glaciol. 2016, 57, 118–127. [Google Scholar] [CrossRef] [Green Version]
  60. McGrath, D.; Steffen, K.; Overeem, I.; Mernild, S.H.; Hasholt, B.; Van Den Broeke, M. Sediment plumes as a proxy for local ice-sheet runoff in Kangerlussuaq Fjord, West Greenland. J. Glaciol. 2010, 56, 813–821. [Google Scholar] [CrossRef] [Green Version]
  61. Van Pelt, W.J.J.; Pohjola, V.A.; Pettersson, R.; Ehwald, L.E.; Reijmer, C.H.; Boot, W.; Jakobs, C.L. Dynamic Response of a High Arctic Glacier to Melt and Runoff Variations. Geophys. Res. Lett. 2018, 45, 4917–4926. [Google Scholar] [CrossRef] [Green Version]
  62. Majchrowska, E.; Ignatiuk, D.; Jania, J.; Marszałek, H.; Wąsik, M. Seasonal and interannual variability in runoff from the Werenskioldbreen catchment. Spitsbergen Pol. Polar Res. 2015, 36, 197–224. [Google Scholar] [CrossRef] [Green Version]
  63. Watson, C.S.; Quincey, D.J.; Carrivick, J.L.; Smith, M.W. The dynamics of supraglacial ponds in the Everest region, central Himalaya. Glob. Planet. Change 2016, 142, 14–27. [Google Scholar] [CrossRef]
  64. Lampkin, D.J.; VanderBerg, J. A preliminary investigation of the influence of basal and surface topography on supraglacial lake distribution near Jakobshavn Isbrae, western Greenland. Hydrol. Processes 2011, 25, 3347–3355. [Google Scholar] [CrossRef]
  65. Worni, R.; Huggel, C.; Clague, J.J.; Schaub, Y.; Stoffel, M. Coupling glacial lake impact, dam breach, and flood processes: A modeling perspective. Geomorphology 2014, 224, 161–176. [Google Scholar] [CrossRef]
  66. Kavan, J.; Nedbalová, L.; Nývlt, D.; Čejka, T.; Lirio, J. Status and short-term environmental changes of lakes in the area of Devil’s Bay, Vega Island, Antarctic Peninsula. Antarct. Sci. 2021, 33, 150–164. [Google Scholar] [CrossRef]
  67. Schuler, T.V.; Kohler, J.; Elagina, N.; Hagen, J.O.; Hodson, A.J.; Jania, J.A.; Kääb, A.M.; Luks, B.; Małecki, J.; Moholdt, G.; et al. Reconciling Svalbard Glacier Mass Balance. Front. Earth Sci. 2020, 8, 156. [Google Scholar] [CrossRef]
  68. Benn, D.I.; Evans, D.J.A. Glaciers and Glaciation; Routledge: London, UK, 2010; 816p, ISBN 978 0 340 905791. [Google Scholar]
  69. Kavan, J. Early twentieth century evolution of Ferdinand glacier, Svalbard, based on historic photographs and structure-from-motion technique. Geogr. Ann. Ser. A Phys. Geogr. 2020, 102, 57–67. [Google Scholar] [CrossRef]
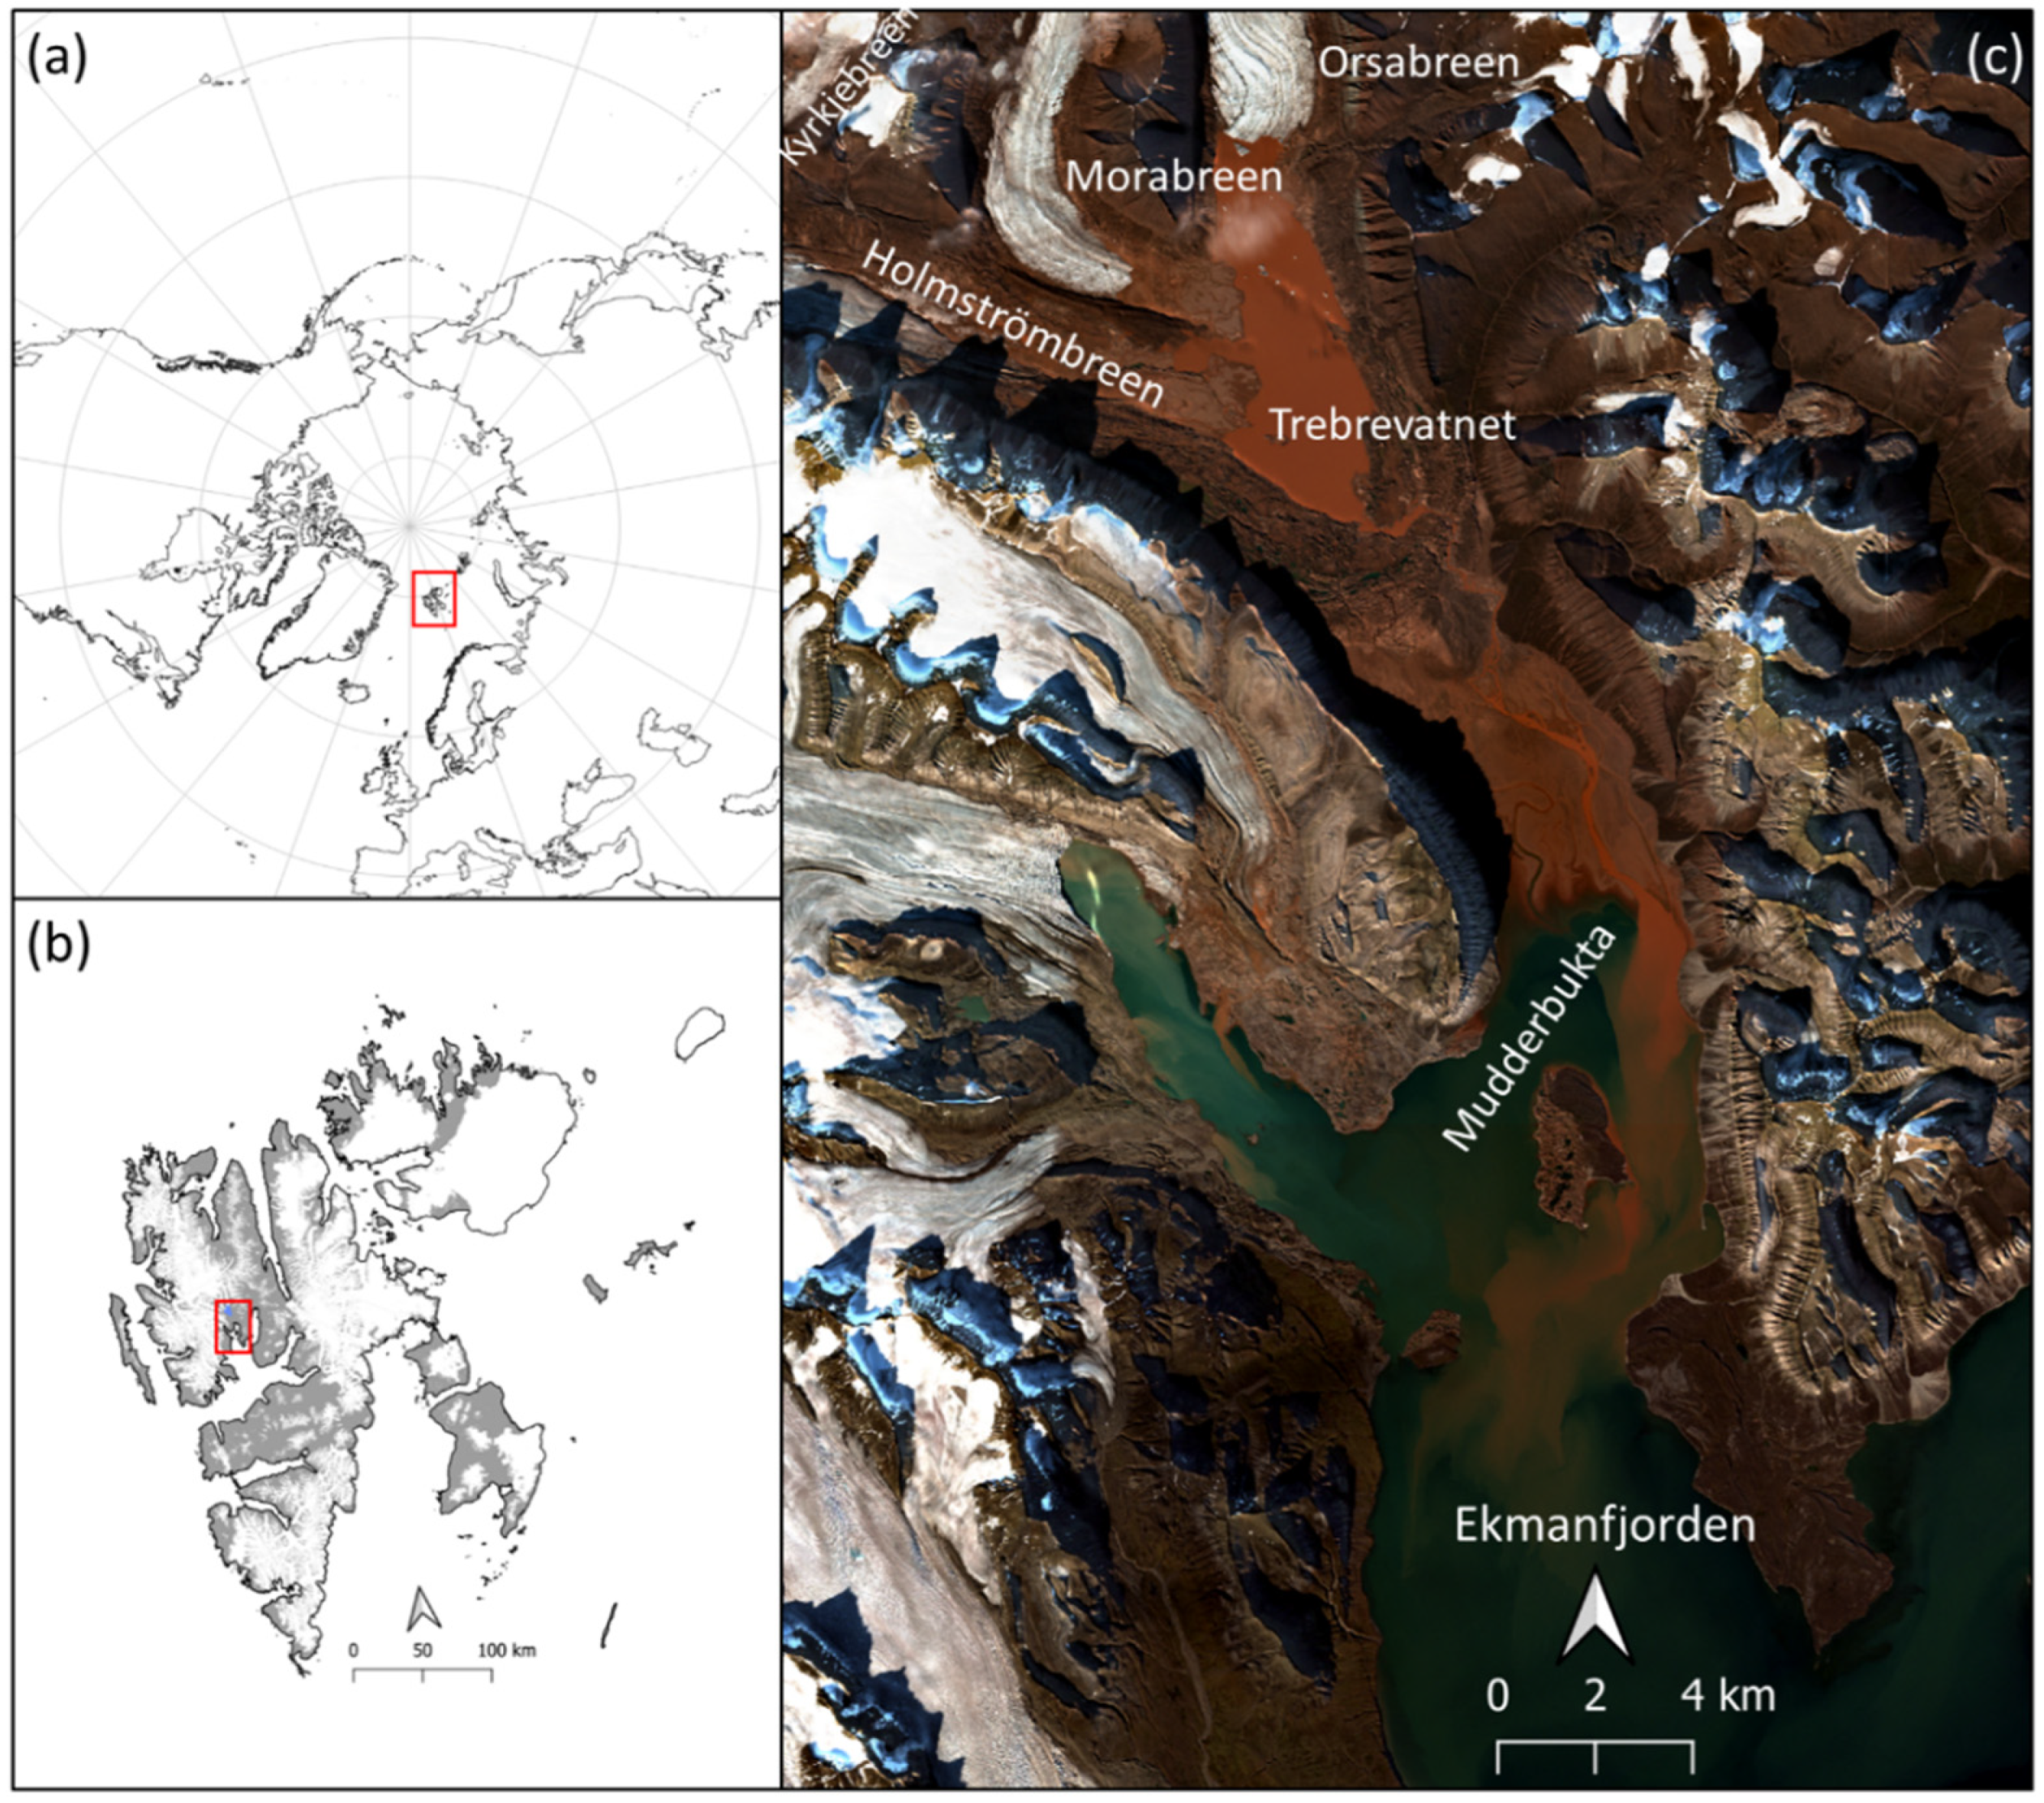
Figure 1. (a) Study site location; Svalbard within the Arctic region; (b) Central Svalbard with location of Ekmanfjorden; (c) Sentinel-2 image (2 September 2021) of the study area with the Trebrevatnet lake filled with suspended sediments on top of the image together with the sediment plume visible on the outlet to the Ekmanfjorden.
Water 14 01840 g001
Figure 2. Example of NDSSI (top) and true colour Sentinel-2 image (bottom) on 25 August 2020; the outline of the sediment plume is highlighted with a dashed line (black in top panel and yellow in bottom panel) in both figures.
Water 14 01840 g002
Figure 3. Seasonal dynamics of suspended sediment parameters and air temperature for each year in the period 2016–2021.
Water 14 01840 g003
Figure 4. Relationship between lake NDSSI and sediment plume SSL index with the highlighted exponential regression.
Water 14 01840 g004
Figure 5. Seasonal dynamics of Trebrevatnet areal extent; examples of (a) maximum and (b) minimum areal extent from 26 July 2020 and 25 August 2020 respectively; (c) the areal extent variability expressed as overlapping lake extent during the 2020 summer season with minimum highlighted in red and maximum in black; (d) comparison of the seasonal lake areal extent evolution within the studied years.
Water 14 01840 g005
Figure 6. Conceptual model of the sediment cascade system from glacier and glacial lake to fjord environment.
Water 14 01840 g006
Publisher’s Note: MDPI stays neutral with regard to jurisdictional claims in published maps and institutional affiliations.