1. Introduction
As the main driver of the water cycle and the most active variable in atmospheric circulation, precipitation plays a vital role in hydrological, climatic, and agricultural applications, for instance, extreme precipitation analysis [
1], drought monitoring [
2], flood forecasting [
3], and agricultural decision-making [
4]. Despite its importance in many applications, reliable and accurate precipitation measurement remains a challenging task due to the significant heterogeneity of precipitation processes [
1].
Conventional precipitation gauges are considered to provide the most accurate precipitation observations in many parts of the world. However, the difficulty and the cost associated with their maintenance limit their area of coverage. While the ground networks of precipitation gauges in developed regions are dense enough, in developing countries and remote areas, the data coverage is usually insufficient to accurately characterize the spatial variability of precipitation. The satellite remote-sensing technology, with its consistent periodicity and broad coverage, presents a promising alternative way to measure precipitation [
2].
Satellite precipitation products (SPPs) are normally derived from sensors on board geostationary and low-earth orbit satellites. Geostationary satellites employ visible and infrared sensors to retrieve precipitation estimates with high spatial and temporal resolutions (e.g., 0.5–2 km and 10–15 min for the Advanced Himawari Imager [
5] onboard Himawari-8/-9, manufactured by Mitsubishi Electric, Tokyo, Japan). Low earth orbit satellites use passive microwave sensors to provide worldwide precipitation measurements with two observations per day and a spatial resolution typically larger than 25 km [
6]. The latter is typically more accurate because microwave sensors are more directly responsive to cloud internal processes and precipitation formation mechanisms [
7]. Several SPPs have been developed to exploit the complementary strengths of geostationary observations and low-earth orbit retrievals.
These SPPs include the following: Tropical Rainfall Measuring Mission (TRMM) Multi-satellite Precipitation Analysis (TMPA) [
8], Climate Prediction Center (CPC) morphing technique (CMORPH) [
9], Global Precipitation Measurement (GPM) Integrated Multi-satellitE Retrievals (IMERG) [
10], Global Satellite Mapping of Precipitation (GSMaP) [
11], Precipitation Estimation from Remotely Sensed Information using Artificial Neural Networks (PERSIANN) [
12], PERSIANN−Cloud Classification System (CCS) [
13], and PERSIANN−Dynamic Infrared Rain Rate near-real-time (PDIR−Now) [
14]. These SPPs are especially valuable in regions where precipitation observations from hydrometeorological networks are scarce or totally absent.
Although SPPs can provide quasi-global high-quality precipitation estimation, they are subject to bias and systematic errors caused by various factors such as sampling frequency, the nonuniform field of view of the sensors, and uncertainties in the retrieval algorithms [
15]. Therefore, it is necessary to evaluate and intercompare the performance of these datasets before application. Characterized by a reliable and direct way to measure precipitation, observations from precipitation gauges are often selected as the evaluation reference. A number of studies have been performed to evaluate SPPs against gauge data [
16,
17,
18,
19,
20,
21,
22,
23]. For example, Alijanian et al. [
17] evaluated five satellite rainfall estimates (CMORPH, PERSIANN−CDR, PERSIANN, TRMM, and MSWEP) against gauge data based on different rainfall regimes over Iran. They found that the performance of satellite rainfall estimates varies with climatic regimes; for example, the best correlation was observed in the south, on the shore of the Persian Gulf, with a “very hot and humid” climate for MSWEP, TRMM, and PERSIANN−CDR. Yu et al. [
22] analyzed and evaluated the spatiotemporal accuracy features of the following three high spatial resolution SPPs: CHIRPS, GPM−IMERG, and PERSIANN−CCS. They concluded that the performance of SPPs is relatively good in summer but slightly weak in winter, and SPPs perform better in the eastern humid basin than in the western arid basin.
However, the measurements from precipitation gauges often include systematic biases, which could weaken the reliability of the assessment results of SPPs. These biases include wind-induced precipitation undercatch, evaporation losses, the underestimation of trace precipitation events, and wetting losses. Of the biases, the wind-induced undercatch is generally the source of the greatest error. In the low-precipitation areas, the wetting losses and trace precipitation are also significant biases [
24,
25,
26,
27]. The World Meteorological Organization (WMO) began the Solid Precipitation Measurement Intercomparison Project in 1985 to assess various national methods of solid precipitation observations [
28]. This project involves thirteen countries, including China. New bias-correction techniques have been developed for a variety of commonly used precipitation gauges across the world, such as the Canadian Nipher snow gauge, the United States standard 8” non-recording gauge, the Hellmann gauge, and the Russian Tretyakov gauge. The WMO bias-corrected methods have been applied in several regions and countries, such as Mongolia [
27], Greenland [
25], and the northern regions [
29]. The results clearly show that precipitation amounts are much higher than previously reported, especially in high-latitude regions [
30].
In China, research on bias correction of gauge data has been carried out since the 1980s [
26,
31,
32,
33,
34,
35,
36,
37]. Analysis of the intercomparison data of precipitation measurements at Daxigou Meteorological Station in 1986 indicated the relationship between the catch efficiency of the Chinese standard precipitation gauge (CSPG) and the average wind speed at 10 m height for different precipitation phases [
33,
34]. Ye et al. [
26] developed a new bias-correction method for gauge measurements and generated a reliable climatology for China based on the bias-corrected data. They found that annual precipitation has increased by 6–62% relative to gauge-measured yearly total precipitation over China. Li et al. [
31] used the bias-corrected daily precipitation from a gauge to re-divide the climatic zones in China. The findings demonstrate that the severe arid areas declined while the severe humid areas grew, indicating that the actual climate conditions of China should be wetter than presently assessed. Yao et al. [
35] investigated the effects of gauge data bias on aridity and drought assessment in China. They concluded that the spatial and temporal characteristics of drought assessment were altered by precipitation bias. These studies imply that the bias of gauge measurements will affect all research fields that use gauge data, of course, including SPPs evaluation. However, to our knowledge, there have been no relevant studies that investigate the impacts of gauge bias on the performance assessment of SPPs in China. Such studies will contribute to a more accurate understanding of SPPs’ performance and thus help users select appropriate SPPs for different applications.
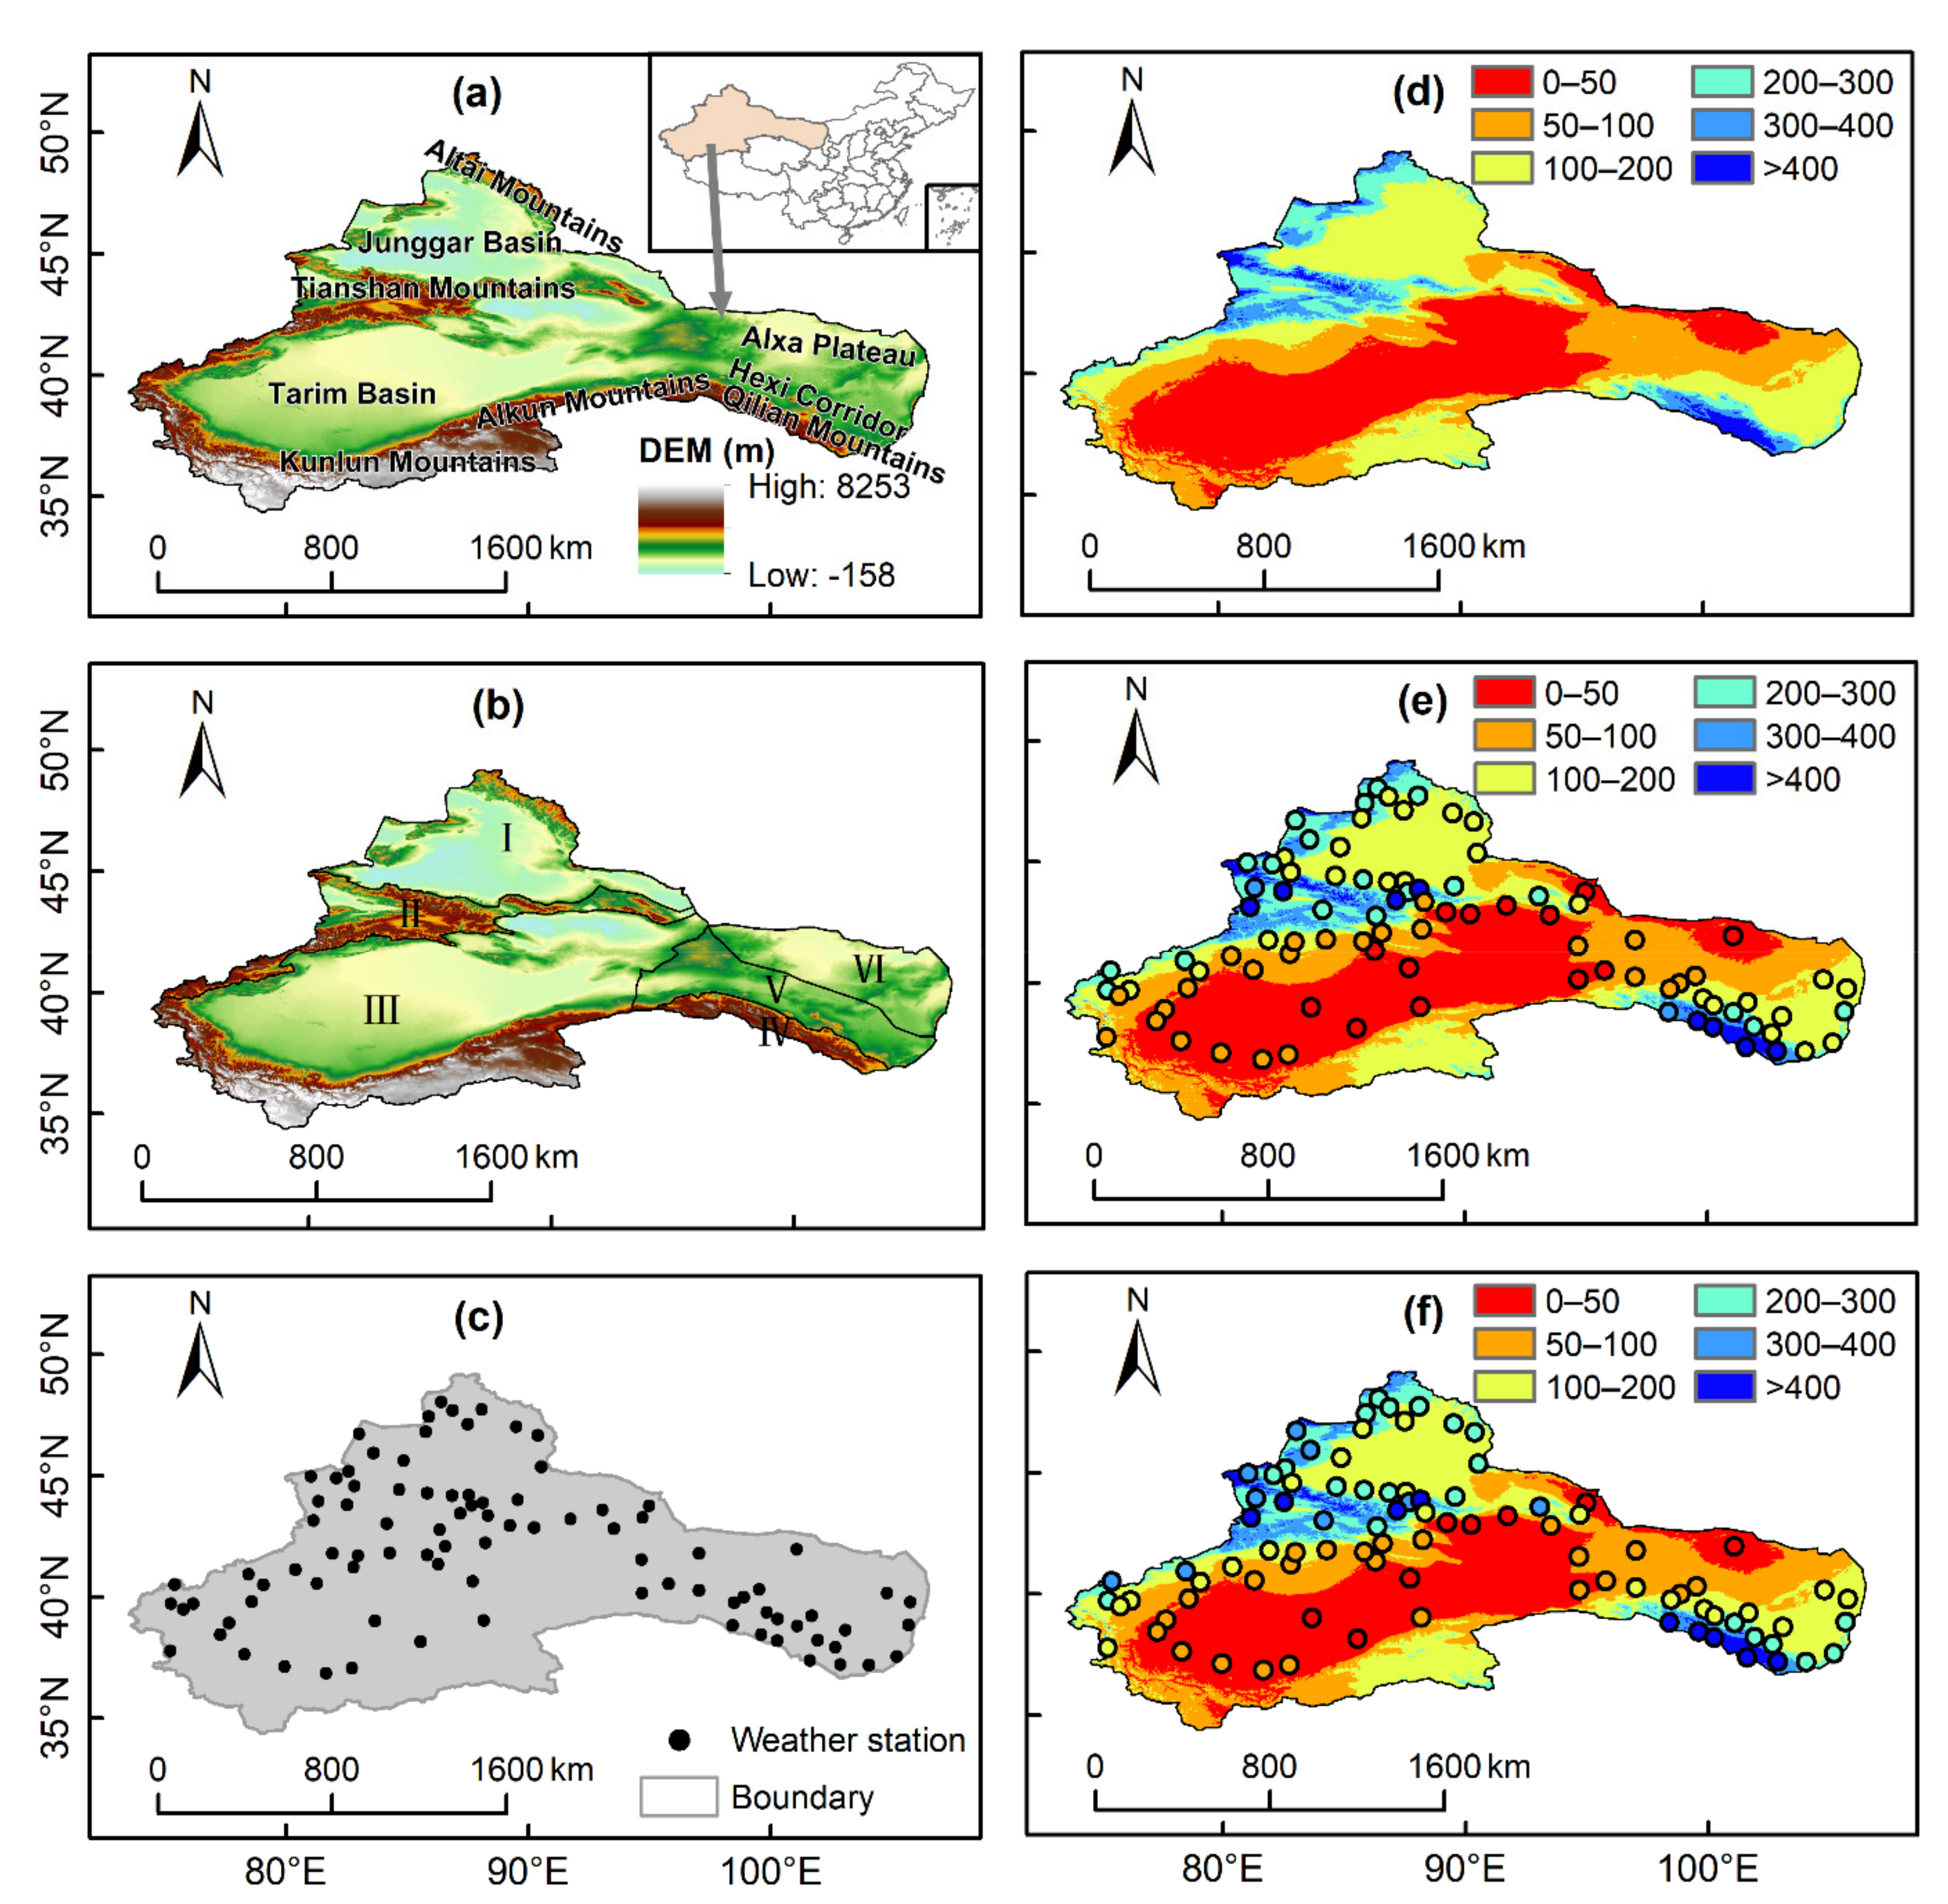
The arid region of Northwestern China (ARNC) is one of the important parts of the arid region of Central Asia. The terrain in the region is complex; mountains and basins are distributed alternately, deserts and oases coexist, and the spatial and temporal distribution of natural elements, including precipitation, is very uneven [
38]. SPPs can provide valuable precipitation information, which is beneficial to studies on climate change, prevention and control of desertification, protection and restoration of ecosystems, etc., for this area. Correcting the biases due to wind-induced undercatch, wetting loss, and underestimation of trace precipitation events for gauge measurements, Ye et al. [
26] found the correction factor (computed as corrected minus measured data, divided by measured data) is more significant in northwestern China than southeastern China. Ma et al. [
39] found the correction factor can be up to 180% in the winter over the ARNC. This illustrates that it is indeed necessary to investigate the impact of gauge bias on the performance assessment of SPPs before applications in ARNC.
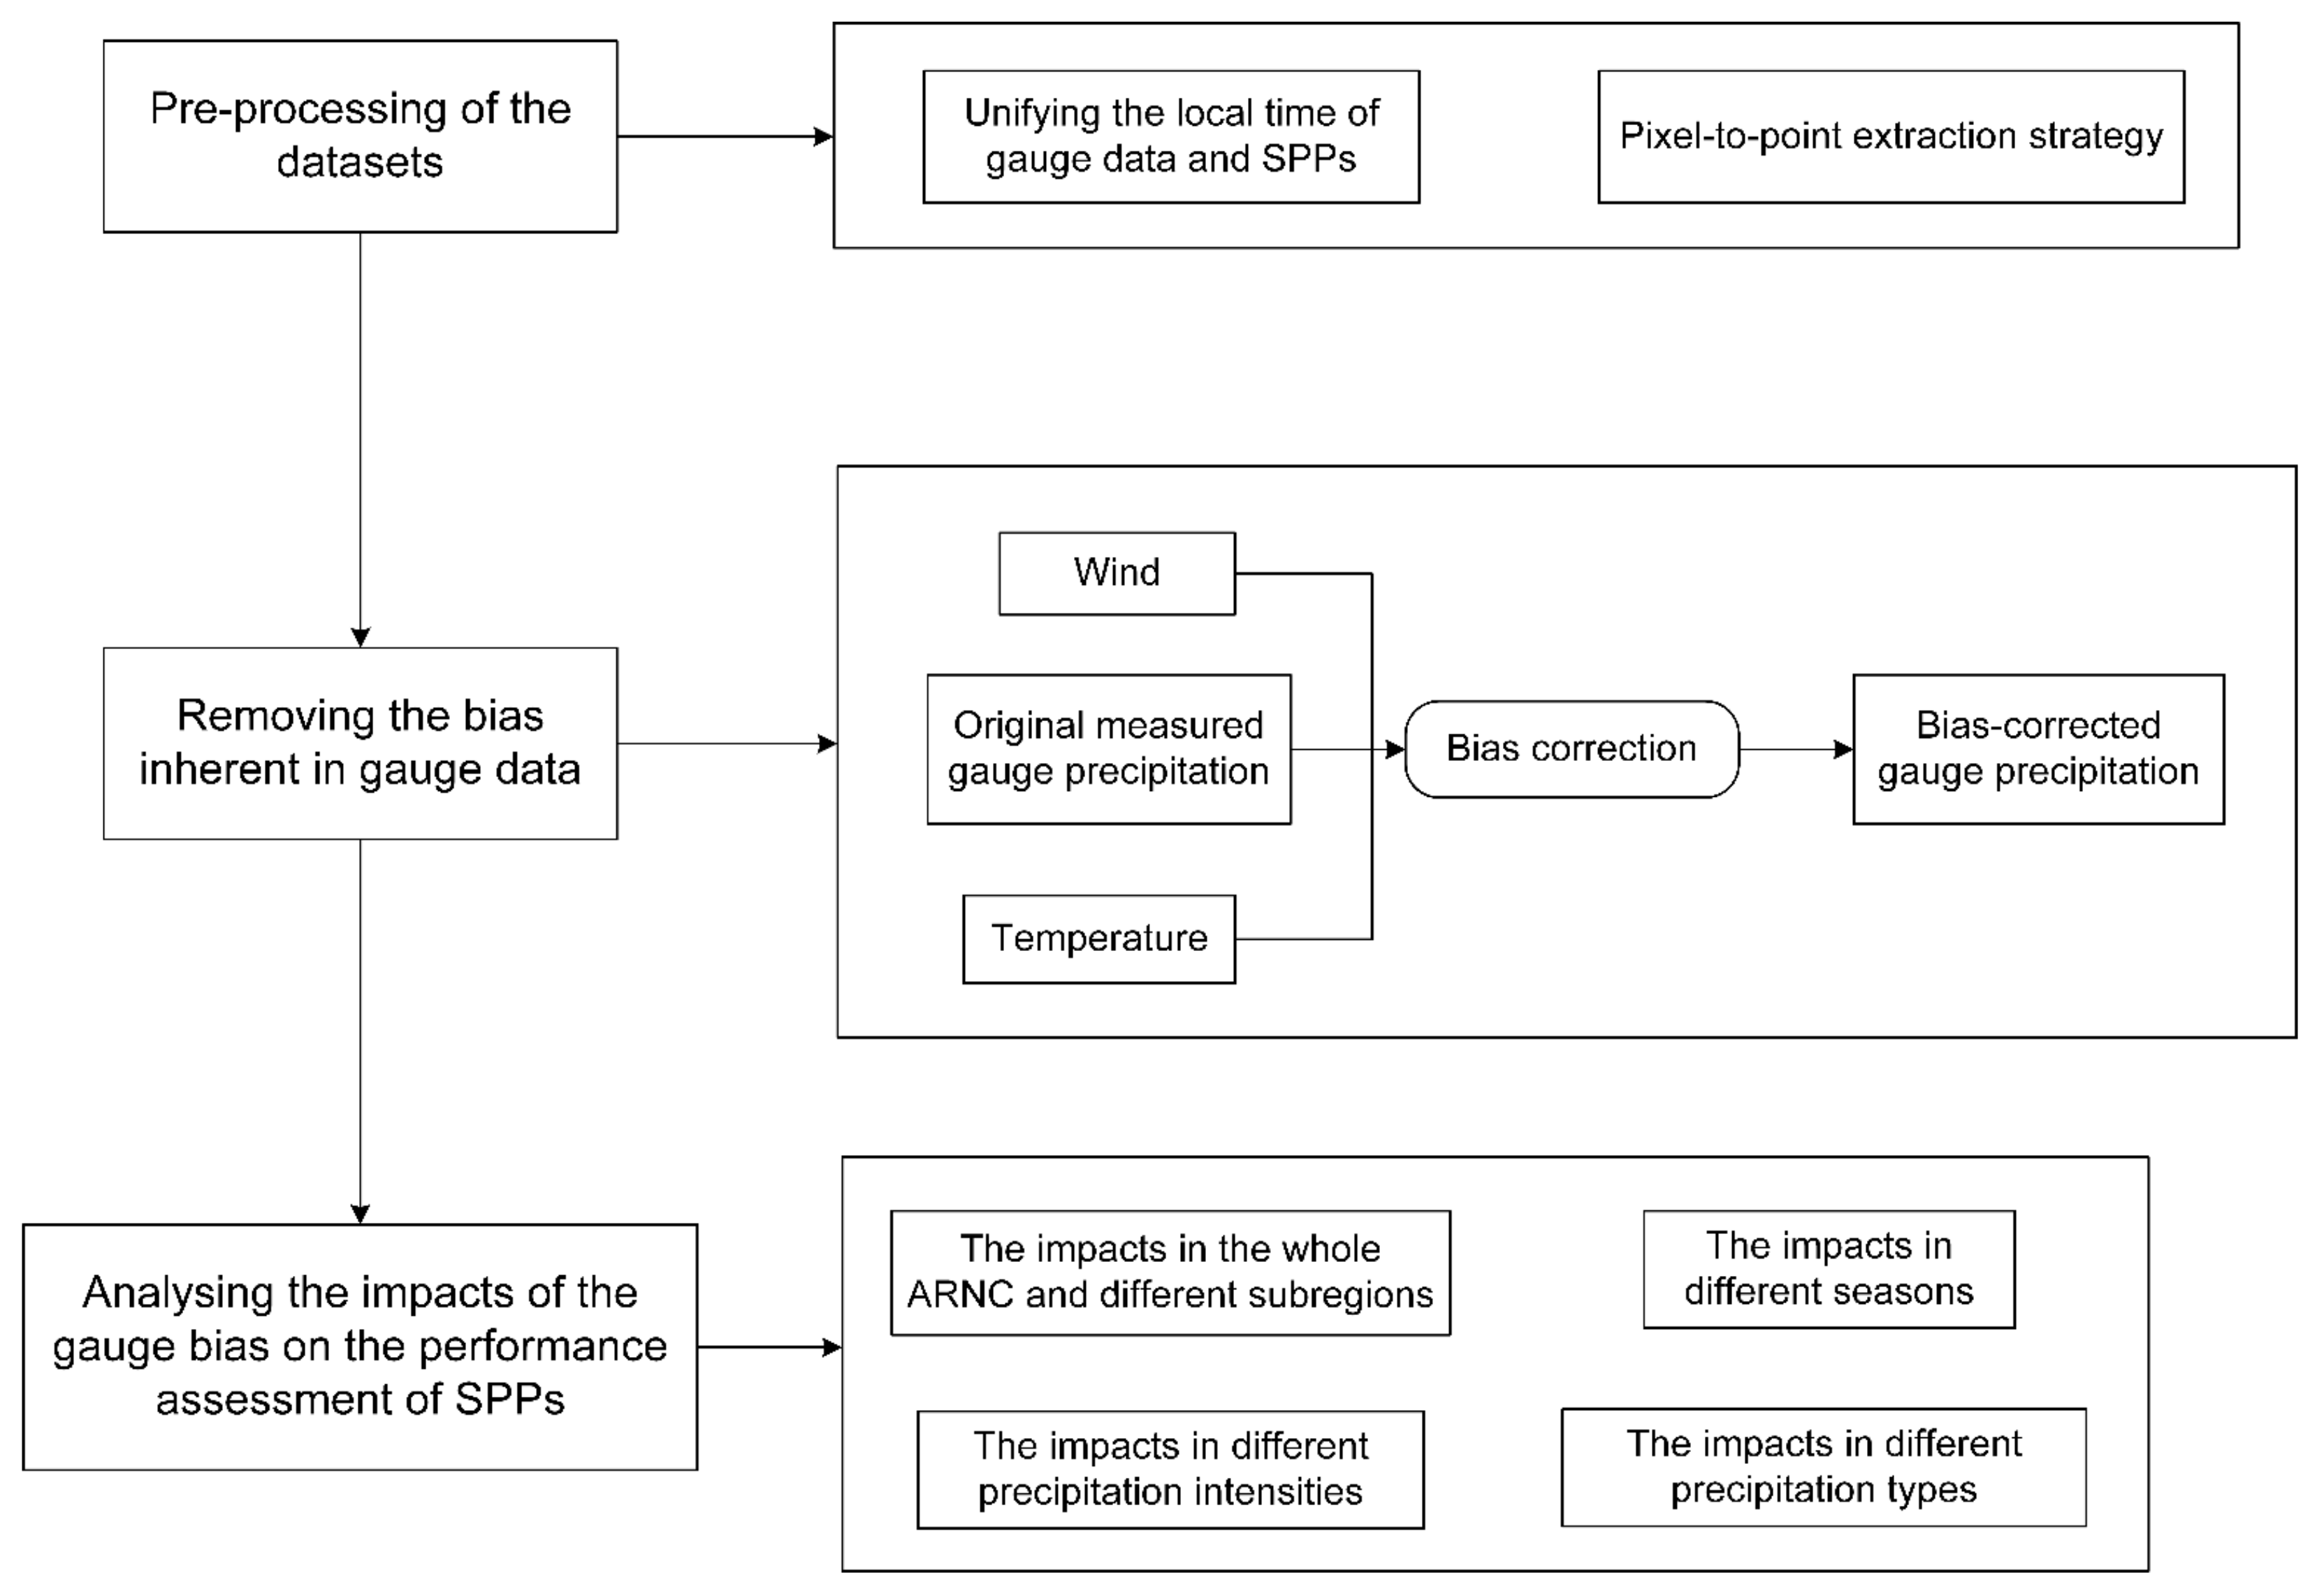
In this paper, the impacts of bias in gauge data on evaluating six major SPPs (IMERG, CMORPH, GSMaP, PERSIANN, PERSIANN−CCS, PDIR−Now) over ARNC were investigated on a spatial/seasonal scale, different ranges of precipitation intensity, and different precipitation phases. We first corrected for the bias inherent in gauge-measured precipitation. Then, the changes in the performance assessment of SPPs were presented by calculating the changes in evaluation metrics. The structure of this study is as follows:
Section 2 describes the study area and datasets, the preprogressing of datasets, the bias correction method for gauge measurements, and evaluation metrics,
Section 3 presents the results, and
Section 4 makes the summary and discussion, while the conclusions are given in
Section 5.
4. Summary and Discussion
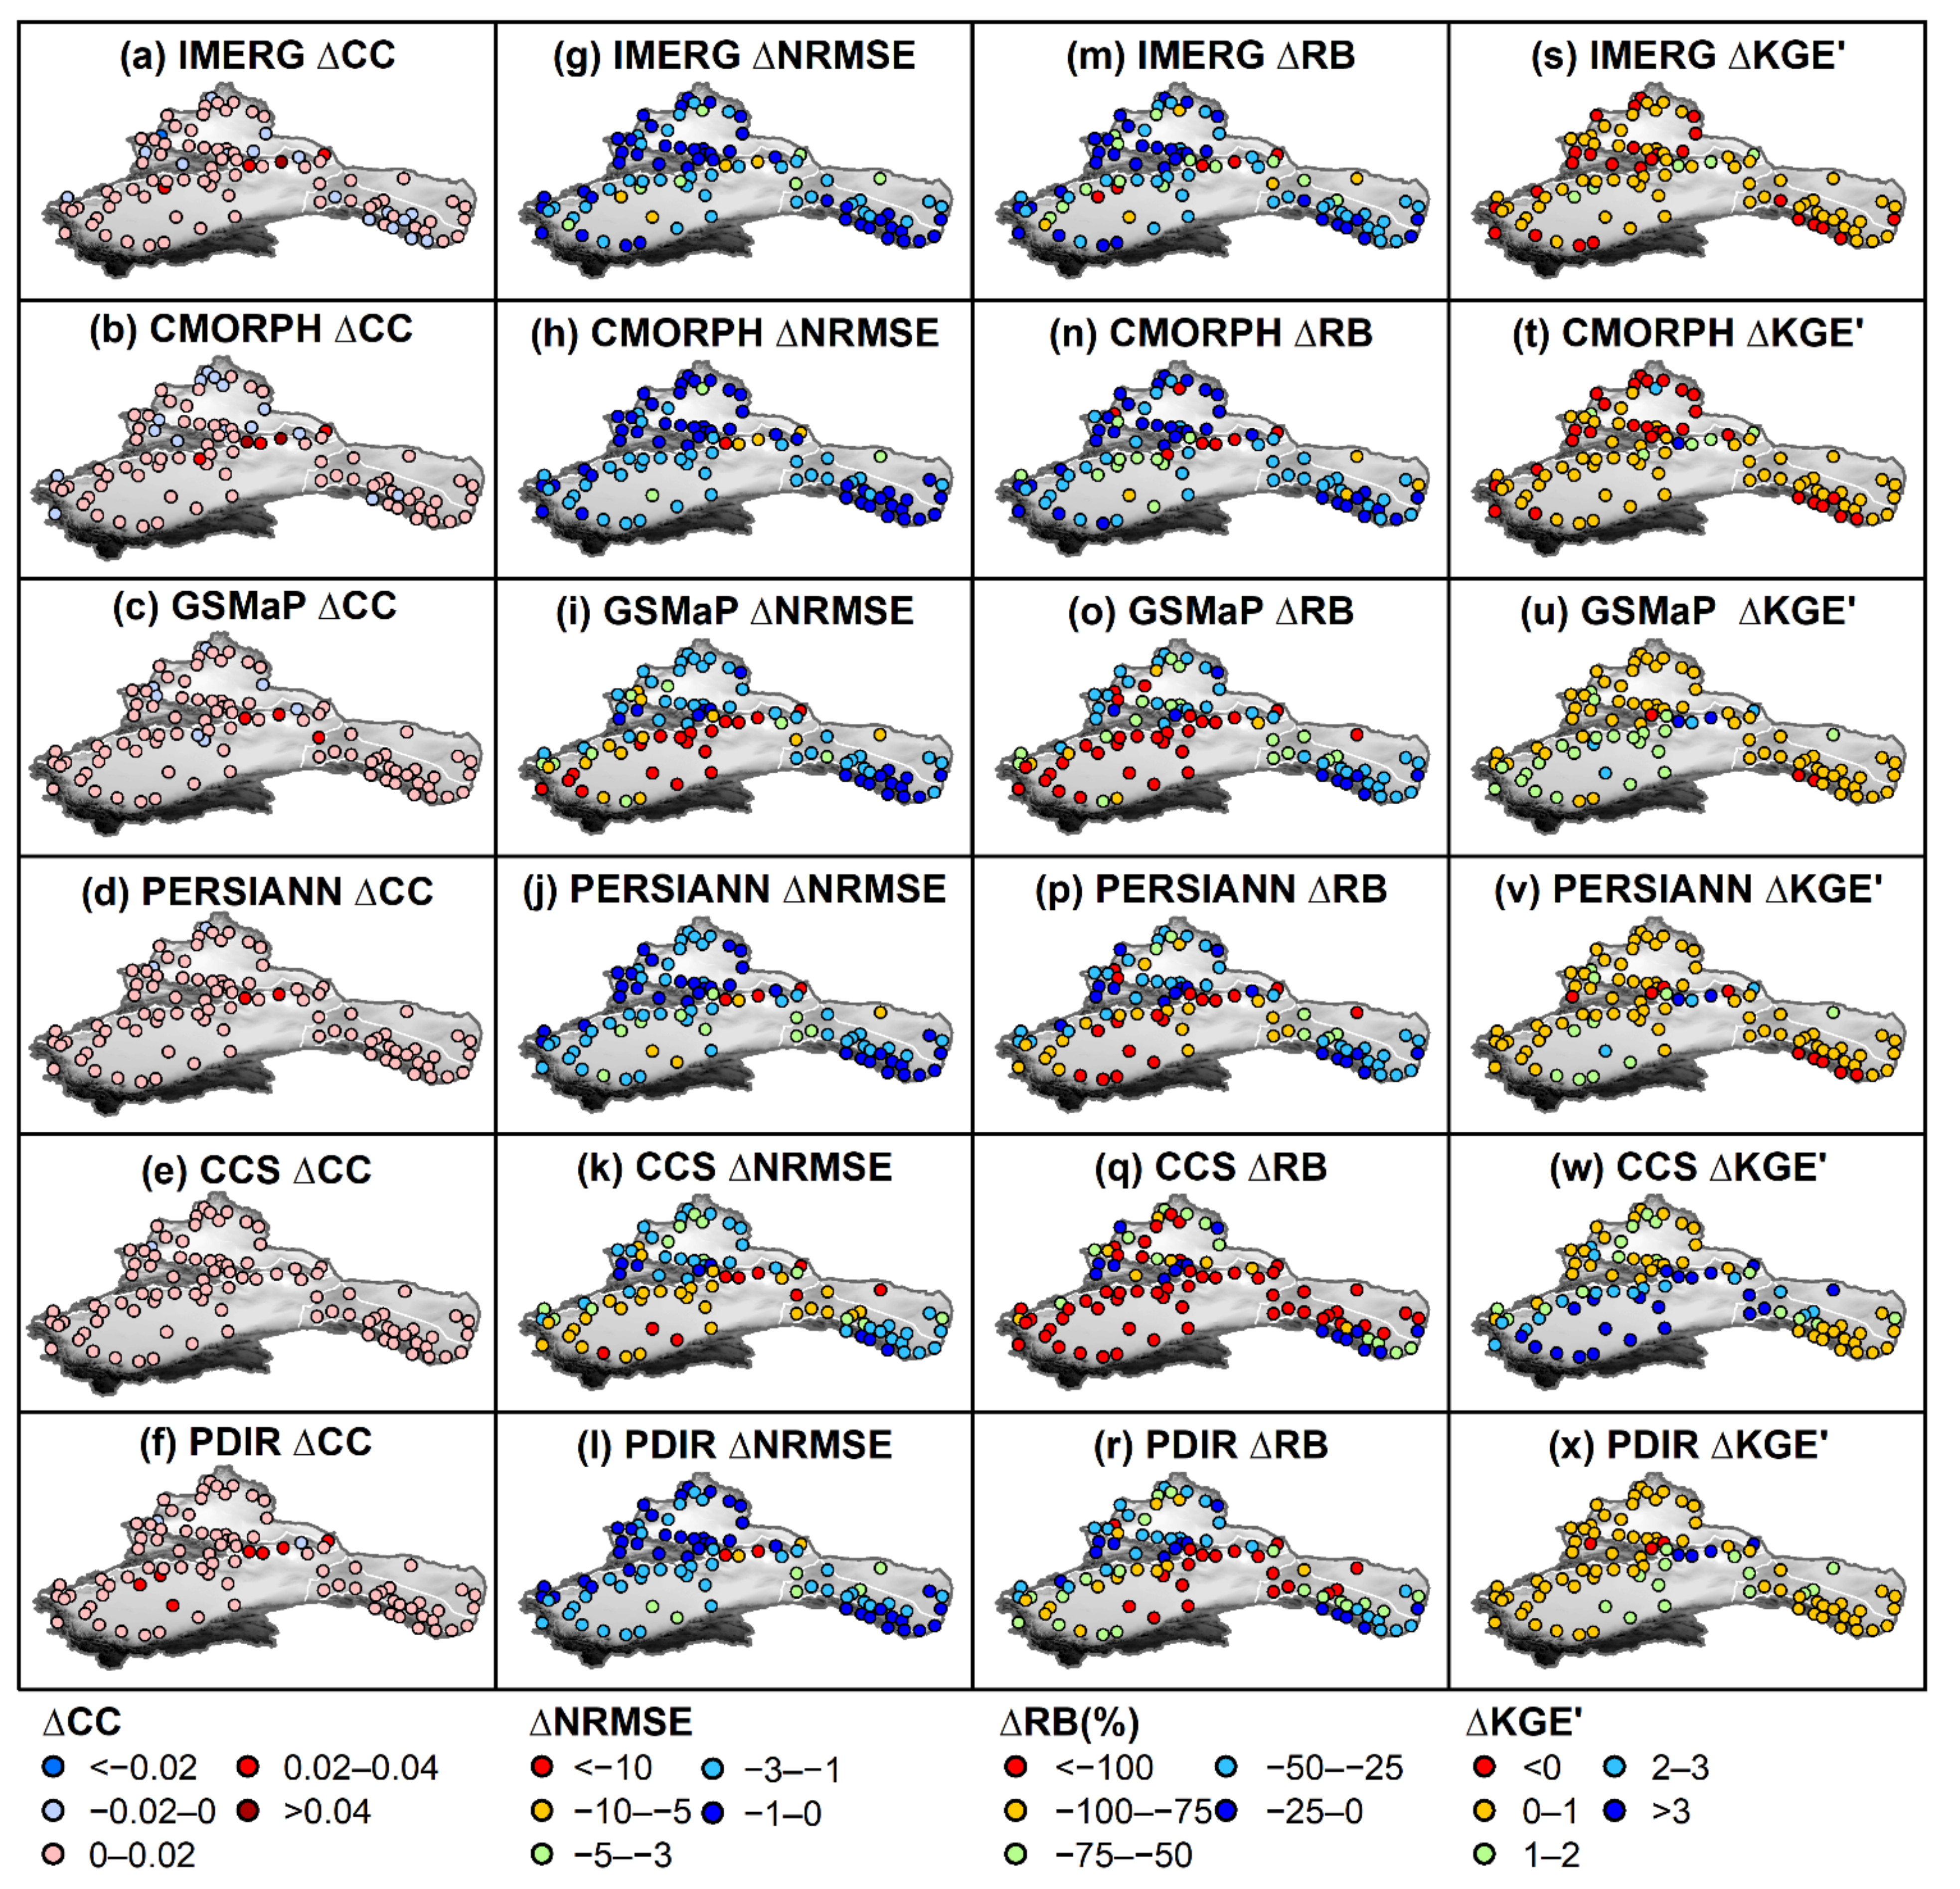
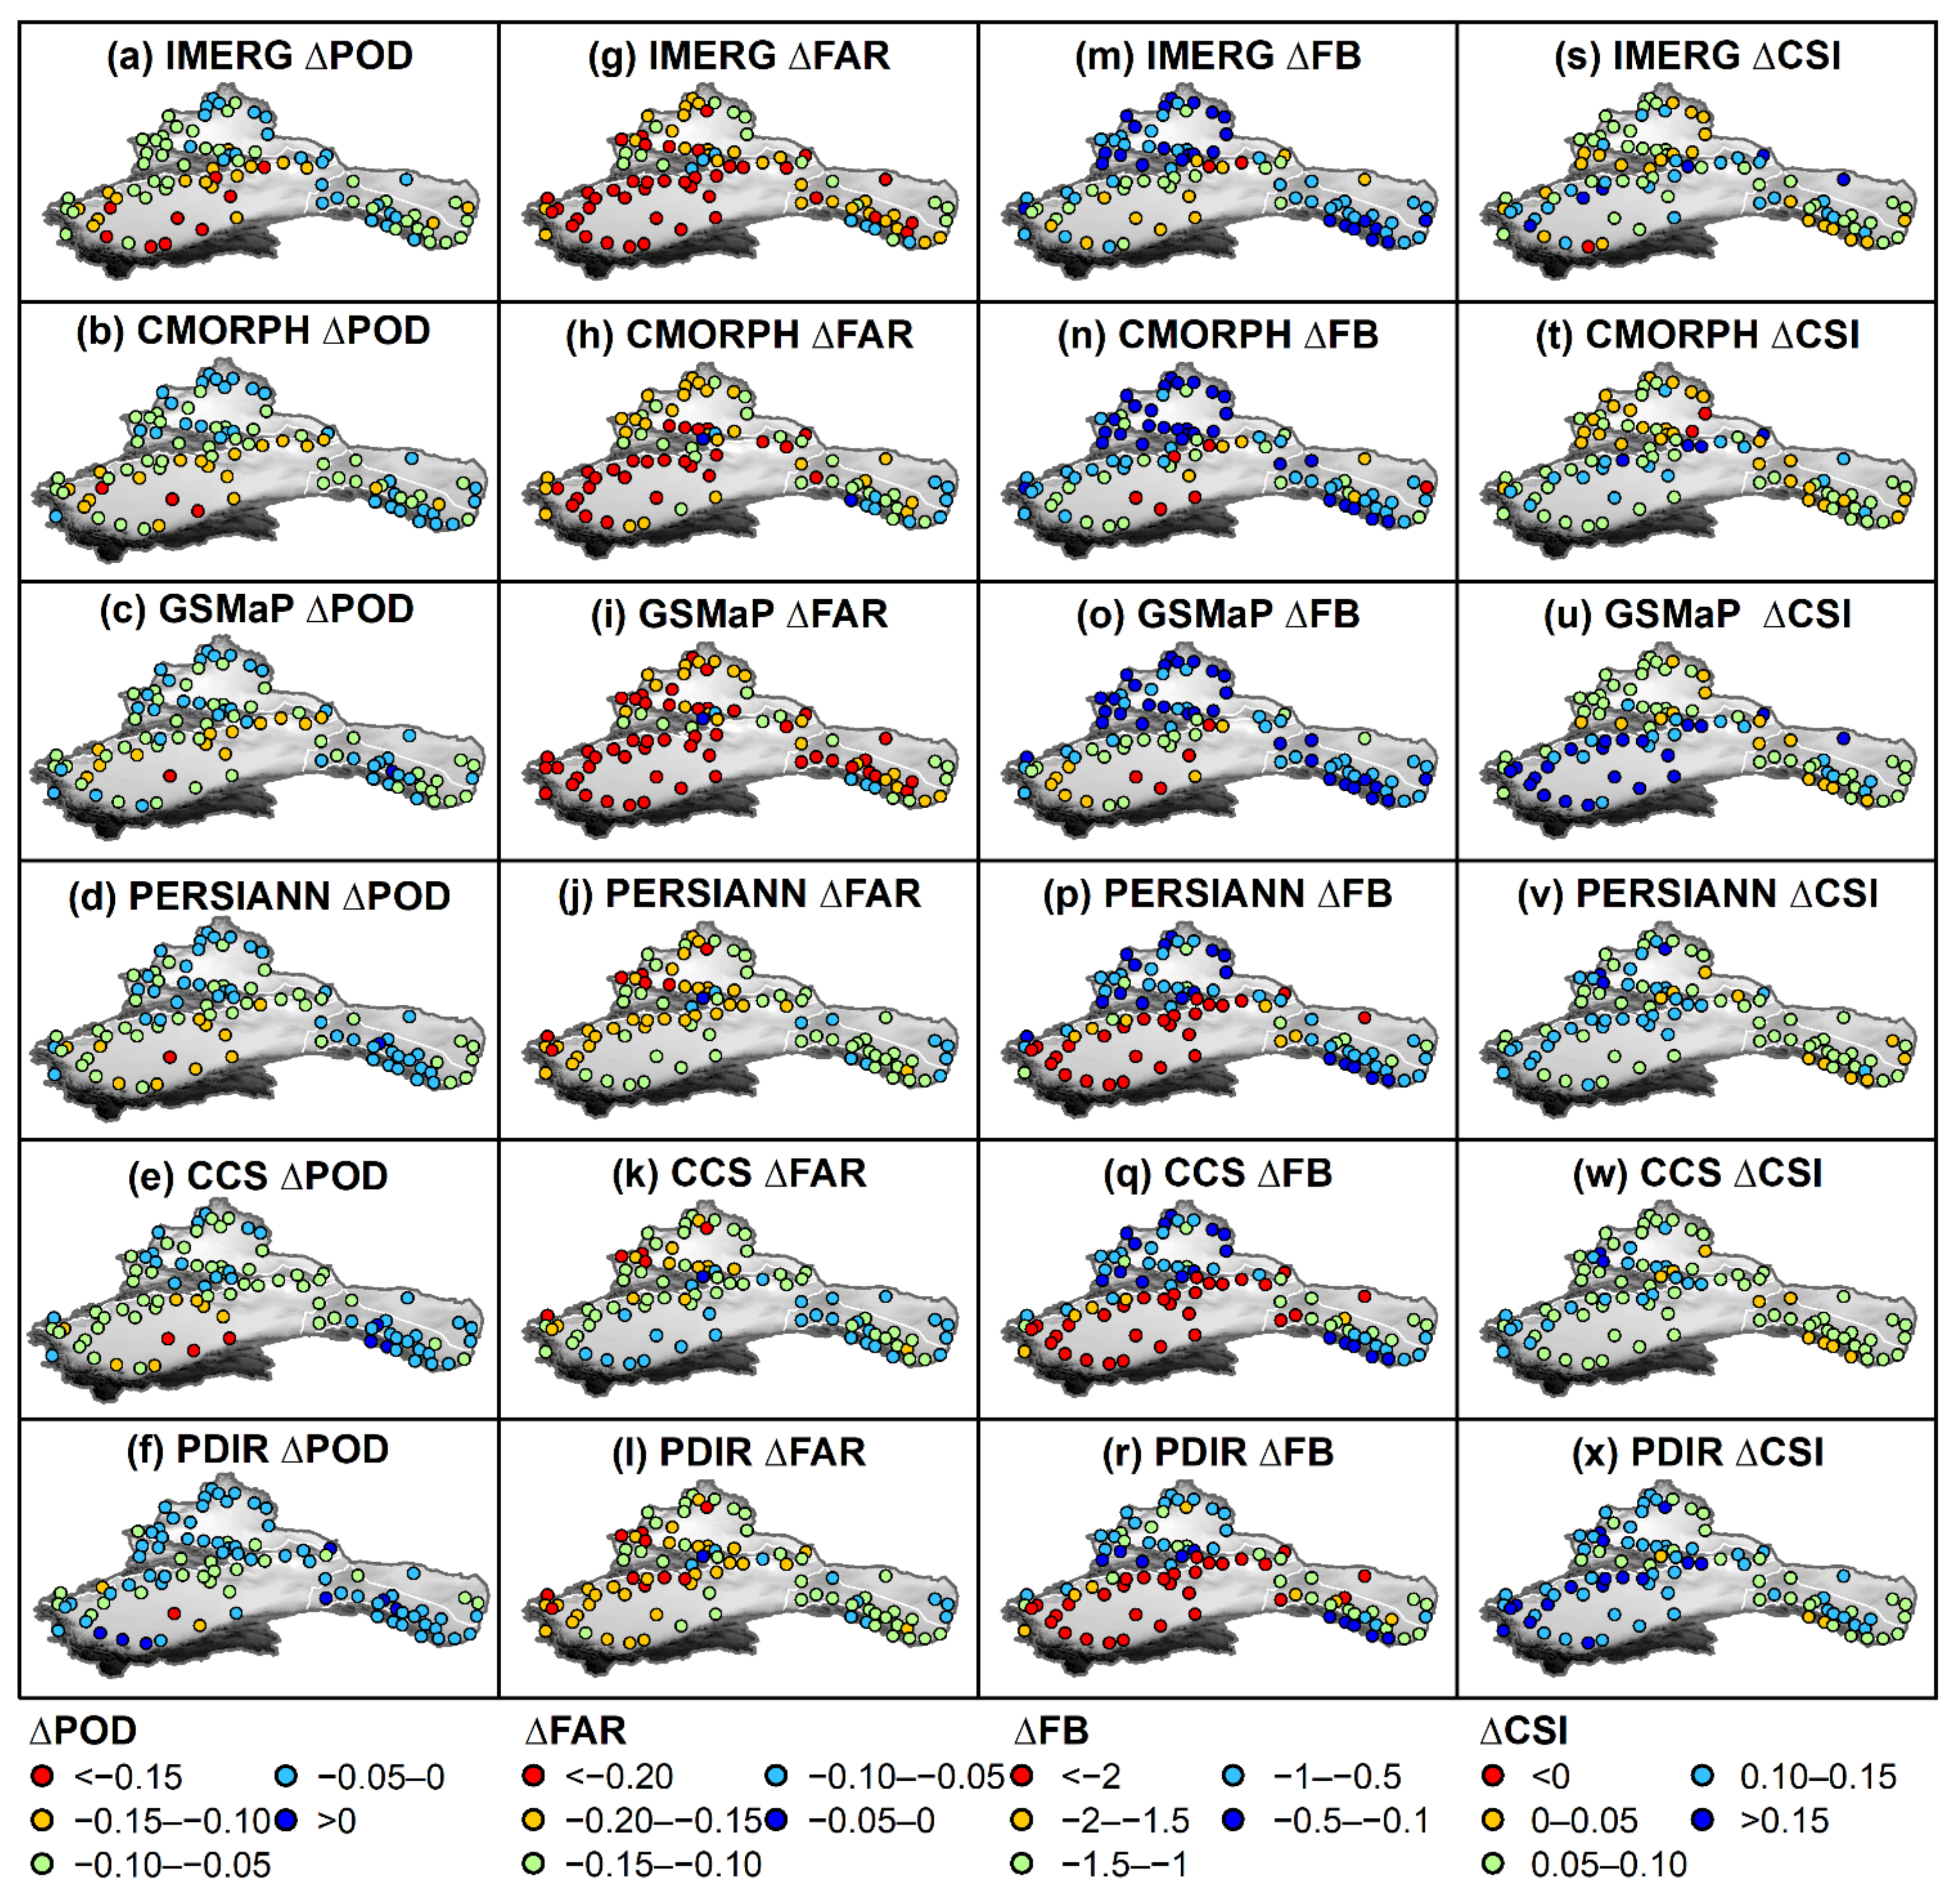
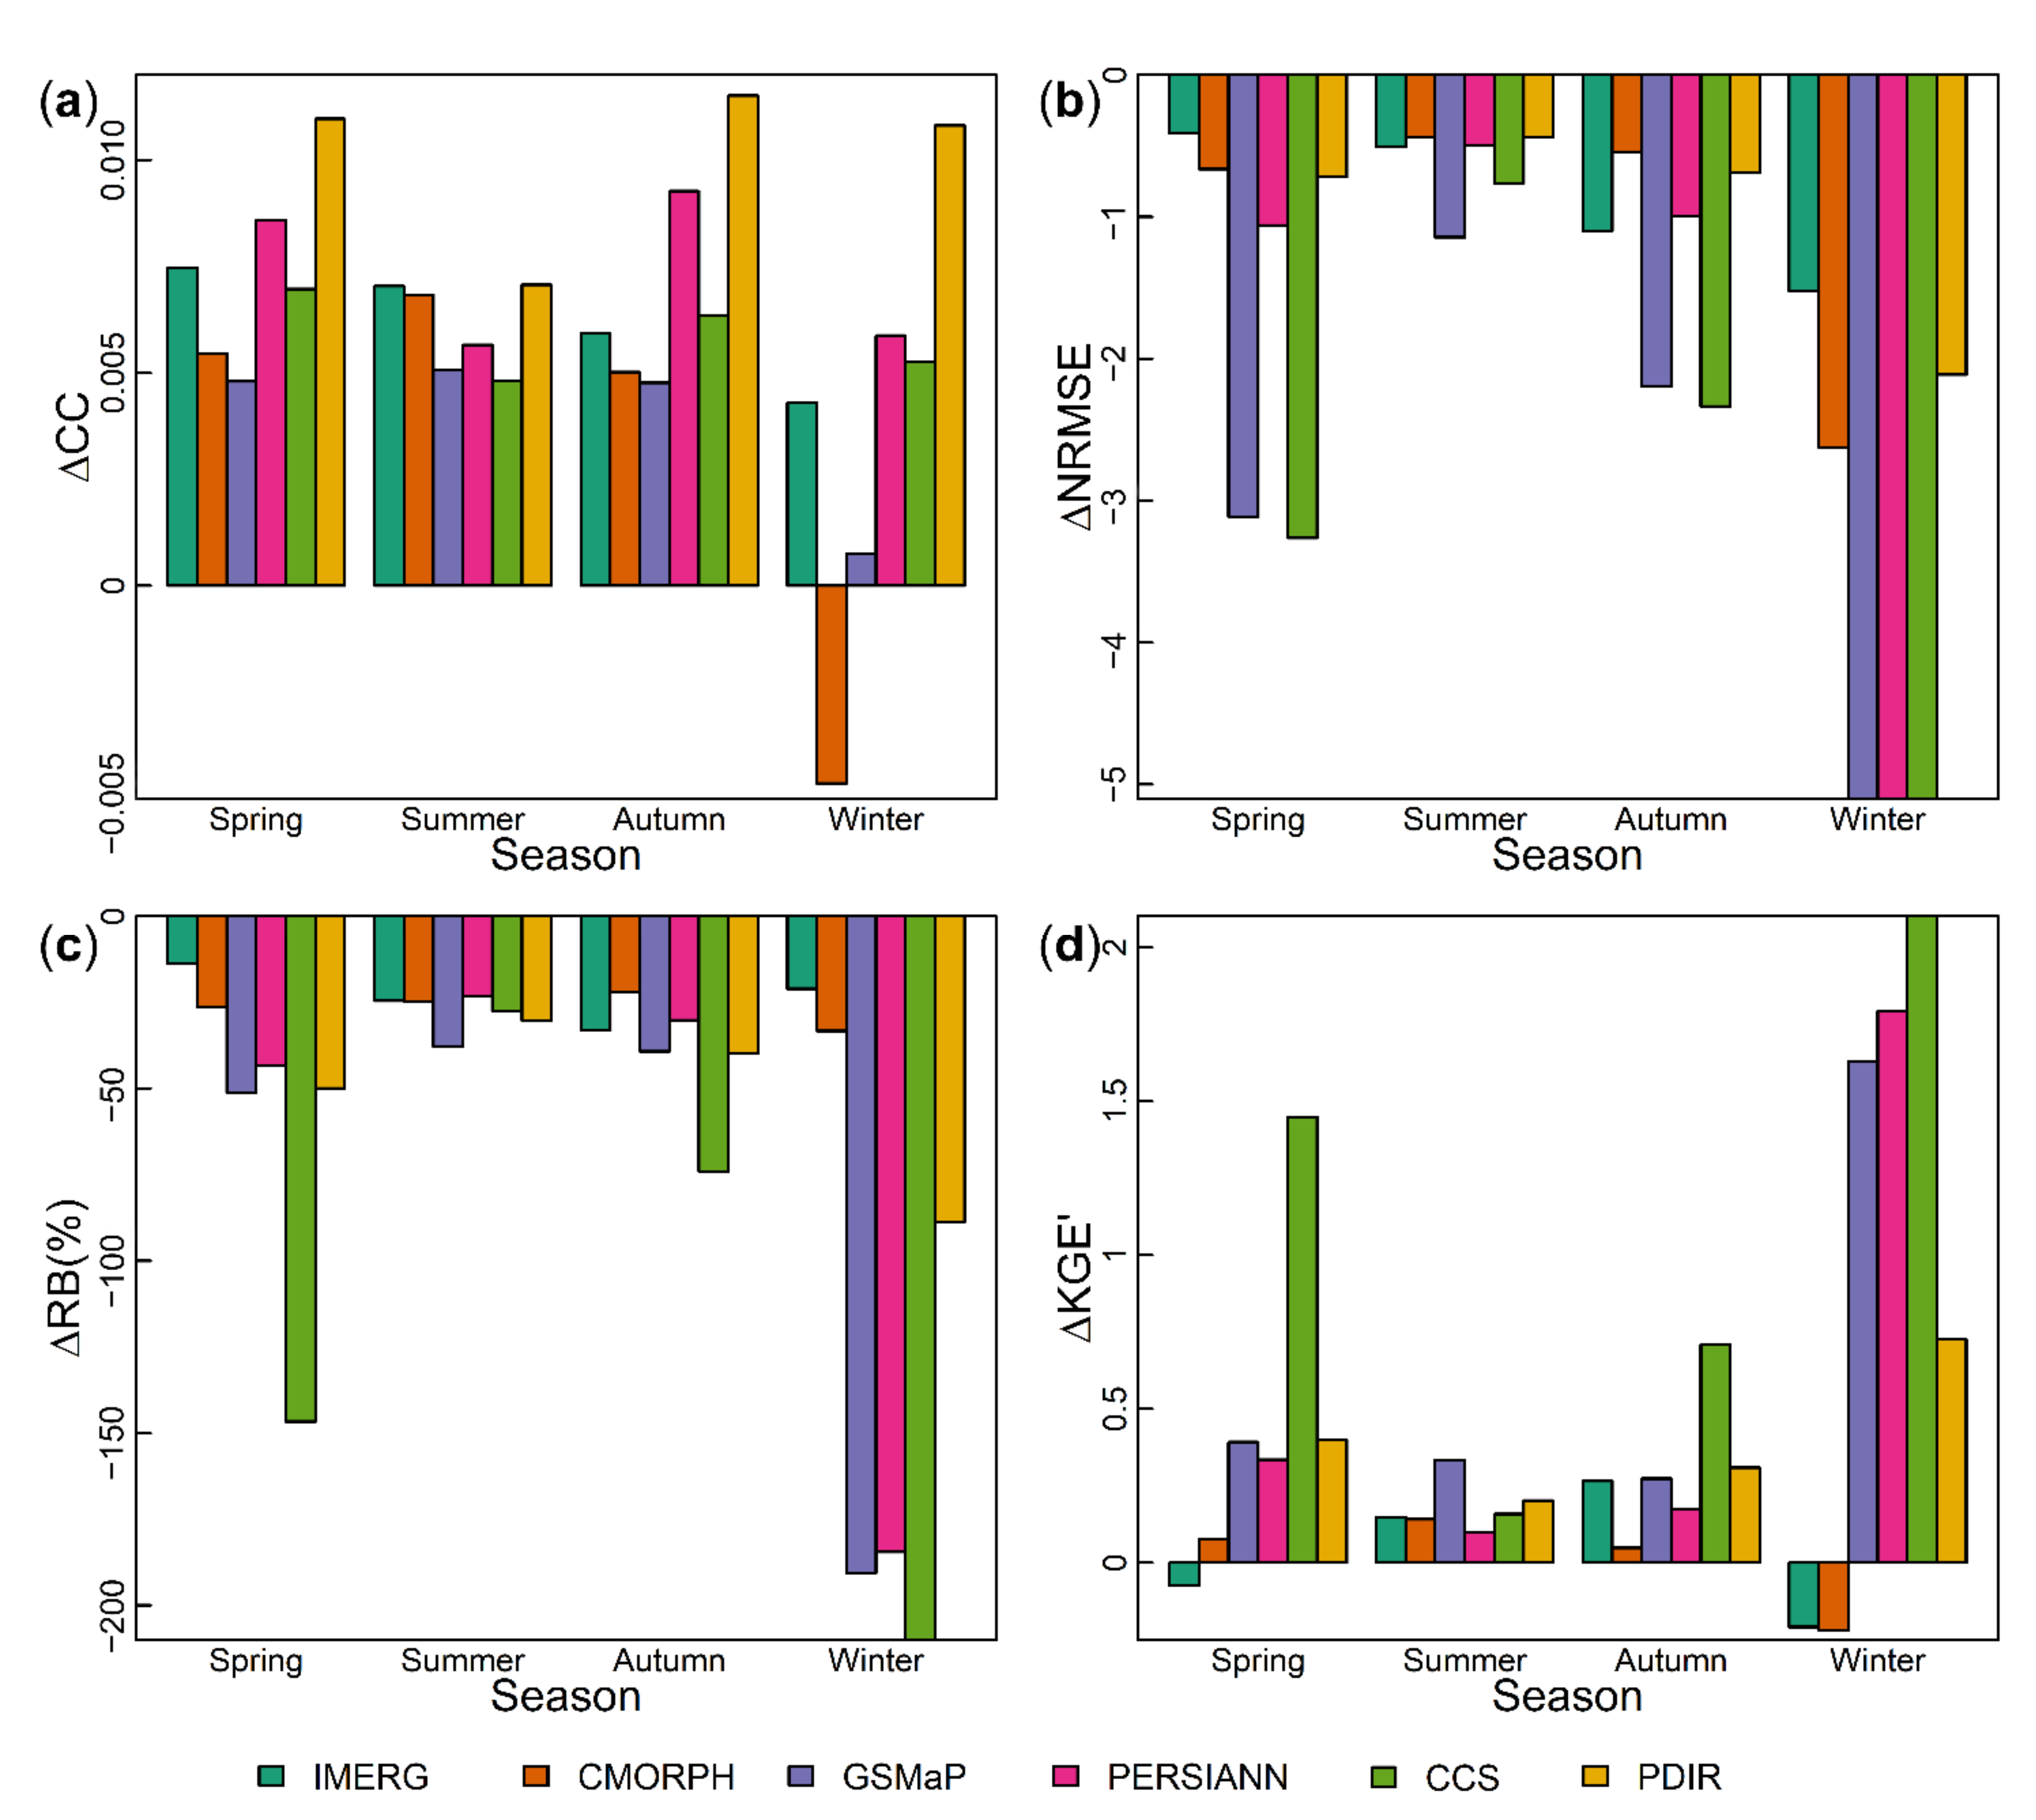
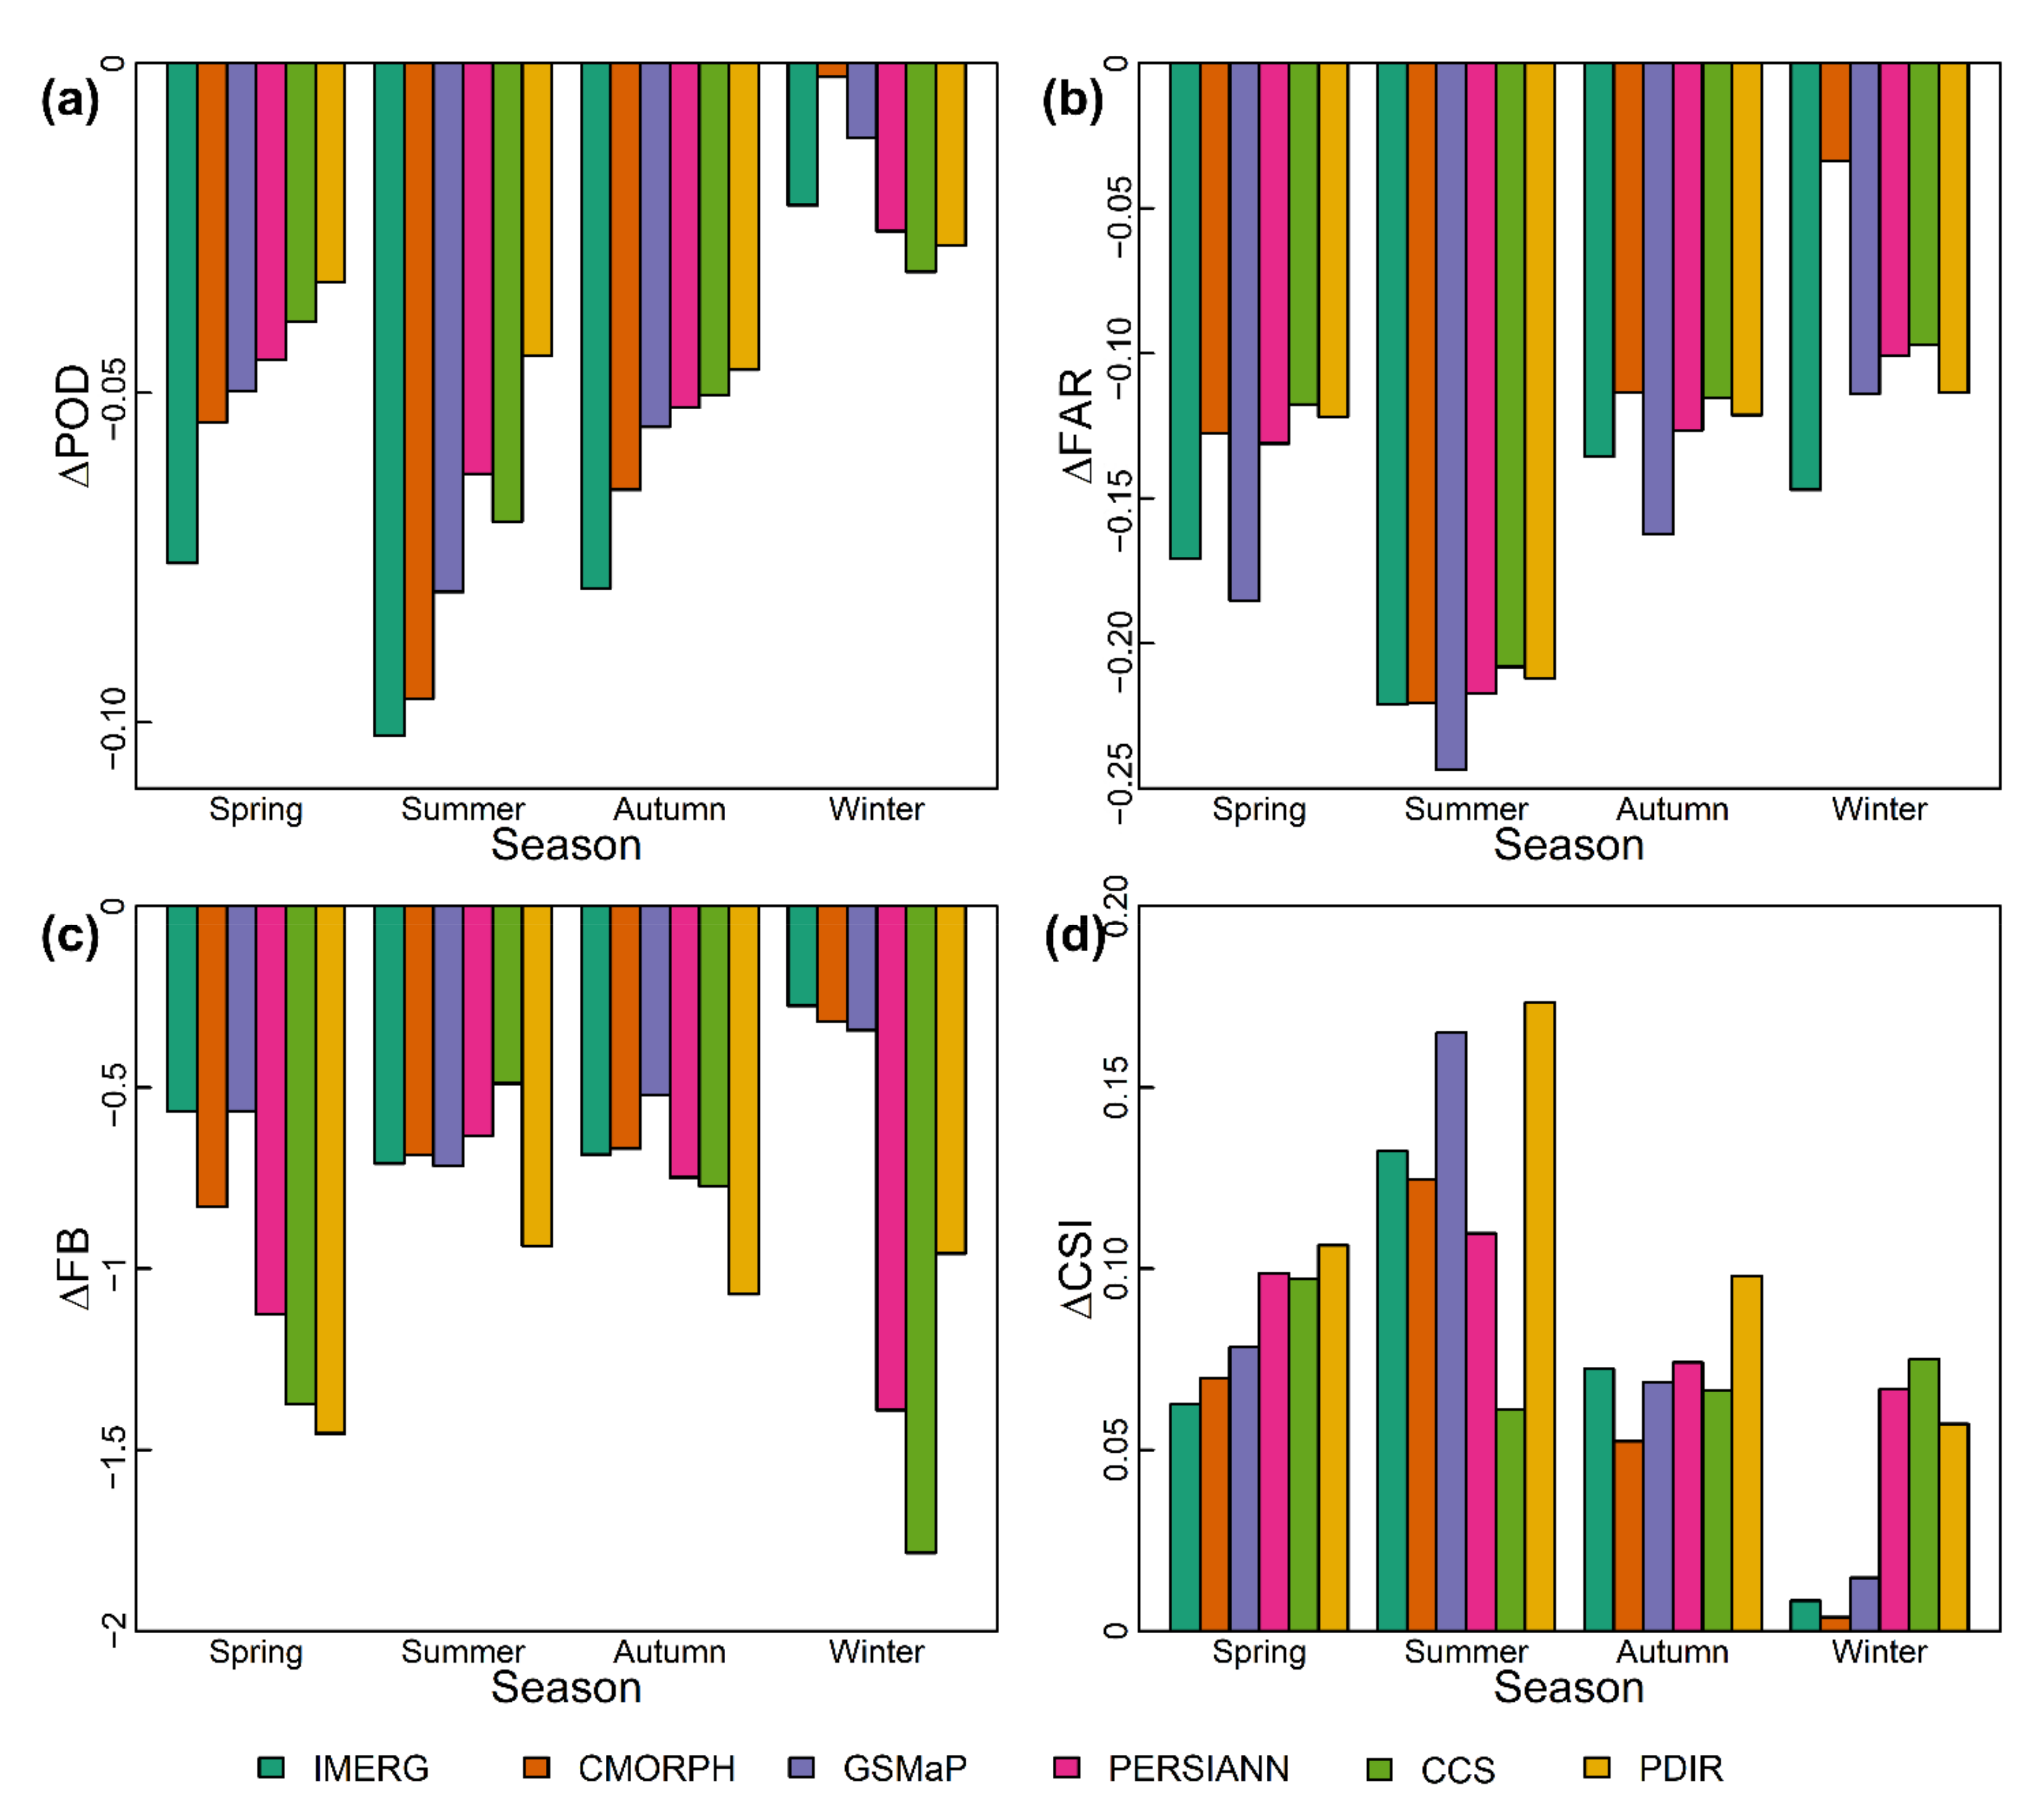
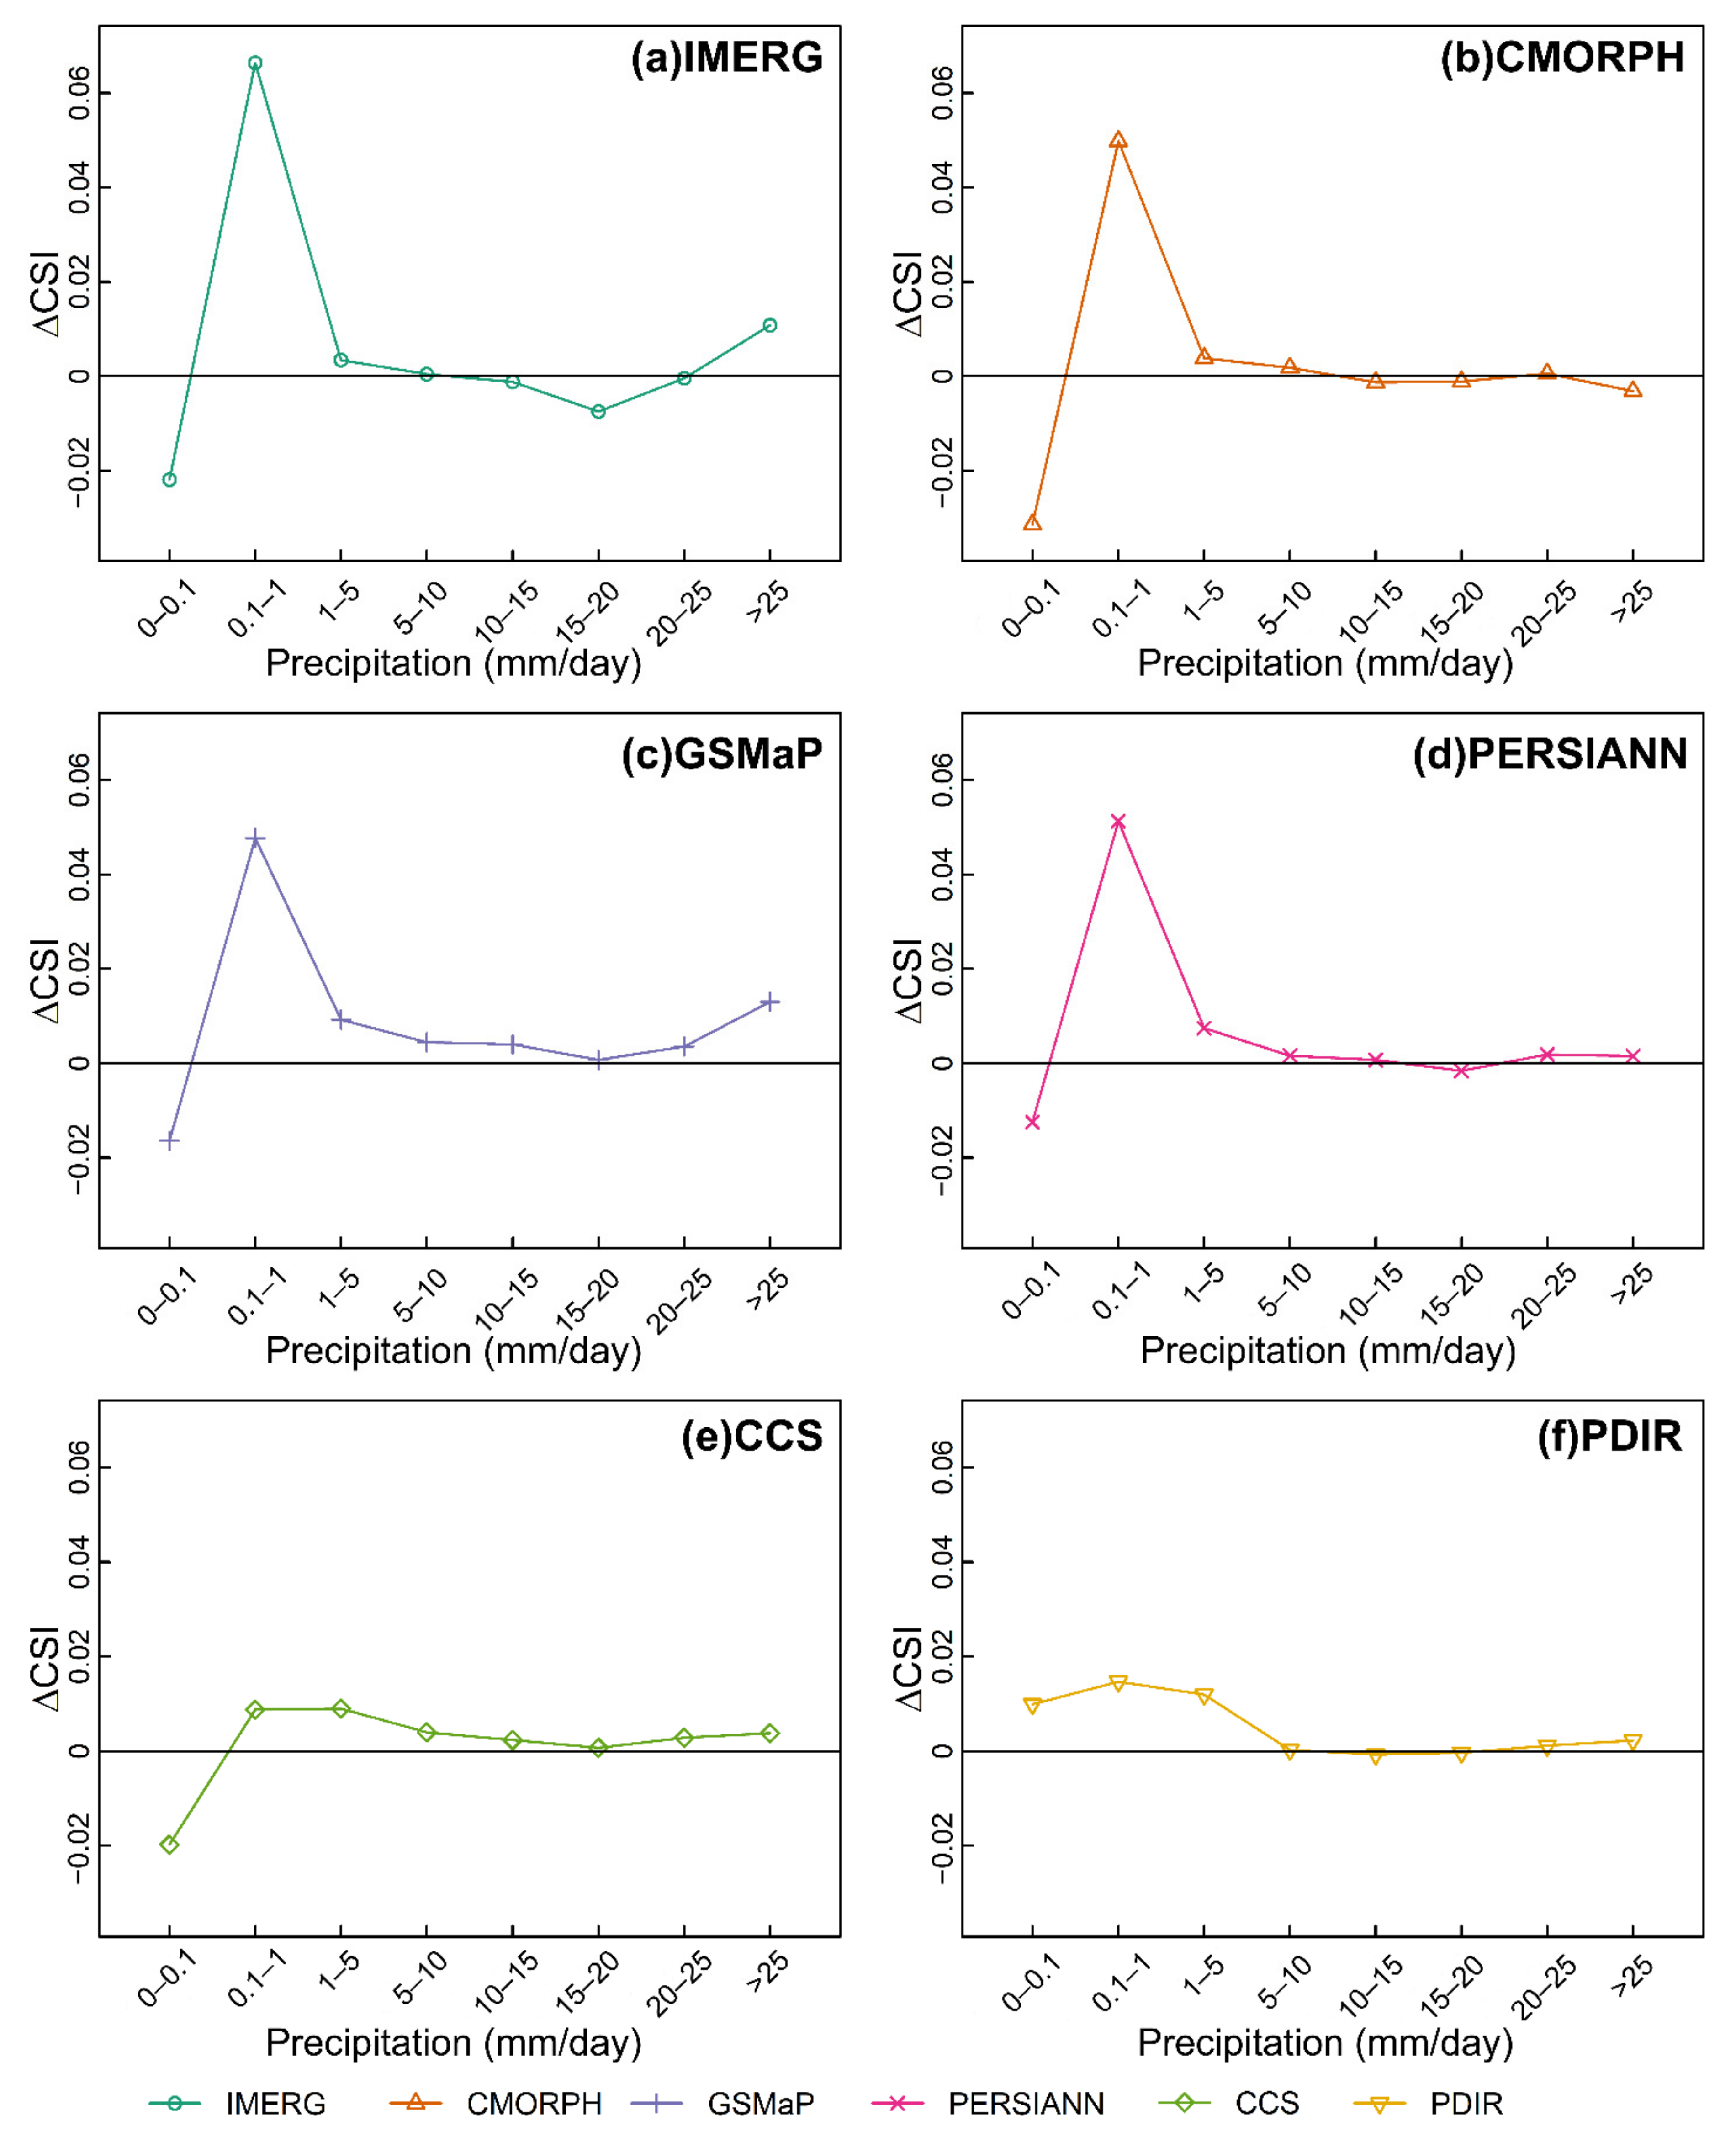
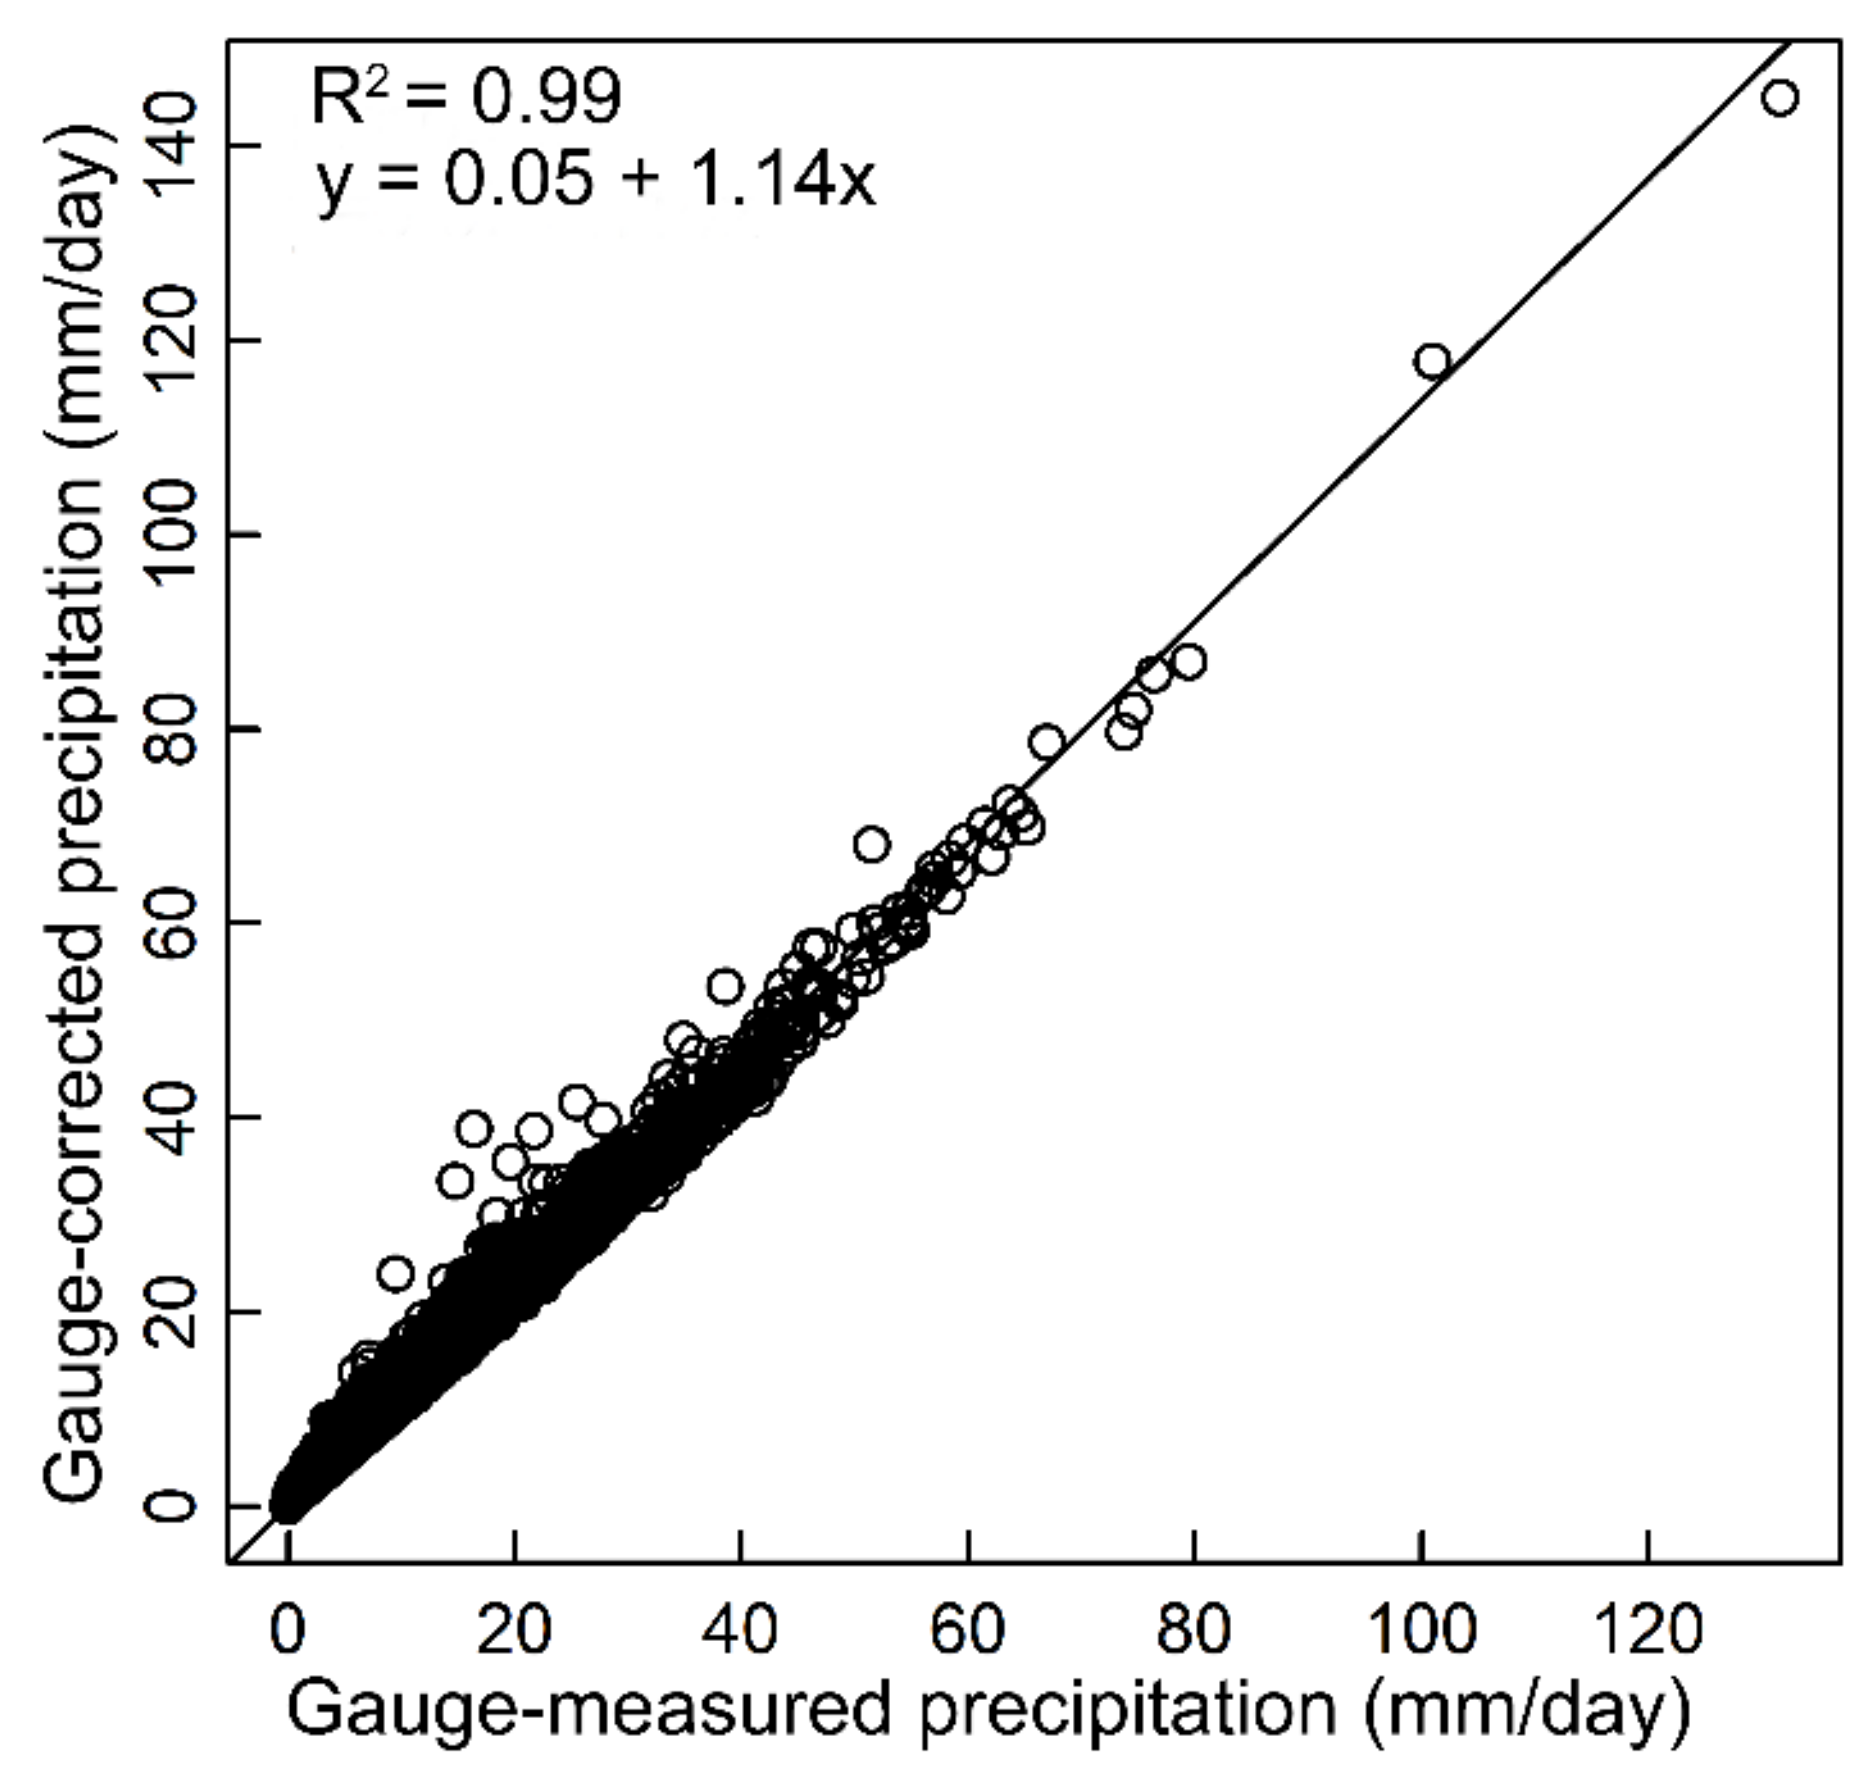
Summarizing the above results, we found that the bias of the gauge makes the overall performances of all six SPPs undervalued over the whole ARNC, which indicates that the application potential of SPPs in ARNC will be underestimated if directly using gauge data as an evaluation benchmark without removing bias. After removing the negative bias inherent in gauge measurements, the precipitation amount and the number of precipitation events from the gauge increase, which reduced the overestimation magnitude of six SPPs in precipitation amount and the number of precipitation events. Therefore, the absolute values of RB and FB decline along with decreasing RMSE, POD, and FAR, which contribute to the increasing KGE′ and CSI. These results suggest that the performance evaluation of SPPs in other regions may also be affected by the gauge bias and further works should be performed to investigate the impacts of gauge bias on the performance assessment of SPPs in other regions. In addition, the CC of SPPs after bias correction hardly changes, which indicates that the correlation between SPPs and gauge data is robust to the bias in gauge measurements. This is because the bias-corrected gauge data has a significant linear correlation with the original measured gauge data (see
Figure 8; the determination coefficient R
2 reaches 0.99).
Among six SPPs, IMERG shows the best performance, which can be explained by the massive input data and advanced retrieval algorithms. IMERG integrates “all” satellite microwave precipitation estimates, microwave-calibrated infrared (IR) satellite estimates, and potentially other precipitation estimators for the TRMM and GPM eras over the entire globe [
10]. The algorithm of IMERG incorporates multiple techniques from other SPPs, that is, the morphing technique from CMORPH, the IR precipitation estimation method from PERSIANN, and intercalibration and bias-adjustment algorithms from TMPA (Tropical Rainfall Measuring Mission Multi-Satellite Precipitation Analysis) [
10]. Three IR-based precipitation estimation products, PERSIANN, CCS, and PDIR, although with higher resolution, do not show superior performance to a passive microwave (PMW)-based IMERG. This is because IR imagery only provides information on cloud-top characteristics, but PMW sensors provide rich information on the vertical profile of the atmosphere and hydrometeors directly related to precipitation [
14]. Moreover, the performances of all six SPPs over ARNC are still not very satisfactory over ARNC. This might be caused by the sub-cloud evaporation [
57] and the complex terrain. Over arid regions, the atmospheric conditions beneath the clouds are mostly dry. As a consequence, precipitation detected by satellites will evaporate before reaching the surface. The terrain is complex over ARNC; mountains and basins are distributed alternately, and deserts and oases coexist. Therefore, the variability of precipitation patterns over this region is high and hard to be completely captured by the satellites. Besides, efforts are needed to develop more advanced algorithms and integrate more earth observation data for SPPs to provide more accurate gridded SPPs over ARNC. Alternatively, SPPs can be merged with ground precipitation observation (gauge or radar observations) and reanalysis precipitation products to provide multi-source precipitation fusion products with high accuracy, which will especially be useful for regions with scarce ground precipitation observations, for example, ARNC.
The impacts of gauge data bias on the performance assessment of SPPs are different for different SPPs and vary by different subregions, seasons, ranges of precipitation intensity, and precipitation phases. Two reasons may account for this result. First, different algorithms of six SPPs lead to different performances of the SPPs. The algorithms of PERSIANN, CCS, and PDIR belong to the category of techniques called the “Euler approach” [
14,
58]. Using collocated IR and PMW data, this category develops a spatiotemporally dependent empirical link between precipitation intensity and cloud-top temperature. The algorithms of CMORPH, GSMaP, and IMERG adopted the second category of techniques, the “Lagrangian approach” [
43,
58]. Using the precipitation cloud system moving vector computed from consecutive IR images, the “Lagrangian approach” propagates and interpolates the estimated instantaneous rain rates from the PMW observations. Second, the correction factors (the ratio of the corrected gauge precipitation to the measured gauge precipitation) differ by different regions, seasons, precipitation phases, and ranges of precipitation intensity. Ye et al. [
26] found the correction factor varies from 15% to 250% over the arid region in Northwest China. Zhang et al. [
37] found the correction factor for light rain intensity could reach 40%, and the correction factor for rainstorm events could reach as high as 18% in some regions of northwest China. Because snow dominates in winter (the ratio of snow in precipitation events is 84.3% in winter) and almost all the precipitation events are rain in summer (the ratio of rain in precipitation events is near 100% in summer) in the study area, the correction factor is larger in winter than in summer. The catch ratio of snow is less than that of rain because snow is more susceptible to wind than rain [
26,
27,
35]. This leads to a higher correction factor for snow than for rain.
This study belongs to the family of studies on the impacts of the gauge bias on downstream applications of gauge data over China. Zhang et al. [
37] investigated the effect of the gauge bias on precipitation climatology over Mainland China, and they found that the actual amounts of precipitation, snowfall, and intense rainfall were much higher than previously measured over China. Li et al. [
31] redivided the climatic zones in China using the bias-corrected gauge data, and they found that the areas of severe arid decreased, but the areas of severe humid areas increased compared to the climate zone division using the original gauge data. Yao et al. [
35] studied the effects of the gauge bias on aridity and drought assessment in China. The results show that climate type changed after correcting the gauge bias, for example, some sites from severe arid to arid and others from arid to semi-arid. These studies and the results of this paper prove that the bias of gauge data will inevitably affect applications that use gauge data as an input. Therefore, further efforts are needed to study the effects of gauge bias on other downstream applications of gauge data.
The network of weather stations used in this study is uneven and relatively sparse, with a density of 0.43 stations per 10,000 km
2. The weather stations in NX and SX are mainly distributed on the edges of the Junggar Basin and the Tarim Basin. Only four weather stations are located in AP. A high-density network of weather stations will substantially improve the reliability of the impact analyses of gauge data bias on the evaluation of SPPs. Limited by the density of the weather station, we adopted a pixel-to-point strategy with the assumption that the point-scale precipitation observation is equal to the areal precipitation estimates and the mismatch between point-measured gauge data and areal estimates from SPPs is neglected. Last but not least, some uncertainties exist in the bias-correction method for gauge measurements. We used two air temperature thresholds to classify the precipitation phase. This simple scheme may cause misclassification of the precipitation phase in some cases. It is expected to develop a parameterization scheme for more accurate precipitation phase classification based on the relationship between various geophysical variables and the precipitation phase. It has been suggested that the wind speed at the gauge level should be used to establish equations for catch ratios [
59]. The wind speed at gauge orifice height can be estimated from the wind speed at standard height. Reducing wind at standard height to the gauge orifice height should consider gauge exposure. However, the station metadata about gauge exposure was not available, so wind speed at the gauge orifice height could not be obtained to calculate the catch ratios. The daily mean wind speed at 10 m height available at the weather station was used instead. Moreover, wind speed can vary during a 24-h day, and therefore the daily mean wind speed applied to correct wind undercatch may not accurately reflect the simultaneous wind speed at the time of the precipitation occurs in some cases. Hourly data is desirable, but high-quality hourly precipitation and wind speed data are currently unavailable.


