3.1. Parameter Sensitivity Analysis
After running the SWAT model, calibration and sensitivity analysis of the model parameters is required. On the basis of referring to a large number of literatures, nine parameters that have a greater impact on runoff are selected. The relative significance of the parameter is represented by the t-Stat value, and the larger the absolute value of t-Stat, the more sensitive the parameter is. The p-Value represents the probability value of P corresponding to the
t-test value, and the closer the value is to 0, the more sensitive the parameter is [
19].
In this paper, the continuous uncertainty rate method (SUFI2) is used to determine the parameters. After 2000 iterations of the model, the parameter sensitivity and optimal parameter values are shown in
Table 4. The CN2 parameter has the highest sensitivity, followed by the CANMX parameter.
3.2. SWAT Model Calibration and Results Analysis
Calibration of hydrological models in the absence of hydrological information is one of the difficulties that make it possible to carry out studies of small hydropower stations without hydrological information. Without the calibration of the hydrological model, the training effect will be very different from the measured value. The SWAT-CUP tool is one of the effective ways to calibrate the SWAT model and this tool is suitable to support decision makers in conceptualizing sustainable watershed management, allowing decision makers to better calibrate the model [
29,
30].
This manuscript proposes the direct method, the indirect method and the similarity method to obtain the measured value. This paper adopts the similarity method to obtain the discharge flow to calibrate the model. The objective function for parameter calibration uses Nash–Sutcliffe efficiency coefficient (NSE) and coefficients of determination [
31].
(1) NSE: Nash–Sutcliffe efficiency coefficient is an important index to evaluate the accuracy of model simulation:
where
is the simulated value of discharge flow from small hydropower station;
represents the measured value of discharge flow;
is the mean of the measured discharge flow; and
is the length of the measured discharge flow.
(2)
represents the determinant coefficient and evaluates the correlation between the model simulation value and the measured value:
where
is the simulated value of the discharge flow;
represents the measured value of the discharge flow;
is the mean of the measured discharge flow;
is the mean of the simulated discharge flow; and
is the length of the measured discharge flow.
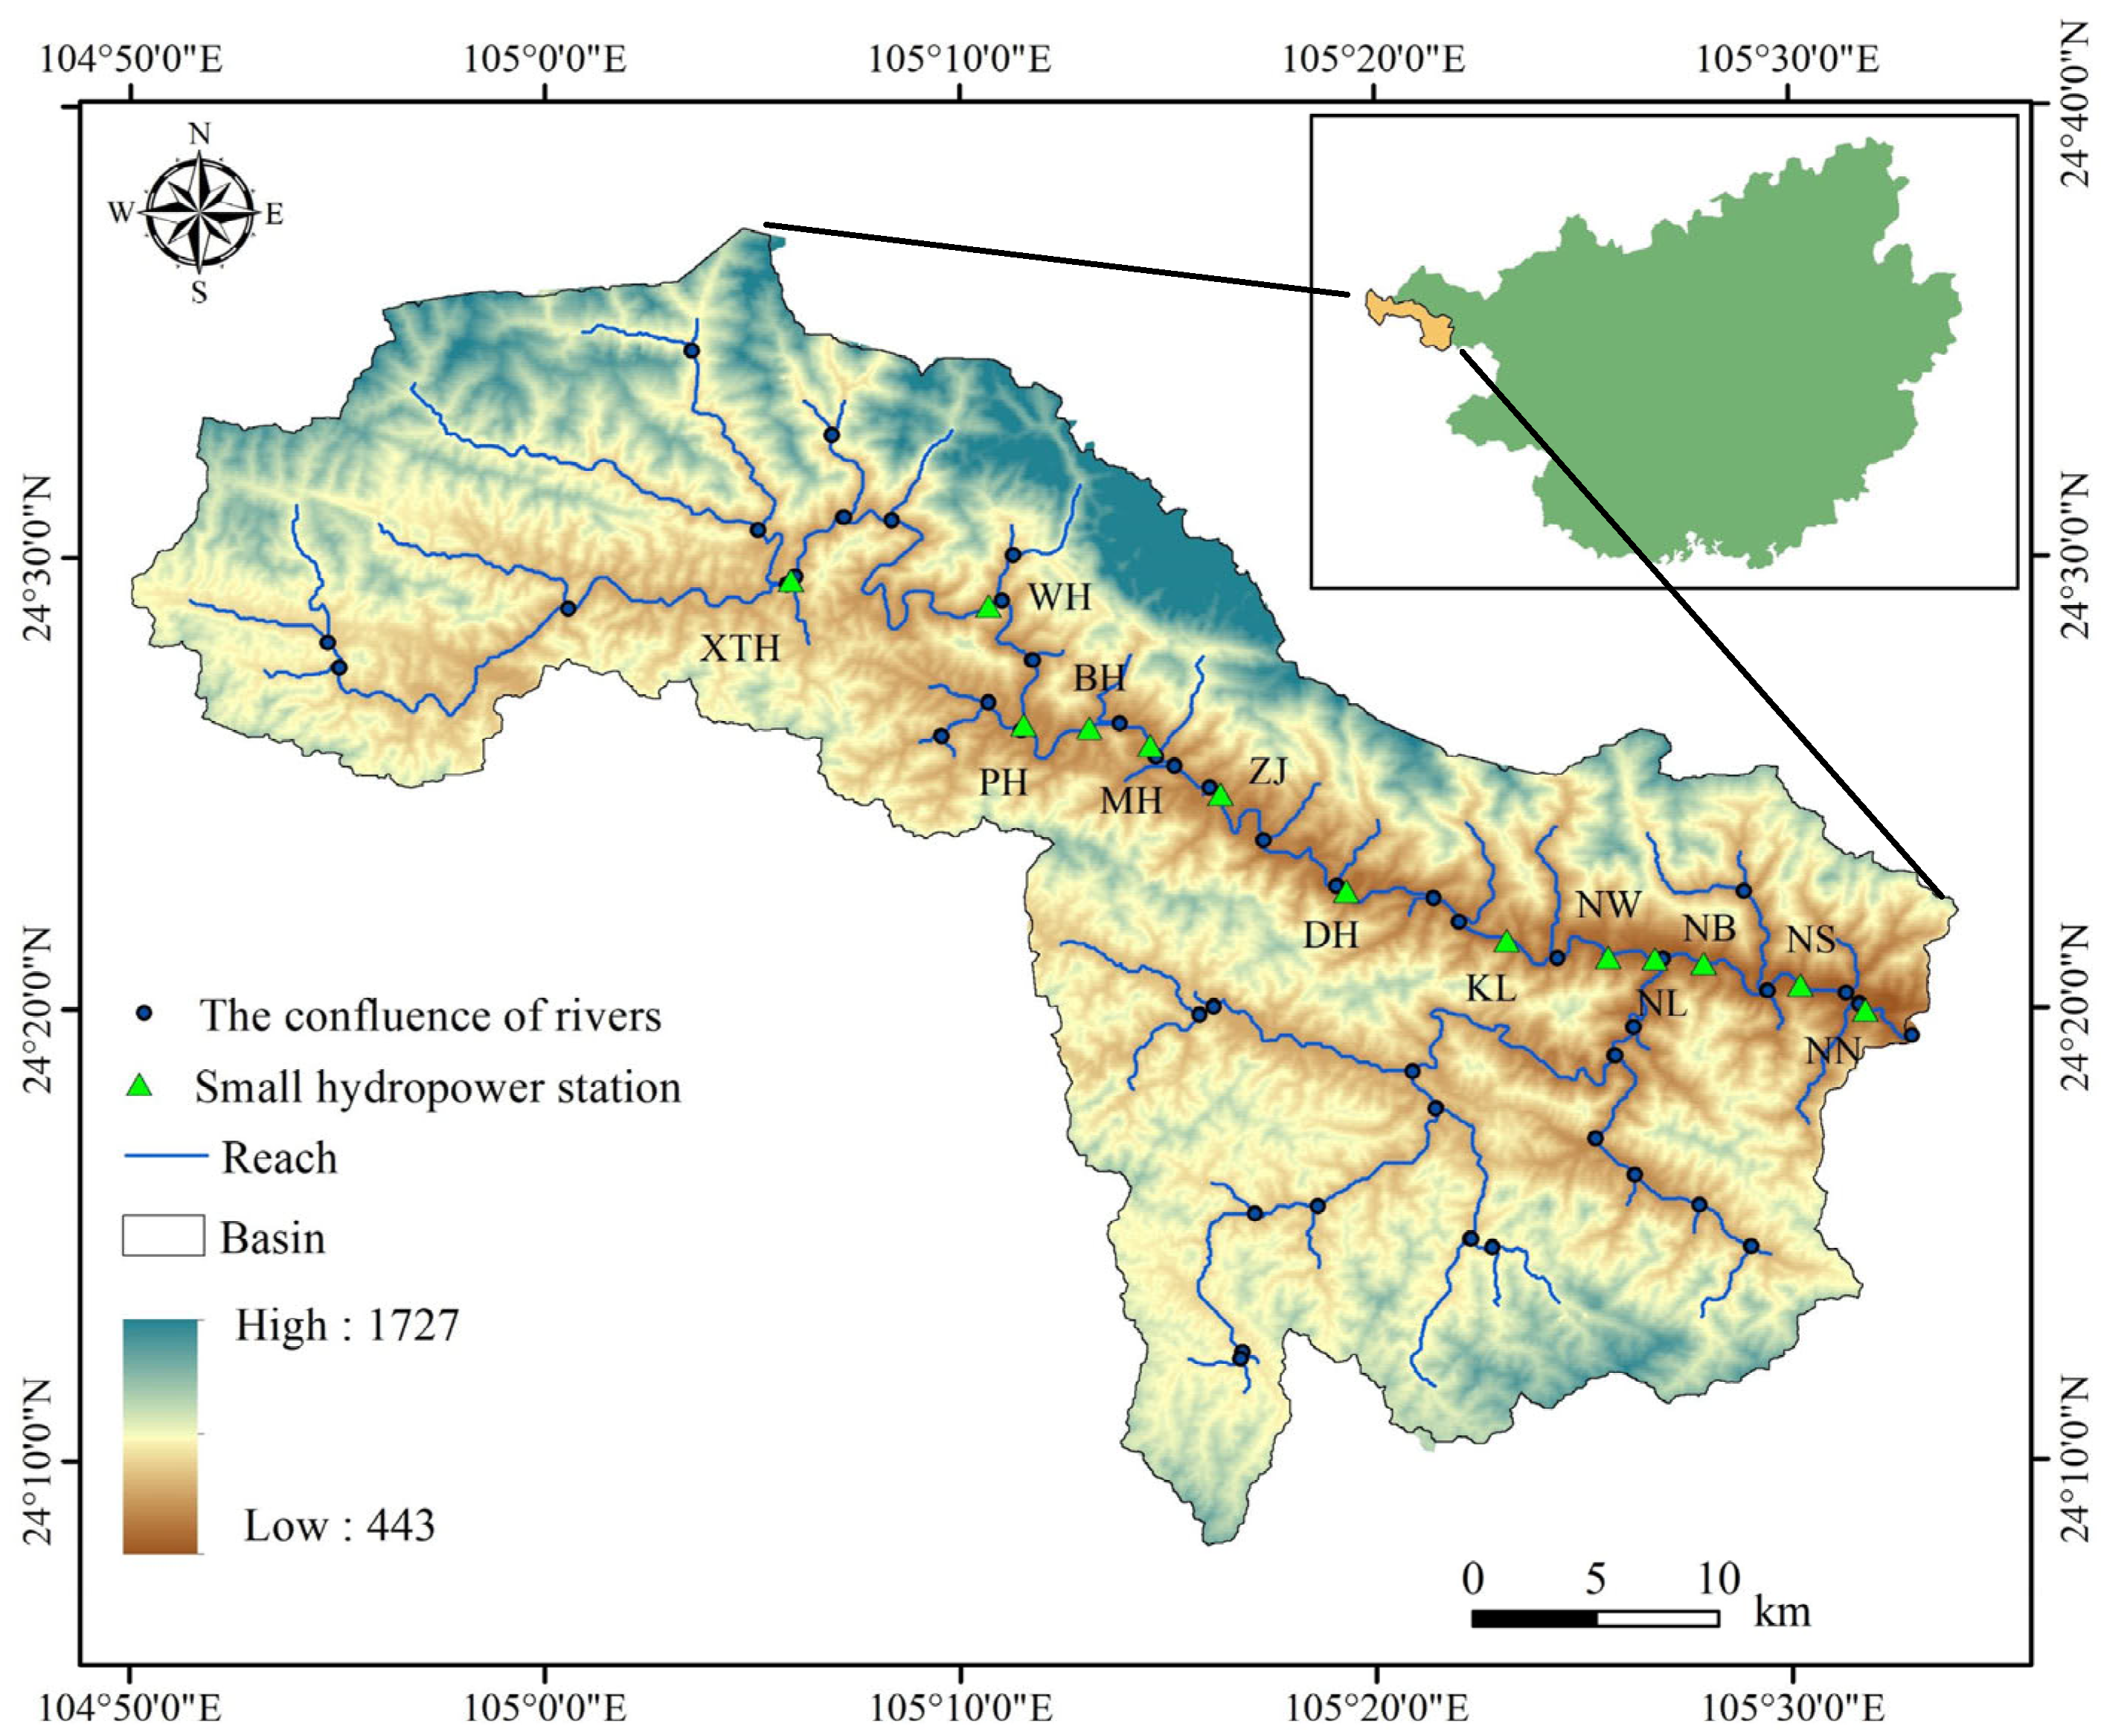
Among the 13 small hydropower stations in the research basin, the MH station and the NW station are selected as the sites for the calibration of the SWAT model. After 2000 calibrations (as shown in
Table 5 and
Figure 5), the discharge flow of the MH small hydropower station has the NSE value of 0.74, the determination coefficient
value of 0.84 and the NSE value of the NW small hydropower station is 0.73. The value of the coefficient
is 0.78.
When the value of NSE is 1, it means that the simulation results are very perfect and the measured and simulated values are exactly equal. When the value of NSE is between 0.6 and 1, it means that the simulation results are better. When the value of NSE is less than 0, the simulation results are poor. The coefficient of determination represents the correlation between the measured value and the simulated value. The closer the value is to 1, the better the result. It can be seen that the verification results of the two small hydropower stations are good and the accuracy is high.
The NB station is chosen as the validation site for no hydrological data. After calibrating the SWAT model, we can directly get the flow rate of NB small hydropower station by setting the river points in advance.
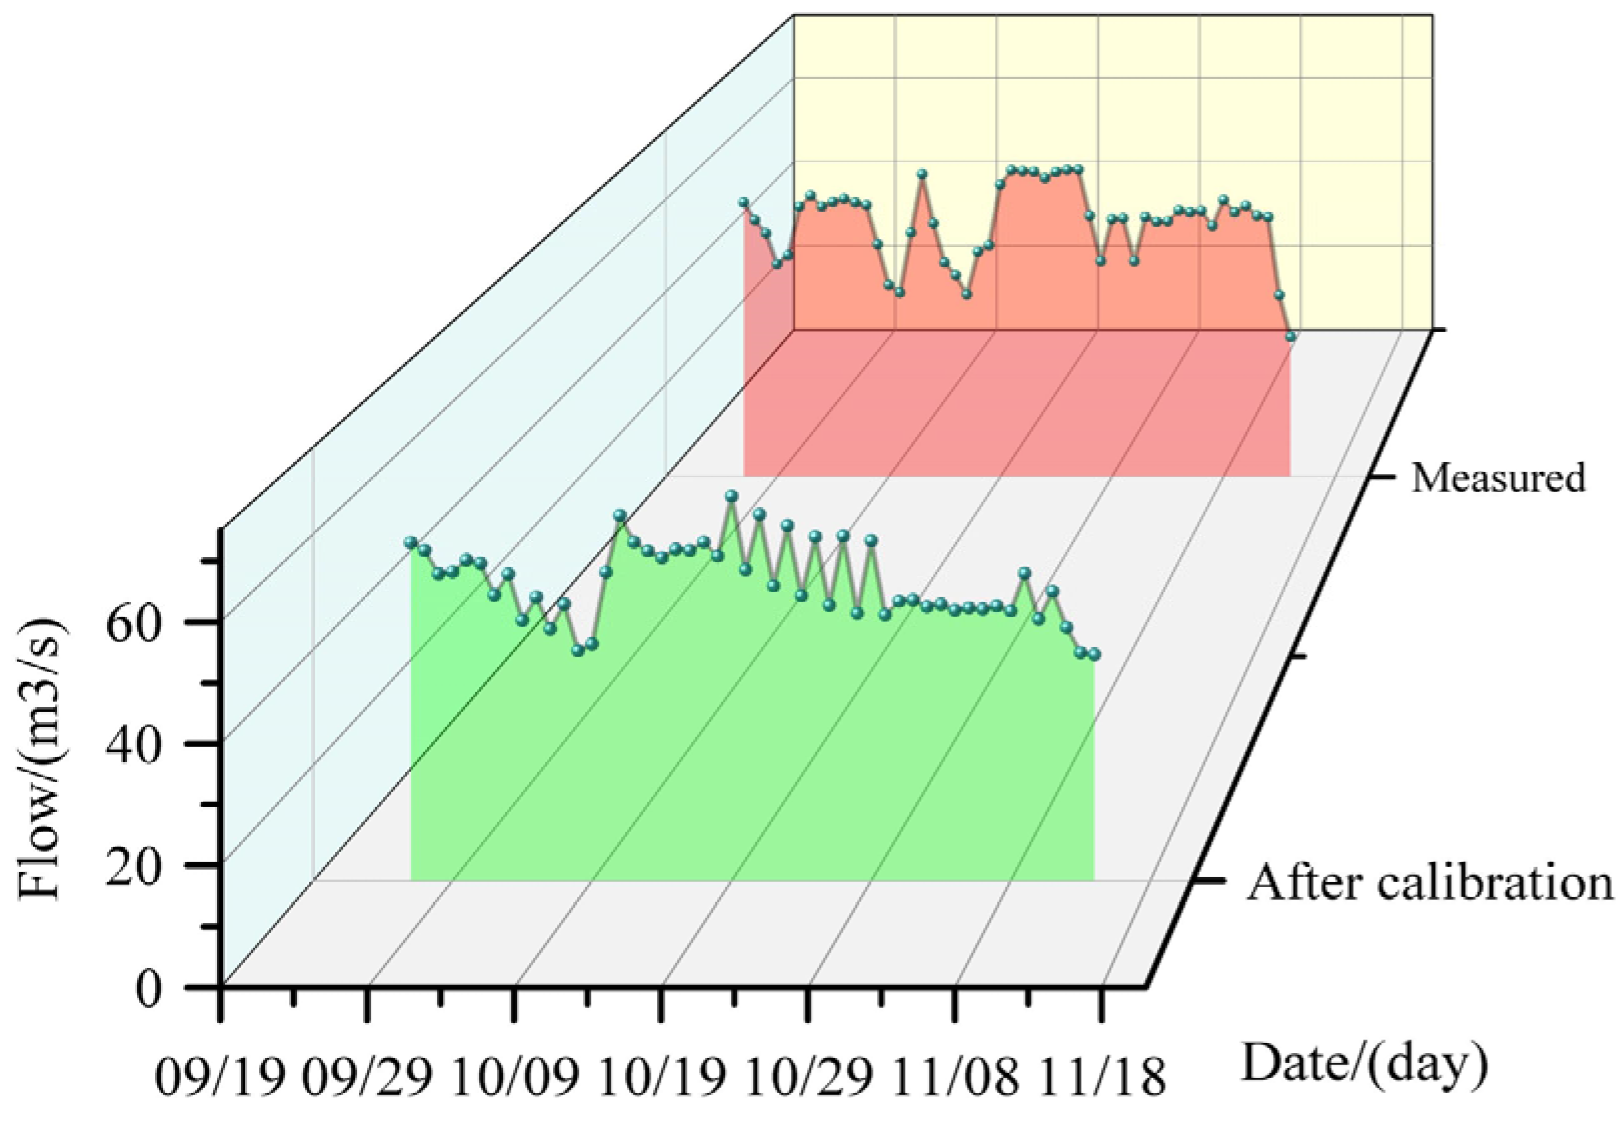
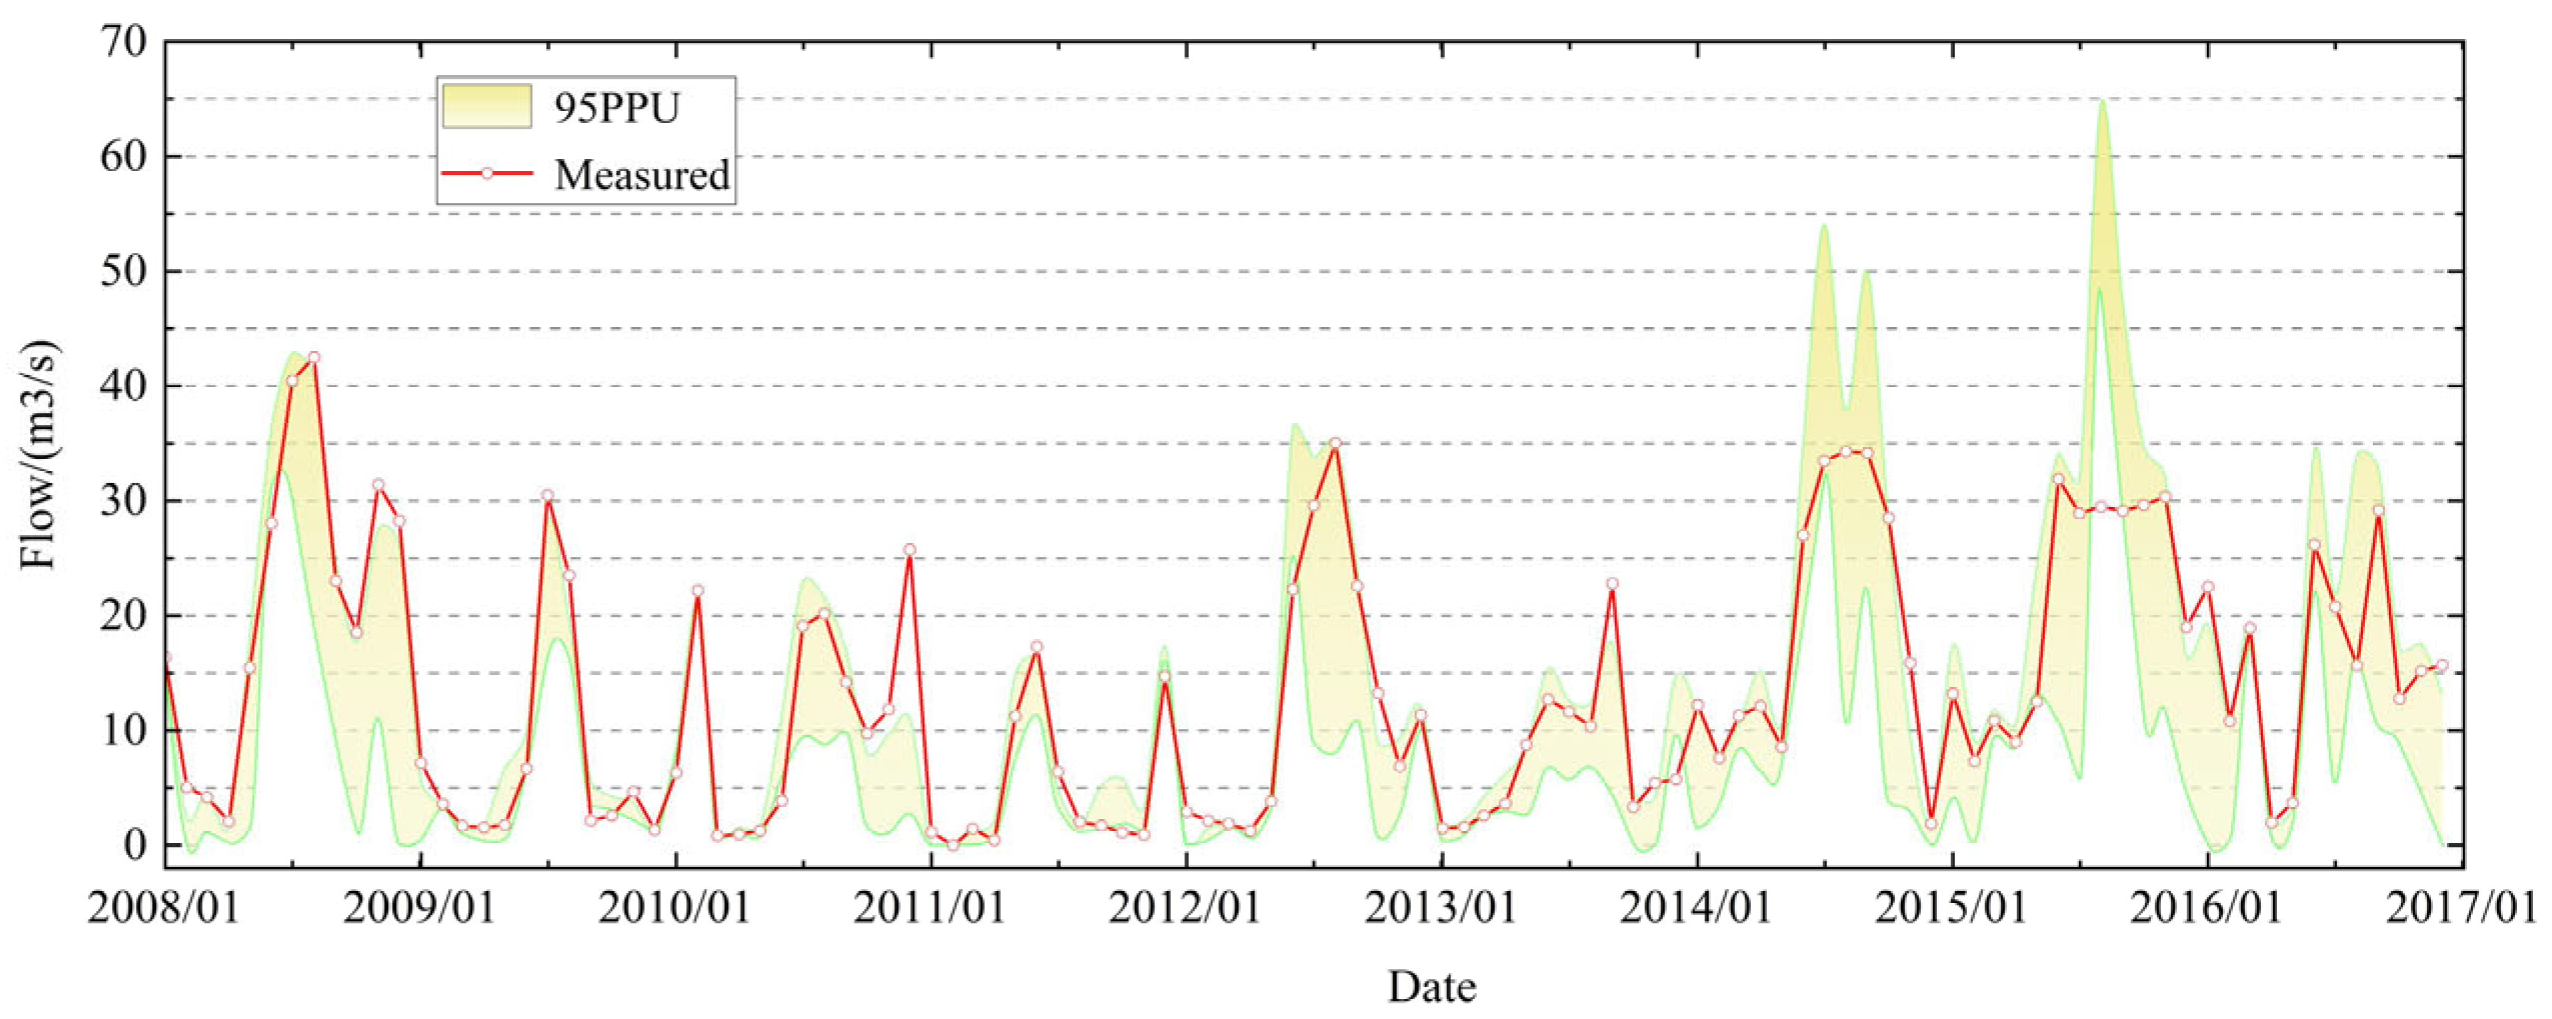
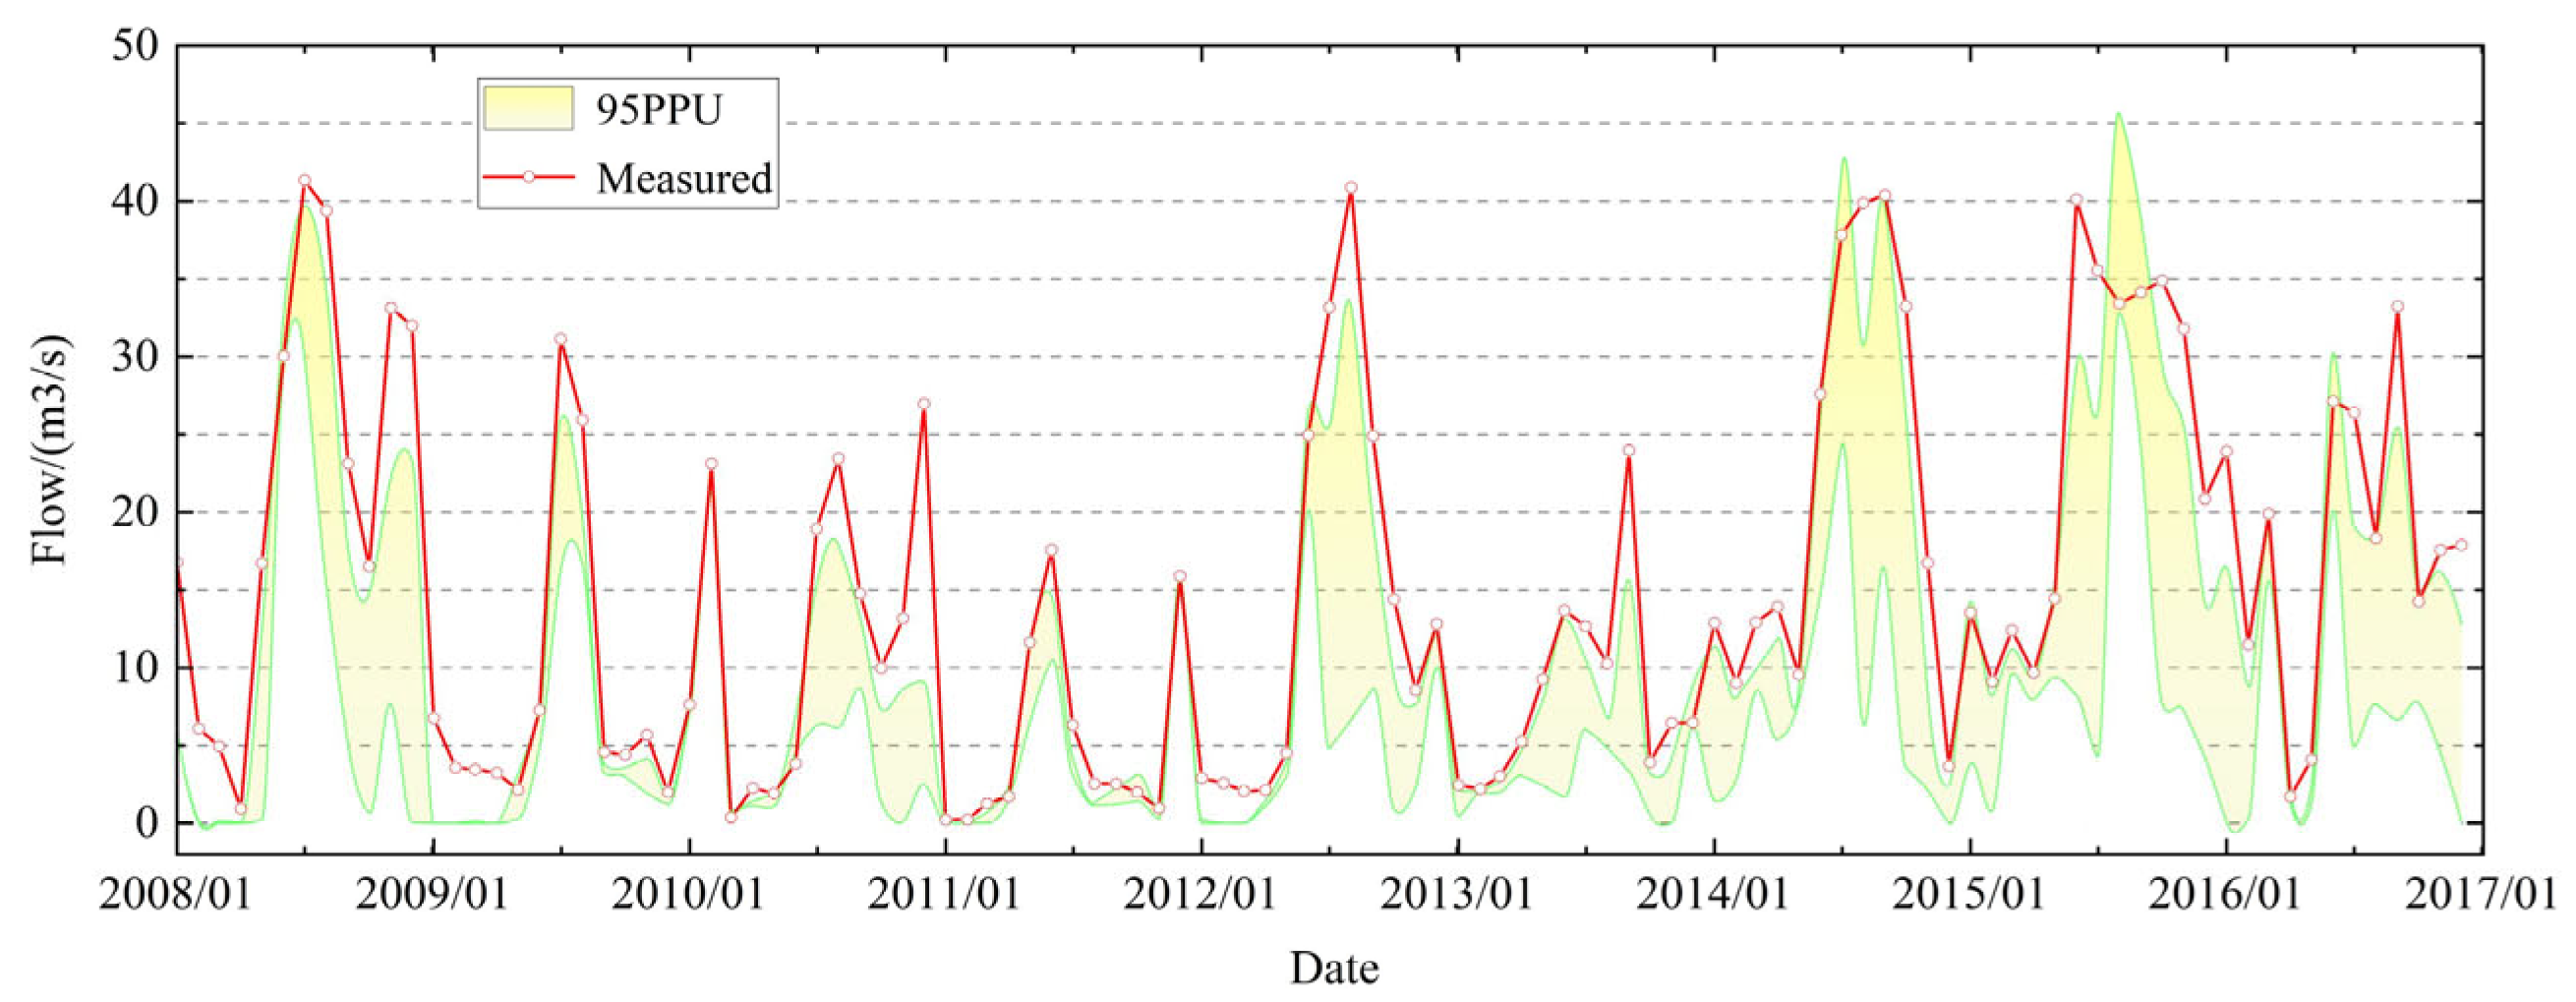
Figure 6 and
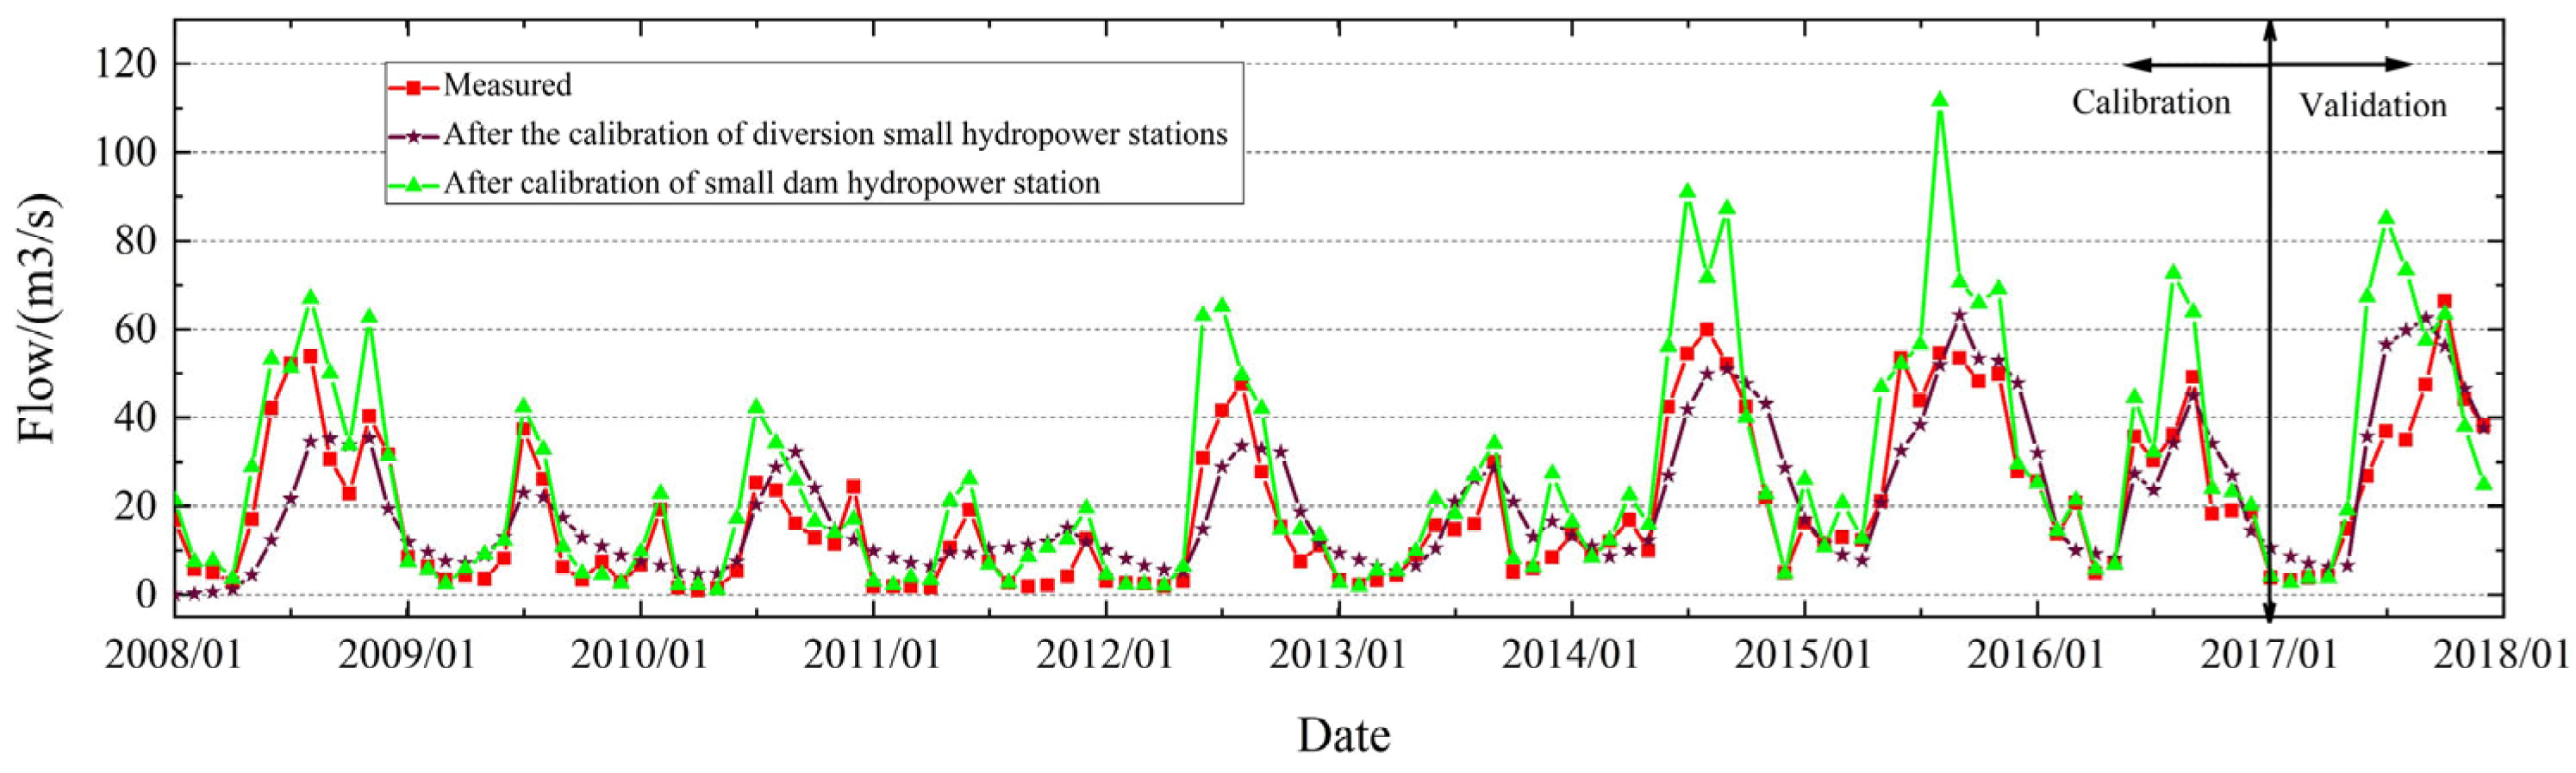
Figure 7 show the test situation of the monthly and daily scale of the discharge flow of NB small hydropower station. It can be seen that before the calibration of the SWAT model, the simulated value is lower than the actual value and the results improved significantly after calibration.
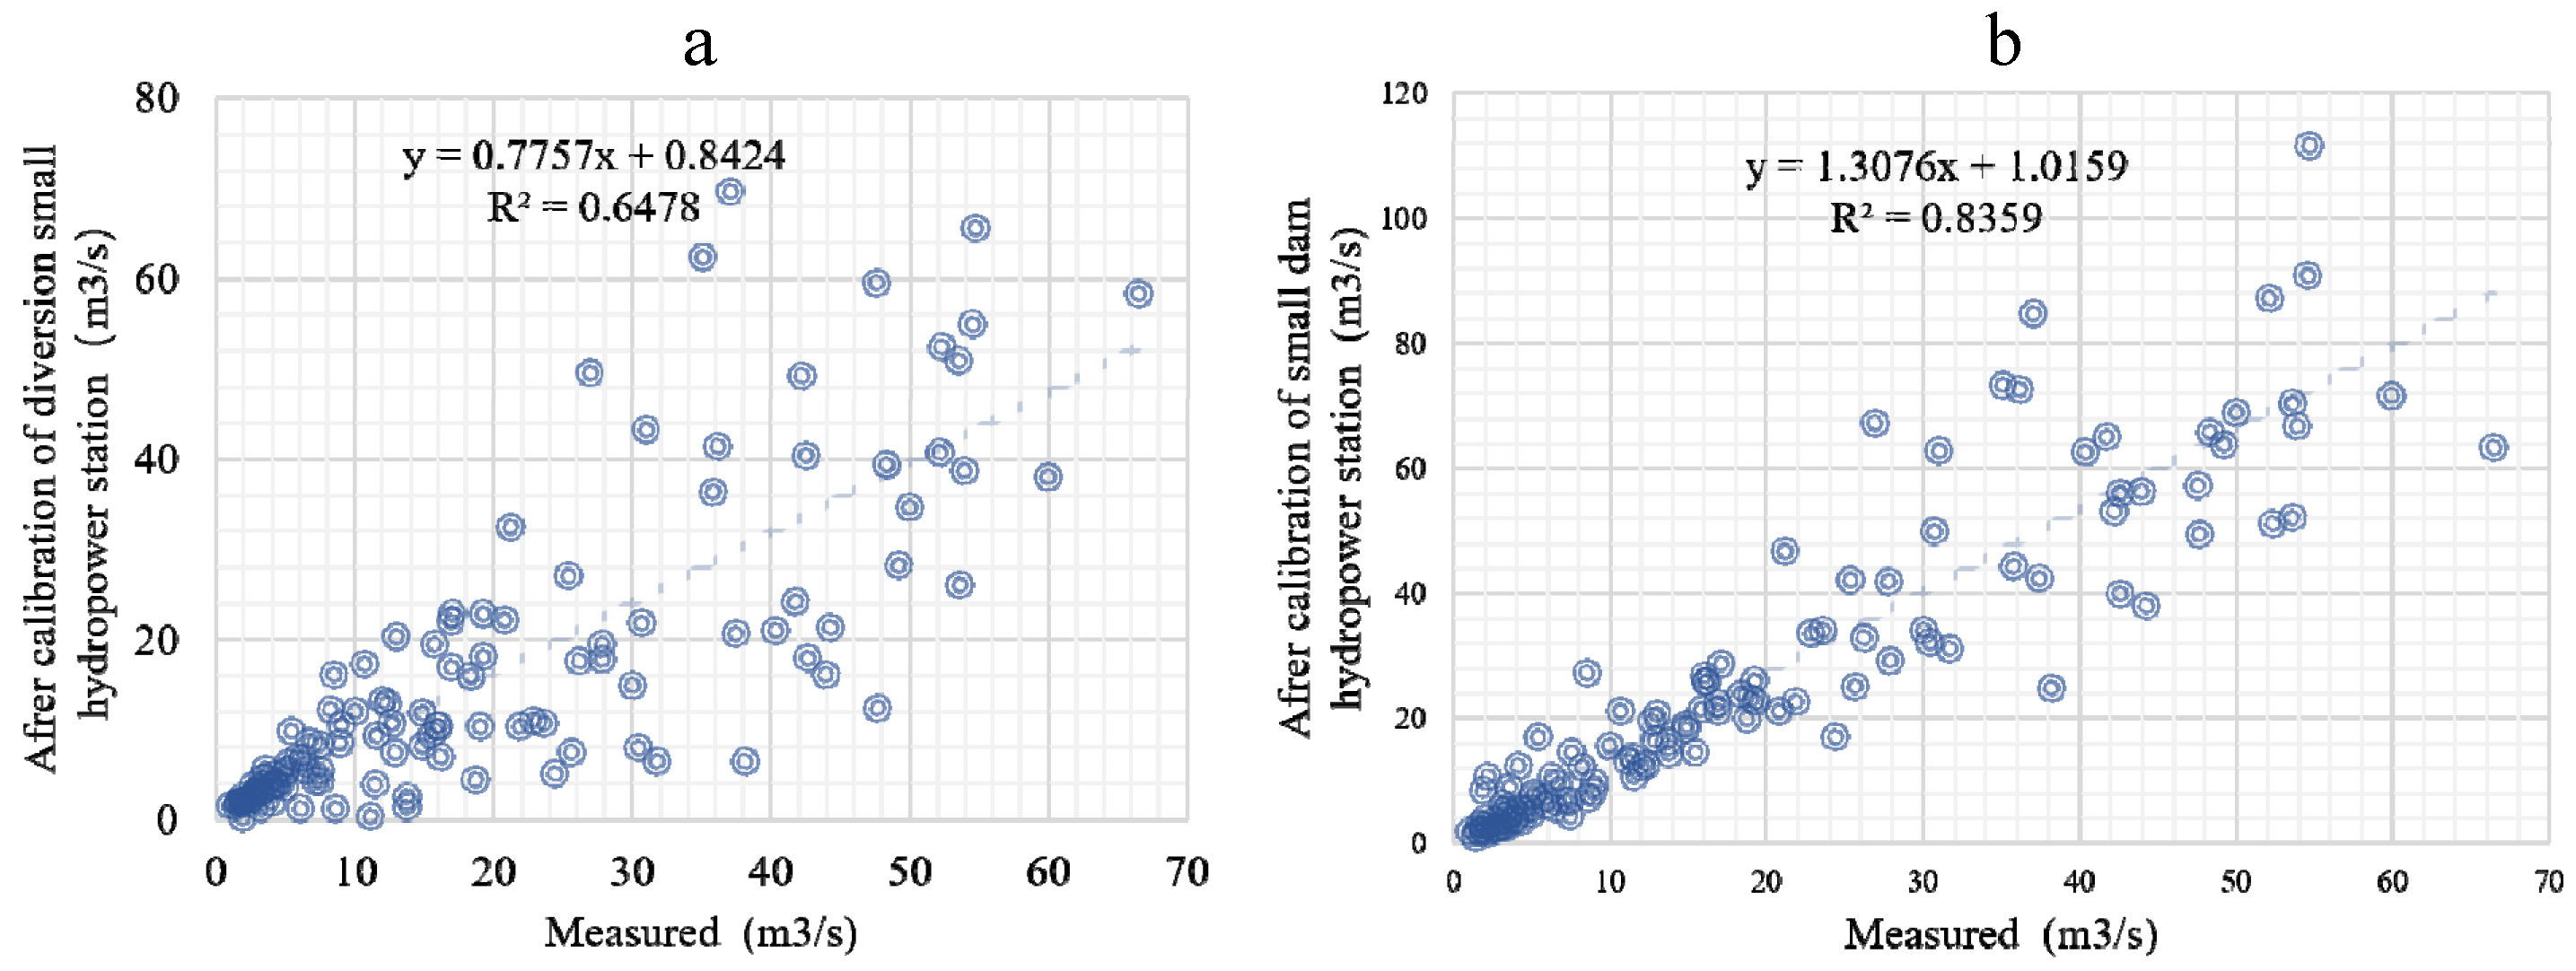
Small hydropower can be divided into dam type, diversion type and hybrid type. In order to conduct a more comprehensive study, this paper conducts an analysis of two cases of NB small hydropower station with and without reservoirs. According to the research, the flow curve of small hydropower station without reservoirs will be smoother and similar to the flow curve of natural rivers. As shown in the red-brown curve in
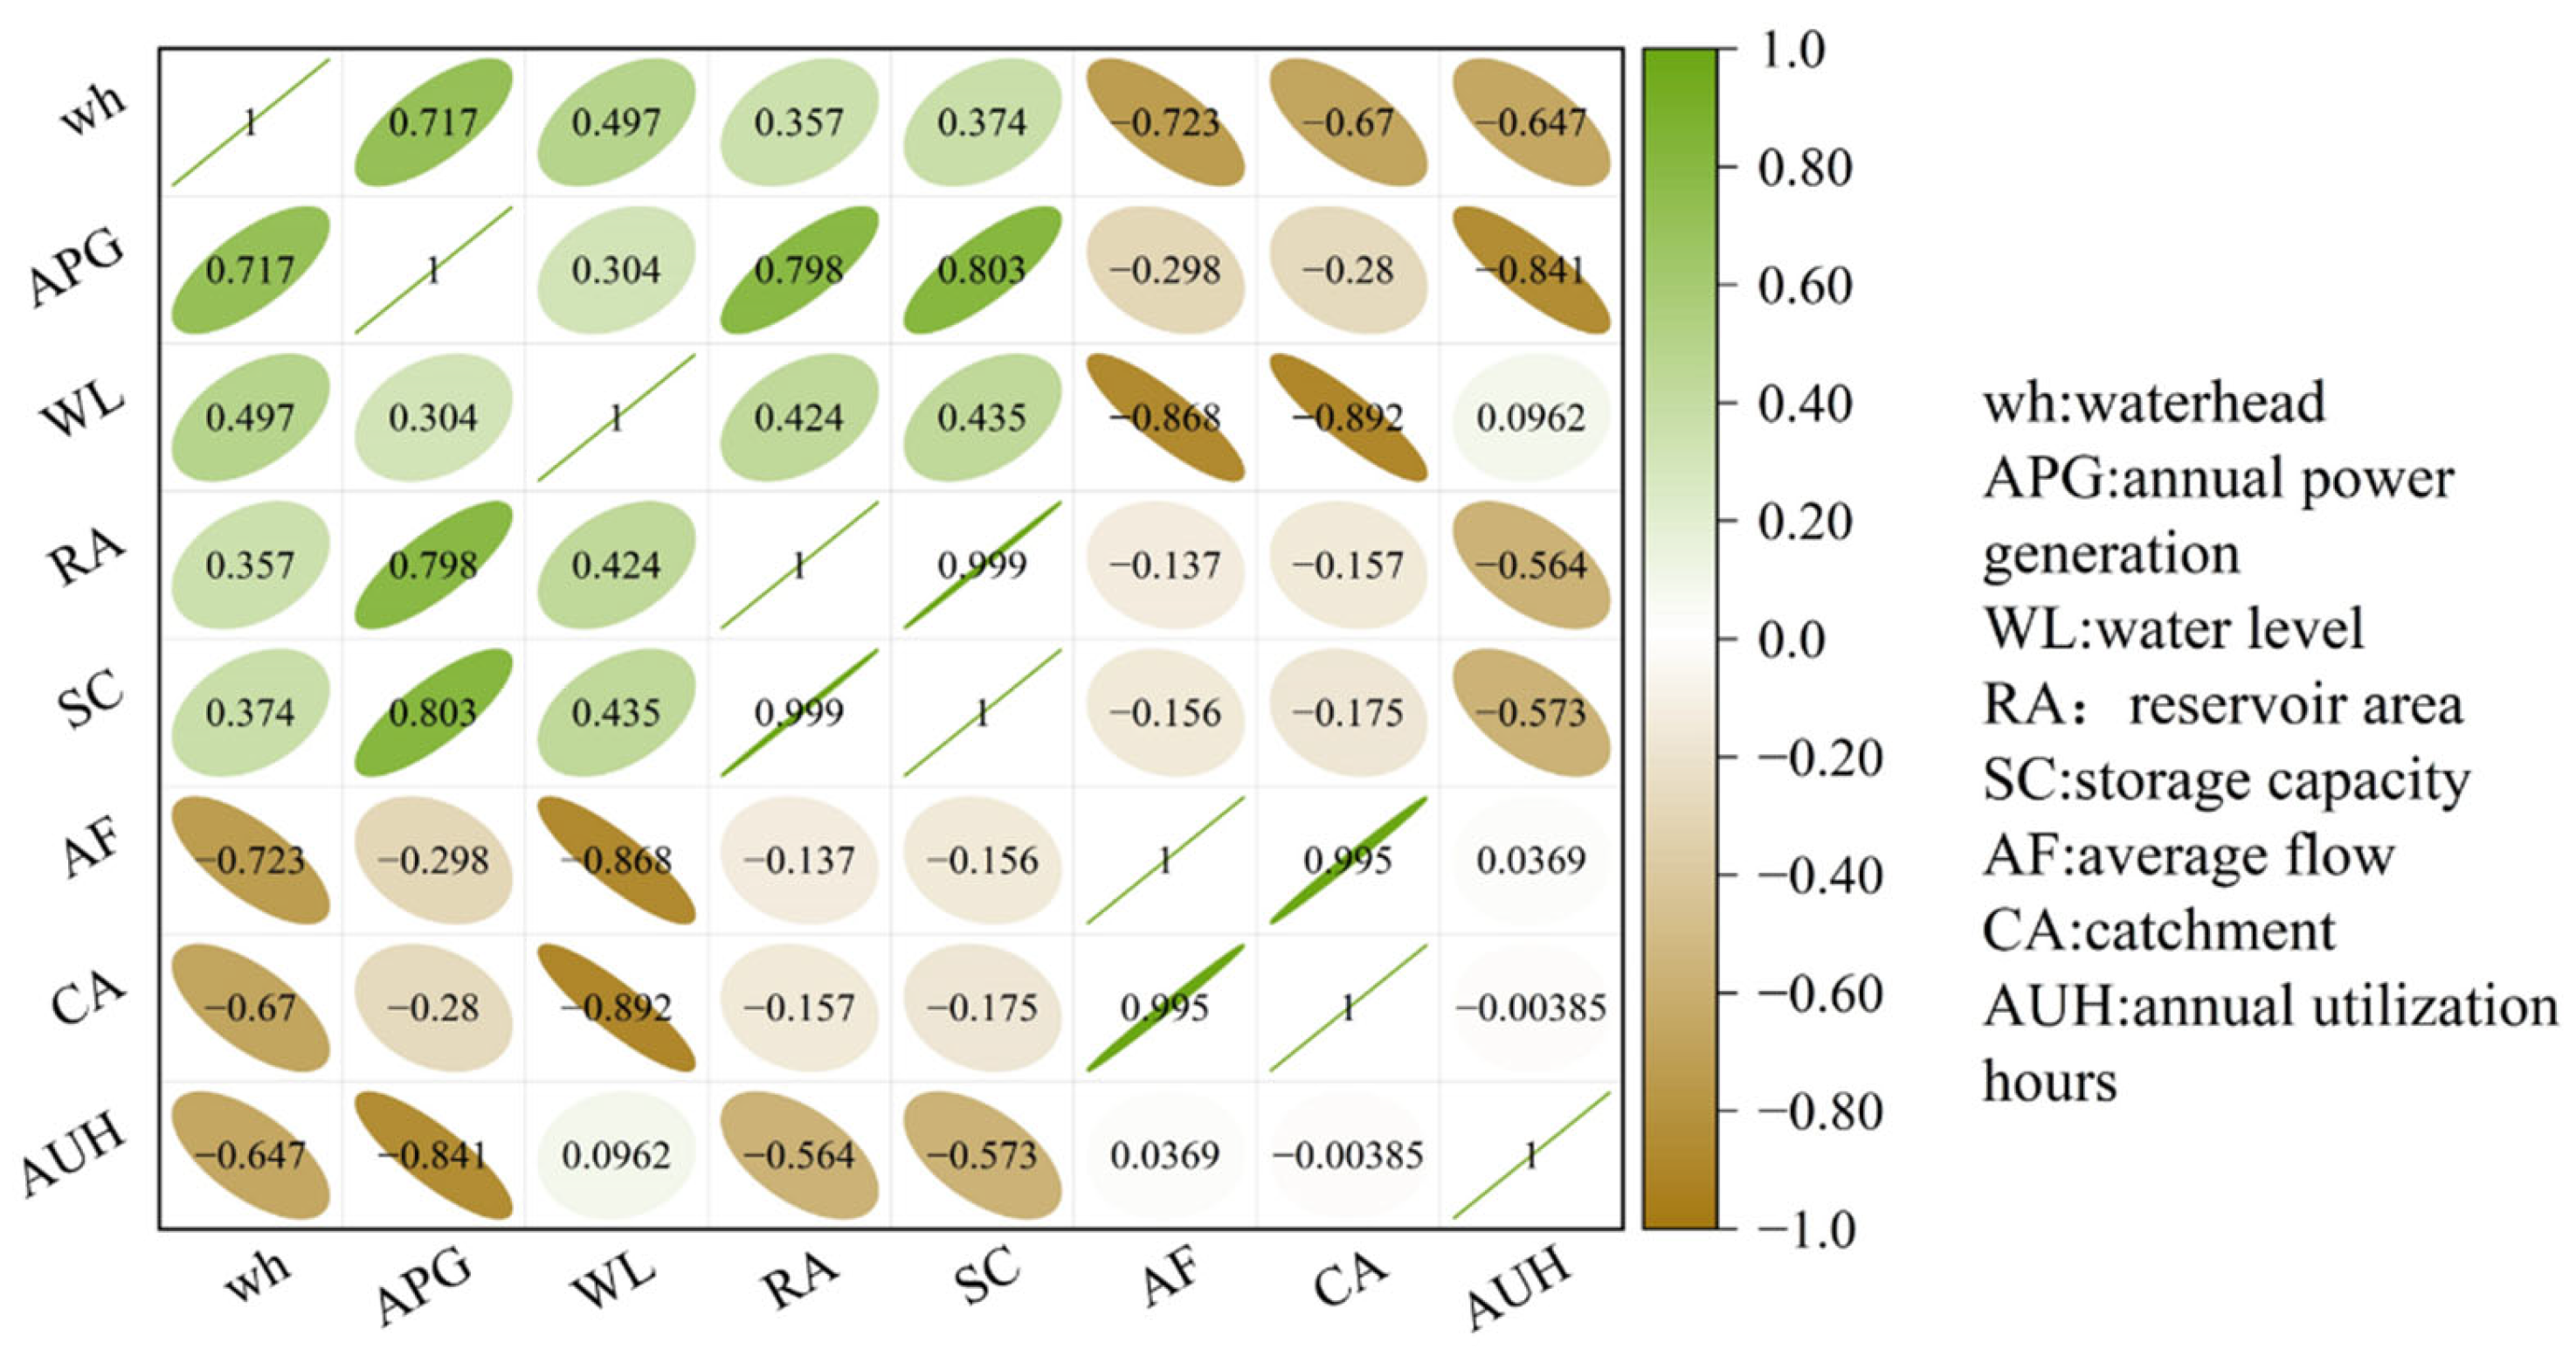
Figure 6, because there is no artificial regulation of the reservoir, this curve is smoother and less accurate, with a correlation coefficient of only about 0.65 in
Figure 8. On the contrary, as shown in the green curve in
Figure 6, this curve is closer to the measured value and more volatile, with a correlation coefficient of about 0.83 in
Figure 8. It is obvious that the NB small hydropower station without hydrological data in this study has a reservoir.


