Article

A Field Experiment Verification of Theoretical Exponent N1 for FAVAD Method in Defining the Relationship of Pressure and Water Losses

1
Hidroing Ltd., Tadije Smičiklasa 1, 31000 Osijek, Croatia
2
Faculty of Civil Engineering and Architecture Osijek, Vladimira Preloga 3, 31000 Osijek, Croatia
*
Author to whom correspondence should be addressed.
Water 2022, 14(13), 2067; https://doi.org/10.3390/w14132067
Submission received: 3 May 2022 / Revised: 23 June 2022 / Accepted: 24 June 2022 / Published: 28 June 2022
(This article belongs to the Special Issue Water Supply Assessment Systems Developing)

Abstract

:
The current problem of managing water losses in water supply systems relies on engineering predictions of expected outcomes based on pressure manipulations using hydraulic models or other computational methods. The objective of this experiment was to conduct a field test to validate the theoretical N1 exponent of the fixed and variable area discharges (FAVAD) method. By knowing the pipe material and measuring the pressure and minimum night flow (MNF), the N1 exponent can be defined and compared to recommendations in the literature. Field measurements and experiments were performed in a small settlement in Croatia consisting of 278 house connections and 7.4 km of PVC material pipe network. Pressure manipulation was performed on a pressure-reducing valve (PRV). The resulting value of N1 = 1.76 from the experiment agrees with the literature graphs, which indicate a value of N1 between 1.5 and 2.0. Considering the difference between the studied values and the theoretically calculated MNF of 4%, it can be concluded that the implementation of the presented methodology to determine the N1 exponent can be used in practice. This type of field testing is important because such tests are difficult to perform due to the extensive pressure manipulations during the tests, which can affect the consumers and cause disturbances in the water distribution.

1. Introduction

The best practices suggest that pressure management is one of the most effective ways to reduce the amount of leakage in a water distribution system [1]. Concepts and models for improved interpretation of data and practical management of leakage in distribution systems have evolved from small beginnings in the mid 1990s. The 1994 fixed and variable area discharges concept (FAVAD) was fully applied to predict reductions in zonal leak flow rates from reductions in pressure [1,2,3]:
L 1 L 0 = ( P 1 P 0 ) N 1
where L1 is leak value after pressure control (l/s), L0 leak value before pressure control (l/s), P1 final pressure (m), P0 starting pressure value (m), and N1 the leakage exponent (-).
Equation (1) is basis for FAVAD calculation method, which is based on the fact that the change in leakage through a pipe crack depends on the value of the pressure in water distribution systems (WDS) [1,4,5].
N1 value can be determined by field measurements during minimum night flow (MNF) period. A number of field studies have shown that N1 typically varies between 0.5 and 2.79, with a median of 1.15 [6]. This means that leakage in water distribution systems is much more sensitive to pressure than conventionally believed (Figure 1).
Research on the effects of leaks in the systems conducted by Greyvenstain and van Zyl [8] indicate that the leakage exponent depends on the geometry of the crack in the pipe. Table 1 shows that the corroded parts in metal pipes have the highest values of the exponent N1 and that in plastic pipes, N1 generates different values largely depending on the crack geometry [9].
Analyzing publications in recent years, it is clear that that there have been significant improvements in understanding how pressure and leakage correlate one to each other [10]. Although much analysis has been conducted on this subject, there are not many on site experiments working with real WDS and real on site pressure management. Some researchers used measured data for computation [11] and application of the scientific hydraulic leakage analysis methods for data interpretation [12,13,14] or data from water companies such as pump data, pipe burst type, or burst frequency data [8].
Understanding the relationship between pressure and leakage should be based on the results of theoretical, numerical, experimental, and field studies. Prediction of behavior for one real WDS could be modeled and therefore optimized for best-case operation [15,16,17,18,19]. Leakage modeling is one way of predicting pressure/leak dependence and is therefore an approachable way for simulating results for better decision making [20,21].
This paper introduces unique approach in conducting site experiment by real pressure management in WDS. This type of field testing is important, as those tests are hard to conduct due to pressure manipulation during tests, which affects consumers and can lead to disturbance in water distribution. Extensive preparation needs to be undertaken, including hydraulic model simulation of test and checking the condition of the installed equipment, which has been pointed out by other researchers also [22]. The main goal of this paper is to give practical methodology in testing theoretical N1 exponent for specific water pipe material, in this case PVC material. The calculated N1 exponent in this paper, after conducting the field experiment in real WDS, results in N1 = 1.76.
In comparison with other researches on this topic, we can see, for example, results of a pressure–leakage relationship analysis conducted on several pressure management zones in the KwaDabeka Township in KwaZulu-Natal, South Africa, from which is, most significantly for this paper, PMZ DV3197, which calculated N1 was 1.2 with 100% plastic pipes [23]. Plastic pipes seems to be more sensitive in comparison to other viscoelastic materials [24]. Comparing results to values in Table 1, leakage exponents for round holes were close to 0.5, for longitudinal cracks between 0.79 and 1.85, and for circumferential cracks between 0.41 and 0.52 [8]. Other researchers defined the recommended N1 range for PVC pipe material as 0.5 to 1.5 [25].
The innovative approach presented in this article provides a methodology for manipulating the real pressure in the water supply system and determining the real N1 exponent from field measurements compared to theoretical experiments [8,25,26]. Other researchers referenced in this paper who calculated N1 from real measurements [4,23,27] used the MNF difference to calculate N1. The MNF difference depends on field work, including pipeline repair and water loss reduction, which are costly and take time. Some researchers used existing night pressure reduction to calculate N1, which can be considered as more approachable method [28]. In comparison, the field experiment presented in this paper introduces a method to reduce MNF and create a pressure differential by reducing the actual pressure at the pressure reducing valve, which is a less-expensive method to calculate N1 and does not depend on pressure management conducted by water supply company. The calculated N1 value can later be used to make decisions and optimize investments in pipe repairs, water loss programs, etc.

2. Materials and Methods

Flowchart (Figure 2) presents experiment methodology explained in following chapters.

2.1. Study Area

For this experiment, a step-by-step pressure-reduction methodology on a pressure-reducing valve (PRV) was selected with flow measurement at one location and pressure measurement at two locations.
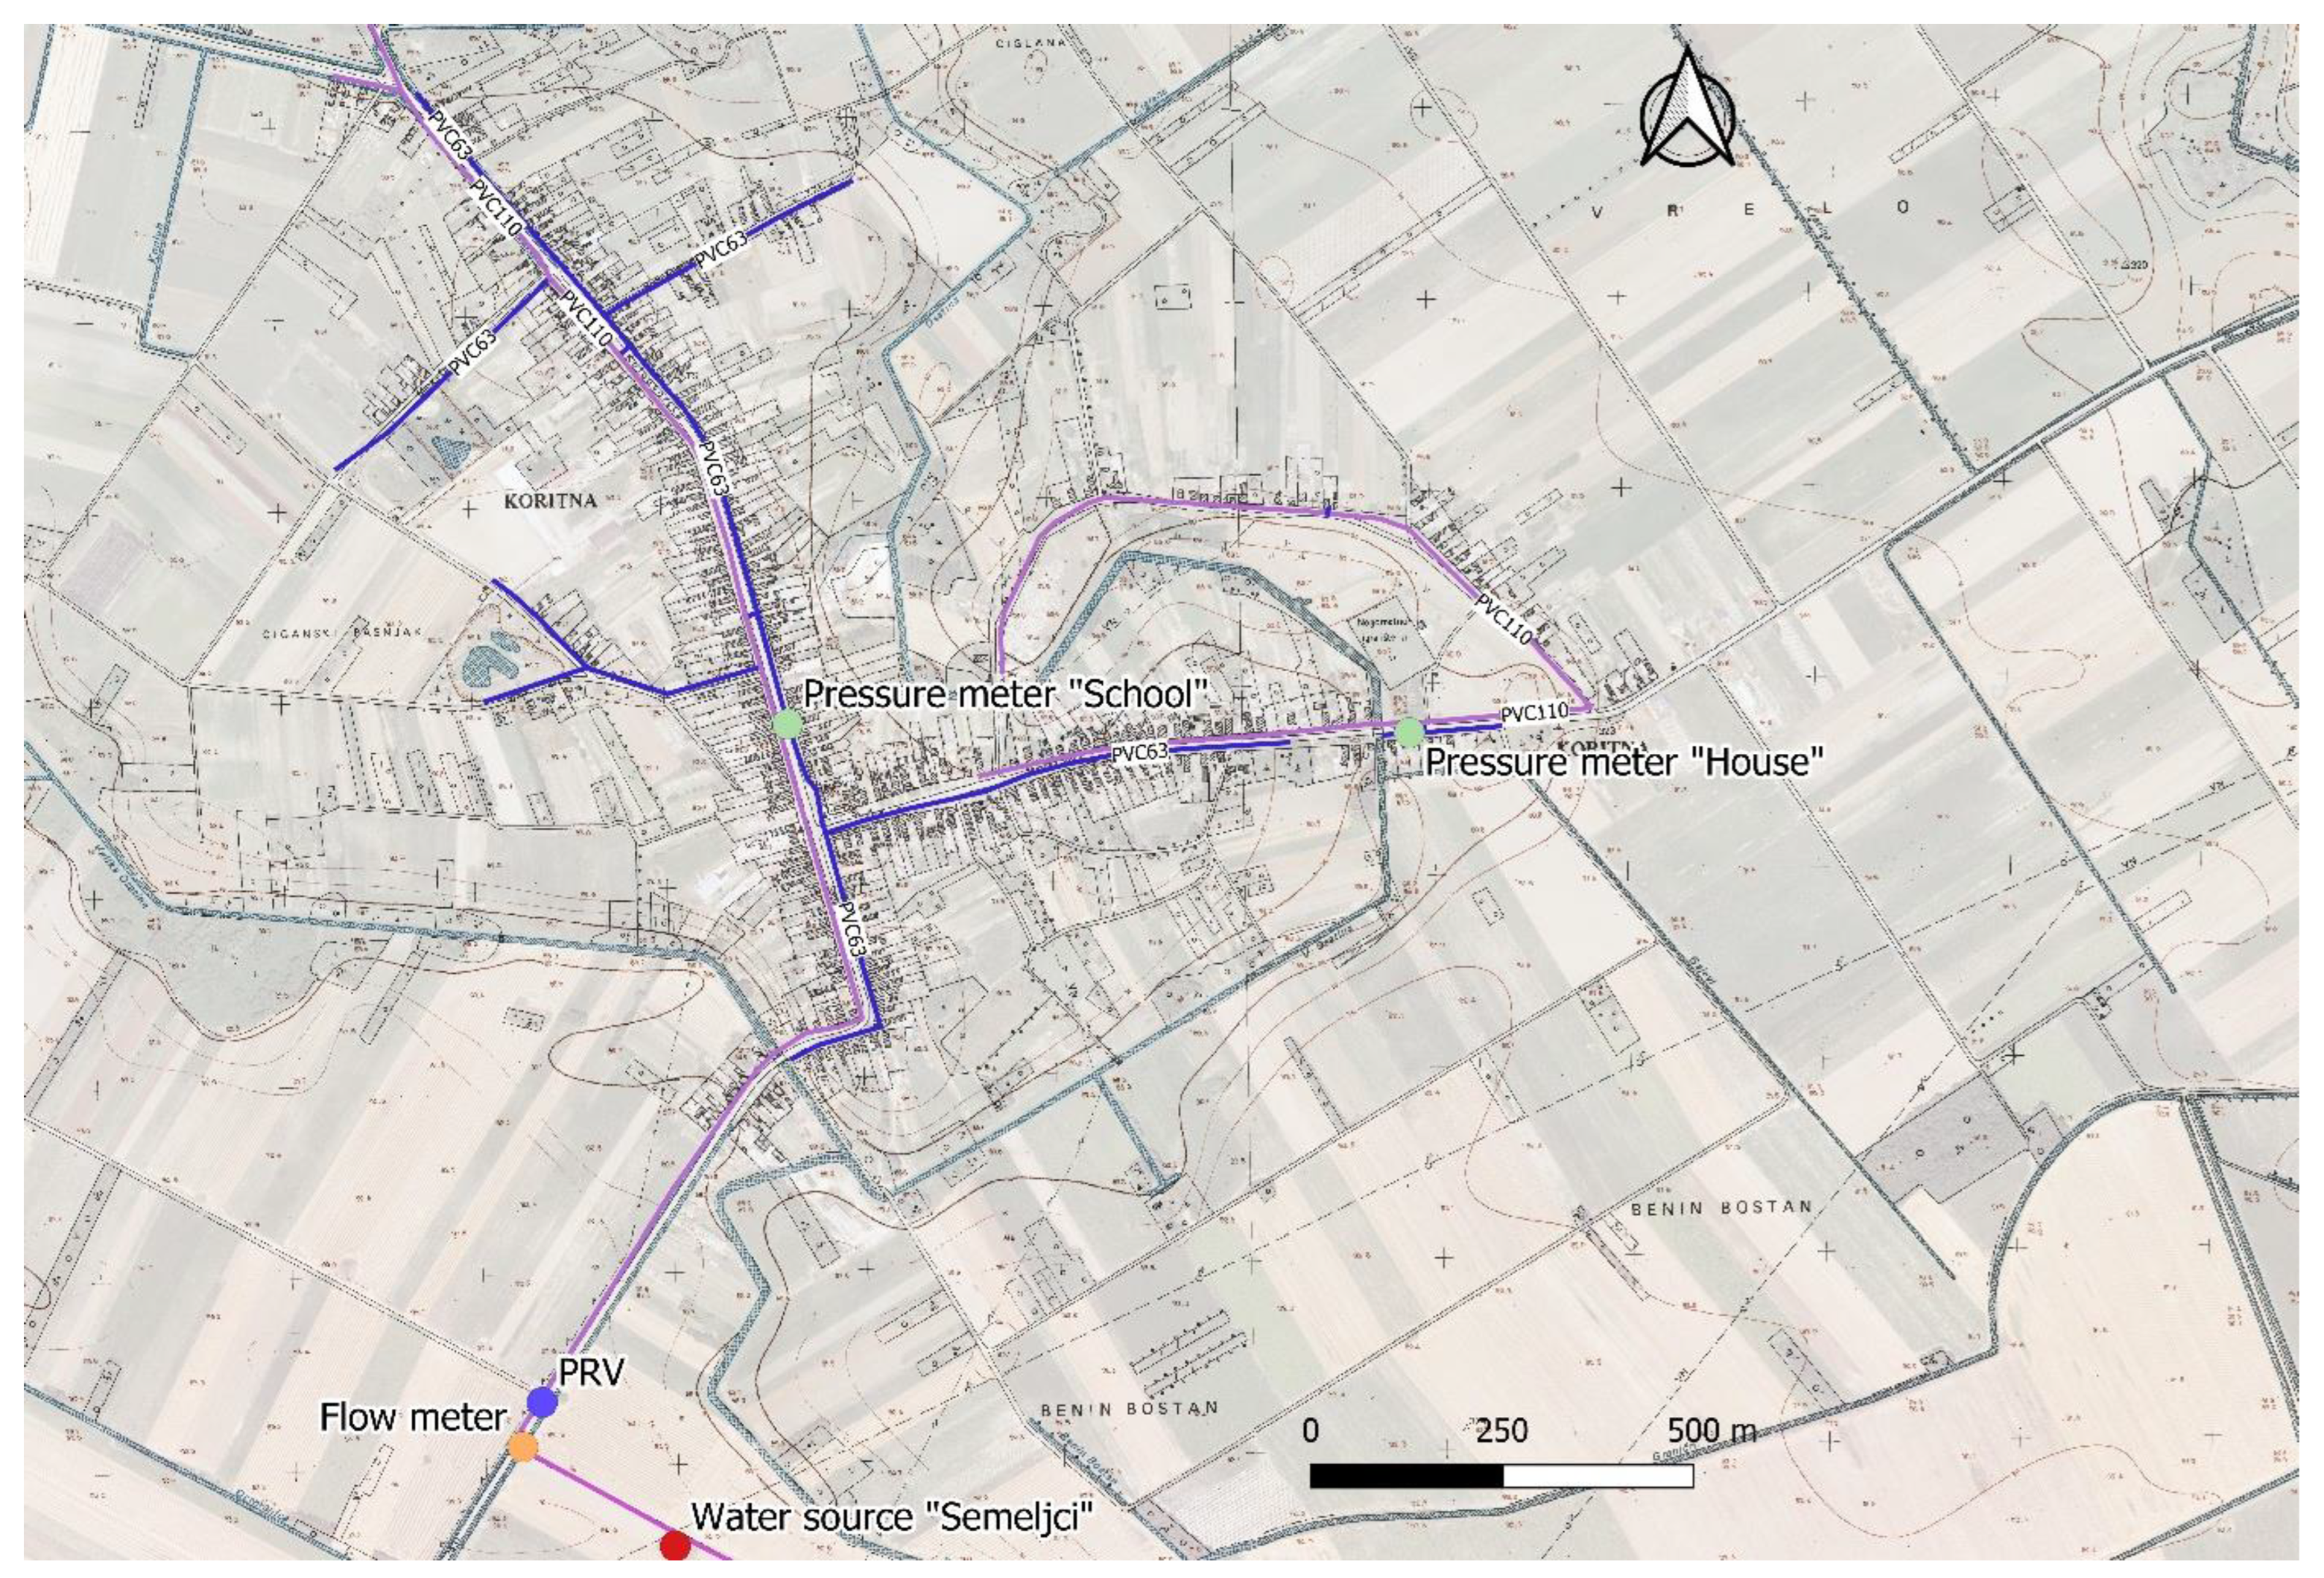
Field measurements and experiment were conducted in small settlement in Croatia (Figure 3) consisting of 278 service connections and 7.4 km of PVC material pipe network. The water network was built during the years 1980–1985.
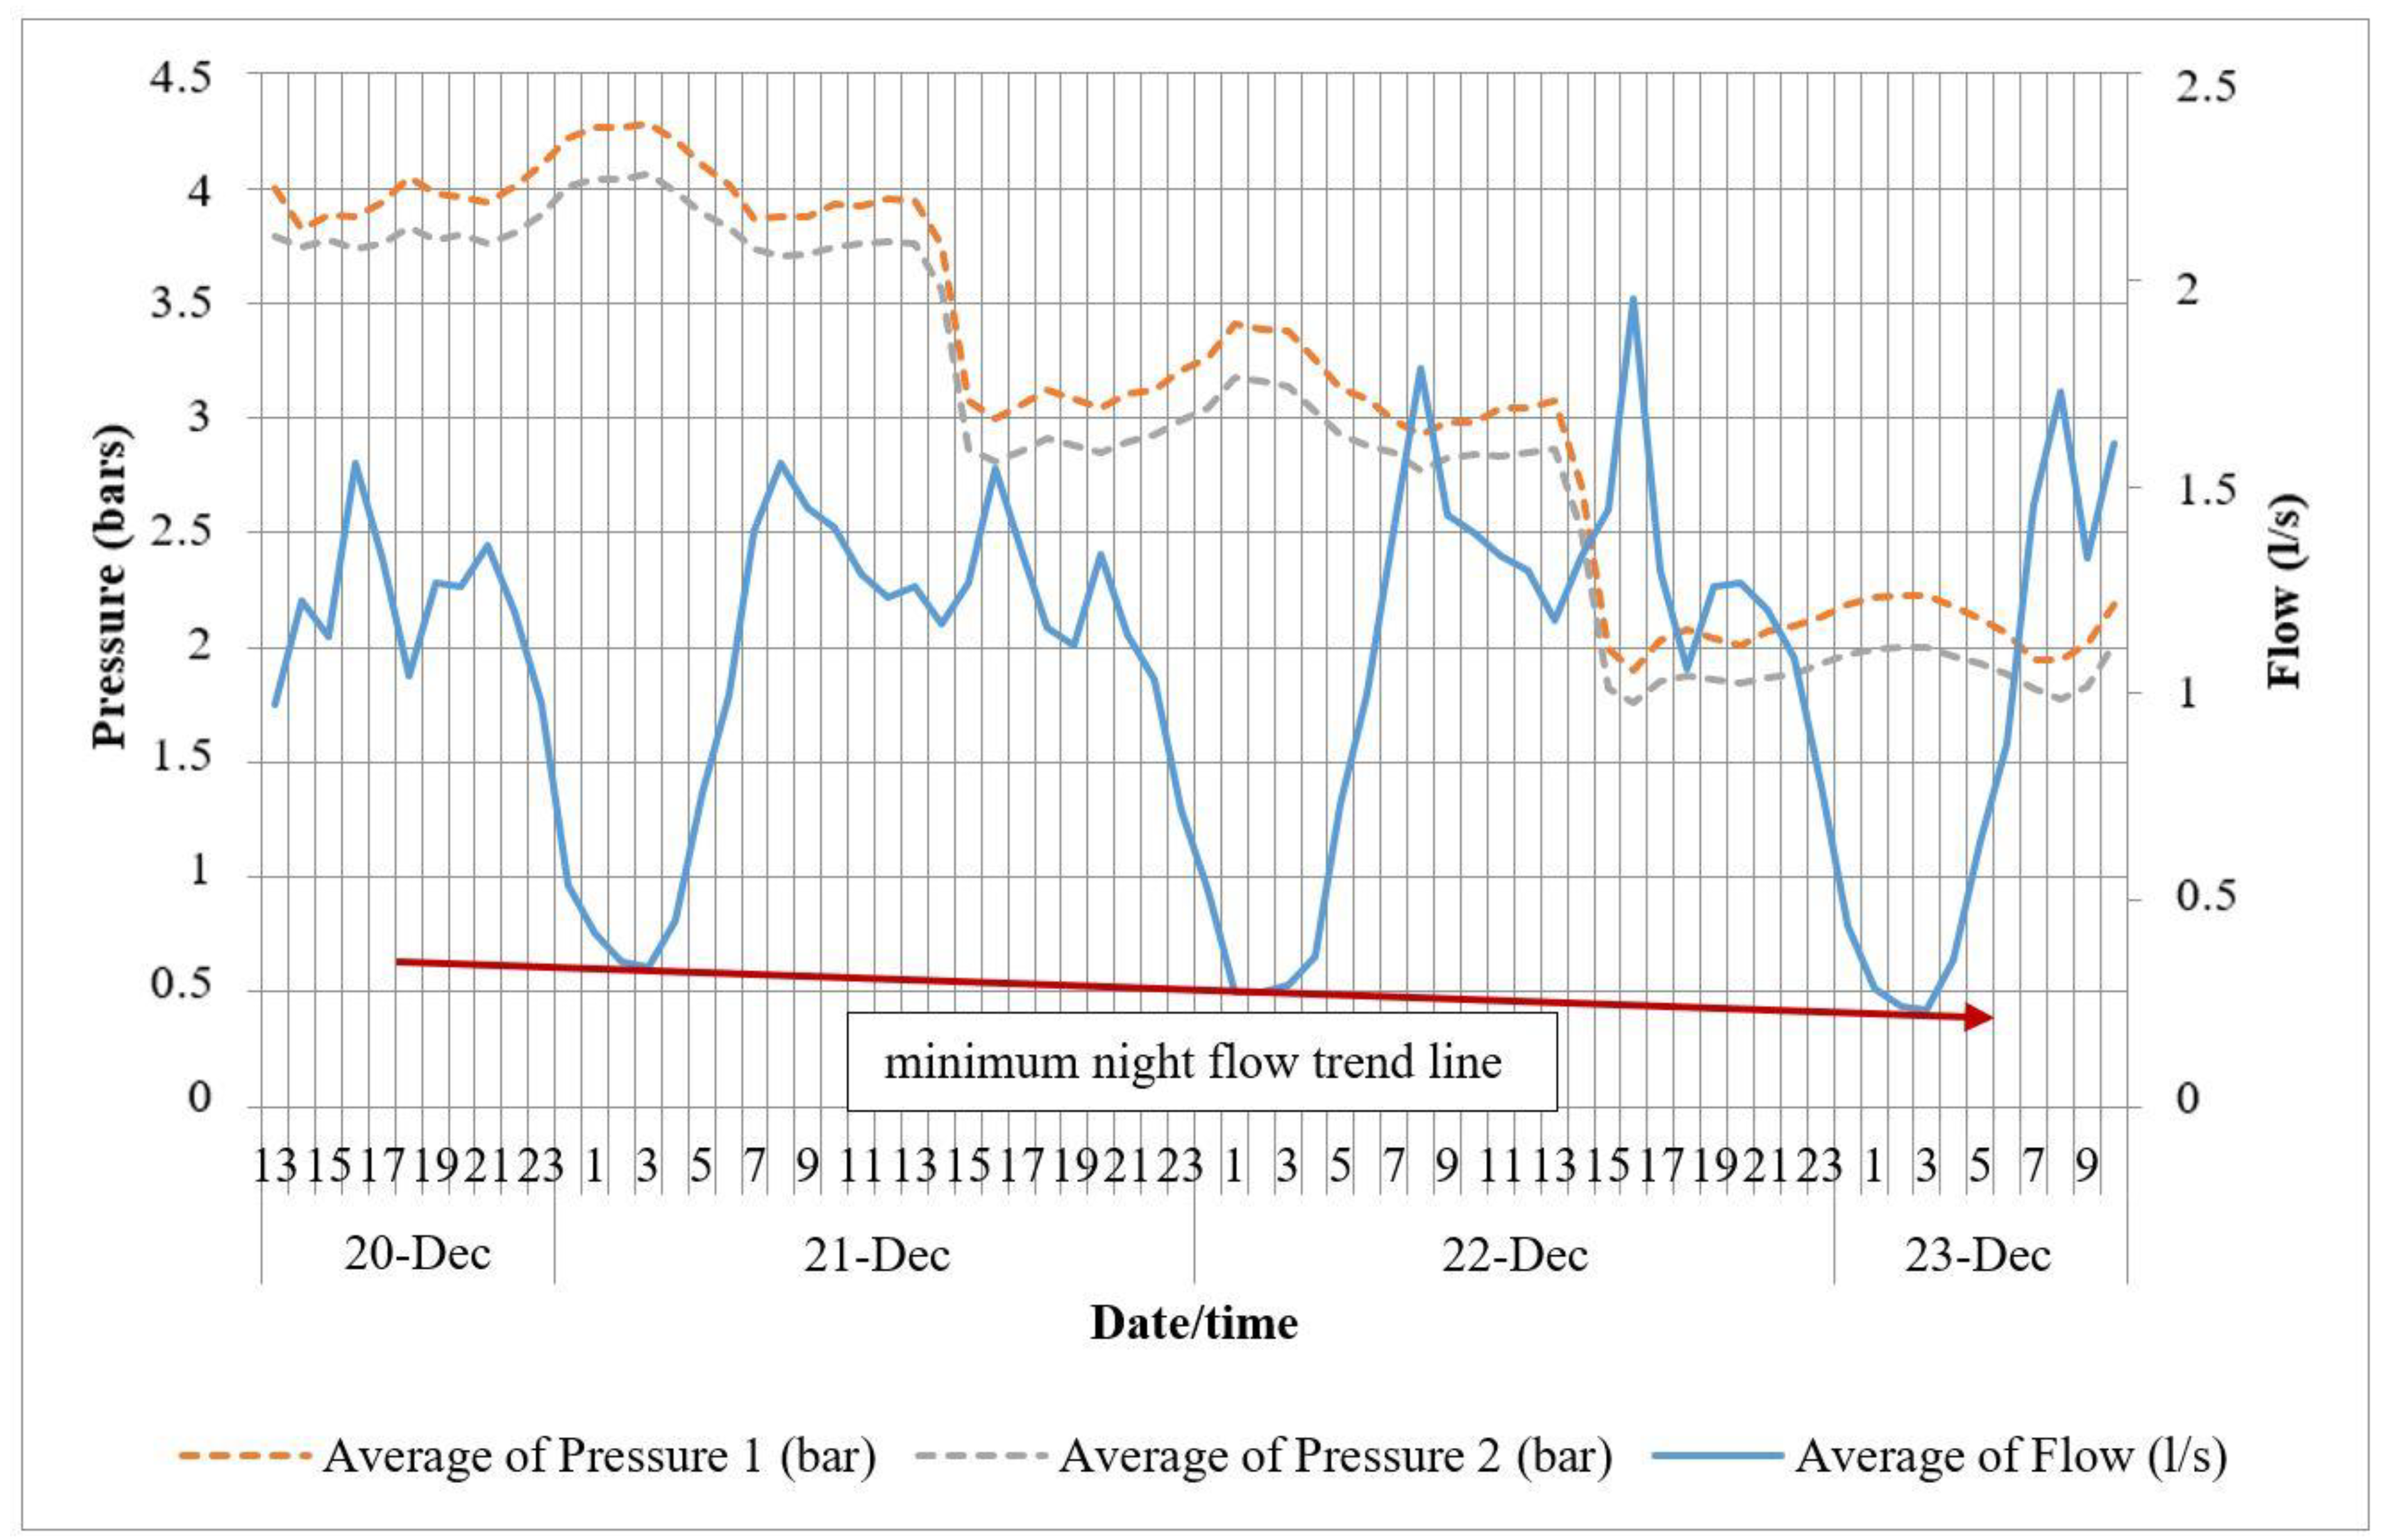
Flow and pressure measurements were conducted for three consecutive days. Flow measurements were carried out at the location of the outlet pipeline from the water pumping station, while pressure measurements were carried out at the location of the primary school (Pressure 1) and the private residential building (Pressure 2). All flow and pressure measurements were performed at 1 min time intervals. Flow measurement was performed by installing a portable ultrasonic flow meter SebaKMT UDM 200. For the purpose of measuring the pressure, two types of devices were used: Cello and Metrolog. Both devices have a built-in pressure measuring sensor and are connected to the water supply system directly via a flexible pipe.
The purpose of the field measurements was to check the change in MNF based on the pressure change. The pilot-operated-type PRV is located in a concrete shaft downstream of the flow meter.

2.2. Measurements

The initial setting of the PRV is 4.0 bar at the outlet regardless of the inlet pressure. For the purposes of this analysis, the pressure was manually reduced at the outlet according to the schedule in increments of 1.0 bar for two consecutive days (Table 2):
Pressure and flow measurements were used for detailed analysis of minimum night flow (MNF) and pressure relation. Figure 4 shows measured data and MNF trend line with decreasing values, which will be used for real N1 exponent calculation.

2.3. Formulas and Calculation Methods

2.3.1. Mean Pressure

The mean pressure is calculated according to the principle of the proportion of pressures of each pipeline. In this way, the mean pressure does not depend on the number of points but on the length of the pipeline, with the corresponding inlet and outlet pressure. The calculation is done using the MS Excel program according to the Equation (2):
Δ P h = n = 1 i ( P 1 n + P 2 n 2 ) × L n n = 1 i L n
where Ph is hourly average pressure (bar), pipe ordinal number, P1 inlet pressure (bar), P2 outlet pressure (bar), and L pipe length (m).

2.3.2. N1 Exponent

The calculation of the N1 exponent was performed by adaptation of Equation (1):
N 1 = log P 1 P 0 L 1 L 0
The N1 coefficient can also be calculated according to the value of the Infrastructure
Leakage Index (ILI). According to [29], ILI is defined as the ratio of the “current annual real losses” (CARL) to the “unavoidable annual real losses” (UARL).
Two Equations (4) and (5) are used for this purpose [30]:
Small background leaks → N1 = 1.5 − (1 − 0.65/ILI) × p/100
Large background leaks → N1 = 1.5 − (1 − 0.667 × ICF/ILI) × p/100
where p is the proportion of recognizable failures on rigid pipes (%), ICF Infrastructure Condition Factor—ratio of actual background leaks and unavoidable annual real losses (UARL), and ILI Infrastructure Leakage Index.

3. Results and Discussion

3.1. Water Loss Calculation for Measured Dates

Residential night consumption (RNC) was estimated based on number of connection and number of household population [31] (Table 3). Some researches consider different approaches to estimate RNC [32,33].

3.2. Calculations of Mean System Pressure

Since the change in the outlet pressure value was performed every day around 15:00, there are no flow and pressure values during one whole day with the same outlet pressure. Therefore, the mean pressures will be calculated according to the actual values for each measured day based on the mean flow over the period of the same outlet pressure.
Implementing Equation (2), the mean pressures for the system were calculated using a reference average daily flow over the period of the same outlet pressure (Table 4):
Based on the calculated mean pressures and the values of actual losses, the calculation of the N1 exponent of the FAVAD method was performed.

3.3. Calculation of N1 Exponent for FAVAD Method

The task of this research was to experimentally define the N1 exponent on the subject system. Since the pipe material on the subject network is entirely PVC, this paper can also serve as a reference in future analyses of systems with built-in PVC pipes. The calculation of the N1 exponent was performed using Equation (3).
Table 5 below shows the results obtained for the subject system.
According to the instructions in the literature and using Equations (4) and (5), if only PCV pipes are on the system, the factor p = 0%, which in both equations gives the value N1 = 1.5.
Checking the value of the N1 exponent on the graph (Figure 1) shows the value of N1 between 1.5 and 2.0, which corresponds to the value from the experiment.

3.4. Hydraulic Model of Subject WDS

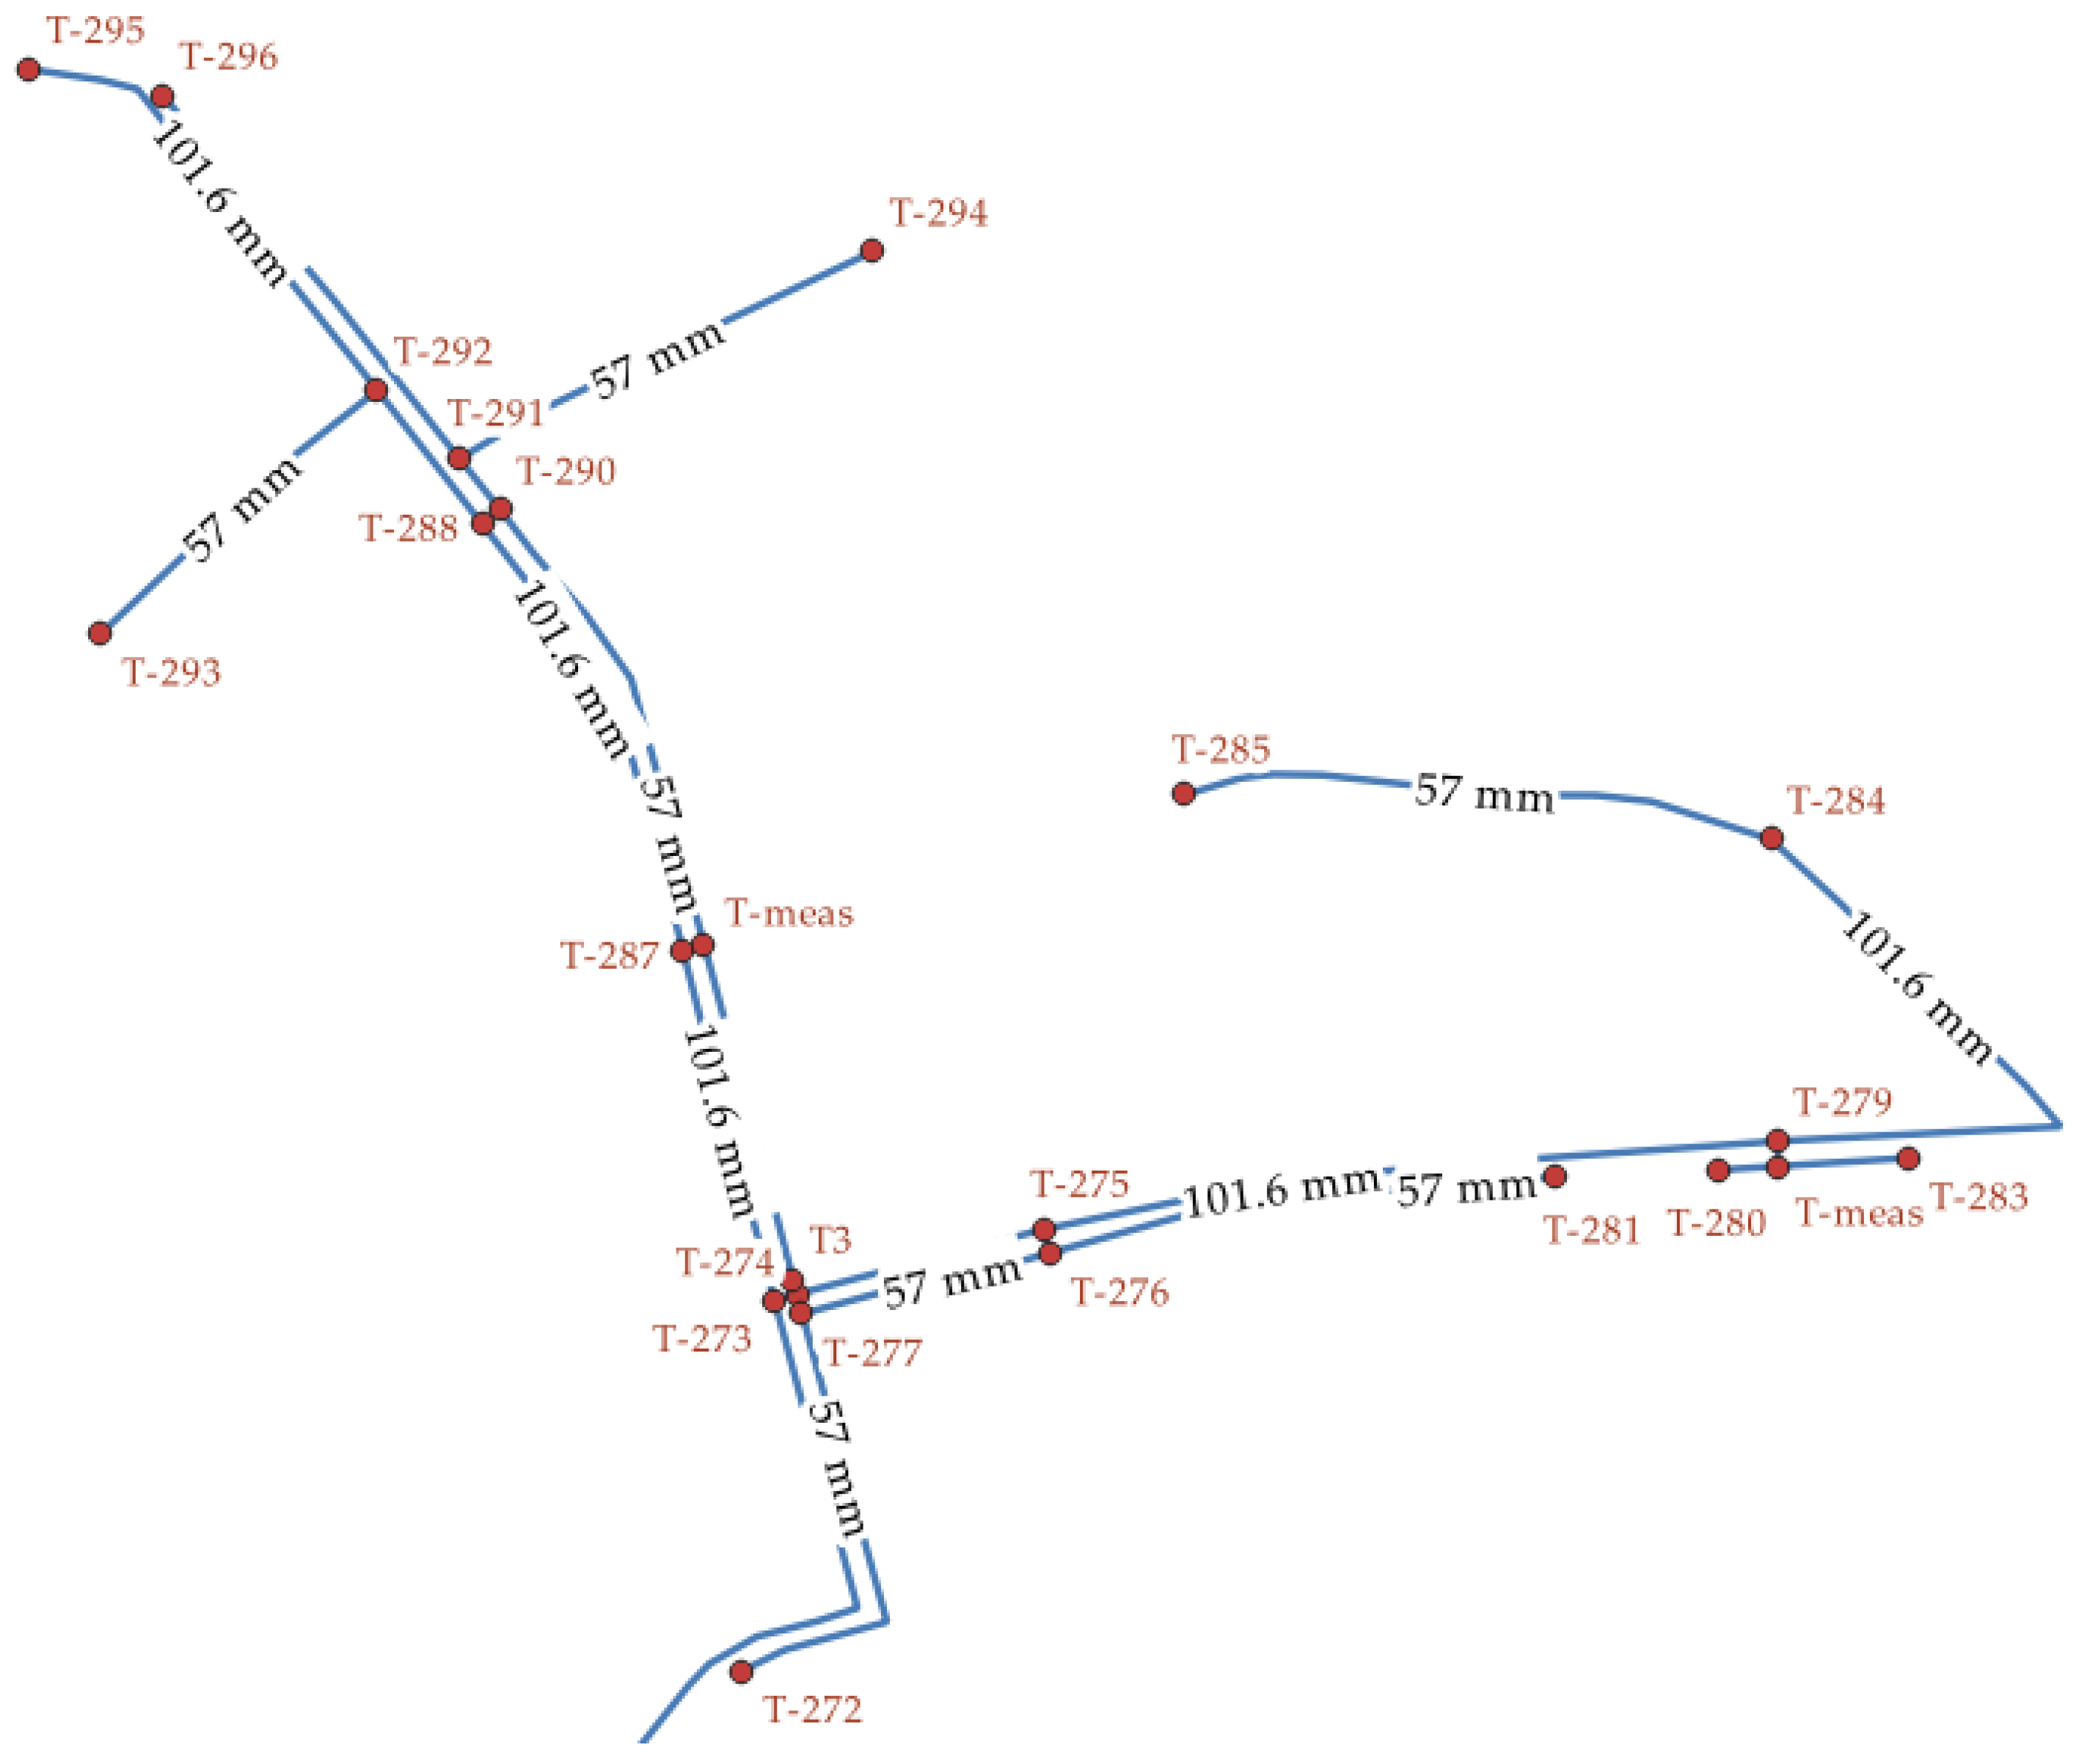
Confirmation of the accuracy of the applied method is visible in the resulting values of MNF calculated in hydraulic model. Daily consumption is not a quality indicator because the value of hourly coefficients from the first measured day were used for all days. Figure 5 shows WDS nodes and pipe structure with inner pipe diameter.
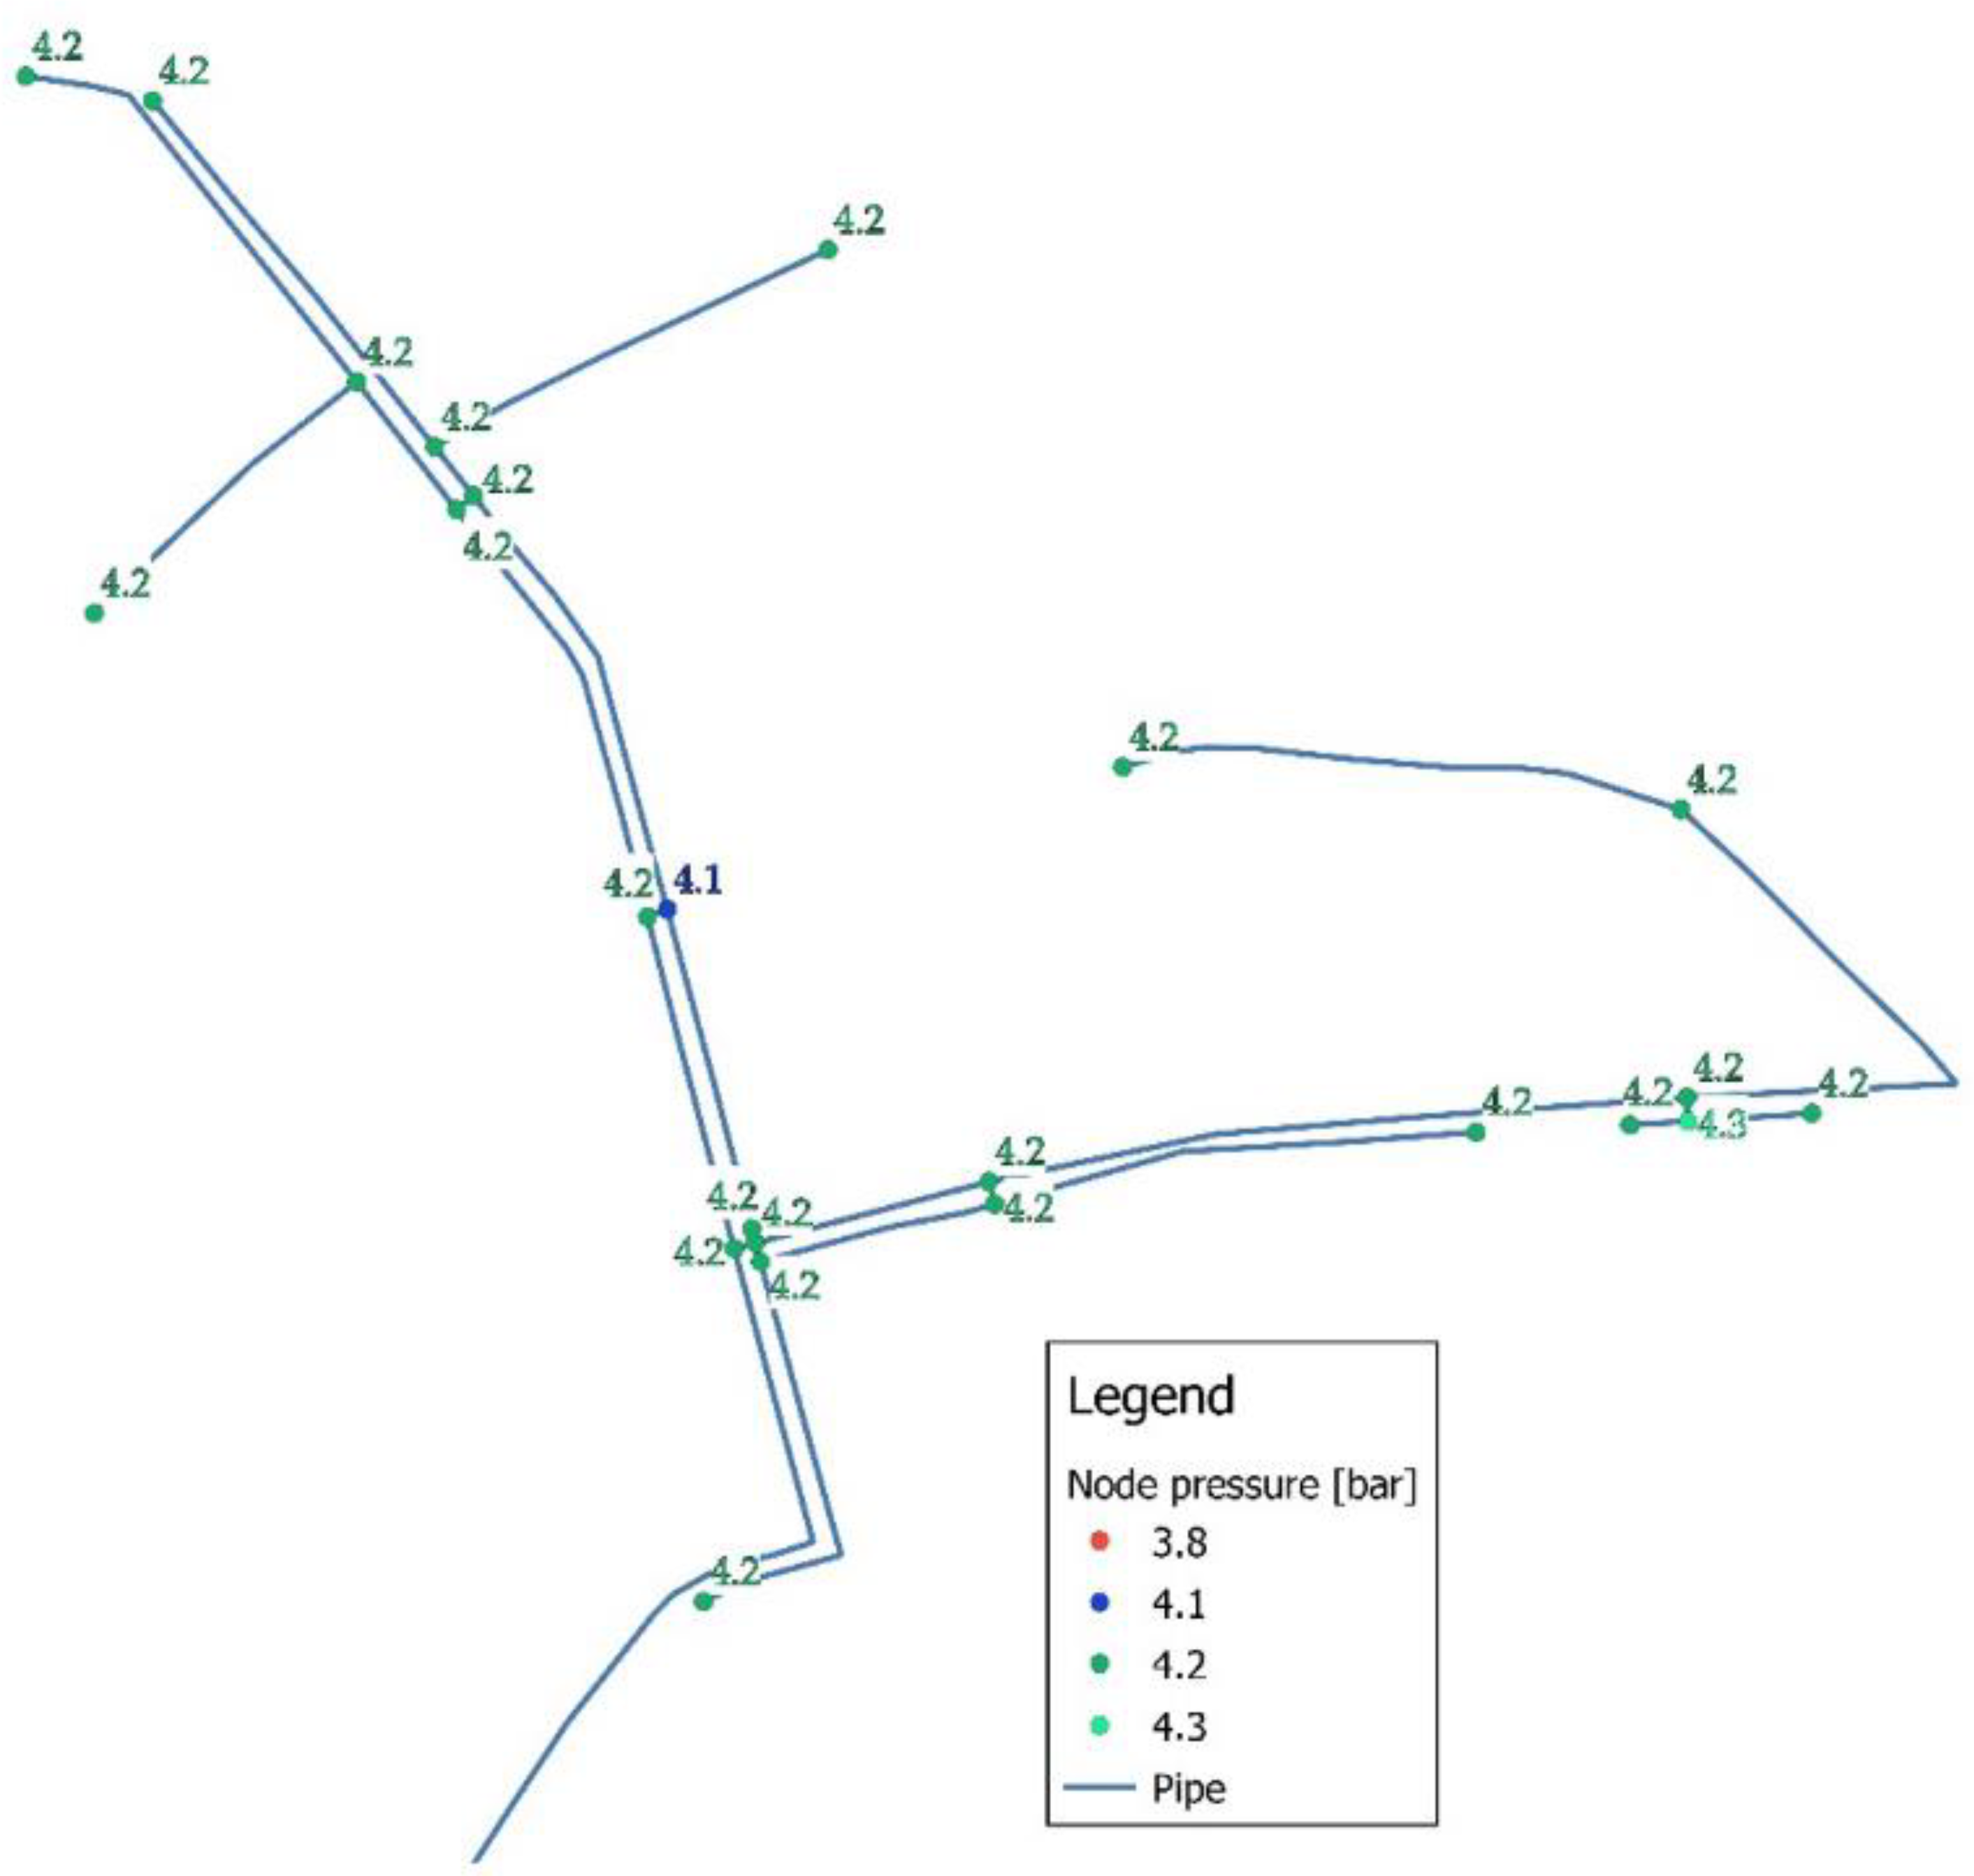
Hydraulic model analysis was conducted for all PRV output pressure settings (Table 2). Figure 6 shows maximal calculated pressures, while the graph (Figure 7) shows resulting flows with trend line.
The calculated MNF using the hydraulic model for subject WDS shows significant matches with average difference in MNF of 0.01 l/s or 4% compared to measured data.
The FAVAD leakage model accounts more accurately for the behavior of leaks in practice [10], and using the hydraulic model tool for MNF identification in WDS proves that the approach is effective in calculating pressure/leakage relationship in real networks, but the results depend on the quality of the observed data, as confirmed in this paper [34], with several practical approaches available besides the one presented in this paper [35].

3.5. Result Comparison

The field experiment was conducted in KwaDabeka township in KwaZulu-Natal, South Africa, from which the most significant location for this paper is PMZ DV3197, where the calculated N1 was 1.2 with 100% plastic pipes [16] compared to N1 = 1.76 in this paper for PVC pipes. Minimum night flow (MNF) for this paper was 0.1–0.3 l/s, while KwaDabeka PMZ DV3197 MNF was 0.4–0.9 l/s. Both results are comparable to theoretical N1 margin, as it depends on type of pipe cracks (Table 1).
Comparing the obtained result of N1 = 1.76 for PVC pipes in the conducted experiment to theoretical ones, there are several different theoretical approaches and results (Table 6):

4. Conclusions

The aim of this experiment was to establish a field validation methodology for the theoretical N1 exponent of the FAVAD method. By knowing the pipe material and measuring the minimum night flow (MNF) and the pressure in the system, the N1 exponent can be defined and compared with the literature recommendations given in this paper. Field experiment was conducted in real WDS constructed of PVC water pipes, which enabled precise comparison between measured and theoretical N1 exponent. To be able to conduct this experiment, extensive pressure management was implemented by manipulating real PRV. By changing output pressure values, changes in MNF were expected.
For better understanding of WDS network behavior during pressure management, a detailed and calibrated hydraulic model was designed. Comparing results of MNF after pressure management in the hydraulic model to the ones measured on site, a 4% difference was noticed, which can lead to the conclusion that the N1 exponent validation methodology shown in this paper is valid and can be used for further researches.
In comparison to other authors, the field experiment for determination of N1 in this experiment and also in experiments of other researchers are both comparable to theoretical N1 margin. The obtained result of N1 = 1.76 for PVC pipes in the conducted experiment compared to theoretical ones falls in expected range (Table 6).
Finally, pressure management shows significant results in leakage or real losses reduction, as is confirmed in this research. Implementing pressure management areas (PMA) and pressure management zones (PMZ) with measuring flow and pressure, including real losses calculation for district metering areas (DMA), is confirmed to be an affordable first step in leakage control. The methodology from this paper can be used to predict many consequences regarding real water supply network operation: maintenance operations where the field engineer could use this methodology to provide better understanding of network behavior during branch closures for maintenance works; equipment optimization regarding PRV and pumping stations; and water quality maintenance, for example, pressure drop during pipe flushing. Decision makers could use pressure/water loss correlation principles to determine and optimize investment priorities with quantified values of leak reduction due to pressure manipulation and also prediction of pressure dependent demands during pressure optimization.

Author Contributions

Conceptualization, I.D. and L.T.; methodology, I.D.; software, I.D.; validation, I.D. and L.T.; formal analysis, L.T.; investigation, I.D.; resources, I.D.; data curation, I.D.; writing—original draft preparation, I.D.; writing—review and editing, I.D. and L.T.; visualization, I.D.; supervision, L.T. All authors have read and agreed to the published version of the manuscript.

Funding

This research received no external funding.

Institutional Review Board Statement

Not applicable.

Informed Consent Statement

Not applicable.

Conflicts of Interest

The authors declare no conflict of interest.

References

  1. Lambert, A.O.; Thornton, J. The Relationships between Pressure and Bursts—A ‘State-of-the-Art’ Update. IWA Water 2011, 21, 37–38. [Google Scholar]
  2. Thornton, J. Managing Leakage by Managing Pressure. Water 2003, 21, 43–44. [Google Scholar]
  3. Samir, N.; Kansoh, R.; Elbarki, W.; Fleifle, A. Pressure Control for Minimizing Leakage in Water Distribution Systems. Alex. Eng. J. 2017, 56, 601–612. [Google Scholar] [CrossRef]
  4. Lambert, A.O.; Fantozzi, M.; Shepherd, M. Pressure: Leak Flow Rates Using FAVAD: An Improved Fast-Track Practitioner’s Approach. CCWI 2017-15th Int. Conf. Comput. Control Water Ind. 2017. [Google Scholar] [CrossRef]
  5. May, J. Pressure Dependent Leakage. World Water Environ. Eng. 1994, 17. [Google Scholar]
  6. Van Zyl, J.E.; Clayton, C.R.I. The Effect of Pressure on Leakage in Water Distribution Systems. Proc. Inst. Civ. Eng. Water Manag. 2007, 160, 109–114. [Google Scholar] [CrossRef]
  7. Lambert, A.O. International Report: Water losses management and techniques. Water Supply 2002, 2, 1–20. [Google Scholar] [CrossRef] [Green Version]
  8. Greyvenstein, B.; Van Zyl, J.E. An Experimental Investigation into the Pressure-Leakage Relationship of Some Failed Water Pipes. J. Water Supply Res. Technol.-AQUA 2007, 56, 117–124. [Google Scholar] [CrossRef]
  9. Fuchs-Hanusch, D.; Steffelbauer, D.; Günther, M.; Muschalla, D. Systematic Material and Crack Type Specific Pipe Burst Outflow Simulations by Means of EPANET2. Urban Water J. 2016, 13, 108–118. [Google Scholar] [CrossRef]
  10. Piller, O.; Van Zyl, J.E. Incorporating the FAVAD Leakage Equation into Water Distribution System Analysis. Procedia Eng. 2014, 89, 613–617. [Google Scholar] [CrossRef]
  11. Sebbagh, K.; Safri, A.; Zabot, M. Pre-Localization Approach of Leaks on a Water Distribution Network by Optimization of the Hydraulic Model Using an Evolutionary Algorithm. In Proceedings of the 3rd EWaS International Conference on “Insights on the Water-Energy-Food Nexus”, Lefkada Island, Greece, 27–30 June 2018; p. 588. [Google Scholar]
  12. Mathye, R.P.; Scholz, M.; Nyende-Byakika, S. Optimal Pressure Management in Water Distribution Systems: Efficiency Indexes for Volumetric Cost Performance, Consumption and Linear Leakage Measurements. Water 2022, 14, 805. [Google Scholar] [CrossRef]
  13. Taghlabi, F.; Sour, L.; Agoumi, A. Prelocalization and Leak Detection in Drinking Water Distribution Networks Using Modeling-Based Algorithms: A Case Study for the City of Casablanca (Morocco). Drink. Water Eng. Sci 2020, 13, 29–41. [Google Scholar] [CrossRef]
  14. Cassa, A.M.; Van Zyl, J.E. Predicting the Leakage Exponents of Elastically Deforming Cracks in Pipes. Procedia Eng. 2014, 70, 302–310. [Google Scholar] [CrossRef] [Green Version]
  15. Price, E.; Ostfeld, A. Battle of Background Leakage Assessment for Water Networks Using Successive Linear Programing. Procedia Eng. 2014, 89, 45–52. [Google Scholar] [CrossRef] [Green Version]
  16. Boian, R.F.; Macedo, D.O.; de Oliveira, P.J.A.; Janzen, J.G. Comparison between FAVAD and General Equations to Evaluate the Leakage Lost Flow in Urban Water Distribution Systems. Eng. Sanit. Ambient. 2019, 24, 1073–1080. [Google Scholar] [CrossRef] [Green Version]
  17. van Zyl, J.E.; Lambert, A.O.; Collins, R. Realistic Modeling of Leakage and Intrusion Flows through Leak Openings in Pipes. J. Hydraul. Eng. 2017, 143, 04017030. [Google Scholar] [CrossRef]
  18. Van Zyl, J.E. Theoretical Modeling of Pressure and Leakage in Water Distribution Systems. Procedia Eng. 2014, 89, 273–277. [Google Scholar] [CrossRef] [Green Version]
  19. Fox, S.; Collins, R.; Boxall, J. Traditional Leakage Models for Leakage Modelling: Effective or Not? Procedia Eng. 2015, 119, 35–42. [Google Scholar] [CrossRef] [Green Version]
  20. Muranho, J.; Ferreira, A.; Sousa, J.; Gomes, A.; Sá Marques, A. Pressure-Dependent Demand and Leakage Modelling with an EPANET Extension-WaterNetGen. Procedia Eng. 2014, 89, 632–639. [Google Scholar] [CrossRef] [Green Version]
  21. Schwaller, J.; Van Zyl, J.E.; Kabaasha, A.M. Characterising the Pressure-Leakage Response of Pipe Networks Using the FAVAD Equation. Water Sci. Technol. Water Supply 2015, 15, 1373–1382. [Google Scholar] [CrossRef]
  22. Tuhovcak, L.; Suchacek, T.; Rucka, J. The Dependence of Water Consumption on the Pressure Conditions and Sensitivity Analysis of the Input Parameters. In Proceedings of the 3rd EWaS International Conference on “Insights on the Water-Energy-Food Nexus”, Lefkada Island, Greece, 3 August 2018; p. 592. [Google Scholar]
  23. Deyi, M.; Van Zyl, J.; Shepherd, M. Applying the FAVAD Concept and Leakage Number to Real Networks: A Case Study in Kwadabeka, South Africa. Procedia Eng. 2014, 89, 1537–1544. [Google Scholar] [CrossRef] [Green Version]
  24. Latchoomun, L.; Ah King, R.T.F.; Busawon, K.; Mawooa, D.; Kaully, R.G. Laboratory Investigation of the Leakage Characteristics of Unburied HDPE Pipes. Procedia Eng. 2015, 119, 91–100. [Google Scholar] [CrossRef] [Green Version]
  25. Schwaller, J.; Van Zyl, J.E. Implications of the Known Pressure-Response of Individual Leaks for Whole Distribution Systems. Procedia Eng. 2014, 70, 1513–1517. [Google Scholar] [CrossRef] [Green Version]
  26. Van Zyl, J.E.; Malde, R. Evaluating the Pressure-Leakage Behaviour of Leaks in Water Pipes. J. Water Supply Res. Technol.-AQUA 2017, 66, 287–299. [Google Scholar] [CrossRef]
  27. Özdemir, Ö.; Fırat, M.; Yılmaz, S.; Usluer, M. Analysis of the Effect of Pressure Control on Leakages in Distribution Systems by Favad Equation and Field Applications. Water Pract. Technol. 2021, 16, 320–332. [Google Scholar] [CrossRef]
  28. Marzola, I.; Alvisi, S.; Franchini, M. Analysis of MNF and FAVAD Models for Leakage Characterization by Exploiting Smart-Metered Data: The Case of the Gorino Ferrarese (Fe-Italy) District. Water 2021, 13, 643. [Google Scholar] [CrossRef]
  29. Lambert, A.O. Ten Years Experience in Using the UARL Formula to Calculate Infrastructure Leakage Index. In Proceedings of the IWA Waterloss 2009 Conference, Cape Town, South Africa, 28–30 April 2009. [Google Scholar]
  30. WLRandA, L. Water Leakage and Pressure Management. Available online: http://www.leakssuite.com/concepts/favad/ (accessed on 5 February 2019).
  31. Fantozzi, M.; Lambert, A. Residential Night Consumption–Assessment, Choice of Scaling Units and Calculation of Variability. In Proceedings of the IWA Water Loss Conference, Manila, Philipp, 26–29 February 2012; pp. 26–29. [Google Scholar]
  32. Loureiro, D.; Borba, R.; Rebelo, M.; Alegre, H.; Coelho, S.T.; Covas, D.I.C.; Amado, C.; Pacheco, A.; Pina, A. Analysis of Household Night-Time Consumption. In Proceedings of the 10th CCWI, Conference: Integrating Water Systems, Sheffield, UK, 1–3 September 2010; pp. 557–562. [Google Scholar]
  33. WSAA. Targeting Leakage Using Nightflow Measurements. In Guidlines by Wide Bay Water Corporation; Australia and Water Loss Research & Analysis Ltd.: Halifax, UK, 2011; pp. 1–29. [Google Scholar]
  34. Costanzo, F.; Fiorini Morosini, A.; Veltri, P.; Savić, D. Model Calibration as a Tool for Leakage Identification in WDS: A Real Case Study. Procedia Eng. 2014, 89, 672–678. [Google Scholar] [CrossRef] [Green Version]
  35. Lambert, A.; Fantozzi, M.; Thornton, J. Practical Approaches to Modeling Leakage and Pressure Management in Distribution Systems–Progress since 2005. In Proceedings of the 12th International; Available online: https://www.semanticscholar.org/paper/Practical-approaches-to-modeling-leakage-and-in-Lambert-Fantozzi/f74b9452b8a0457af3c466867ea63b00df6d37dd (accessed on 2 May 2022).
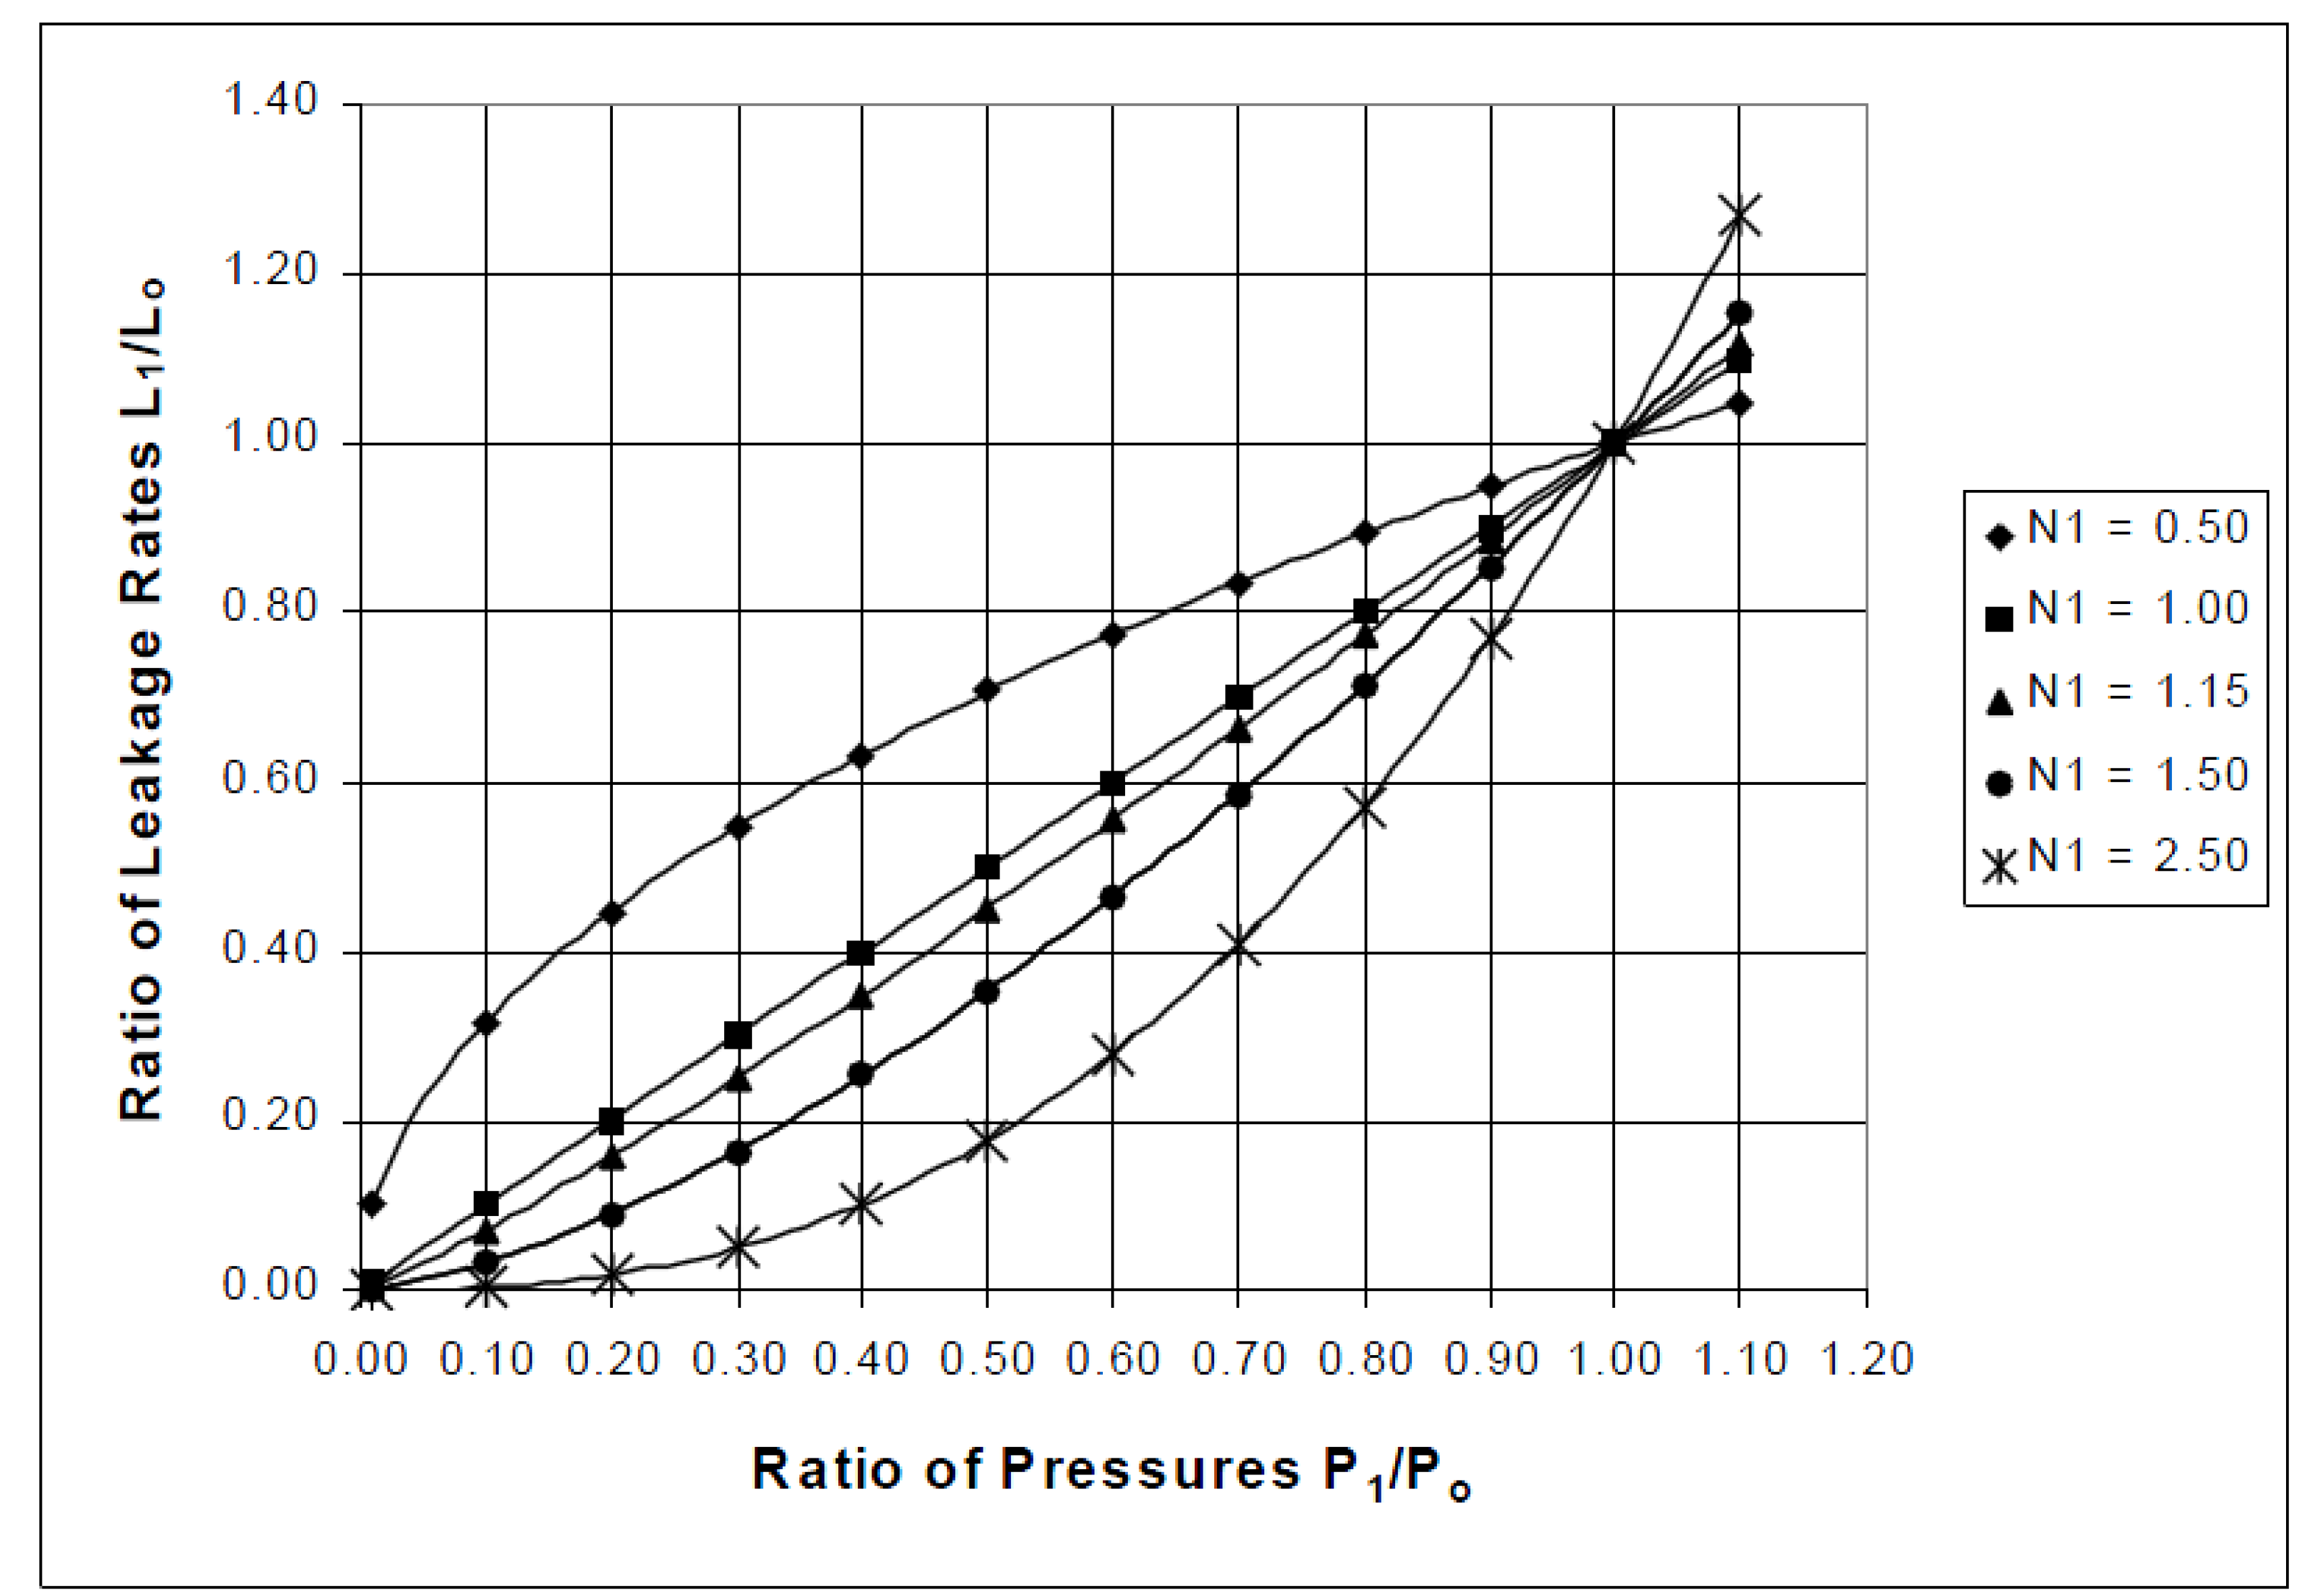
Figure 1. General relationship between pressure and leakage via N1 [7].
Water 14 02067 g001
Figure 2. Experiment methodology flowchart.
Water 14 02067 g002
Figure 3. Experiment location.
Water 14 02067 g003
Figure 4. Measured pressure on two locations and measured flow with MNF trend line.
Water 14 02067 g004
Figure 5. Hydraulic model structure overview with hydraulic pipe diameter.
Water 14 02067 g005
Figure 6. Hydraulic model maximal pressures in every node.
Water 14 02067 g006
Figure 7. The resulting MNF trend line using hydraulic model calculation (blue line represents theoretical flow derived from hydraulic model, while red points represent measured values).
Water 14 02067 g007
Table 1. Leak exponents obtained by Greyvenstein and van Zyl research [8].
Crack TypeN1 Exponent for Pipe Materials
PVCAsbestos–CementIron
Round hole0.524-0.518
Longitudinal cracks1.38–1.850.79–1.04-
Circumferential cracks0.41–0.53--
Corroded hole--0.67–2.3
Table 2. Time setting of pressure within the analysis.
Date and TimePressure Setting (Bar)
20 December 13:00 h4.0
21 December 15:00 h3.0
22 December 15:00 h2.0
Table 3. Calculation of water losses for each measured day.
Measurement DayRNC
(A)
Night Flow
(B)
Water Loss
(C = B − A)
21 December0.1120.3200.209
22 December0.2500.139
23 December0.1400.029
Note: Flow and water losses units (l/s).
Table 4. Mean pressure calculation.
PRV Setting MarkAverage Flow (l/s)Model TimeMean System Pressure (Bar)Water Loss (l/s)
PRV10.9587 h3.90.209
PRV21.04023 h3.10.139
PRV31.01343 h2.00.029
Table 5. Calculation of the N1 exponent.
VariableValue
L10.139
L00.209
P131.5
P039.7
N11.76
Table 6. Comparison of obtained N1 exponent by shown experiment to different theoretical values.
AuthorTheoretical N1 ValueExperimental N1 Value
Greyvenstein and van Zyl’s research [8]Longitudinal cracks
1.38–1.85
1.76
Lambert, A. [19]For flexible pipes
1.5
Van Zyl, J.E [6]0.5–2.79
Publisher’s Note: MDPI stays neutral with regard to jurisdictional claims in published maps and institutional affiliations.