Article

Evaluating the Field Performance of Permeable Concrete Pavers

by
Nam P. T. Nguyen
1,
Albert Sultana
1,
Nathaporn Areerachakul
2 and
Jaya Kandasamy
1,*
1
Faculty of Engineering and IT, University of Technology Sydney, Sydney, NSW 2121, Australia
2
Department of Safety Technology and Occupational Health, Faculty of Industrial Technology, Suan Sunandha Rajabhat Univerity, Bangkok 10300, Thailand
*
Author to whom correspondence should be addressed.
Water 2022, 14(14), 2143; https://doi.org/10.3390/w14142143
Submission received: 26 April 2022 / Revised: 28 June 2022 / Accepted: 30 June 2022 / Published: 6 July 2022
(This article belongs to the Special Issue Water Sensitive Design for Recycling and Treatment of Urban Water)

Abstract

:
The benefits of using permeable interlocking concrete pavement systems (PICPs) have not translated into widespread adoption in Australia, where their uptake has been slow. This paper communicates the actual performance of PICPs installed in the field by providing evidence of their long-term efficiency. There are currently no Australian standards for design, specification and installation of PICPs. In this study, field measurements were conducted to determine the infiltration capacity of PICPs in Sydney and Wollongong, New South Wales, applying the single ring infiltrometer test (SRIT) and the stormwater infiltration field test (SWIFT). A strong correlation was found between the results of the two tests in a previous study, which was verified in this study. The long-term performance of PICPs is demonstrated by their high infiltration rates (ranging from 125 mm/h to 25,000 mm/h) measured in this study at field sites under a diverse range of conditions. The influences of conditions such as age of installation, slope and tree cover on infiltration rates were explored.

1. Introduction

There has been considerable research into the operation of permeable pavements intended to reduce runoff from urban impervious surfaces and to retain pollutants, thereby reducing flooding and pollutant loads. Following pioneering studies in the 1990s [1], many laboratory and field studies have been conducted worldwide. Several commercial products have been developed—pervious concrete and asphalt pavements, permeable interlocking concrete pavement (PICP) systems and grid pavement systems [2].
Permeable pavements have been widely promoted as a measure for water sensitive urban design (WSUD) in Australia, sustainable urban drainage systems (SUDS) in the United Kingdoms and low impact development (LID) in the Unites States of America. They appear in many guides and lists of best management practices (BMPs) and stormwater treatment options. PICPs have been adopted for many decades, beginning in the U.S. in the 1970s and Europe in the 1980s.
PICPs are generally available in two types. The first type of PICPs is constructed with non-porous pavers, where water infiltrates through the joints between pavers and into the base layer. The second type is constructed with porous pavers, which are produced from a no-fine concrete mixture to give a high void ratio, or using a comparable process. This type of paver allows water to infiltrate through both the joints between pavers and through the pavers themselves, creating a fully permeable surface.
In the case of PICPs (non-porous pavers), the gaps at joints between pavers are not filled with sand or cement material as with conventional pavements. They are laid so that there is sufficient space between the pavers to allow water to infiltrate into the lower underlying layers, usually achieved through apertures fabricated into the paver’s shape. Suitable selected material is used to fill the gaps between pavers and form the bedding layer. Pearson and Shackel [3] state that a fill of 2–5 mm aggregate (ASTM #9 grading) provides the optimal compromise between high permeability and structural performance.
This study focusses on PICPs. Studies on PIPCs (both porous and non-porous) have been undertaken globally, for example, in the U.S. [4,5,6]; Canada [7,8]; Europe [9,10,11,12,13] and Australia [13,14,15,16]. It is evident from these studies that:
(a)
Infiltration rates through PICPs are variable, even for different test occasions at the same location.
(b)
During storm events and extended tests, infiltration rates decline with time, as systems become saturated.
(c)
Rates are very high for laboratory tests and new field installations, but decline with age in the field, with the main cause being blockage by fine sediments.
(d)
There can be difficulties in reversing this process through maintenance and renewal operations.
Data from previous studies of infiltration rates of PICPs (non-porous pavers) have been collated, primarily to assess the change in surface infiltration rate with age. The results of the surface infiltration rates versus the age of the PICPs (non-porous pavers) are shown in Figure 1. The general trend in the data shows a reduction in infiltration rate with age of PICPs. However, a significant scatter is evident.
More recently, Boogaard and Lucke [17] conducted 17 field tests in the Netherlands using the full-scale infiltration testing (FSIT) method where infiltration measurements were taken when large sections of PICPs were inundated with water. All except two were non-porous PIPCs. The results of Boogaard and Lucke [17] ranged between an infiltration of 21–503 mm/h and PICP age of 2–8 years.
The fully permeable surface area provided by PICPs (porous pavers) can be expected to perform as well, if not better. However few studies have been undertaken to assess the surface infiltration rates of PICPs (porous pavers), and how they compare against PICPs (non-porous pavers) under factors such as age.
The adoption of PICPs in Australia has been slow [18], despite encouragement in some localities. For example, the Ku-ring-gai Council in New South Wales (NSW) offers a rebate of up to $1000 towards the cost of replacing an impervious surface with a permeable one [19]. The product is not covered in most design guidelines, practice notes or policies prepared by councils, which means asset owners are uncertain about what needs to be considered in the design. Approval authorities are equally unsure of how to specify a permeable pavement and what the long-term risks of approval are, specifically clogging leading to reduction in infiltration rate, generation of surface runoff and a loss of pavement structural integrity that leads to uneven surfaces. Approval often depends on the views of council engineers and their possible limited experience of success, failures and maintenance problems. Proposals involving permeable pavements are often rejected or, if approved, are subjected to strict conditions, which can make their use uneconomical when compared with other BMPs.
According to Moktan [20], there is a reluctance to embrace PICPs in national building standards in Australia, which can be generalized as being due to ambiguities regarding requirements for the maintenance, quality, performance and longevity of pavers. One of the reasons why there is limited support to back up the case for PICPs is the lack of Australian research that can be applied to specify suitable characteristics of permeable pavers for various conditions, most notably, pavement life.
The purpose of the field tests is to gauge the long-term in-situ performance of PICPs and examine the results for their implications for design. Assessment of field installation of PICPs that exist under a range of conditions such as topography, in-situ soil, vegetation and moisture conditions, and load and operating conditions were made. There is a perception that PICPS quickly lose their infiltration capacity and this has held back their widespread application. The results of this study will challenge widely held notions and inform regulatory authorities and designers of the actual situation.
This paper presents the results of field-testing of PICPs at installation sites aged between 1 and 20 years in Sydney and Wollongong. The majority of the tests were conducted for PICPs constructed with non-porous pavers, which rely on water infiltration through joint spaces. This current study will primarily focus on PICPs of porous pavers that create a fully permeable surface. The results of this study augment previous studies that provide data for PICPS of non-porous pavers allowing assessment of differing performance characteristics between these two types of pavers.
This study applied two in-situ test methods that can be performed in the field. The first method was the SWIFT test [14] and the second method uses a single ring infiltrometer test (SRIT) [21]. Both methods were undertaken and the results from each compared. The results obtained using these tests were assessed against the age of the PICPs, the catchment land use, the slope of the pavement, the presence of vegetation cover, etc.

2. Materials and Methods

2.1. Locations of Field Tests

In this study, field infiltration tests of PICPs (porous and non-porous pavers) were performed at several locations in Sydney and Wollongong (NSW) under various conditions (see Table S1). Figure S1 shows the locations where the field tests were performed in relation to local government council boundaries. HydroSTON [22] and Ecotrihex [23] are porous pavers and non-porous pavers, respectively. Most of the tests were conducted at sites where HydroSTON pavers were installed up to 10 years prior to the tests. Field tests were also carried out at Sydney Olympic Park where Ecotrihex pavers [23] were installed. The characteristics of the pavers are shown in Figure S2. H50 (HydroSTON) and Ecotrihex pavers are commonly used as pedestrian footpaths, and H80 (HydroSTON) pavers are used for car parks and driveways. Figure S3 is a section view showing a typical substructure for permeable pavers and how infiltration passes through the pavement surface. In Table S1, the slope rating was estimated by observation on-site. Vegetation cover was evaluated based on the presence of trees and bushes overhanging the paved area, along with observations of vegetation debris on the pavers.

2.2. SRIT (Single Ring Infiltrometer Test)

The SRIT was developed by the American Society for Testing and Materials, now ASTM International (C1781M—14a) [21] to measure infiltration in the field. The method is outlined in the Supplementary Material.

2.3. SWIFT (Stormwater Infiltration Field Test)

Lucke et al. [14] developed a simple, quick and inexpensive field test using readily available equipment (see Figure S4) as an alternative method for measuring the infiltration rate of PICPs for asset managers, local councils, etc., to quickly assess and evaluate the infiltration rates of PICPs. Lucke et al. [14] showed that there is a correlation between the results of the SWIFT and SRIT tests that is evident when the results collected using these two methods are compared graphically. The is outlined by Lucke et al. [14] and in the Supplementary Material.

3. Results

3.1. Field Tests: SRIT and SWIFT Comparison

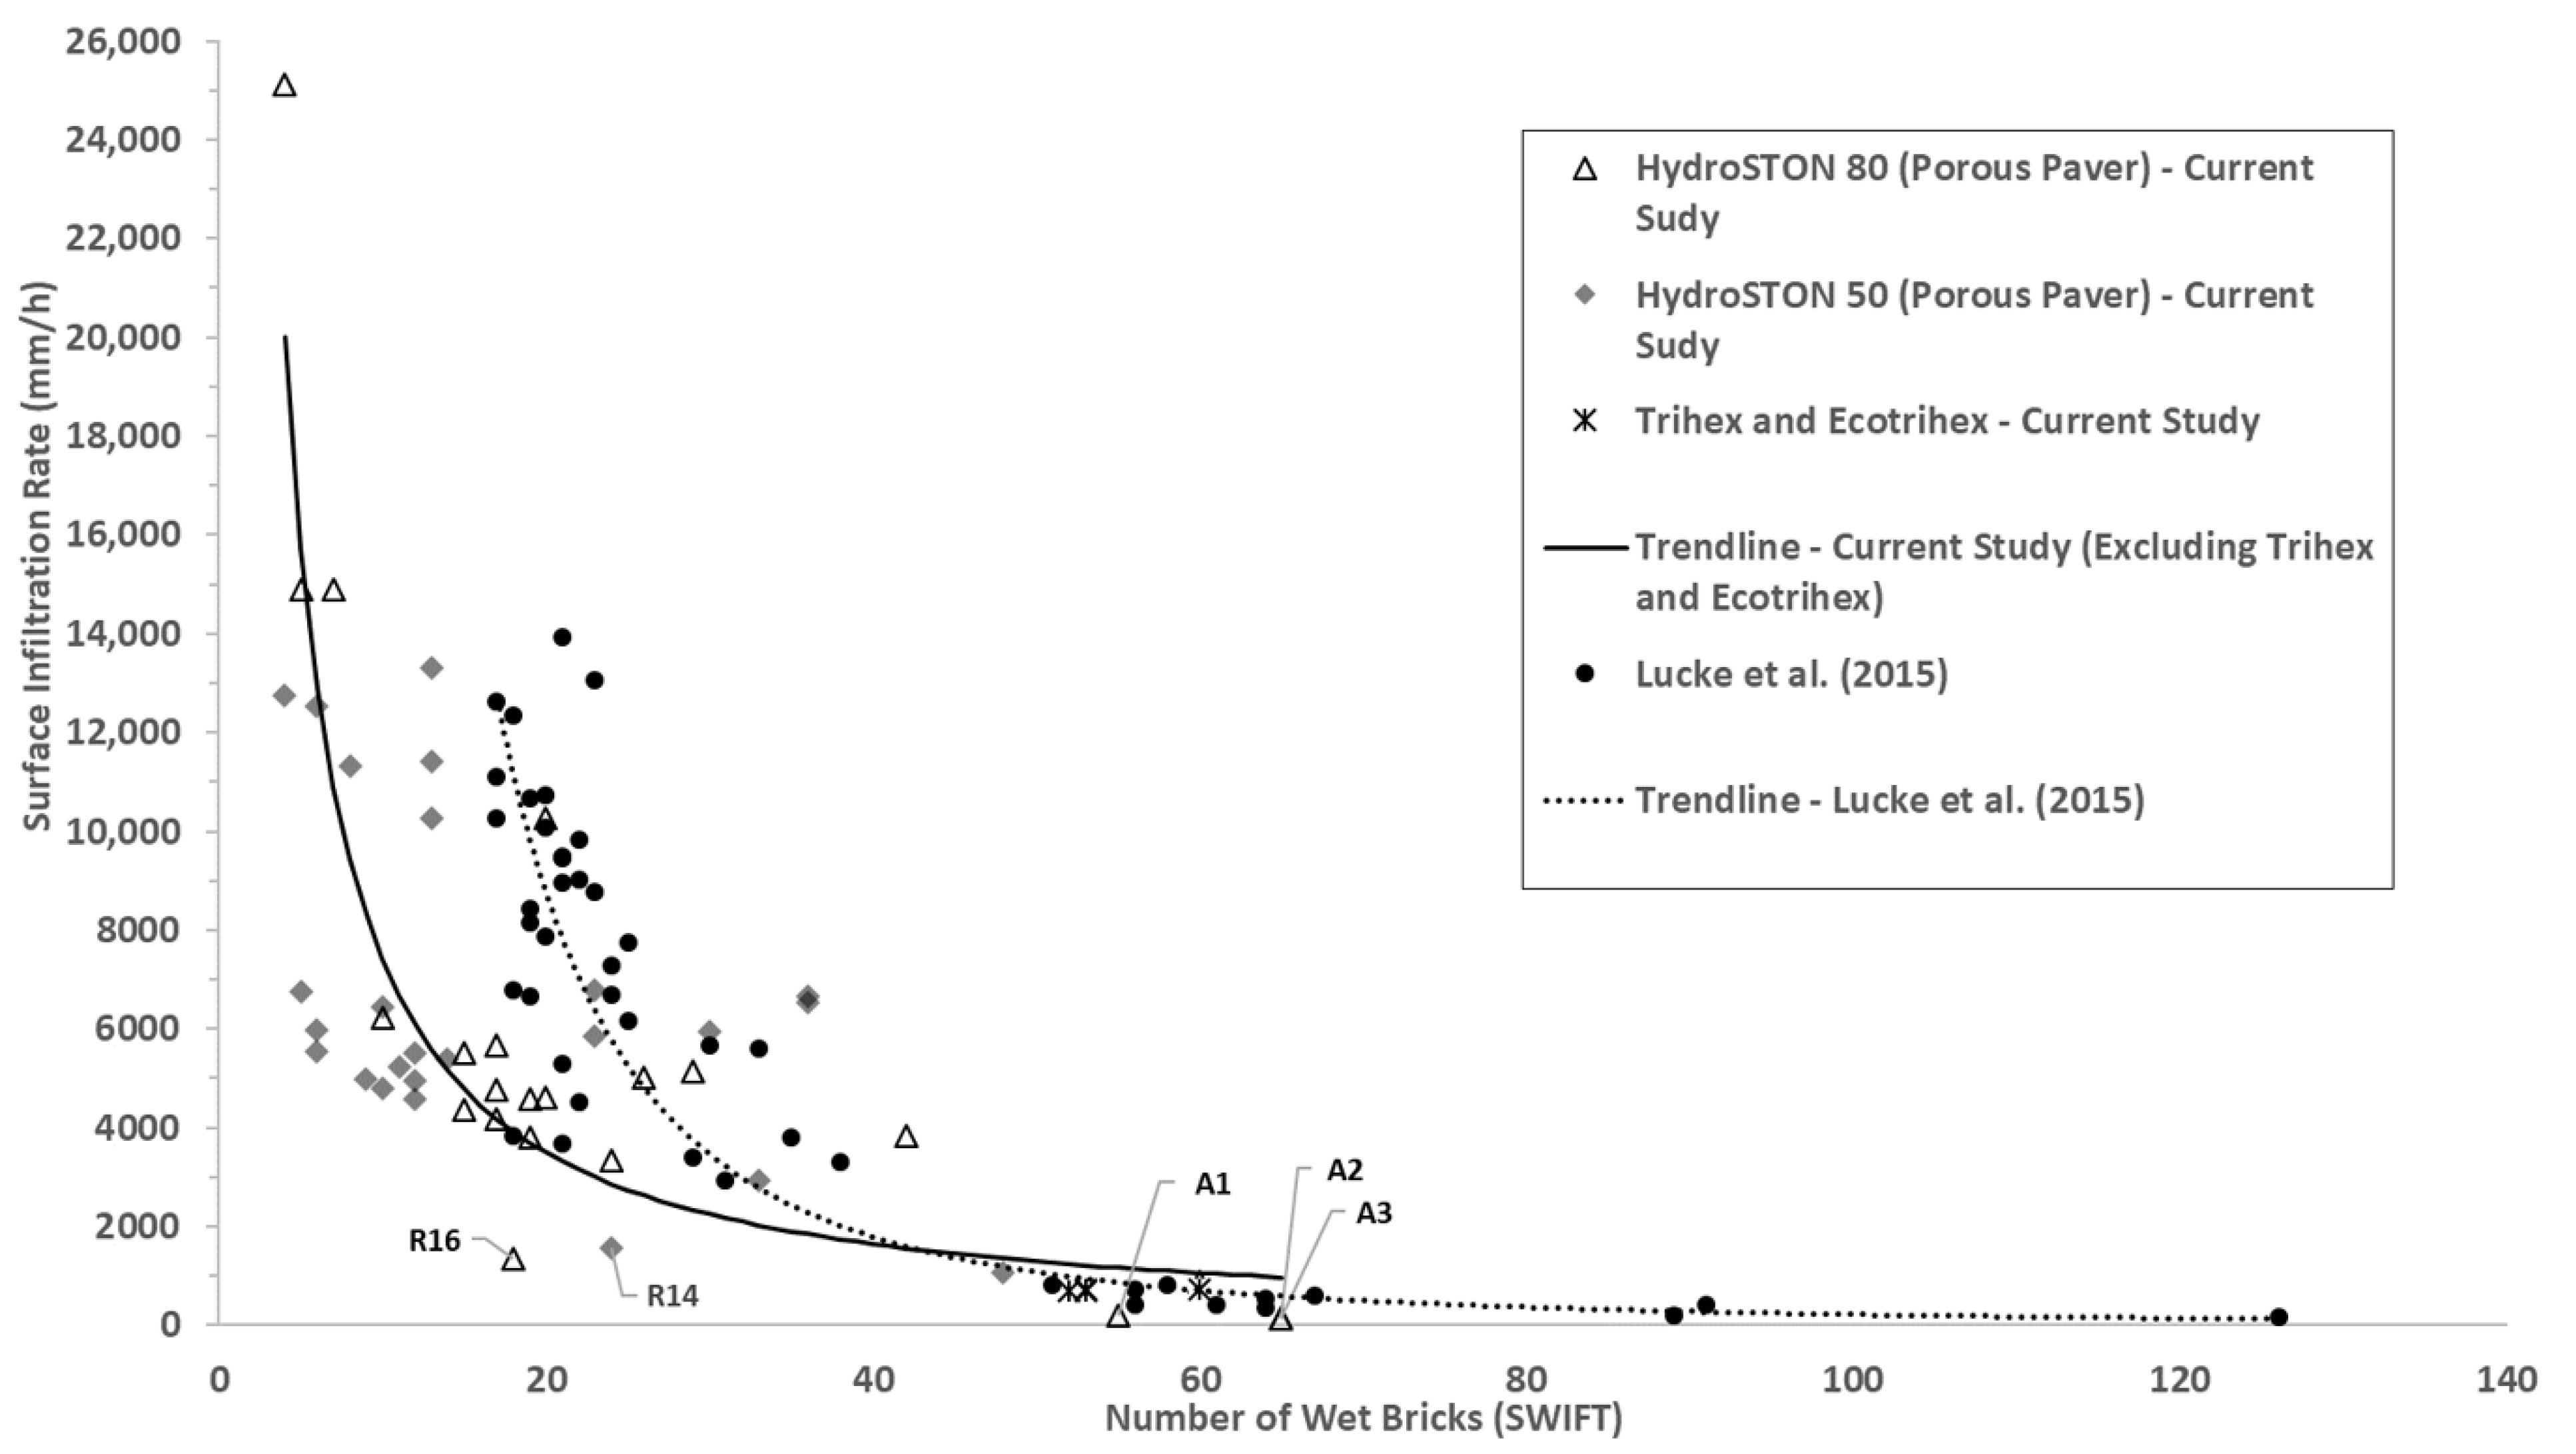
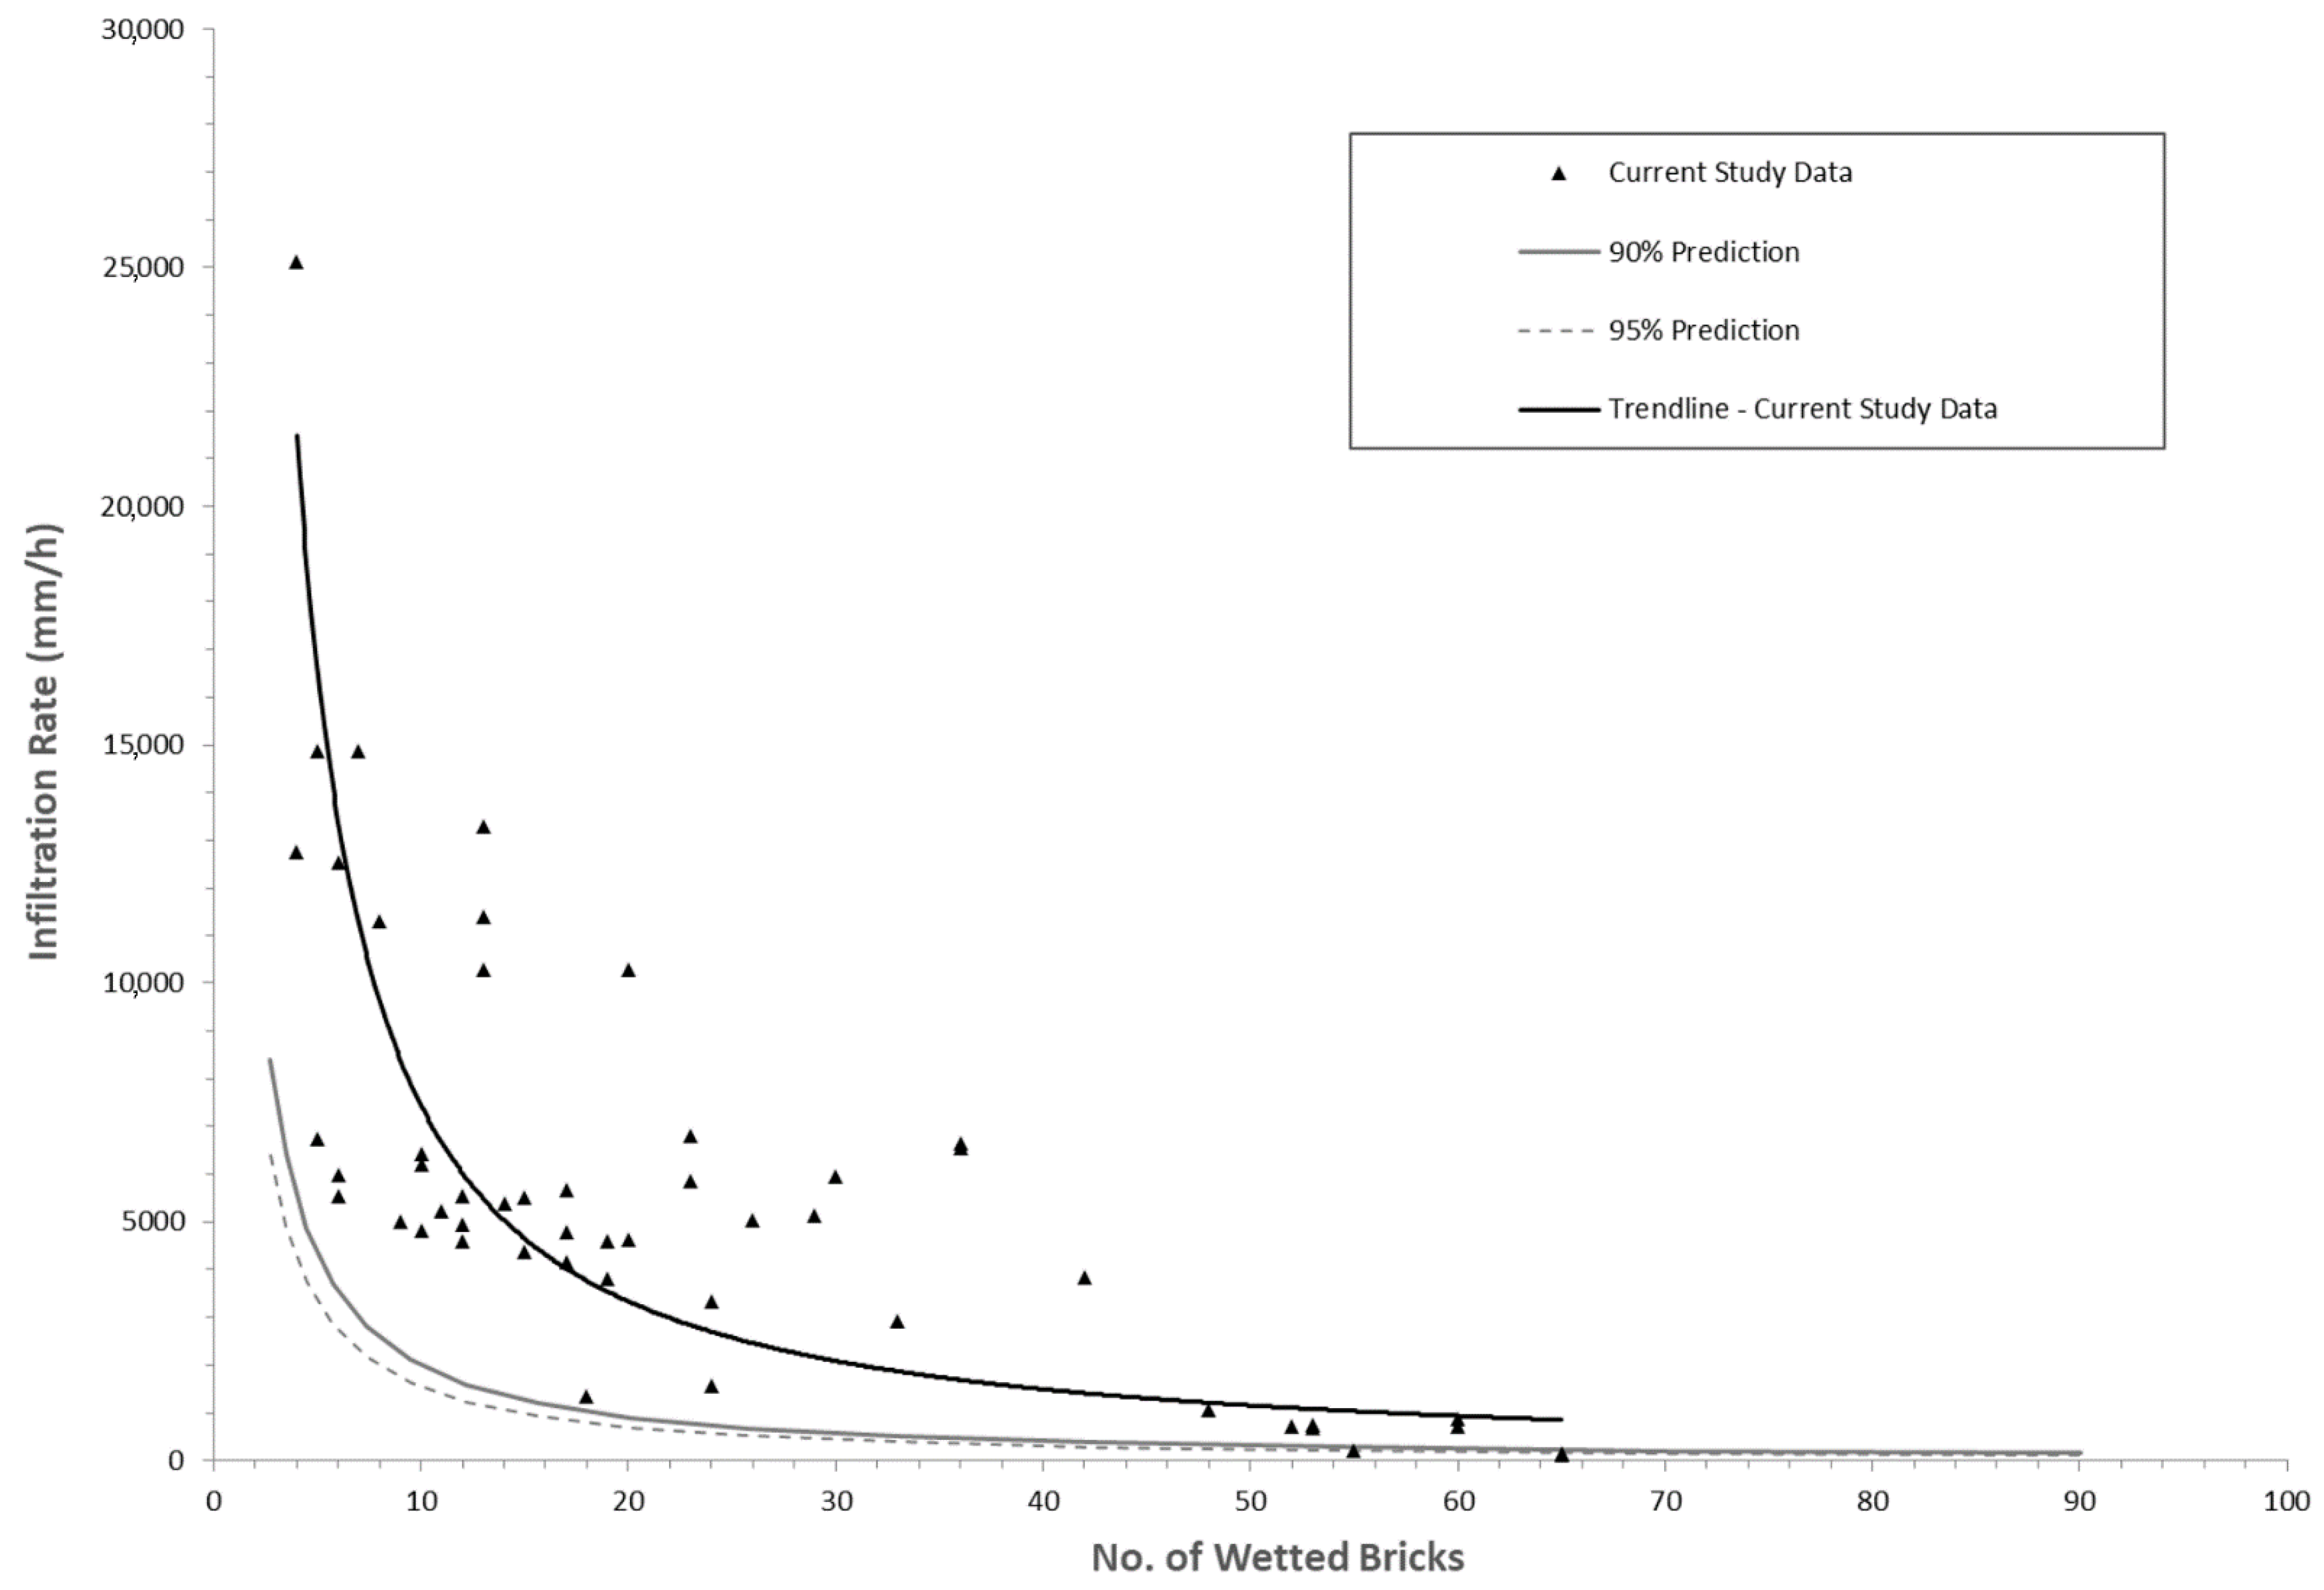
Figure 2 shows comparisons between the SRIT and SWIFT test results obtained by Lucke et al. [14] and in this study. Lucke et al.’s [14] data were collected for non-porous PICPs. The solid line on this graph shows the overall trend of data collected in this study. The trendline for Lucke et al.’s [14] data is shown as a dotted line. Both datasets show a similar trend. Overall, the infiltration rates obtained in the two studies are high, and range widely between 125 and 25,000 mm/h. The latter was a measurement obtained in this study. These rates are much greater than the heaviest rainfall intensities ever experienced in Sydney and Wollongong [24].
The trendline for the data from the present study is
I = 89,951N−1.084
where I is the infiltration rate; and N is the number of wet bricks (R2 = 0.53). The trendline of present study data excludes data of Trihex and Ecotrihex pavers (Table S1) that were obtained in this study and explained later.
Lucke et al. [14] classified the blockage of PICPs according to infiltration rates, as shown in Table 1. In this study, there are 10 data points that have an infiltration rate of less than 2000 mm/h (medium blocked) and zero where the infiltration rate was less than 30 mm/h (fully blocked). The result indicated that PICPs retain their permeability very well over extended periods under varying conditions.
In the present study, there were a total of 53 tests carried out at 13 locations (Table S1). Tests at each location were carried out without cleaning the pavement surface prior to the measurement, apart from removing large debris such as leaves that would interfere with the testing. Of the 53 sites tested, there was only one, at the Albert de Lardes Reserve, Illawong (Figure S1; Table S1), where the pavers appeared visibly blocked. This site is a popular public car park, located on slightly sloping ground and with very significant tree coverage. The site had not been subject to routine or systematic maintenance during its 7 years of use. The three tests that were carried out at this location recorded a surface infiltration rate in the range of 150–125 mm/h applying SRIT and wetting more than 65 pavers using SWIFT.
Figure 2 shows that the trendline for the data collected in this study is different from that of Lucke et al. [14]. The data of Lucke et al. [14] fits better to its trendline (R2 = 0.85) than that of the present study (R2 = 0.53). While both trendlines have the same form, the trendline of data of the present study shows that infiltration occurs through a smaller number of bricks than the trendline of the data of Lucke et al. [14]. The data from the present study are predominantly for HydroSTON pavers, which are porous to create a fully permeable surface area. Lucke et al.’s [14] data is for non-porous pavers where infiltration only occurs through the gaps between the pavers. Nonetheless, where the number of bricks exceeds approximately 45 pavers, the situation appears to reverse, although this region is not well defined with few HydroSTON data. The Trihex and Ecotrihex (non-porous pavers) data collected in this present study fit well with the Lucke et al. [14] trendline, as they are similar non-porous paver systems.
The data collected in the present study show more variability than those of Lucke et al. [14], evident from the lower R2 coefficient for the trendline of the present data. The data of this study were collected from sites with a more heterogeneous range of conditions (see Table S1). Apart from the predominant paver type in the study being porous pavers, which in Lucke et al.’s study [14] were non-porous, other factors that could lead to the differences in the measured infiltration rates include the slope of the pavement surface; age of pavers; sub-grade structure including soil type, its saturation and water table levels; quality of construction; operating conditions including size and type of clogging materials and vegetation cover, vehicular and pedestrian loads; and frequency and quality of maintenance. The following sections highlight differences in test conditions between the two sets of data.
Location of testing: Lucke et al. [14] conducted SRIT and SWIFT tests at three sites on the Sunshine Coast of Queensland. The SRIT test was carried out during one day, then the SWIFT test was carried out at the exact location on another day, ensuring the same environmental conditions were applied for each test. The tests in the present study were carried out on the same day, one after the other at locations slightly offset to each other, generally about 1–2 m away, i.e., the SRIT test was conducted at one location, then a few minutes later the SWIFT test was conducted at a location within a 1–2 m radius of the SRIT test location. Therefore, the base course and the surface of the pavers were not exactly the same, yielding results that may not necessarily correlate.
Weather: Lucke et al. [14] stated that “replicate testing was undertaken on different days to ensure the PICP surface was dry to allow for the number of wet bricks to be counted.” Following the SRIT test, they waited for the pavement surface to dry to carry out the SWIFT tests at the same location. Their study took into account the general condition of the testing surface. The moisture conditions for the current tests were not the same for all sites. Some sites experienced 10–30 mm of rainfall the day before testing, while other sites were dry. The difference in moisture content at the test locations may have contributed to the scatter in the data.
Slope: Lucke et al. [14] did not note the slope of the pavement at the sites where the tests were performed. In this study, the slope of the pavements where measurements were carried out are summarised in Table S1.
Type of pavers: Lucke et al. [14] carried out a similar number of tests on two PICPs (non-porous) i.e., HydrapaveTM pavers, and Ecotrihex and Trihex pavers. The tests in this study were carried out predominantly on HydroSTON pavers (see Figure 3). Further it was observed that the sizes of gaps between pavers were not consistent between locations. This can therefore affect the results of the test experiments.
Base course: The base course under the pavers tested in this study is noted in Table S1. At some locations, the types of base course were not known. Lucke et al. [14] mentions that two test sites used an aggregate base and one site used a sand base. Drainage through pavers is affected by the type of base courses under the pavers, the gradation of the bedding layer, the fill material in the joints between pavers and vegetation cover, as well as the size of the drainage voids within the pavers themselves [25].
Trees: Lucke et al. [14] did not specify vegetation conditions, but photographs in the paper show the sites to be relatively open, with only a few trees in the vicinity and none overhanging the test location. The vegetation conditions of the tests in this study are summarised in Table S1 and varied considerably, with overhanging trees and vegetation cover at some locations.
Age: The variation of the age of PICPs within the three sites studied by Lucke et al. [14] is not enough to properly assess the effect of age and was not considered in their analysis. In this study, the age of the pavement is summarized in Table S1. The age was between 1 and 10 years for HydroSTON pavers, and 21 years for Trihex and Ecotrihex pavers. This allows the impact of the age of the pavement on infiltration to be assessed and this is discussed in Section 3.3.

3.2. Discussion on Variability

The scatter of data points in the present study is evident and may have been caused by the different environmental conditions during measurement and factors such as slope, age, vegetation cover, etc. To illustrate the nature of the scatter, the measurement conditions of two points R14 and R16 are detailed.
Test R14 was conducted on a driveway at Newington College (Table S1, Figure S1) and was located next to a tree. There was about 10 mm of rain at the site the day before measurements were taken. Both the pavement and area around the tree had a damp surface. The SRIT test took time to drain and the results could have been affected by the condition of the sub-base structure. The SWIFT test could also have given an inaccurate result due to the uneven slope (and sag point) at this test location. These reasons could explain the lower number of wetted pavers during the SWIFT test.
The results from Test R16 were obtained at another car park at Newington College, where the field measurements displayed a wide range. Measurements on the pavement where cars parked gave a high infiltration rate. The Test R16 infiltration rate was obtained on the driveway portion of the car park and was low. It was observed there were large gaps of up to 10 mm between pavers, which could have been caused by vehicular loads. These may have contributed to the variation in results.

3.3. Analysis of Factors Influencing the Infiltration Rate

In this section, factors that could influence the permeability of PICPs were assessed, using data collected in this study.
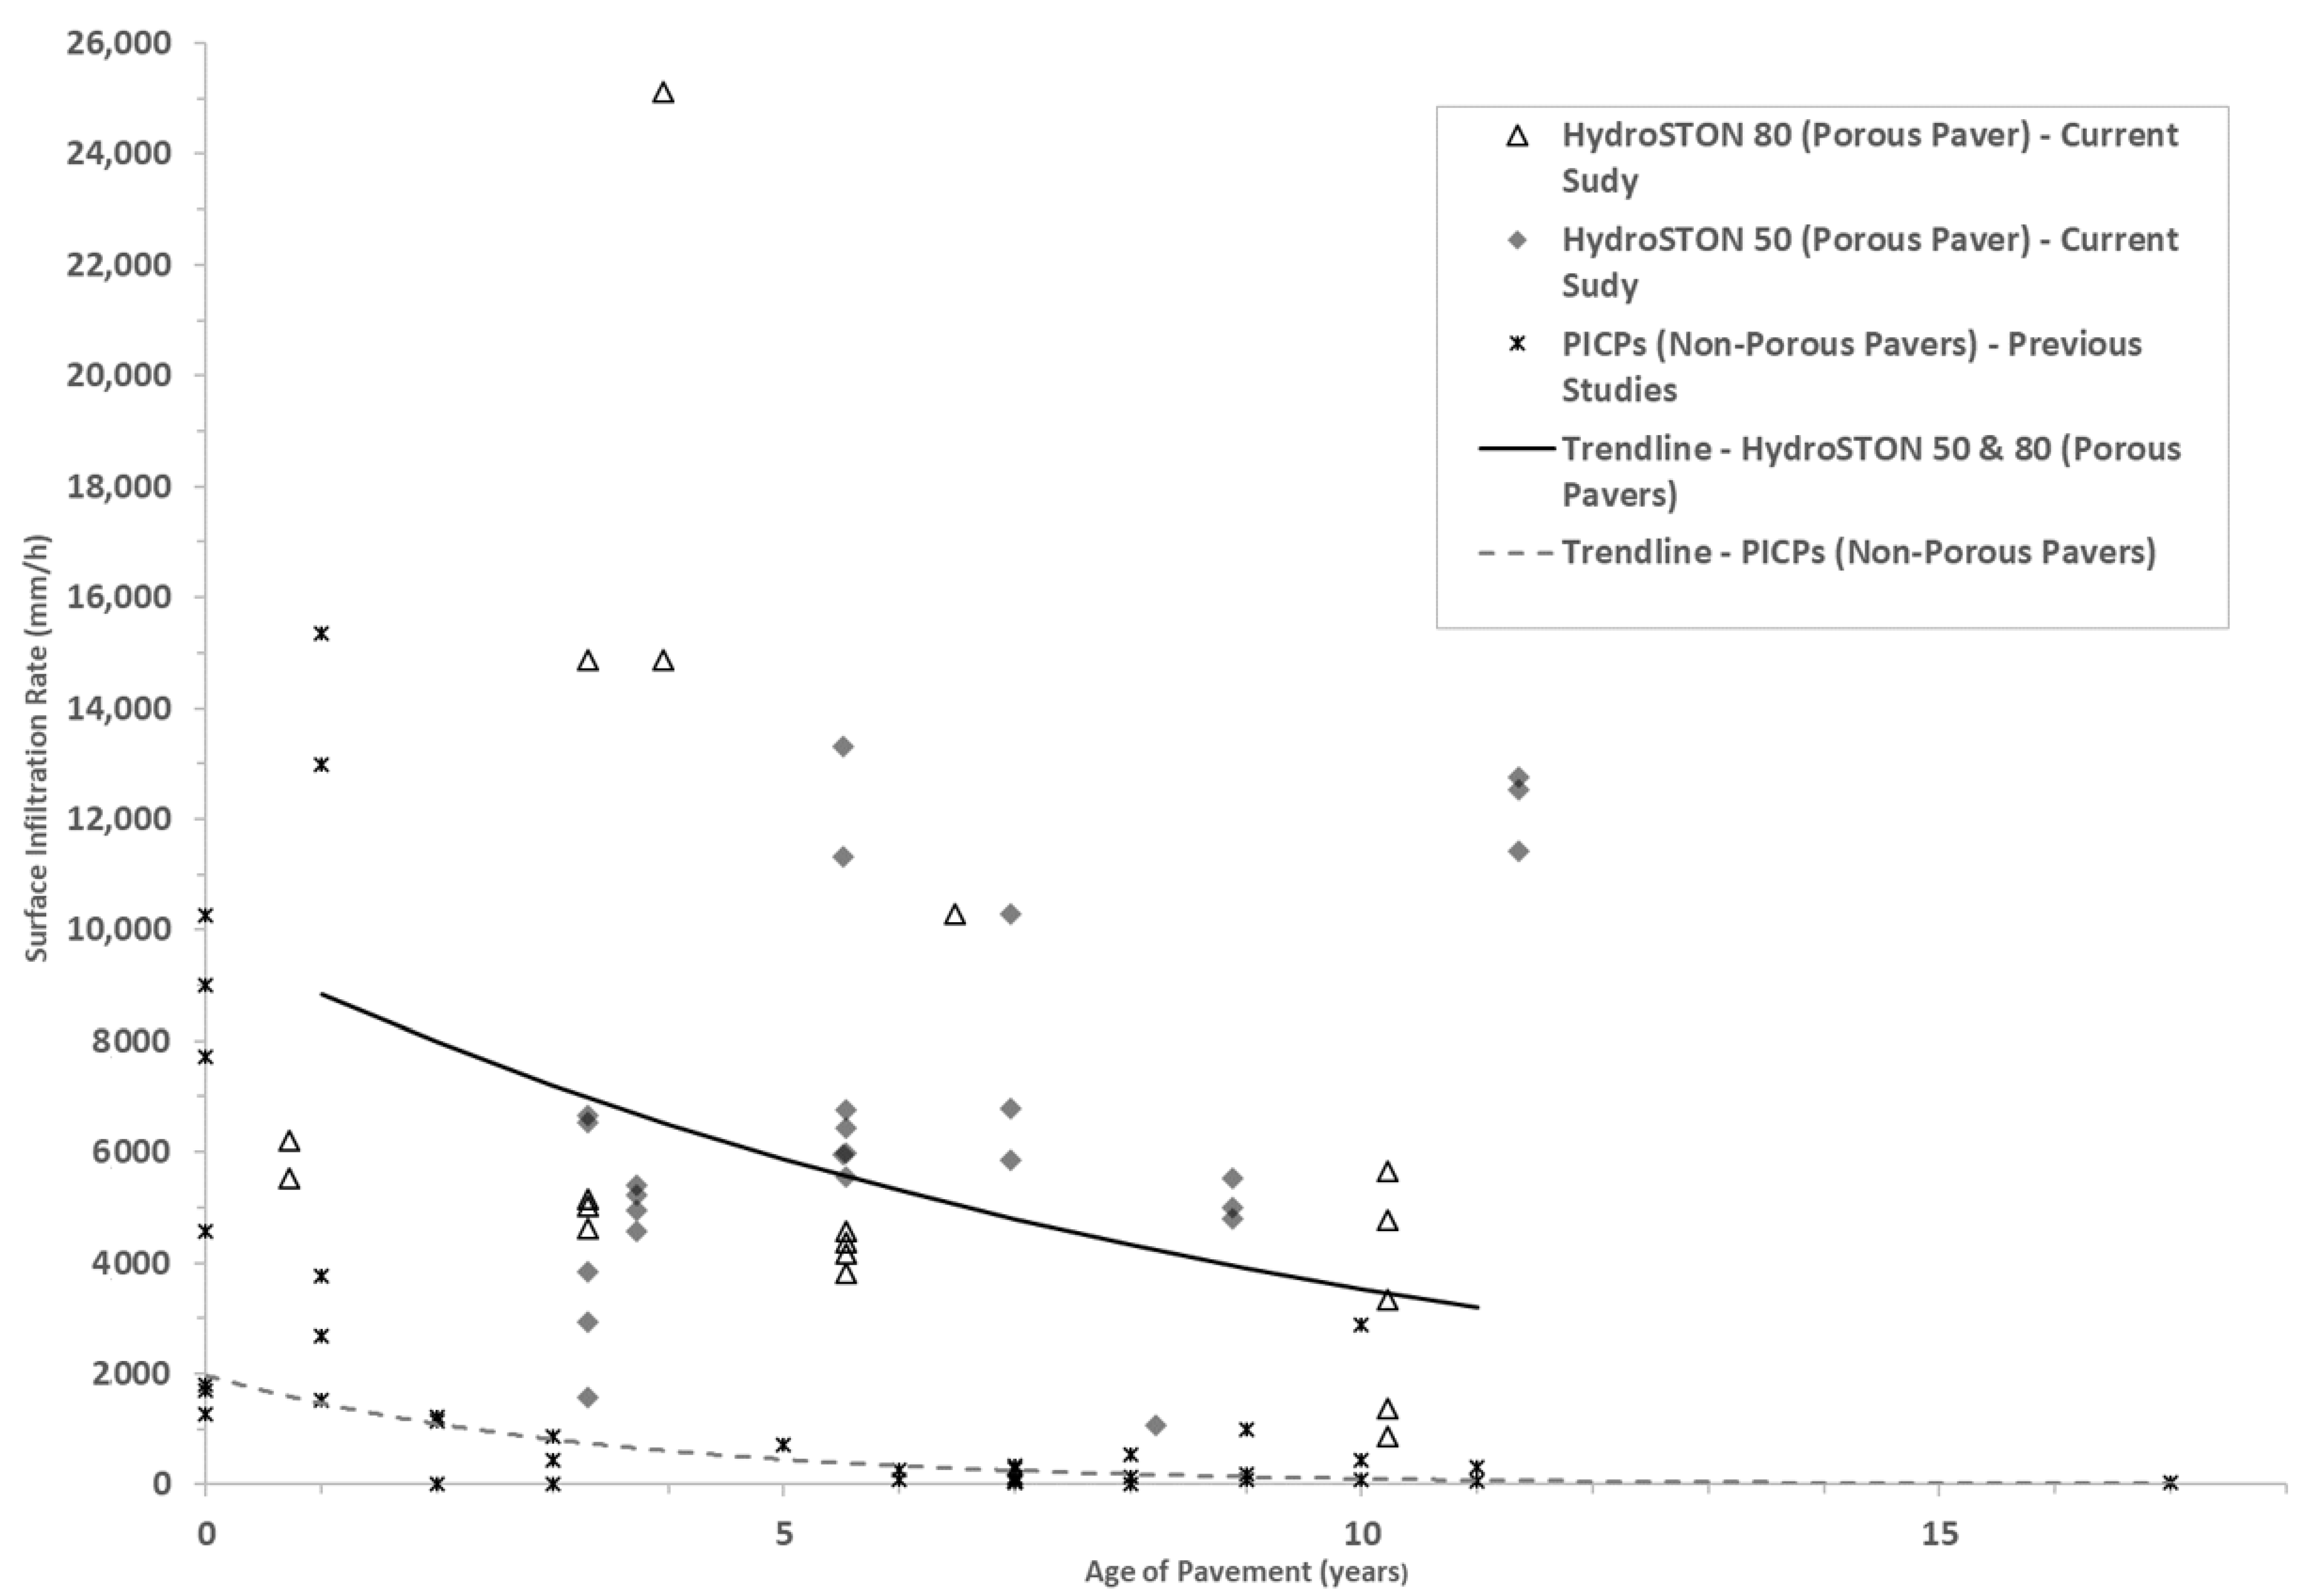
Effect of paver type: The trendlines in Figure 2 show infiltration occurs through a smaller number of PICPs (porous pavers) than non-porous pavers (when the number of wet bricks is less than 45).
Figure 2 shows the surface infiltration rates of PICPs (porous pavers) obtained in this study and that of PICPs (non-porous pavers) from previous studies, both compared against pavement age. Trendlines show that, comparatively, porous pavers have a higher infiltration rate relative to their age. This is expected, as porous pavers offer a significantly more permeable surface area. There is significant scatter in this data resulting from the influence of other in-situ factors, as previously discussed. Furthermore, the different testing methods used in this study and the previous studies also contribute to the scatter.
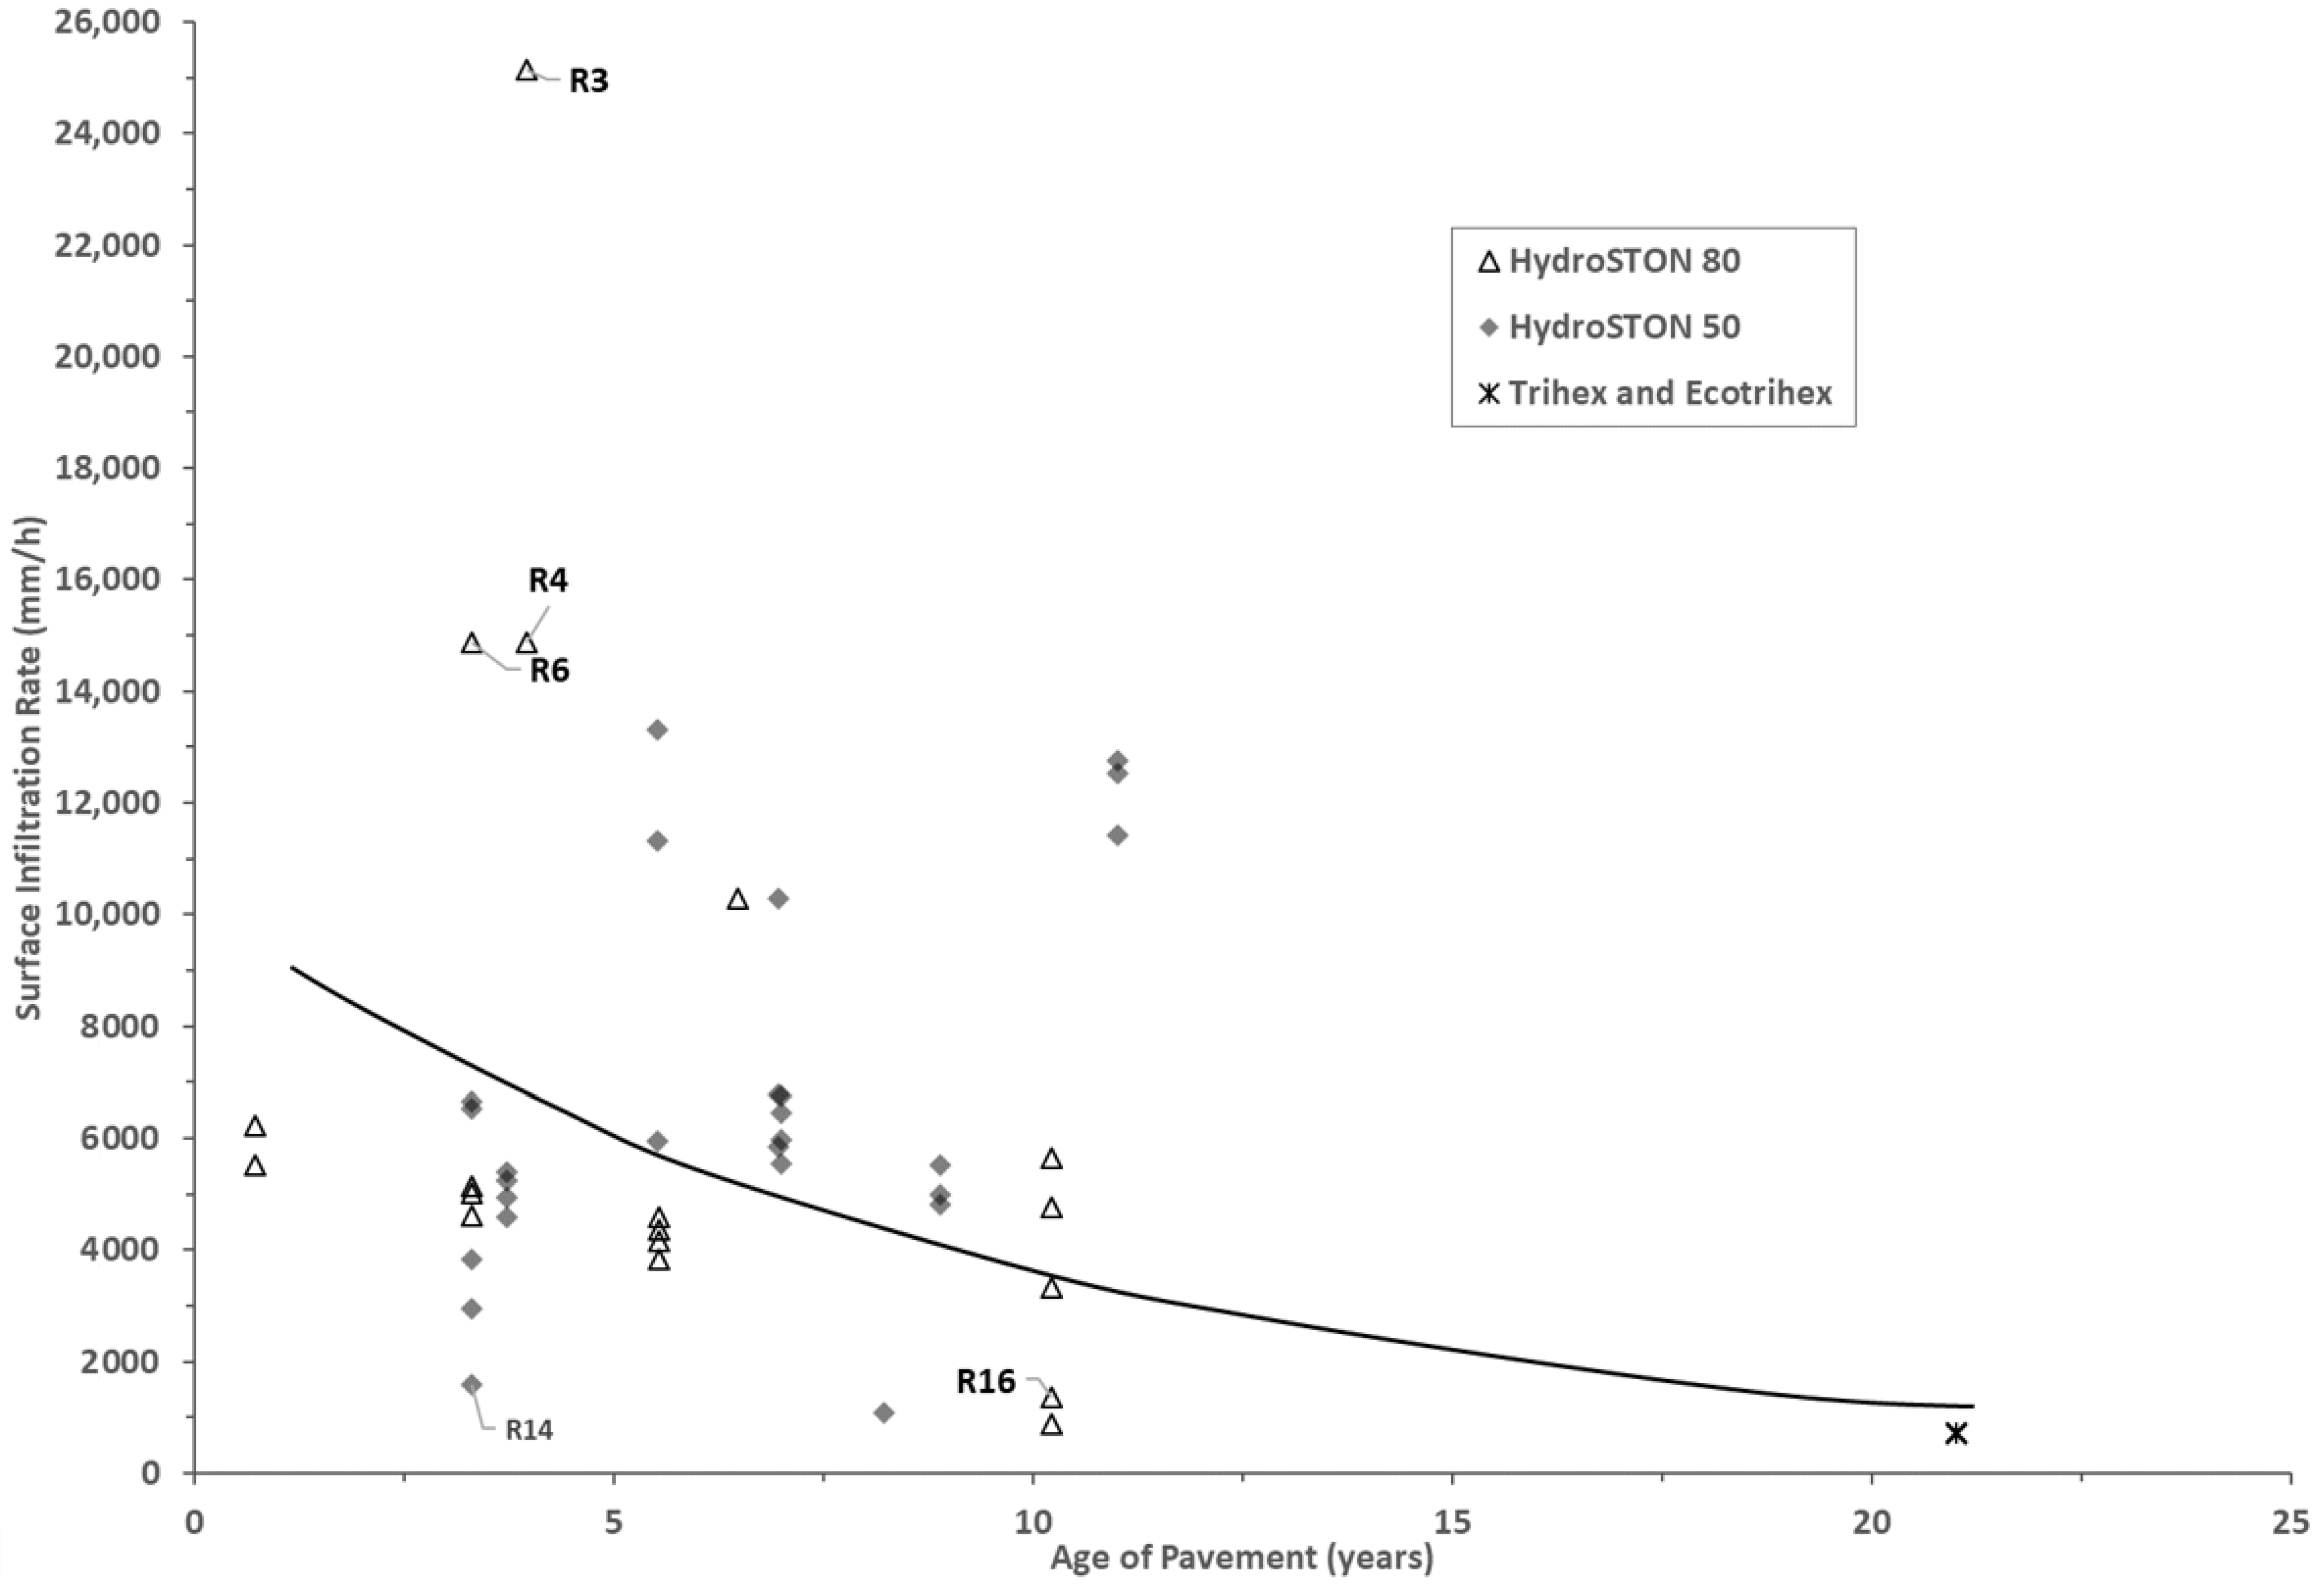
Effect of age of pavement: The infiltration rate of PICPs is affected by the clogging that typically occurs with age and by the slope of the pavement (Sañudo-Fontaneda et al. [13]).
Figure 4 shows a plot of infiltration rates against the age of PICPs. The line shown in Figure 4 depicts the overall trend of the data. Newer PICPs give a higher infiltration rate than older installations, as expected. However, even PICPs that are more than 20 years old still had a high infiltration rate of about 800 mm/h. Nonetheless, the data has a large range of vertical scatter, as discussed earlier. This could indicate the influence of other factors, such as the slope at which the pavement was laid.
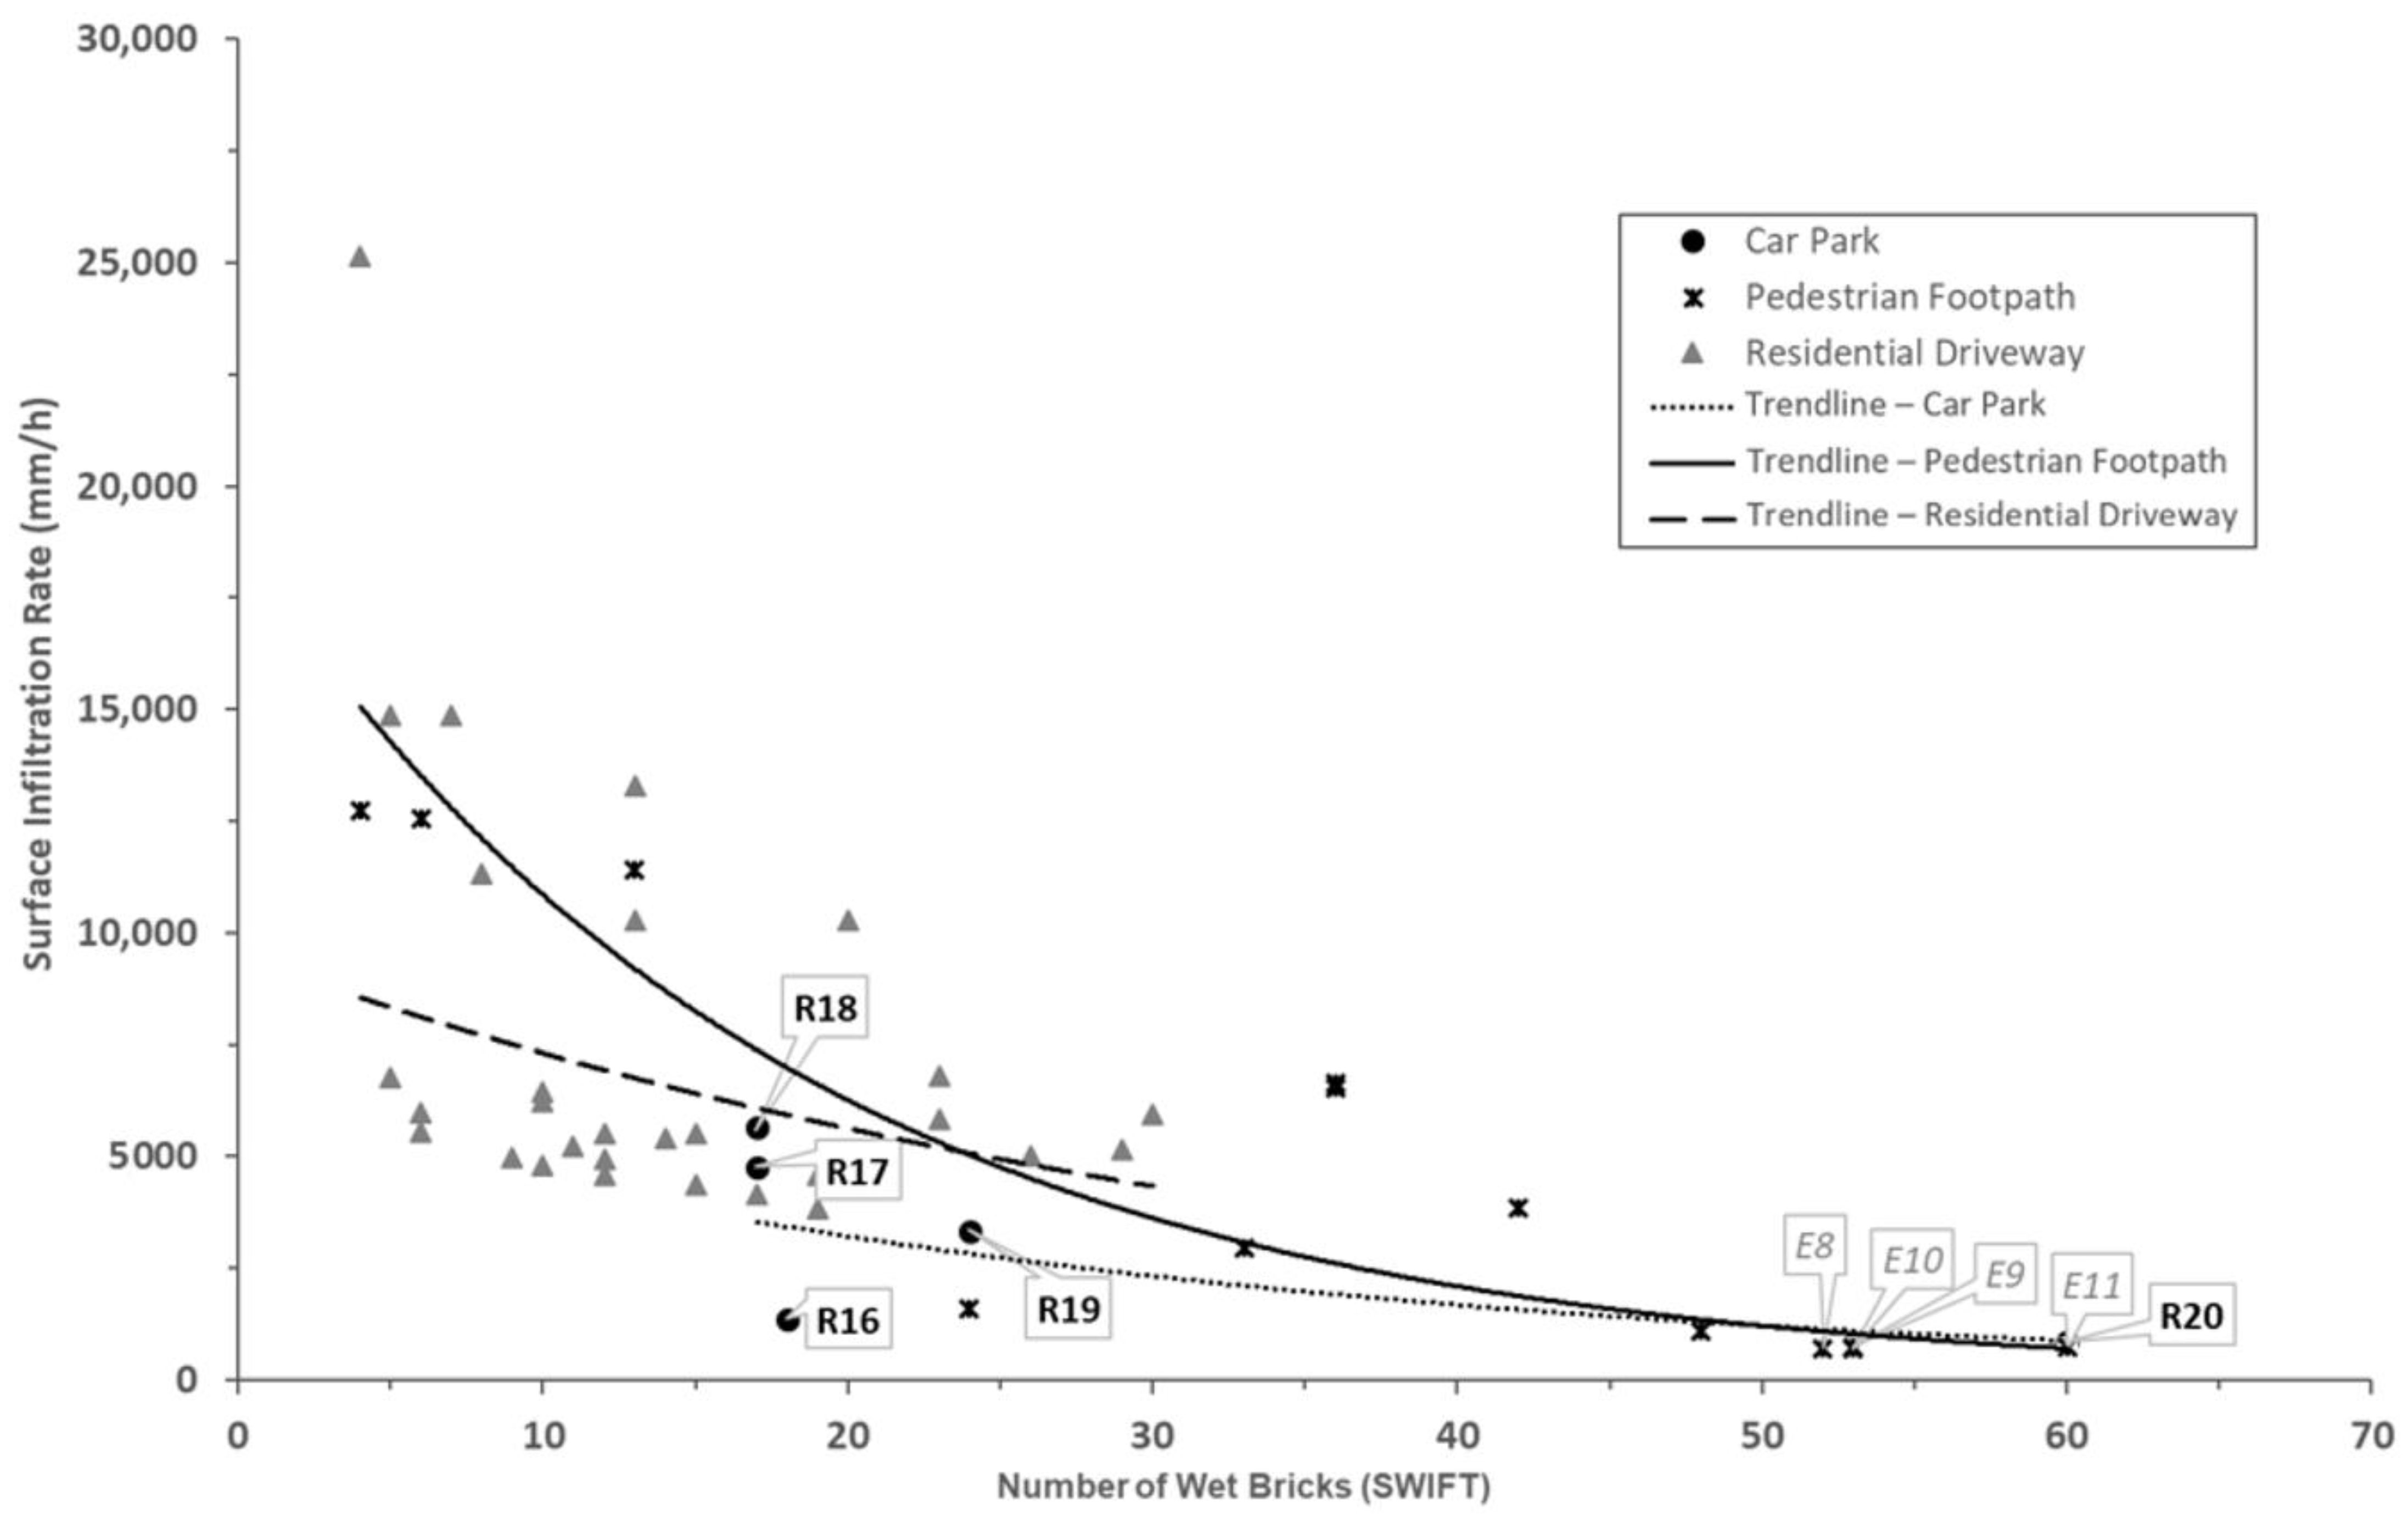
Effect of usage: Infiltrations rates for PICPS used for different types of usage such as residential driveways, pedestrian footpaths and car parks were analysed. These locations where tests were carried out were those expected to have high pedestrian traffic or where the pavers experienced high vehicle loads.
Figure 5 shows a comparison of infiltration rates for the different uses of PICPs. The infiltration rate of pedestrian footpaths was slightly higher than that of residential driveways and carparks.
To further identify the effects of traffic loads on PICPs, tests were carried out at a car park at Newington School that had a flat slope and HydroSTON80 pavers (Table 2). Four tests were performed at different locations at the car park. Test number R16 had been discussed earlier. Tests R17 and R18 were carried out in the middle of a parking bay, where high vehicle loads were not normally experienced. Tests R19 and R20 were performed on a driveway or at a location that experiences wheel loading (near the line that demarcates parking slots).
Table 2 demonstrates how the type of traffic and load can affect the infiltration rate. The tests performed where there was higher traffic/load had a lower infiltration rate than those locations with less traffic/load (see Table 2). The lowest infiltration rate collected at locations under heavy loads and that were more highly trafficked was still relatively high at 800 mm/h.
At Sydney Olympic Park E8, E9, E10 and E11 (Figure S1) had lower infiltration rates because the paver type was PICPs (non-porous) and were 21 years old. PICPs here also experienced high pedestrian traffic loads. Despite this the PICPs still had a relatively high infiltration rate of 600–700 mm/h.
These measured data provide support for the use of PICPs as car park and pedestrian pavements. Indeed, several government planning guides promote the use of a permeable pavement for car parks [26,27,28,29]. Beyond this, these documents fail to provide technical specifications or design parameters that can support their design and installation.
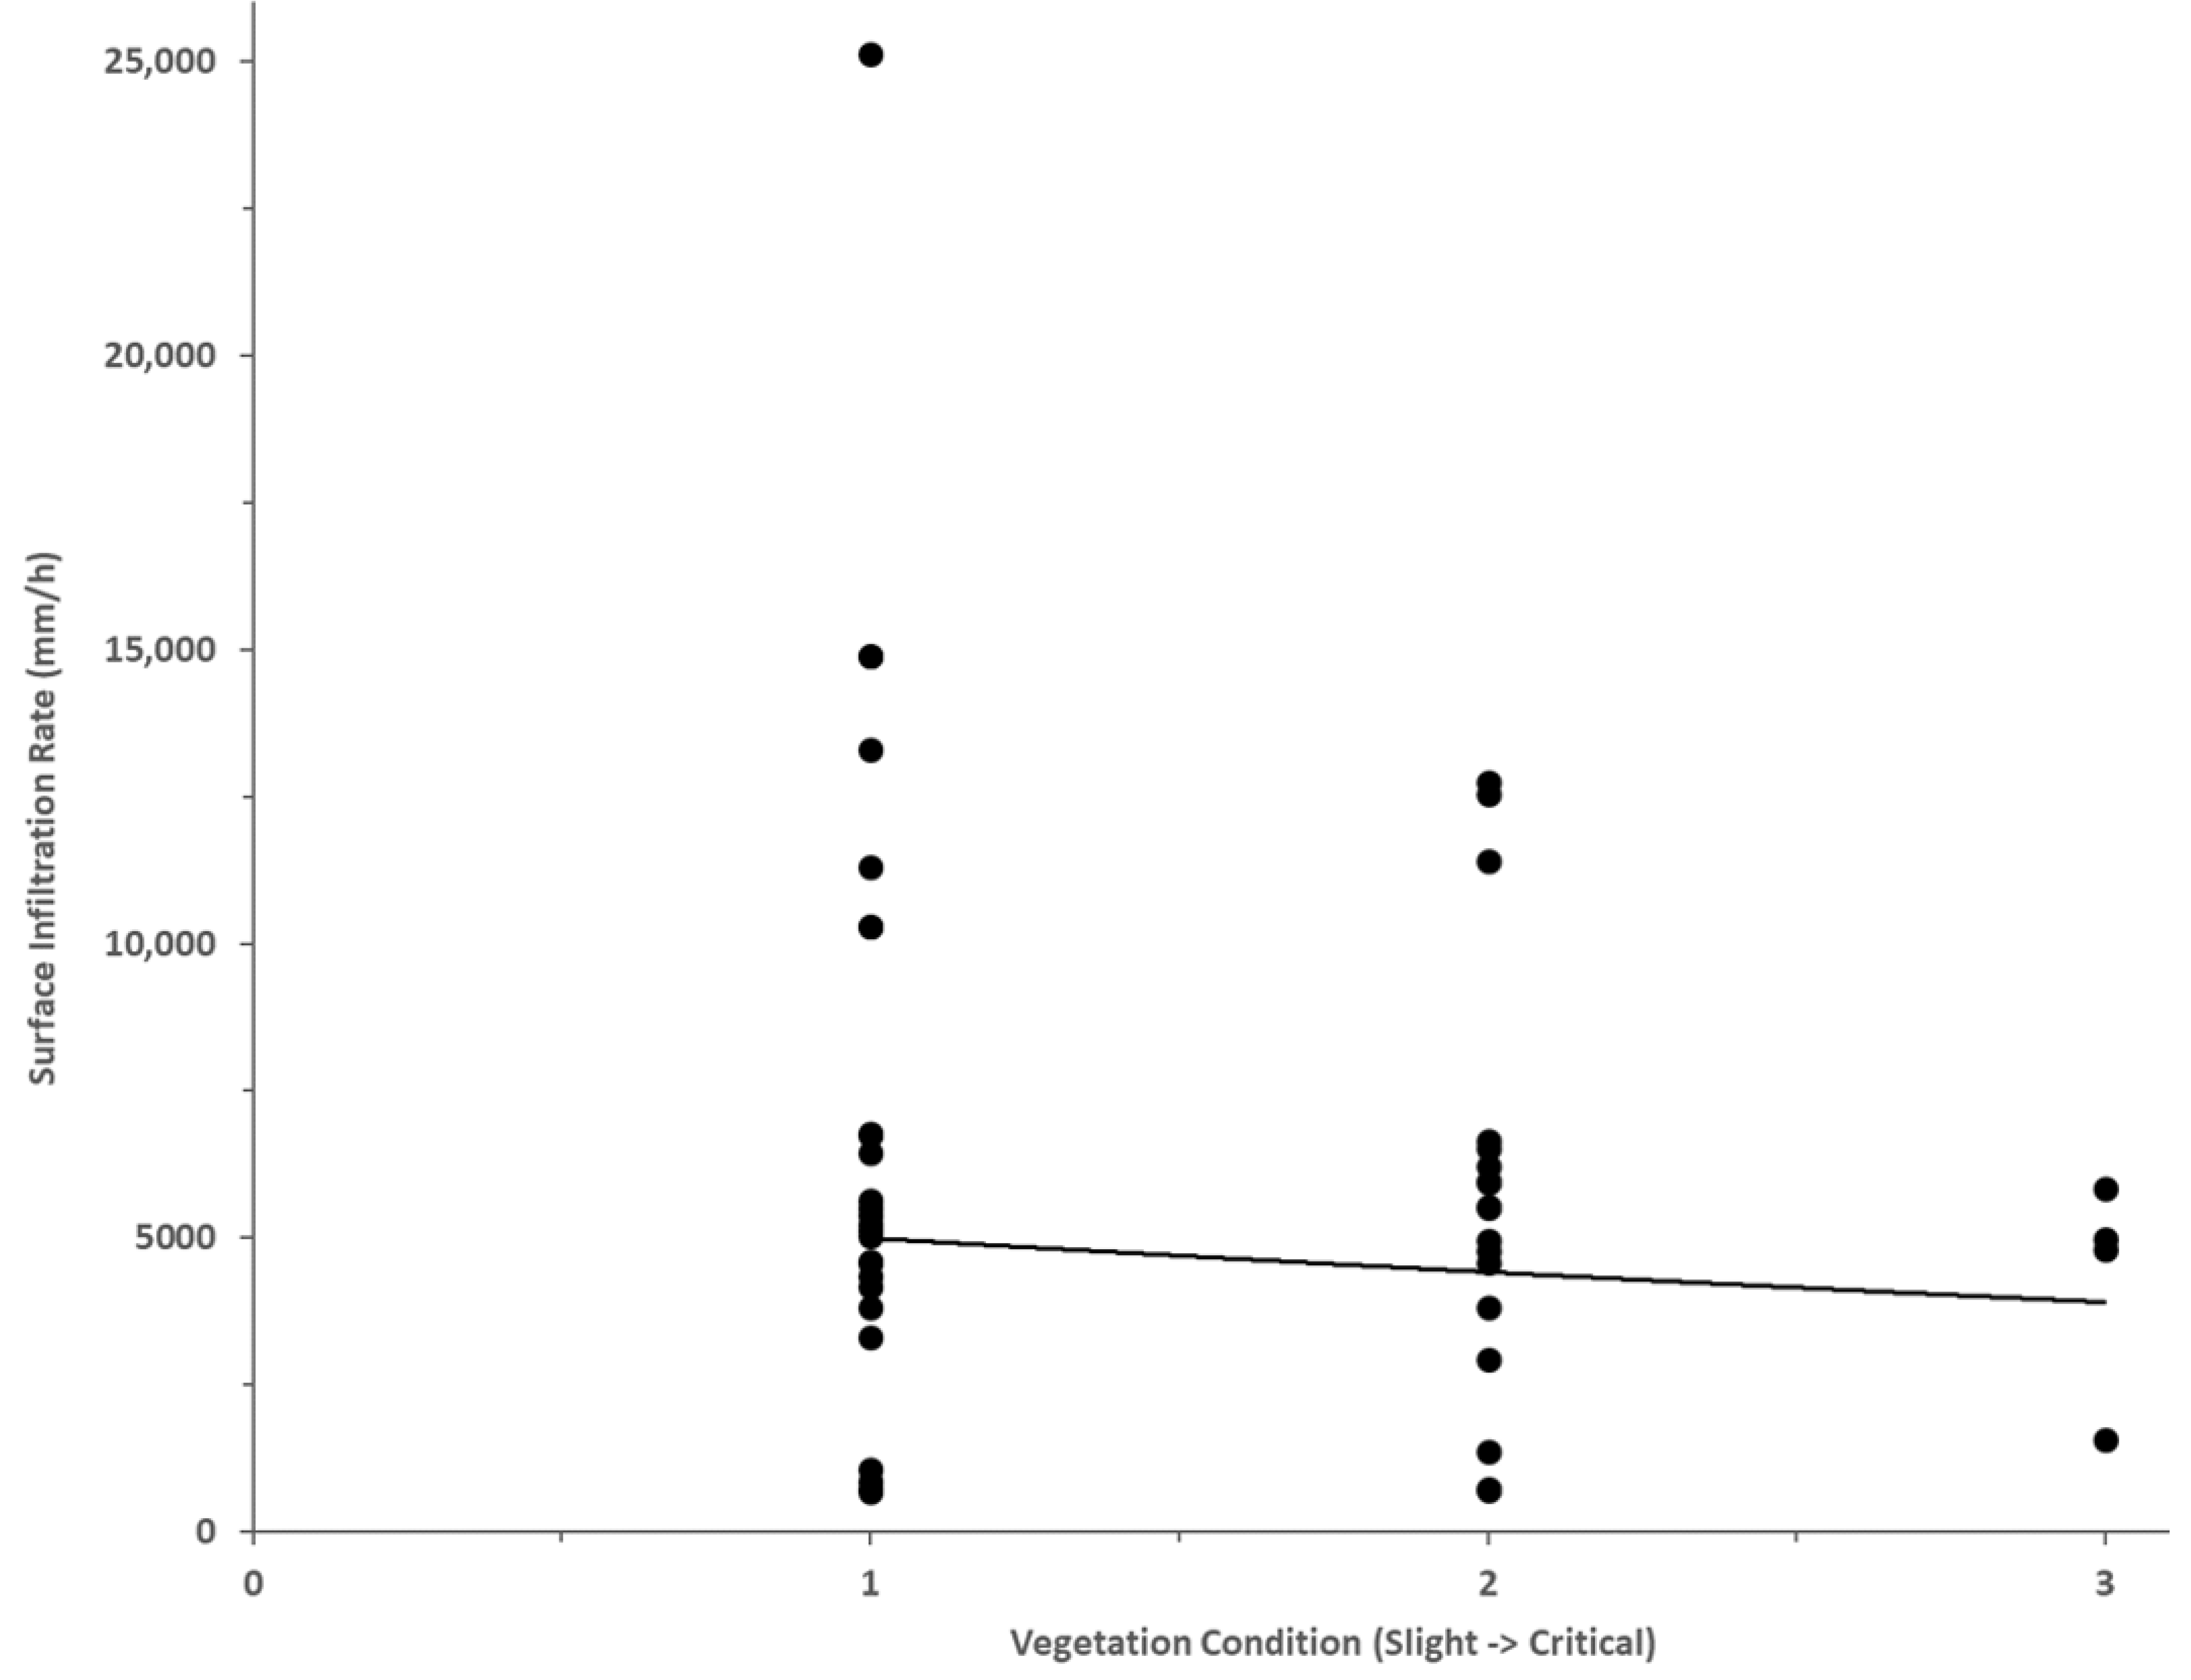
Effect of slope of pavement: Figure 6 plots the infiltration of PICPs against the slope of the pavement. Note that the slope was measured by eye-estimate and given a rating that ranged from flat/gentle (rating = 1), medium (rating = 2) and steep (rating = 3), a form of classification that may have exacerbated the scatter. In addition, 4–7 year old pavements were selected for this plot because this was the range where the amount of data was the largest. In the figure, the callout labels show the age of the pavers. The figure shows that infiltration is higher where the slope is medium/steep compared with a flat/medium slope. This may be explained by a self-cleaning effect where debris that would otherwise clog pavements are more easily washed/blown away off steeper slopes.
Effect of vegetation overhang: Vegetation overhanging a pavement could influence the infiltration through the pavement as more debris maybe expected to fall on the pavement. While testing in the field, vegetation overhang was estimated based on the number of surrounding trees and whether leaves were observed on the pavers and between the gaps in the pavers. It was rated as 1 for no/light overhang, through to 3 for heavy vegetation overhang.
The result plotted in Figure 7 shows that vegetation also affects the infiltration rate of PICPs, which is higher for lightly covered pavements. It should be noted that the infiltration rates are high despite the presence of overhang, with locations with heavy overhang of vegetation recording up to 6000 mm/h.
Effect of saturation: One of the concerns of PICPS is the expected reduced infiltration rate over periods of extended rainfall. This can occur as the subgrade, base course and bedding layer, and ground beneath the PICPs becomes saturated. The infiltration rate of PICPs decreased over time during extended infiltration testing and continuous rainfall (Razzaghmanesh and Beecham [30]). Infiltration testing conducted by Borgwardt [11] applied a modified SRIT method with sprinklers to simulate rainfall of constant intensity. The results showed a characteristic trend of high values at the beginning of the test, a non-linear reduction over time and an asymptotic constant infiltration rate towards the end, corresponding with the system under fully-saturated conditions.
In this study a series of test were carried out in order to assess how infiltration rates reduce over an extended period, to assess the impact of substructure saturation. These tests were carried out using the SRIT method at 8 locations where HydroSTON PICPs are installed. At each site, the SRIT test was carried out at the same spot five consecutive times at 30-min intervals apart.
The greatest reduction in PICP infiltration rates occurred at the residential driveway of 186 Wooloware Roadd, Burraneer, with a change of 1571 mm/h between the first and fifth repetition, or a 12% reduction (Figure 8). The greatest percentage reduction was found at the footpath entrance of Newington College, Stanmore, with a 63% reduction in infiltration rate observed. These results are consistent with the conclusions presented by Boogaard et al. [17], Razzaghmanesh and Beecham [30], and Borgwardt [11], that the PICP infiltration rates decline with time during extended testing due to saturation of the system. The test shows that the drop in infiltration can be high, and possibly explain some of the scatter observed in Figure 2.
All locations tested showed a similar trend and the reduction in infiltration rates can be represented by the nonlinear regression trendline. The high R2 shows the trendline fits the data well. It can be seen that there are differences in the rate of change between most of the sites. This is due to the differing substructure and subgrade properties at the sites. Sites that showed little change (such as Alice Street, Turramurra) were likely constructed over open or uniformly graded base layers over a well-draining subgrade. Sites that show significant early changes (such as both Newington College sites) are likely more densely graded. The Concrete Masonry Association of Australia [31] advises the use of open-graded bases for PICPs trafficked by cars and uniformly graded for pedestrian-only traffic. Therefore, it is more likely that the infiltration rate changes observed at the Newington College sites are the result of a low permeability subgrade, as both test locations were built for different loadings (one site is a car park and the other a footpath) and installed several years apart. An analysis of the pavement’s substructure would be required to evaluate these findings, which is beyond the scope of this current study.
The results of the repeated SRIT method conducted in this study show a similar characteristic trend as Borgwardt [11], although no asymptotic constant infiltration rate was observed because the saturation point had not been reached. It is expected that PICPs will be in a fully saturated condition during a storm event. Therefore, the saturated infiltration rate, obtained through continuous or repeated infiltration tests, gives a more realistic appraisal and should be considered when designing PICPs.

3.4. Prediction Limits

Prediction limits were derived based on the data collected in this study and by Lucke et al. [14]. These were determined by assuming that (a) the data can be fitted with a power function (equivalent to a straight-line fit on the logarithms of the data points), and (b) the distribution of points about the fitted line is normal. A total of 90% and 95% of measurements of infiltration rates and wetted bricks, respectively, should fall above the two prediction lines shown in Figure 9.
Figure 9 relates the infiltration rates to the number of wet bricks, which in turn is related to the area of the paved surface. If a suitable infiltration rate of PICPS for design purposes is defined, then, based on the 90% or 95% limits, the paved area can be determined. Furthermore, if there is an adjoining catchment that flows onto the paved surface, then the required infiltration rate can be adjusted to allow the infiltration of runoff from both the catchment and paved surface.
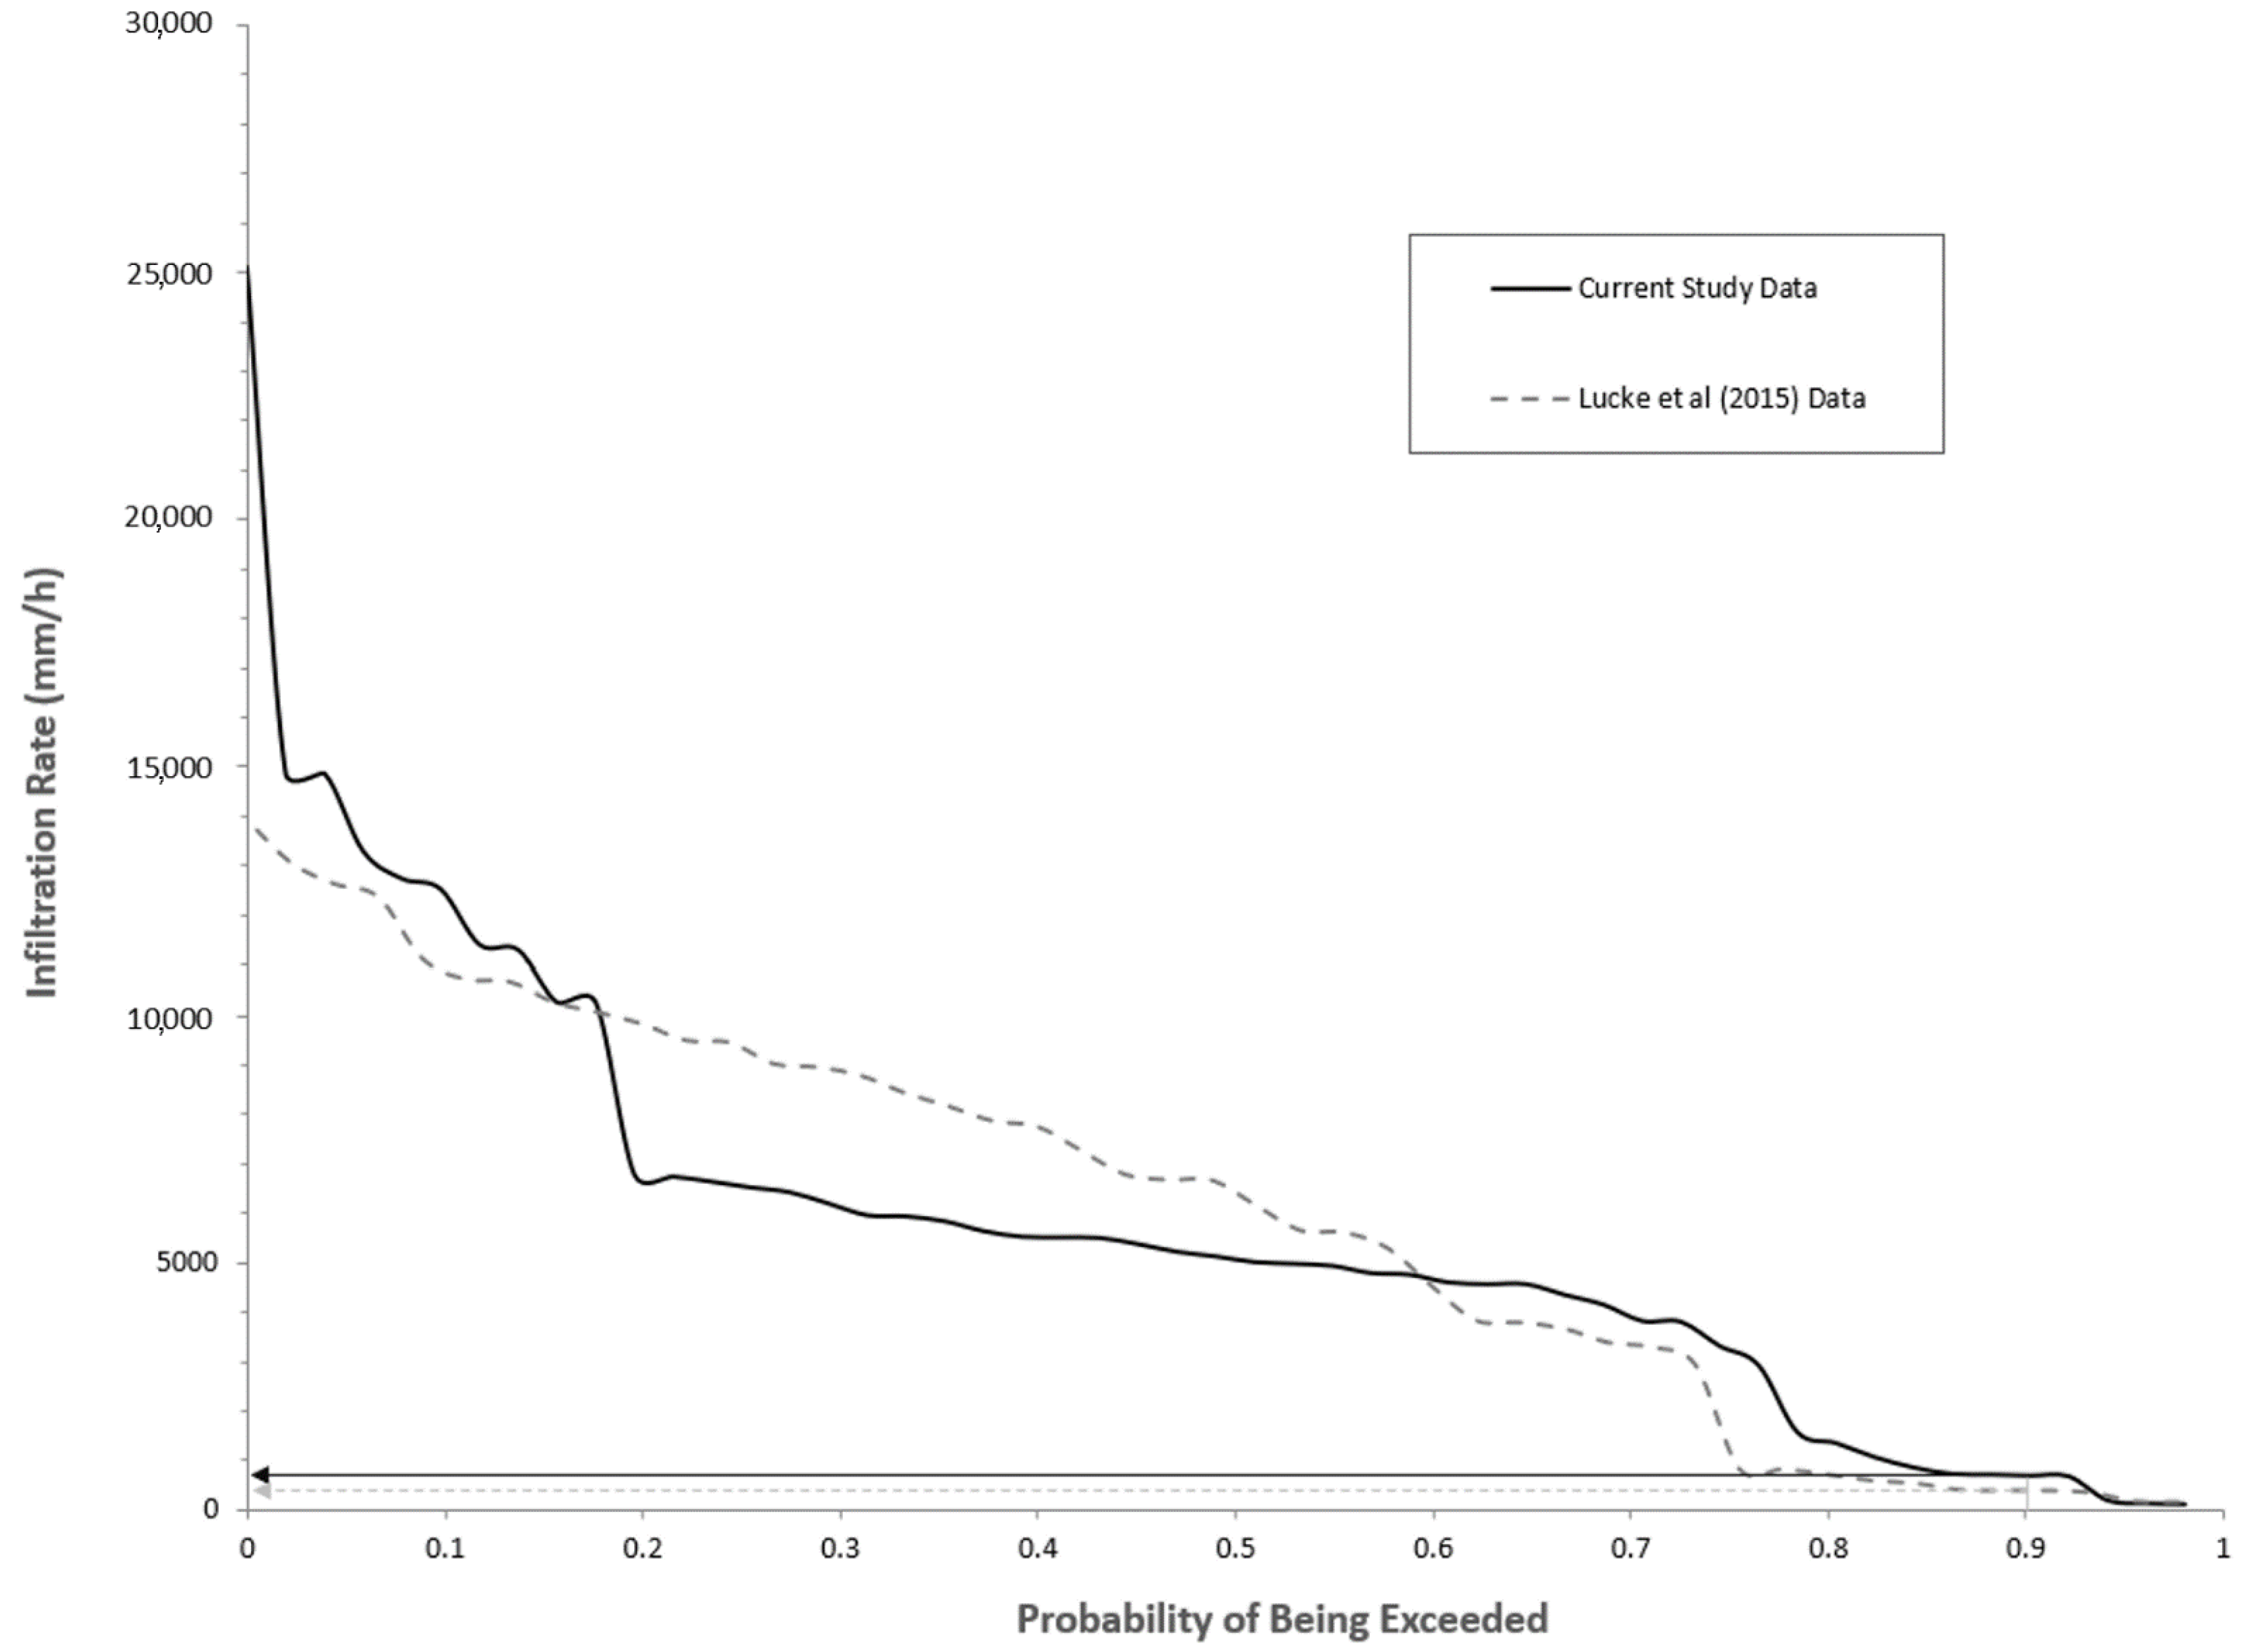
This raises the question about an infiltration rate suitable for the design of PICPs and if it can be derived from all of the data collected. Tests show that all of the sites provide very high infiltration rates, with the lowest being approximately 125 mm/h for both the current study and the study of Lucke et al. [14]. This, at least, provides an empirical basis for choosing an infiltration rate for the design of PICPs. Further guidance on the infiltration rate for design can be obtained by exploring the probability of exceedance of the data, see Figure 10. Taking the infiltration rate that is exceeded in 90% of cases, the data collected in this study gives a value of 700 mm/h and Lucke et al.’s [14] data gives 400 mm/h. Both of these are high infiltration rates. Based on this, the lower value of 400 mm/h could be assumed for design purposes, based on field measurements in the Sunshine Coast, Sydney and Wollongong.
Evaluating the performance of PICPs has been a subject of debate and contributed to the lack of an Australian standard. In this study field measurements were conducted to determine the infiltration capacity of PICPs. The infiltration rate of PICPs collected from field tests varied over a relatively high range from 125 to 25,000 mm/h under various conditions. The latter was a measurement obtained in this study. Field test results obtained indicated that PICPs retain their permeability effectively over extended periods. Age, slope and vegetation affect the infiltration of PICPs and display expected trends despite scattering in the data. Although the difference in infiltration rates for different type of usage were noted, PICPs still perform well under high traffic loads.

4. Conclusions

In the past, measurement of field infiltration rates has been problematic due to difficulties in applying proper methods of testing, access to laboratories to perform tests, and time and cost constraints on tests. The study shows that SWIFT and SRIT results correlate reasonably well, validating the use of the simpler SWIFT method. SWIFT tests can be performed easily, providing a simple and cost-effective way of estimating infiltration. Property owners or council staff can easily perform this test and obtain an instant estimation of the condition of pavers and, if desired, determine maintenance.
Repeated infiltration testing over a short period supports the characteristic trend that the rate of infiltration through PICPs decreases non-linearly as the system becomes saturated. This change in infiltration rate is dependent on the gradation of the base/sub-base layer and condition of the subgrade. In the extreme case, the infiltration rate was observed to decrease by more than 50% over the course of the repeated testing. Therefore, the infiltration rate under fully saturated conditions should be considered when designing PICPs.
In summary, the use of PICPs is one of the effective approaches to improve runoff water quality, reduce surface runoff in urban catchments and help mimic the natural hydrological cycle impacted by urbanization, and PICPs are suggested in many documents issued by the NSW Government and councils. This paper has focused on evaluating the infiltration rate and parameters that affect the long-term performance of PICPs. The study focused on the greater Sydney region. Similar data from more regions around the world will better define and consolidate the findings in this study. The effects of clogging and quality maintenance programs, the characteristics of the sub-grade and how extended periods of rainfall might influence the infiltration rate of PICPs, while conducted in this study in a limited sense, should be assessed in more detail through further research.

Supplementary Materials

The following are available online at https://www.mdpi.com/article/10.3390/w14142143/s1, Figure S1: Testing locations shown on local council boundaries, Figure S2: Types of pavers used; HydroSTON [22] and Ecotrihex [23]; Figure S3: Substructure of PICPs, HydroSTON, [22]; Figure S4: SWIFT method and equipment used for on-site tests; Table S1: Location and characteristics of test sites. References [14,21,22,23,32] are cited in the Supplementary Materials.

Author Contributions

Conceptualization, J.K.; methodology, J.K.; formal analysis, N.P.T.N., A.S.; investigation, N.P.T.N., A.S.; resources, J.K.; data curation, N.P.T.N., A.S.; writing—original draft preparation, N.P.T.N., A.S.; writing—review and editing, N.A., J.K.; supervision, J.K.; project administration, J.K. All authors have read and agreed to the published version of the manuscript.

Funding

This research received no external funding.

Data Availability Statement

Data collected in this study are available at PICPS Test Data.xlsx.

Acknowledgments

The authors would like to thanks UTS BE students who undertook the collection of data in this study as part of their BE capstone project. They are Roel Ten Cate, Andy Vo and Edwin Wong. We also thank Wiebke Benze von Fritz from HydroCon for her assistance.

Conflicts of Interest

The authors declare no conflict of interest.

References

  1. Pratt, C.; Mantle, J.; Schofield, P. UK Research Into the Performance of Permeable Pavement, Reservoir Structures in Controlling Stormwater Discharge Quantity and Quality. Water Sci. Technol. 1995, 32, 63–69. [Google Scholar] [CrossRef]
  2. Eisenberg, B.; Lindow, K.; Smith, D. (Eds.) Permeable Pavements, Permeable Pavements Task Committee; American Society of Civil Engineers: Reston, VA, USA, 2015.
  3. Pearson, A.R.; Shackel, B. Concrete segmental pavements aesthetic and performance solutions. In Proceedings of the 5th International Conference on Concrete Block Paving, Tel-Aviv, Israel, 23–27 June 1996; pp. 669–678. [Google Scholar]
  4. Bean, E.Z.; Hunt, W.F.; Bidelspach, D.A.; Smith, J.E. Evaluation of Four Permeable Pavement Sites in Eastern North Carolina for Runoff Reduction and Water Quality Impacts. J. Irrig. Drain. Eng. 2007, 133, 583–592. [Google Scholar] [CrossRef]
  5. Winston, R.; Al-Rubaei, A.; Blecken, G.; Hunt, W. A Simple Infiltration Test for Determination of Permeable Pavement Maintenance Needs. J. Environ. Eng. 2016, 142, 06016005. [Google Scholar] [CrossRef]
  6. Collins, K.A.; Hunt, W.F.; Hathaway, J.M. Hydrologic Comparison of Four Types of Permeable Pavement and Standard Asphalt in Eastern North Carolina. J. Hydrol. Eng. 2008, 13, 1146–1157. [Google Scholar] [CrossRef]
  7. Drake, J.; Bradford, A.; Marsalek, J. Review of environmental performance of permeable pavement systems: State of the knowledge. Water Qual. Res. J. 2013, 48, 203–222. [Google Scholar] [CrossRef]
  8. Valeo, C.; Gupta, R. Determining Surface Infiltration Rate of Permeable Pavements with Digital Imaging. Water 2018, 10, 133. [Google Scholar] [CrossRef] [Green Version]
  9. Dierkes, C.; Kuhlmann, J.; Kandasamy, J.; Angelis, G. Pollution Retention Capability and Maintenance of Permeable Pavements. In Proceedings of the 7th International Conference on Urban Drainage, Portland, OR, USA, 8–13 September 2002. [Google Scholar]
  10. Boogaard, F.; Lucke, T.; van de Giesen, N.; van de Ven, F. Evaluating the Infiltration Performance of Eight Dutch Permeable Pavements Using a New Full-scale Infiltration Testing Method. Water 2014, 6, 2070–2083. [Google Scholar] [CrossRef]
  11. Borgwardt, S. Long Term In-Situ Infiltration Performance of Permeable Concrete Block Pavement. In Proceedings of the 8th International Conference on Concrete Block Paving, San Francisco, CA, USA, 8–11 September 2015. [Google Scholar]
  12. Cipolla, S.; Maglionico, M.; Stojkov, I. Experimental Infiltration Tests on Existing Permeable Pavement Surfaces. CLEAN—Soil Air Water 2015, 44, 89–95. [Google Scholar] [CrossRef]
  13. Sañudo-Fontaneda, L.; Andres-Valeri, V.; Costales-Campa, C.; Cabezon-Jimenez, I.; Cadenas-Fernandez, F. The Long-Term Hydrological Performance of Permeable Pavement Systems in Northern Spain: An Approach to the “End-of-Life” Concept. Water 2018, 10, 497. [Google Scholar] [CrossRef] [Green Version]
  14. Lucke, T.; White, R.; Nichols, P.; Borgwardt, S. A Simple Field Test to Evaluate the Maintenance Requirements of Permeable Interlocking Concrete Pavements. Water 2015, 7, 2542–2554. [Google Scholar] [CrossRef] [Green Version]
  15. Beecham, S.; Pezzaniti, D.; Myers, B.; Shackel, B.; Pearson, A. Experience In The Application of Permeable Interlocking Concrete Paving in Australia. In Proceedings of the 9th International Conference on Concrete Block Paving, Buenos Aires, Argentina, Argentinean Concrete Block Association (AAHB), Buenos Aires, Argentina, 18–21 October 2009; Argentinean Portland Cement Institute (ICPA) Small Element Paving Technologists (SEPT): Buenos Aires, Argentina. [Google Scholar]
  16. Shackel, B. The Design, Construction and Evaluation of Permeable Pavements in Australia. In Proceedings of the 24th ARRB Conference: Celebrating 50 years of Road and Transport Research 2010, Melbourne, VIC, Australia, 12–15 October 2010. [Google Scholar]
  17. Boogaard, F.; Lucke, T. Long-Term Infiltration Performance Evaluation of Dutch Permeable Pavements Using the Full-Scale Infiltration Method. Water 2019, 11, 320. [Google Scholar] [CrossRef] [Green Version]
  18. Johnson, T.; King, R. Experience with Pervious Paving. In Proceedings of the 6th Australian National Conference on Urban Water Management: New Frontiers into the Next Decade, Virtually, 13–16 April 2021. [Google Scholar]
  19. Ku-ring-gai Council. Current Projects and Priorities, Water Smart Rebates. 2018. Available online: https://www.kmc.nsw.gov.au/Current_projects_priorities/Key_priorities/Environment_sustainability/Our_community_programs/Water_Smart/Water_Smart_rebates (accessed on 20 May 2019).
  20. Moktan, B. Understanding the Design and Approval Process of Permeable Pavements in Australia, Engineering Graduate Project; University of Technology: Sydney, Australia, 2018; pp. 6–10. [Google Scholar]
  21. C1781/C1781M-14a; Standard Test Method for Surface Infiltration Rate of Permeable Unit Pavement Systems. ASTM International: West Conshohocken, PA, USA, 2014.
  22. HydroSTON 2016, Designs and Specification, Sydney. Available online: https://hydroston.com.au/specifications/ (accessed on 4 April 2019).
  23. Adbri Masonry. Types of Pavers: Ecotrihex, Sydney. 2019. Available online: https://www.adbrimasonry.com.au/commercials/paving/industrial-paving/ecotrihex-2 (accessed on 4 April 2019).
  24. Current Results. Sydney-Extreme Daily Rainfall for Each Year. Current Results Weather and Science Facts (2022). Available online: https://www.currentresults.com/Yearly-Weather/Australia/NSW/Sydney/extreme-annual-sydney-precipitation.php (accessed on 8 June 2022).
  25. Brown, C.; Chu, A.; van Duin, B.; Valeo, C. Characteristics of Sediment Removal in Two Types of Permeable Pavement. Water Qual. Res. J. 2009, 44, 59–70. [Google Scholar] [CrossRef] [Green Version]
  26. NSW Department of Planning and Environment. Apartment Design Guide; NSW Department of Planning and Environment: Sydney, Australia, 2015; ISBN 978-0-7313-3676-0.
  27. NSW Department of Planning and Environment. New England North West Regional Plan, Sydney, Australia. 2018. Available online: https://www.planning.nsw.gov.au/Plans-for-your-area/Regional-Plans/New-England-North-West/Draft-New-England-North-West-Regional-Plan/Protected-water-environment-and-heritage?acc_section=direction_5_1_-_manage_water_resources_for_a_growing_economy_and_environmental_sustainability (accessed on 28 August 2018).
  28. City of Botany Bay. Development Control Plan 2013, Stormwater Management Technical Guidelines, Sydney, Australia. Available online: https://www.bayside.nsw.gov.au/sites/default/files/2018-01/Part-10-Stormwater-Mgmt-Tech-Guidelines_Amd8_A09081_E050917.pdf (accessed on 3 June 2019).
  29. Blacktown City Council, Water Sensitive Urban Design (WSUD) Standard Drawings, Plan & Build, Stage 2—Plans and Guidelines, Developers Toolkits for Water Sensitive Urban Design (WSUD). 2017. Available online: https://www.blacktown.nsw.gov.au/Plan-build/Stage-2-plans-and-guidelines/Developers-toolkit-for-water-sensitive-urban-design-WSUD/Water-sensitive-urban-design-WSUD-standard-drawings (accessed on 3 November 2019).
  30. Razzaghmanesh, M.; Beecham, S. A Review of Permeable Pavement Clogging Investigations and Recommended Maintenance Regimes. Water 2018, 10, 337. [Google Scholar] [CrossRef] [Green Version]
  31. Concrete and Masonry Association of Australia. Permeable Interlocking Concrete Pavements—Design and Construction Guide; Concrete and Masonry Association of Australia: Sydney, Australia, 2010. [Google Scholar]
  32. NSW Roads & Maritime Services. Test Method T377, Water Permeability of no Fines Concrete (Falling Head Laboratory Permeameter); RMS NSW Government: Sydney, Australia, 2016.
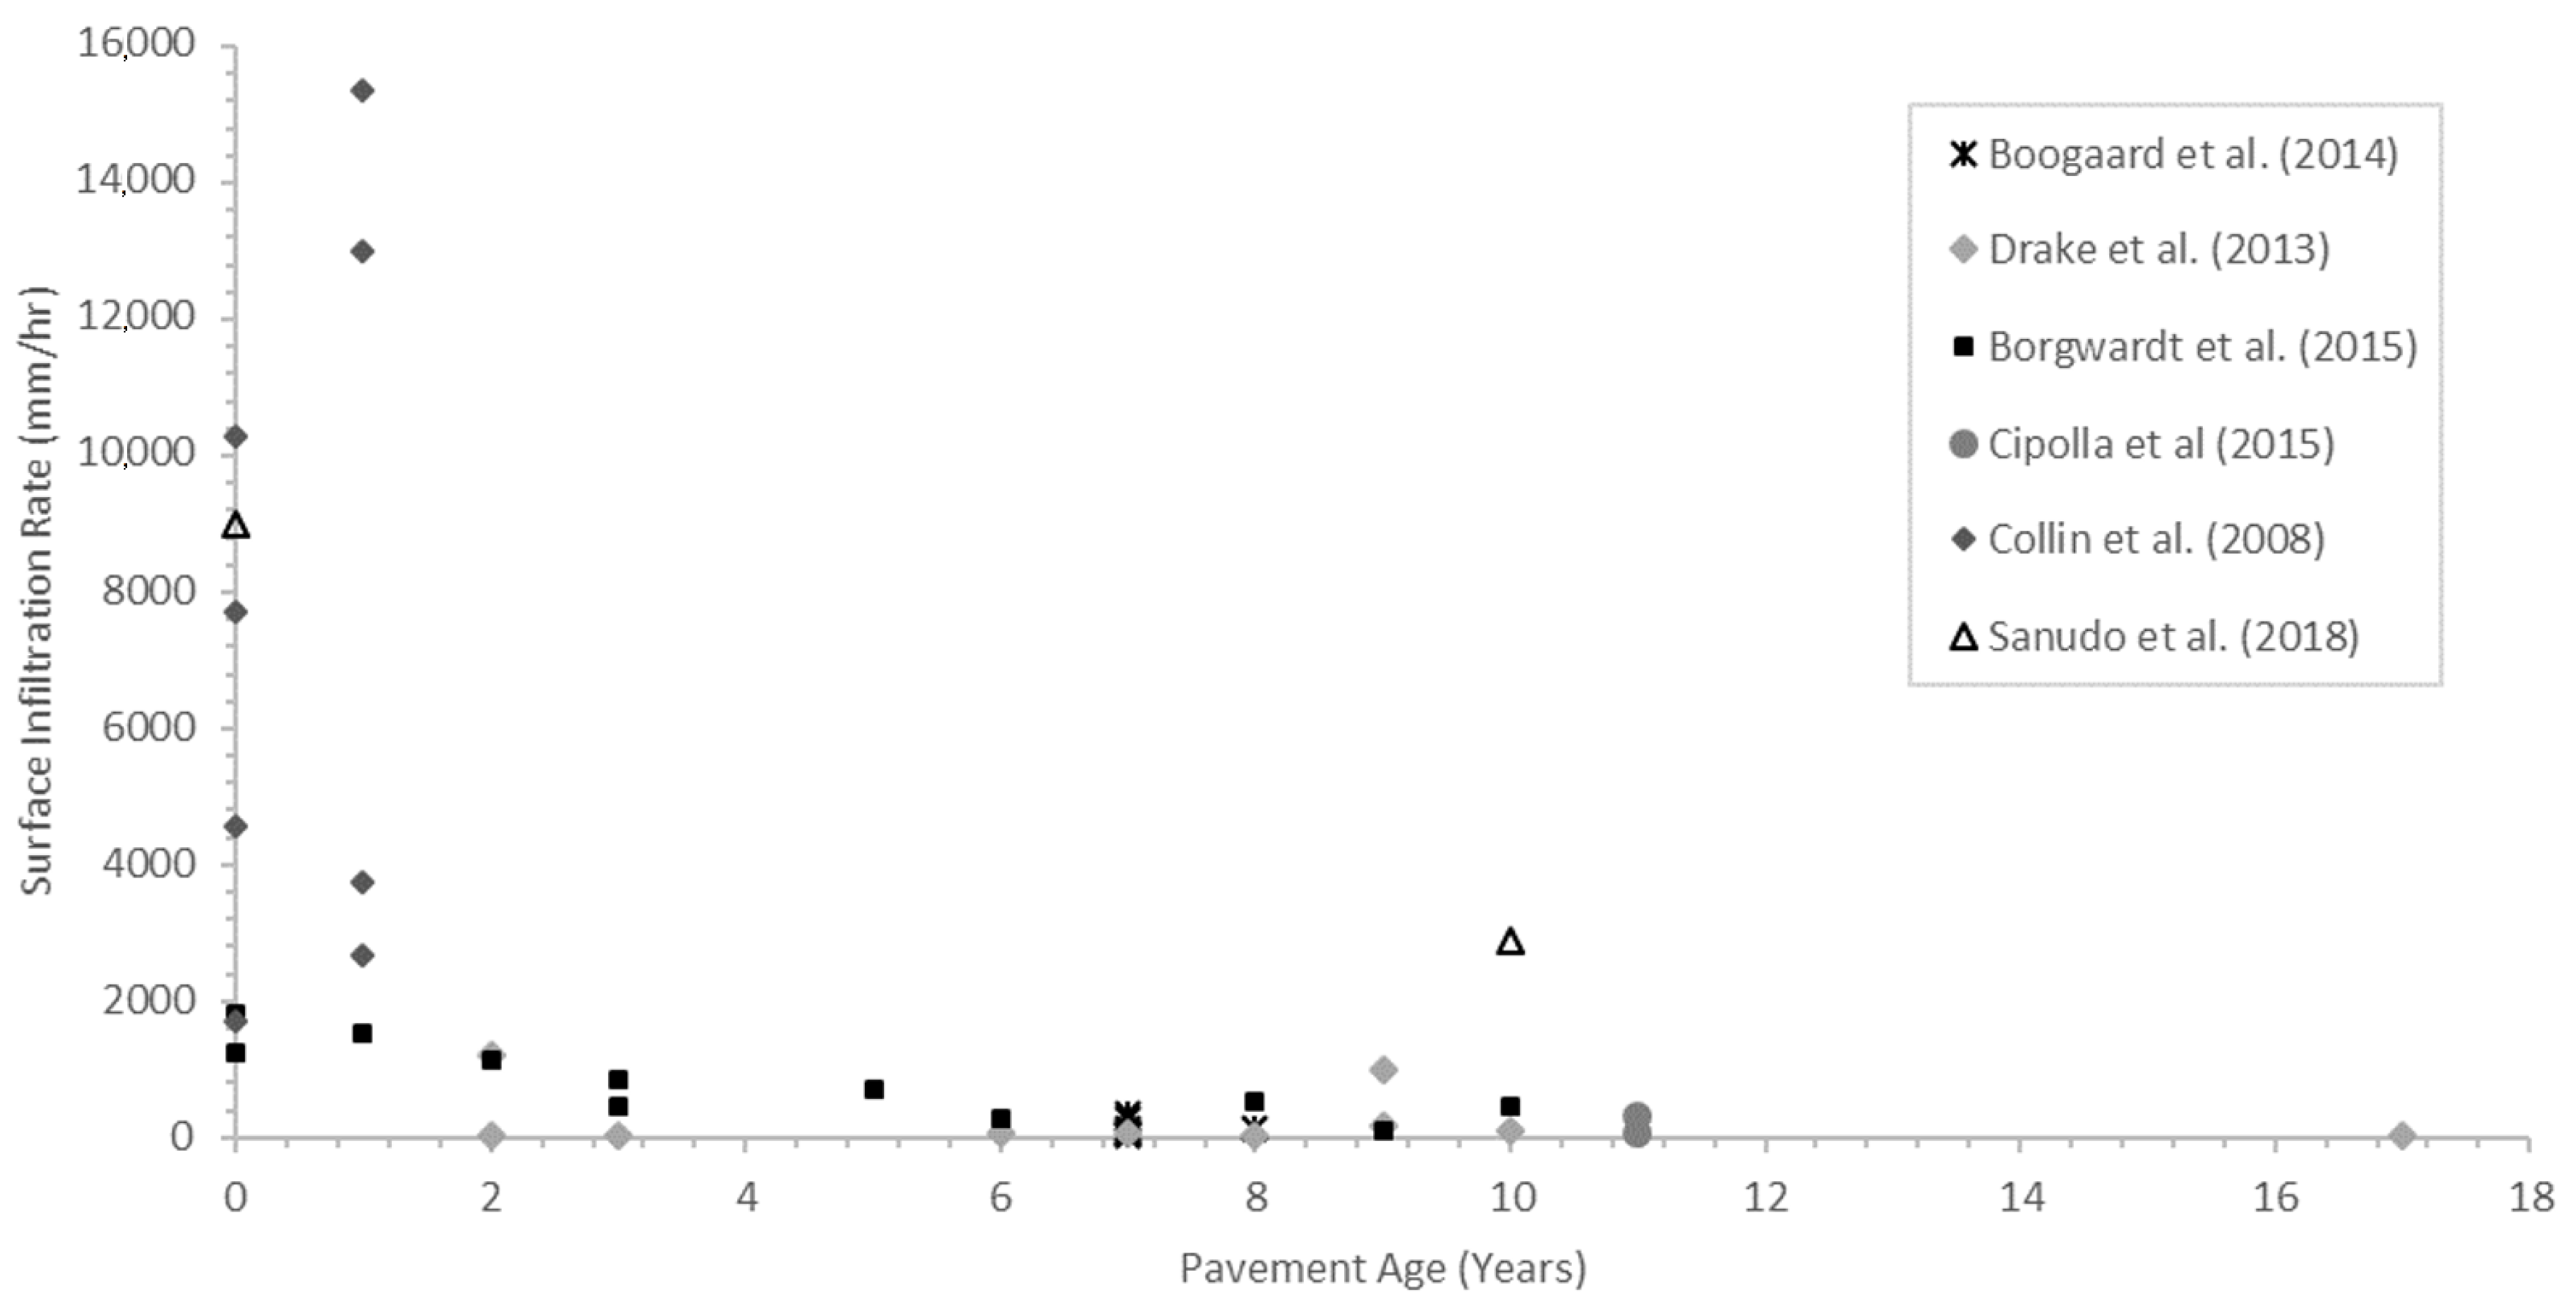
Figure 1. Surface infiltration rate versus age of PICPs (non-porous), as recorded in various past studies. (Collin et al. [6], Drake et al. [7], Boogaard et al. [10], Borgwardt et al. [11], Cipolla et al. [12], and Sañudo-Fontaneda et al. [13]).
Water 14 02143 g001
Figure 2. Comparison of PICP infiltration rates using SRIT and SWIFT tests. Data from current study and Lucke et al. [14].
Water 14 02143 g002
Figure 3. Infiltration rate versus the age of PICPs with both porous and non-porous pavers.
Water 14 02143 g003
Figure 4. Infiltration rate versus age of pavement for all field measurements conducted in this study.
Water 14 02143 g004
Figure 5. Infiltration rate of pavers under different usage.
Water 14 02143 g005
Figure 6. Infiltration rate versus slope of pavement. The age of the pavement is between 4 and 7 years old. The call-out boxes show the age of the pavement.
Water 14 02143 g006
Figure 7. Infiltration rate versus vegetation cover.
Water 14 02143 g007
Figure 8. Infiltration rate verses the number of SRIT tests carried out.
Water 14 02143 g008
Figure 9. The data obtained in the present study fitted with a power distribution together with 90% and 95% prediction limits.
Water 14 02143 g009
Figure 10. Probability of the infiltration rate being exceeded based on all data collected in this study and data from Lucke et al. [14].
Water 14 02143 g010
Table 1. Degree of blockage of PICPS and related infiltration rates based on Lucke et al. [14].
Degree of BlockageFree of BlockageMedium BlockageComplete Blockage
Infiltration Rate (mm/h)>200030–2000<30
Table 2. Tests at different locations in Newington School car park.
Test NoNumber of Wet BricksUsageInfiltration Rate (mm/h)Degree of Blockage *Age in Years
R1618Driveway1362Medium Blockage10
R1717Parking bay4772Free of blockage10
R1817Parking bay5654Free of blockage10
R1924Driveway3326Free of blockage10
R2060Driveway870Medium Blockage10
* See Table 1 for degree of blockage.
Publisher’s Note: MDPI stays neutral with regard to jurisdictional claims in published maps and institutional affiliations.