1. Introduction
Flash floods are among the deadliest natural disasters in the world, responsible for 85% of inundations and a high death rate of more than 5000 people lost each year [
1]. Egypt has experienced many flash floods with loss of life and serious damage to vital infrastructure and buildings, especially in the Sinai, the north coast and the Red Sea coast. Well-known examples are the 1979 flash flood in El-Quseir and Marsa Alam, which killed 19 and destroyed a coastal road along the Red Sea, the flash flood in Marsa Alam in 1991, the flash flood in Alexandria in 1993, which killed 21, and the flash flooding in Assiut in November 1994 resulting in loss of life and infrastructure [
2]. Recently, in 26–27 October 2016, heavy rainfall in Ras Gharib on the Red Sea coast resulted in flash flooding that killed dozens and caused damage to infrastructure and property [
3]. On 14 November 2019, heavy rains led to flooding in wadi El-Sukkari and further to the Idfu-Marsa Alam Road, fortunately without losses [
4].
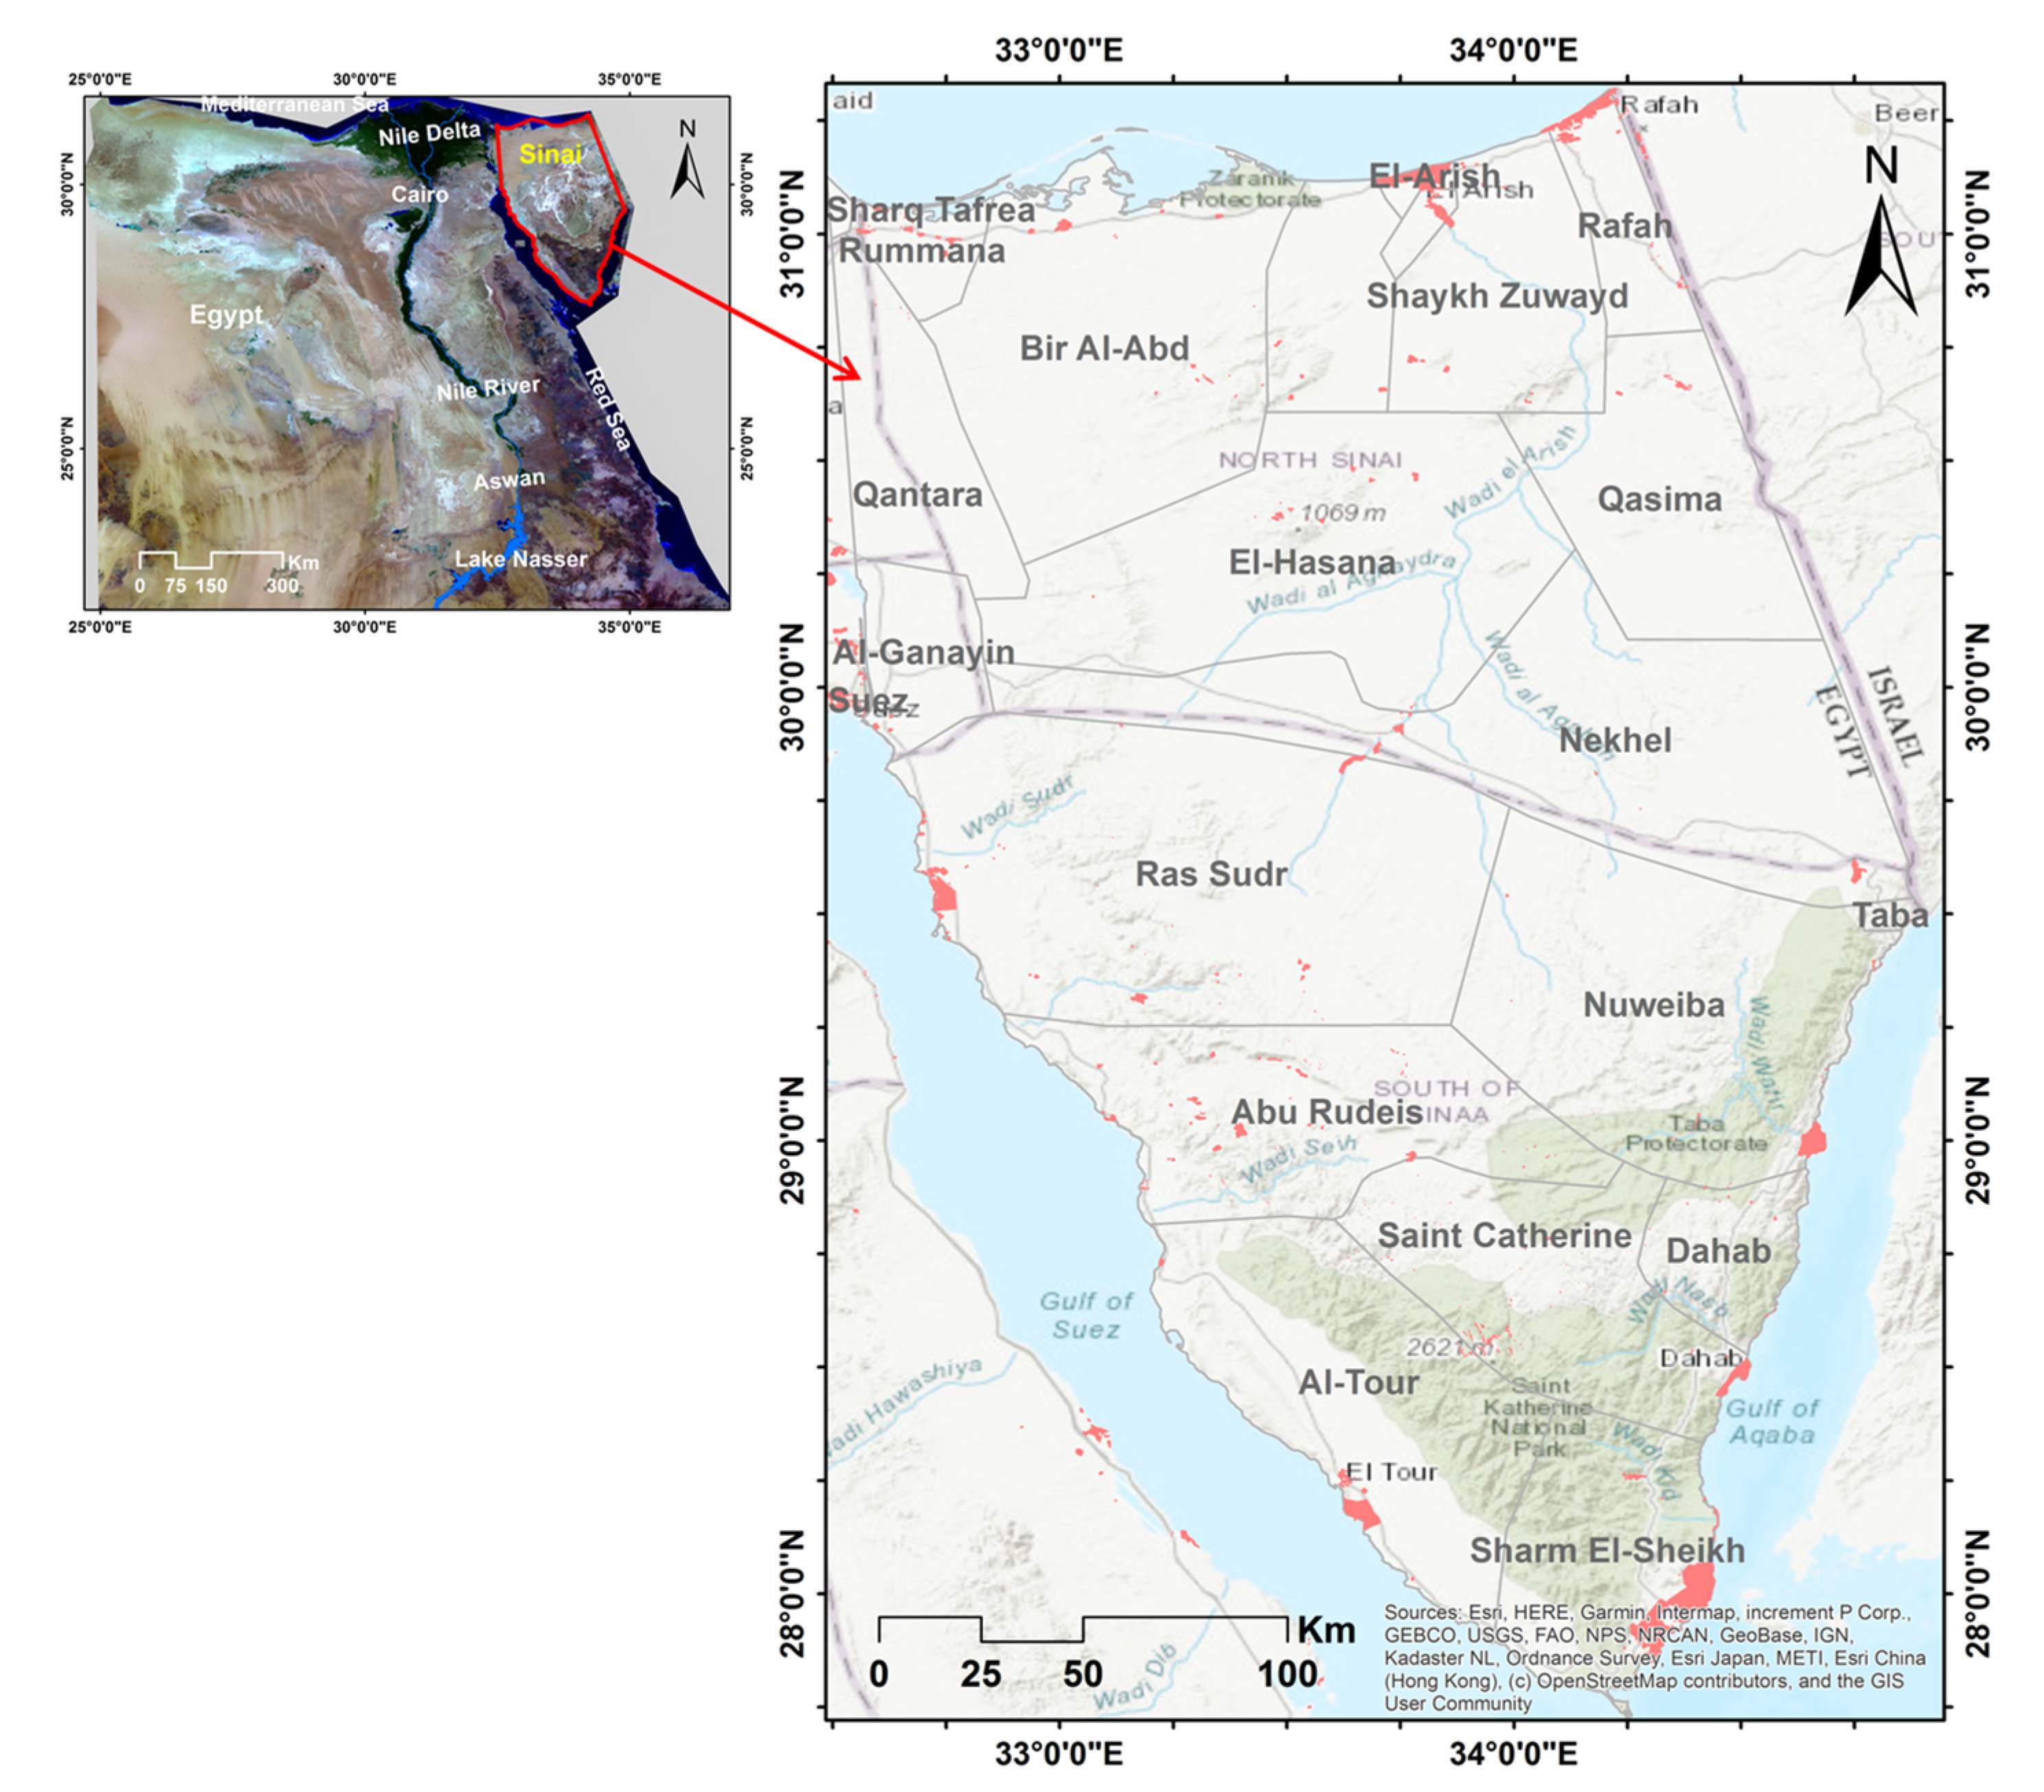
Sinai in particular is a flood-prone area where flash floods cause significant damage to infrastructure, displacement of populations and sometimes loss of life. An overview of major floods in the Sinai in the past is given by Abdel-Fattah et al. [
5] and Omran [
6]. Most devastating was the severe flooding in Wadi El-Arish on 17–18 January 2010, which resulted in six deaths and dozens of injuries and vital infrastructure and hundreds of houses destroyed [
7]. Cools et al. [
8] reported that out of 20 significant rainfall events over a 30-year period (1979–2010) in wadi Watir, located in Southeast Sinai, nine resulted in flash flooding, some of which caused severe damage to the coastal road between Nuweiba and Taba, which was completely washed away in some parts. More recently, a catastrophic flash flood in October 2016 caused many deaths and injuries and damage to roads and buildings in wadi Dahab in South Sinai [
9]. El-Fakharany and Mansour [
10] discussed dangerous flash flood locations in southern Sinai, including the wadis Werdan, Sedri, El-Aawag and Feiran.
Reliable and accurate data on flash flooding in arid environments are often lacking due to the remoteness and sparse habitation of such areas. Therefore, morphometric analyzes are often used instead to analyze the drainage behavior of such areas. Quantitative measurements of the geometrical features of drainage basins, such as basin size and shape, drainage network and relief form the basis of hydro-morphometric analysis as set forth in the classical works of Horton [
11,
12], Smith [
13], Strahler [
14,
15] and Schumm [
16]. Since the development of remote sensing (RS) and geographic information systems (GIS), hydro-morphological parameters can be easily obtained.
A comprehensive overview of past developments in the analysis of flood risk assessment has been provided by Diaconu et al. [
17]. An overview of flash flood risk assessment based on morphometric analyses has been provided by Ali et al. [
18], discussing flash flood hazard vulnerability and risk assessment approaches, uncertainties and challenges. Notable recent studies are as follows. Farhan et al. [
19] presented a morphometric analysis and flash floods assessment for drainage basins of the Ras En Naqb Area, South Jordan. Mahmood and Rahman [
20] studied the flash flood susceptibility modeling using geomorphometric and hydrological approaches in Panjkora Basin, Eastern Hindu Kush, Pakistan. Mahmood and Rahman [
21] modeled the flash flood susceptibility using a geomorphometric ranking approach in the Ushairy Basin, in eastern Hindu Kush, Pakistan. Bhat et al. [
22] presented a flood hazard assessment of the upper Jhelum basin using morphometric parameters. Obeidat et al. [
23] performed a morphometric analysis and prioritized watersheds for flood risk management in the Wadi Easal Basin, Jordan. Pangali Sharma et al. [
24] identified potential flash flood areas using a geomorphic approach in the East Rapti River Basin of Nepal.
Hydro-morphometric analyzes have been applied in studies for flood assessment in Egypt. Arnous et al. [
25] reported that morphometric analysis strongly supported a high probability of flash flooding in the western part of the Gulf of Suez. Youssef et al. [
26] used morphometric parameters to estimate the risk of flash flooding along the St. Katherine Road in southern Sinai. Abdel-Lattif and Sherief [
27] used three morphometric parameters (bifurcation ratio, drainage density and stream frequency) to estimate flood hazard in wadi Sudr and wadi Wardan, Gulf of Suez. Elewa et al. [
28] presented a hydro-morphometric analysis for the El-Arish Basin in northern and central Sinai to identify suitable sites for collecting runoff. Abdalla et al. [
29] presented a geomorphometric classification of wadis along the southeastern Red Sea coast in Egypt, showing that most basins are highly susceptible to flash flooding. Abdel Ghaffar et al. [
30] evaluated the flash flood hazard of wadi El-Arish by combining nine morphometric parameters using priority values and classification into high, medium and low hazard. Abuzied et al. [
31] used morphometric parameters to evaluate flood sensitive basins and to map the flash flood susceptibility in the Nuweiba area, Sinai. Abdelkareem [
32] derived a flash flood hazard map for the wadi Asyuti basin in the eastern desert of Egypt by ranking and combining morphometric parameters that favor higher flood peaks and runoff. Elsadek et al. [
33] presented a morphometric analysis to estimate flood hazard in the wadi Qena basin. Abuzied and Mansour [
34] combined normalized values of morphometric parameters to obtain hazard indices for sub-basins of wadi Dahab, Sinai. Elsadek et al. [
35] investigated flood hazard in wadi Qena based on a combination of morphometric parameter ranking. Kamel and Arfa [
4] used a ranking method of 13 morphometric parameters to derive the degree of flash flood hazard of basins between Marsa Alam and Abu Ghuson along the Red Sea coast. Prama et al. [
9] derived a flood hazard map for the Dahab region in southern Sinai, by an unweighted combination of normalized morphometric parameters. El-Fakharany and Mansour [
10] evaluated morphometric parameters and the occurrence of flash floods in wadi El-Aawag in southwestern Sinai.
The main aim of this research is to quantify the risk of flash flooding in the Sinai Peninsula, Egypt. Various methods are used for this: (1) hydro-morphometric features are derived that are relevant for estimating the sensitivity to flash flooding using satellite images and spatial analysis tools; (2) principal component analysis is applied to reveal relationships between the different catchment properties and to identify the most significant hydro-morphometric parameters; (3) the probability of flash flooding is estimated by logistic regression using observed events of flash floods as dependent variable and the significant principal components of the hydro-morphometric parameters as explanatory variables; (4) prediction results are cross-validated to assess and prove the robustness of the modeling approach; (5) the logistic model is used to generate a map of flash flood probability for the Sinai Peninsula. The novelty of the approach consists primary in generating a flood susceptibility map for the entire Sinai Peninsula, which has not been presented before; previous studies [
9,
10,
26,
27,
28,
30,
31,
34] only considered only some local sub-basins. A complete flash flood susceptibility map for the Sinai Peninsula can be useful to authorities and decision makers for an overall impact assessment and can contribute to flash flood management and to the planning and implementation of mitigation measures. This study also aims to demonstrate how hydro-morphometric parameters can be used for flood risk assessment in Egypt through a combination of principle component analysis and logistic regression that is robust, reliable and validated. To date, most flood susceptibility studies conducted in Egypt have used a ranking method proposed by Davis [
36] to derive flash flood hazard from hydro-morphometric data, by standardizing morphometric parameters, usually in the range of 1 to 5, and then combining and classifying them into groups ranging from lowest to highest risk level [
25,
26,
27,
28,
29,
30,
31,
32,
33,
34,
35]. However, the number of parameters can vary, all parameters are treated with the same weight as if they have an equal impact on flooding, and the classification into hazard classes is done without rules or standards. In addition, the results are usually not validated.
4. Discussion
Results of the PCA (
Table 5) indicate that the hydro-morphometric characteristics of the Sinai drainage basins can be combined into five groups that account for 90% of the variation of the data and have clear physical meaning. Ordered in decreasing importance in explaining the total variance, the first group includes all hydro-morphometric parameters related to size, the second group consists of parameters related to relief, the third group of parameters relates to basin shape, the fourth group of parameters relates to drainage capacity and the fifth group consists only of the bifurcation ratio. However, the importance of the basin characteristics on flash flood occurrence is not in order of explained variance in the data, but in a different order based on flash flood prediction, as shown by the logistic regression (
Table 6). Most important in predicting flash flooding is the basin size, followed by drainage density, relief, bifurcation ratio and basin shape. The latter two are not statistically significant in the model regression, but nevertheless appear to be relevant in terms of likelihood combined with model complexity (AIC,
Table 5), and therefore should not be removed from the model. The importance of a predictor is given by the regression coefficients (
Table 5). It follows that basin size and drainage density are about two times more important than relief, stream bifurcation or basin shape.
Not surprisingly, the size of a basin is the most important factor in predicting flash flooding. In the case where local thunderstorms are more or less spatially random, the probability of an extreme thunderstorm in a large basin will be greater than in a small basin, increasing the risk of flash flooding in large basins. Equally important is the converse that less or no flash flooding is observed in small basins. The PC representing the drainage density is the second most important predictor of flash flooding, but surprisingly the regression coefficient is negative, so that the flood probability decreases with increasing drainage density, which is contradictory to what is commonly believed. The reason is that flash flooding and drainage density are examined here on a regional scale. Locally, higher drainage density may result in faster drainage, but this is not necessarily the case when comparing drainage densities of basins of different sizes and characteristics. The drainage density of basins expresses how channels and surrounding floodplains are spatially arranged, which is strongly determined by the shape, size and relief of the basin. A low drainage density can indicate large, compact basins with a strong relief, and on the other hand, a high drainage density can indicate small basins with flat elongated or dispersed floodplains. In the present case, the values of the drainage densities for all basins where flash flooding have been observed vary between 0.38 and 0.47, which is below average (
Table 3); these basins are also large with a strong relief and compact shapes.
Relief is only the third most important factor after basin shape and drainage density, which is somewhat unexpected, as relief is usually considered one of the most important factors for flooding [
18]. The fourth predictor relates to the bifurcation ratio, which appears to be a unique but minor factor in flash flood prediction that, however, is often ignored in other studies presented in the literature. The last and least important predictor relates to the shape of basins, where, as expected, compact basins are more prone to flooding than elongated bases.
Comparison of these results with results of similar studies in other countries or in Egypt [
19,
20,
21,
22,
23,
24,
25,
26,
27,
28,
29,
30,
31,
32,
33] is fruitless, as all these studies were performed on a much smaller scale than the current study, usually only one basin, and no analysis of variance such as principal components was applied to establish relationships between hydro-morphometric parameters and to identify key parameters related to the total variance, and importantly, no observations of occurring flash floods were used to reveal the predictive power of the parameters to flooding. Therefore, this study shows that a large set of hydro-morphometric parameters can be reduced to a much smaller set without loss of information, indicating redundancy in the data. So, hydro-morphometric parameters are not independent and do not add more information by their number. Therefore, in flood sensitivity analyses, it makes no sense to combine correlated factors that express similar characteristics, as is done in traditional ranking methods where all parameters are combined with the same weight.
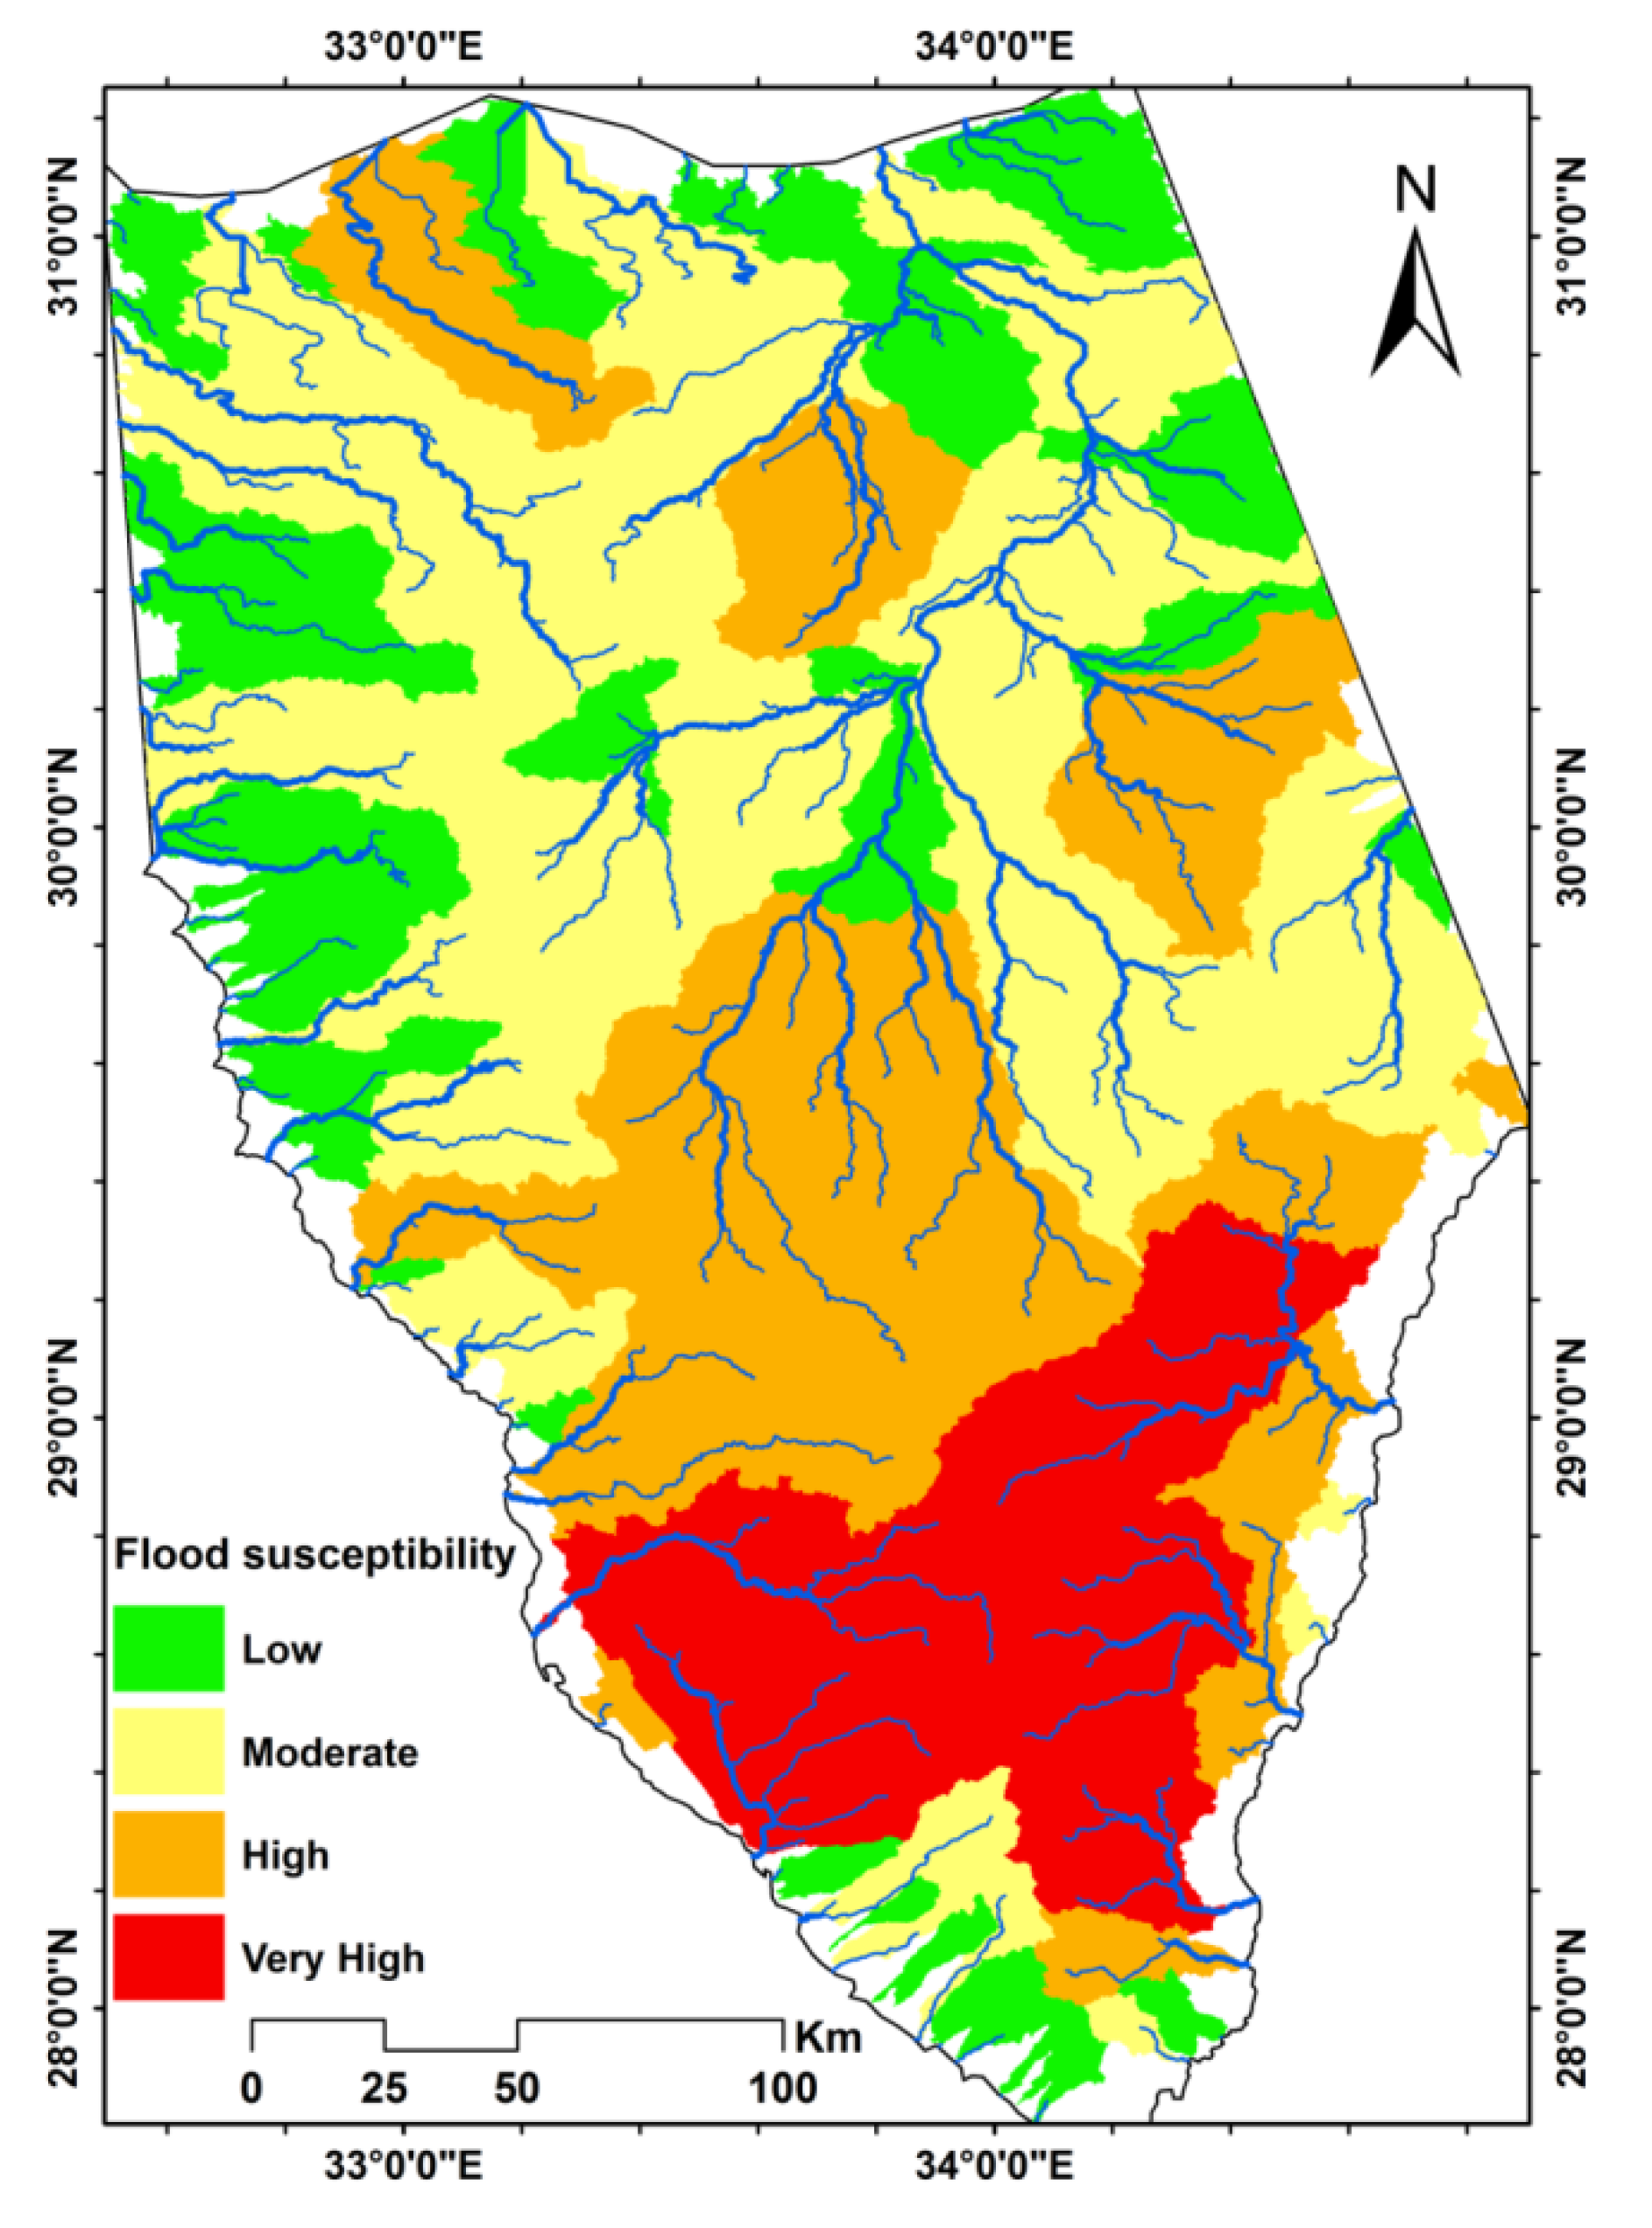
The flash flood susceptibility map (
Figure 5) shows the spatial distribution into four categories: very high, high, moderate and low susceptibility. The very high sensitivity zone is located in the mountain ranges of the southern Sinai and consists of six major basins known for their flash flooding, such as wadis El-Aawag, Feiran and Kid and the upstream sub-basins of wadis Dahab and Watir, which in total represent an area of approximately 8000 km
2, or 15% of the total area of Sinai. The high sensitivity zone is mainly in the center of the Sinai Peninsula and some scattered areas further north. It encompasses 16 river basins, covering a total area of approximately 15,000 km
2 or 28% of the Sinai area, including some upstream sub-basins of wadi El-Arish, sub-basins of wadi Dahab and Watir, and the basins of wadis Sedri, Garf and Werdan which drain into the Gulf of Suez. The basins in the north are wadi El-Beada in Bir Al-Abd, which drains to the Mediterranean, and two sub-basins of wadi El-Harish in El-Hasana and Quasisma, respectively, which may be the source of the flash floods that have been observed in this wadi. The moderate sensitivity zone is mainly located in the north of the Sinai Peninsula and includes 36 watersheds with a total area of about 21,000 km
2 or 39% of the Sinai area. These are usually smaller to medium sized basins located in flatter areas. The low-sensitive zone comprises 45 catchments with a total area of approximately 10,000 km
2, or 18% of the Sinai area. These are usually very small basins on flat terrains with short drainage paths and few branches. Most are located in the north and center along the periphery of the Sinai Peninsula; some are also found in the southern part of Sinai. The resulting flash flood sensitivity map is largely consistent with flash flood observations that occurred in different regions of the Sinai and with the findings or predictions of other studies [
6,
9,
10,
31,
34].
In particular, the map indicates the high probability of flash flooding in the mountainous basins of southern Sinai, as observed and reported in several publications, such as wadi Feiran [
26], wadi Watir [
8,
31], wadi Dahab [
9] and wadi El-Aawag [
10]. The map also indicates the high or moderate sensitivity of some basins in southwestern Sinai draining to the Gulf of Suez as described in the literature, such as wadi Sedri [
10], wadi Sudr and wadi Wardan [
27]. By indicating the high sensitivity to flooding of some sub-basins in El-Hasana and Quasisma of wadi El-Arish, the map also sheds light on the possible origin of flash floods observed in El-Aris, as discussed by Moawad [
7], Elewa et al. [
28] and Abdel Ghaffar et al. [
30]. Nevertheless, it is clear that these results can be improved as more accurate and detailed information on the characteristics of river basins and the occurrence of flash floods in the Sinai becomes available.
Flood susceptibility mapping presented by other studies conducted in Egypt or other countries [
19,
20,
21,
22,
23,
24,
25,
26,
27,
28,
29,
30,
31,
32,
33] mainly used a classification method consisting of standardization of the morphometric parameters, usually in the range of 1 to 5, and combining the resulting scores without any ranking or weighting as if all parameters have an equal effect on flooding. In addition, there is no validation of the results with field data regarding the occurrence of flash floods, which makes it impossible to verify such simplifying assumptions and approach. In contrast, the method presented in the present study, combining principal component analysis and logistic regression, proves to be robust, reliable and validated and therefore superior to what has been presented before.
The drainage network extracted from satellite data and the sub-division of large basins introduces some bias regarding the range and magnitude of the derived hydro-morphometric parameters. Subdivision is, of course, necessary to get a map of the spatial distribution of flash flood susceptibility in the Sinai. A more detailed subdivision could improve the resolution and accuracy of such a map, but the uncertainty about the exact location of flash flood observations needed to optimize the logistic regression model could potentially cause more bias and uncertainty. In this regard, the current study is only a first attempt, and more research is needed to assess accuracy and improve results.
5. Conclusions
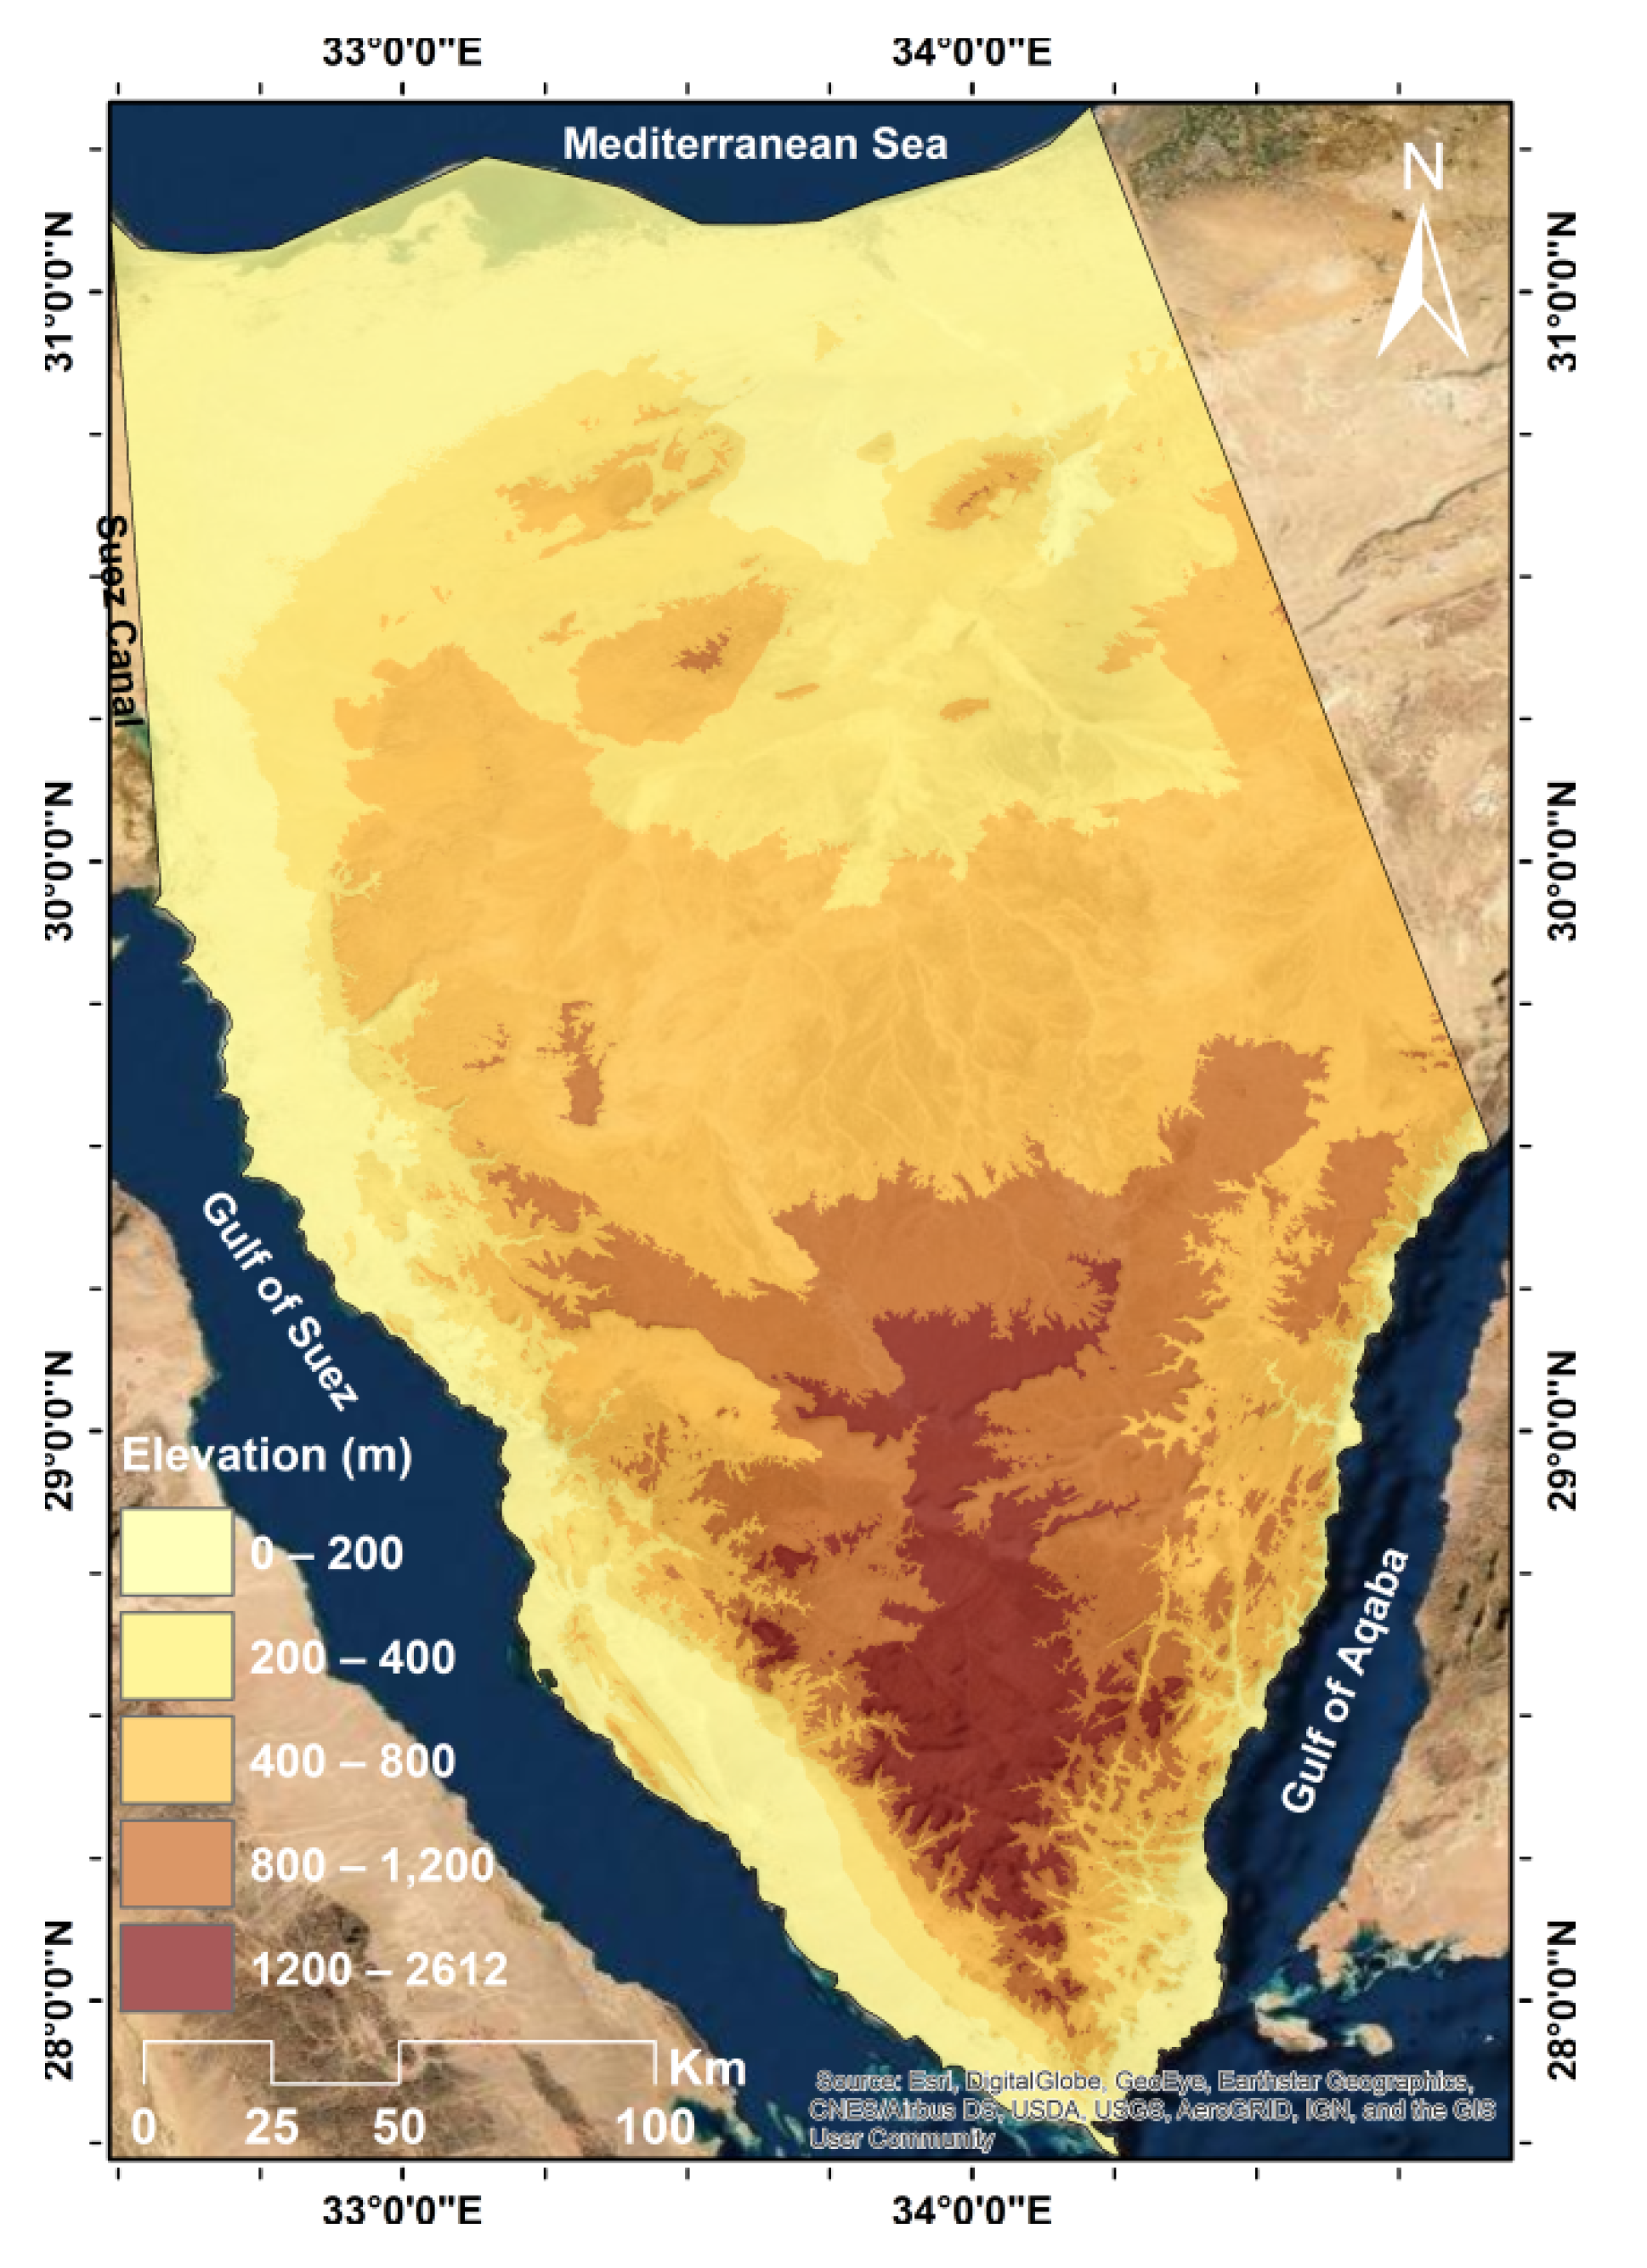
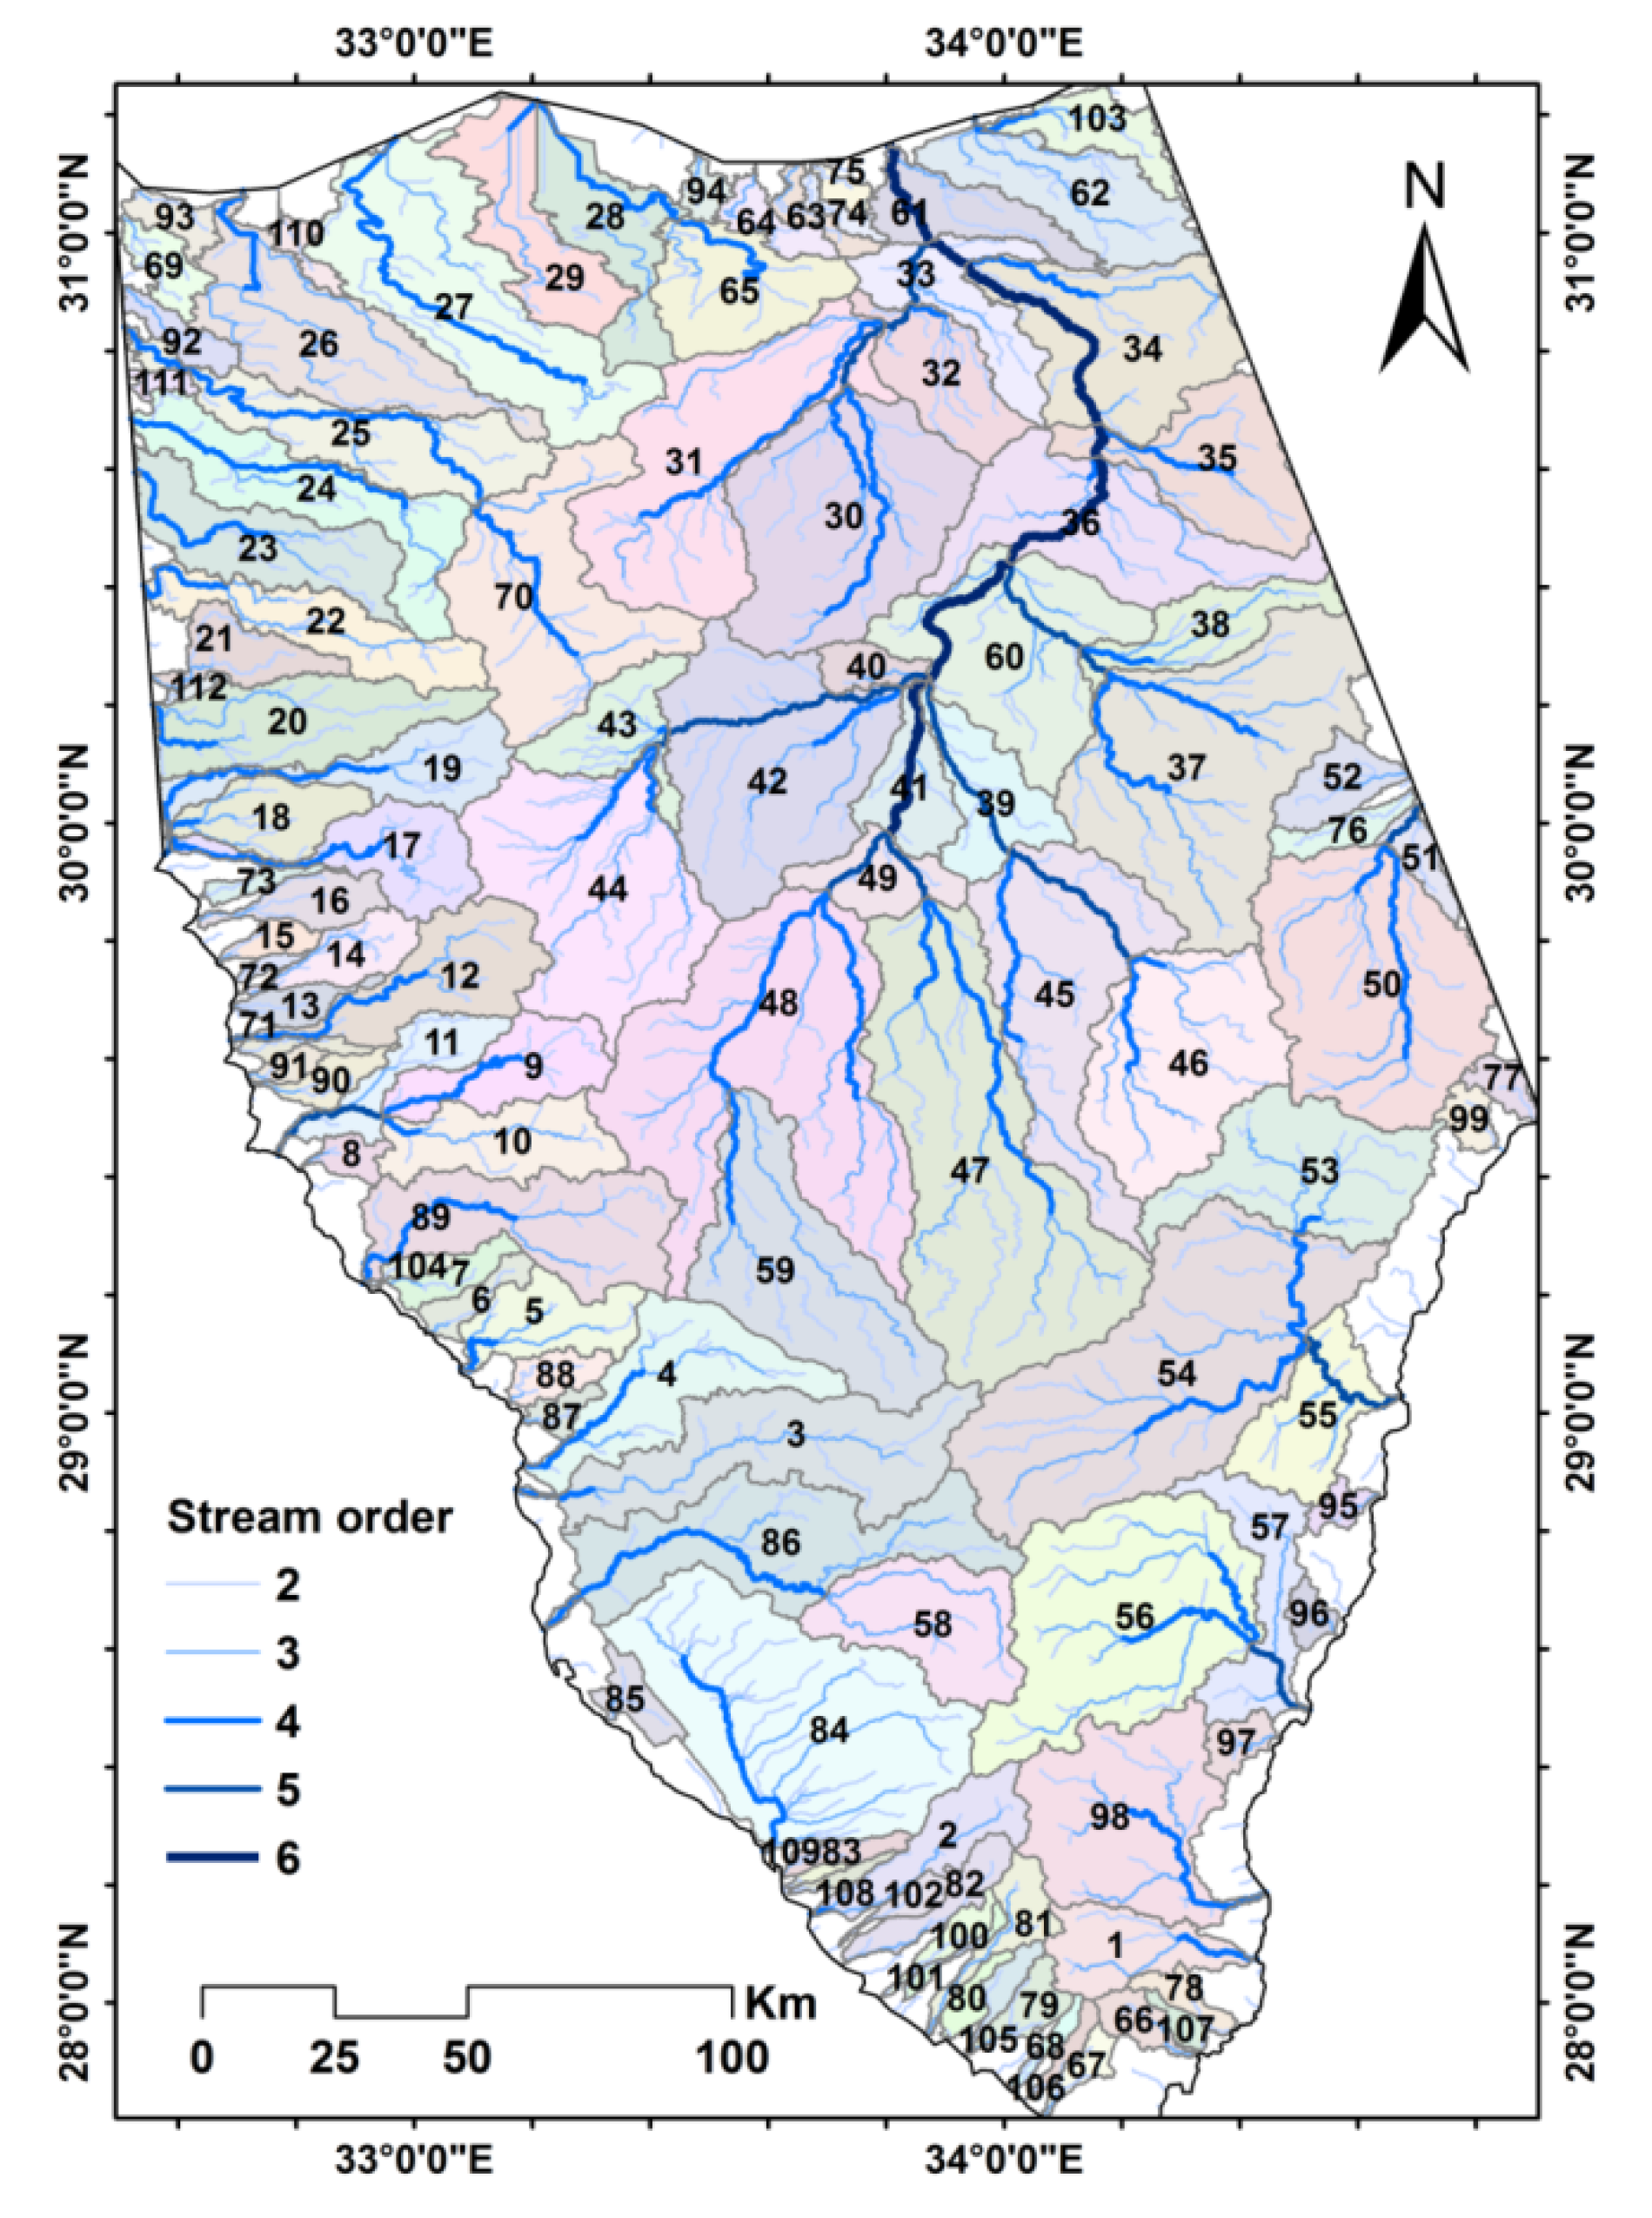
Thunderstorms in the Sinai Peninsula often lead to flash floods that can cause significant damage to infrastructure and sometimes even loss of life. Therefore, this study shows how to derive the susceptibility to flash flooding using hydro-morphometric characteristics of the watersheds. Subbasins of various sizes and shapes and their hydro-morphometric features are derived from a digital elevation model from NASA Earthdata. Principal component analysis reveals the relationships between the most important hydro-morphometric parameters and allows us to derive five significant principal components that explain 90% of the variation in the data and have clear physical significance: basin size, drainage density, relief, stream bifurcation and basin shape. This shows that hydro-morphometric parameters are not independent which makes traditional ranking methods to estimate flood sensitivity questionable.
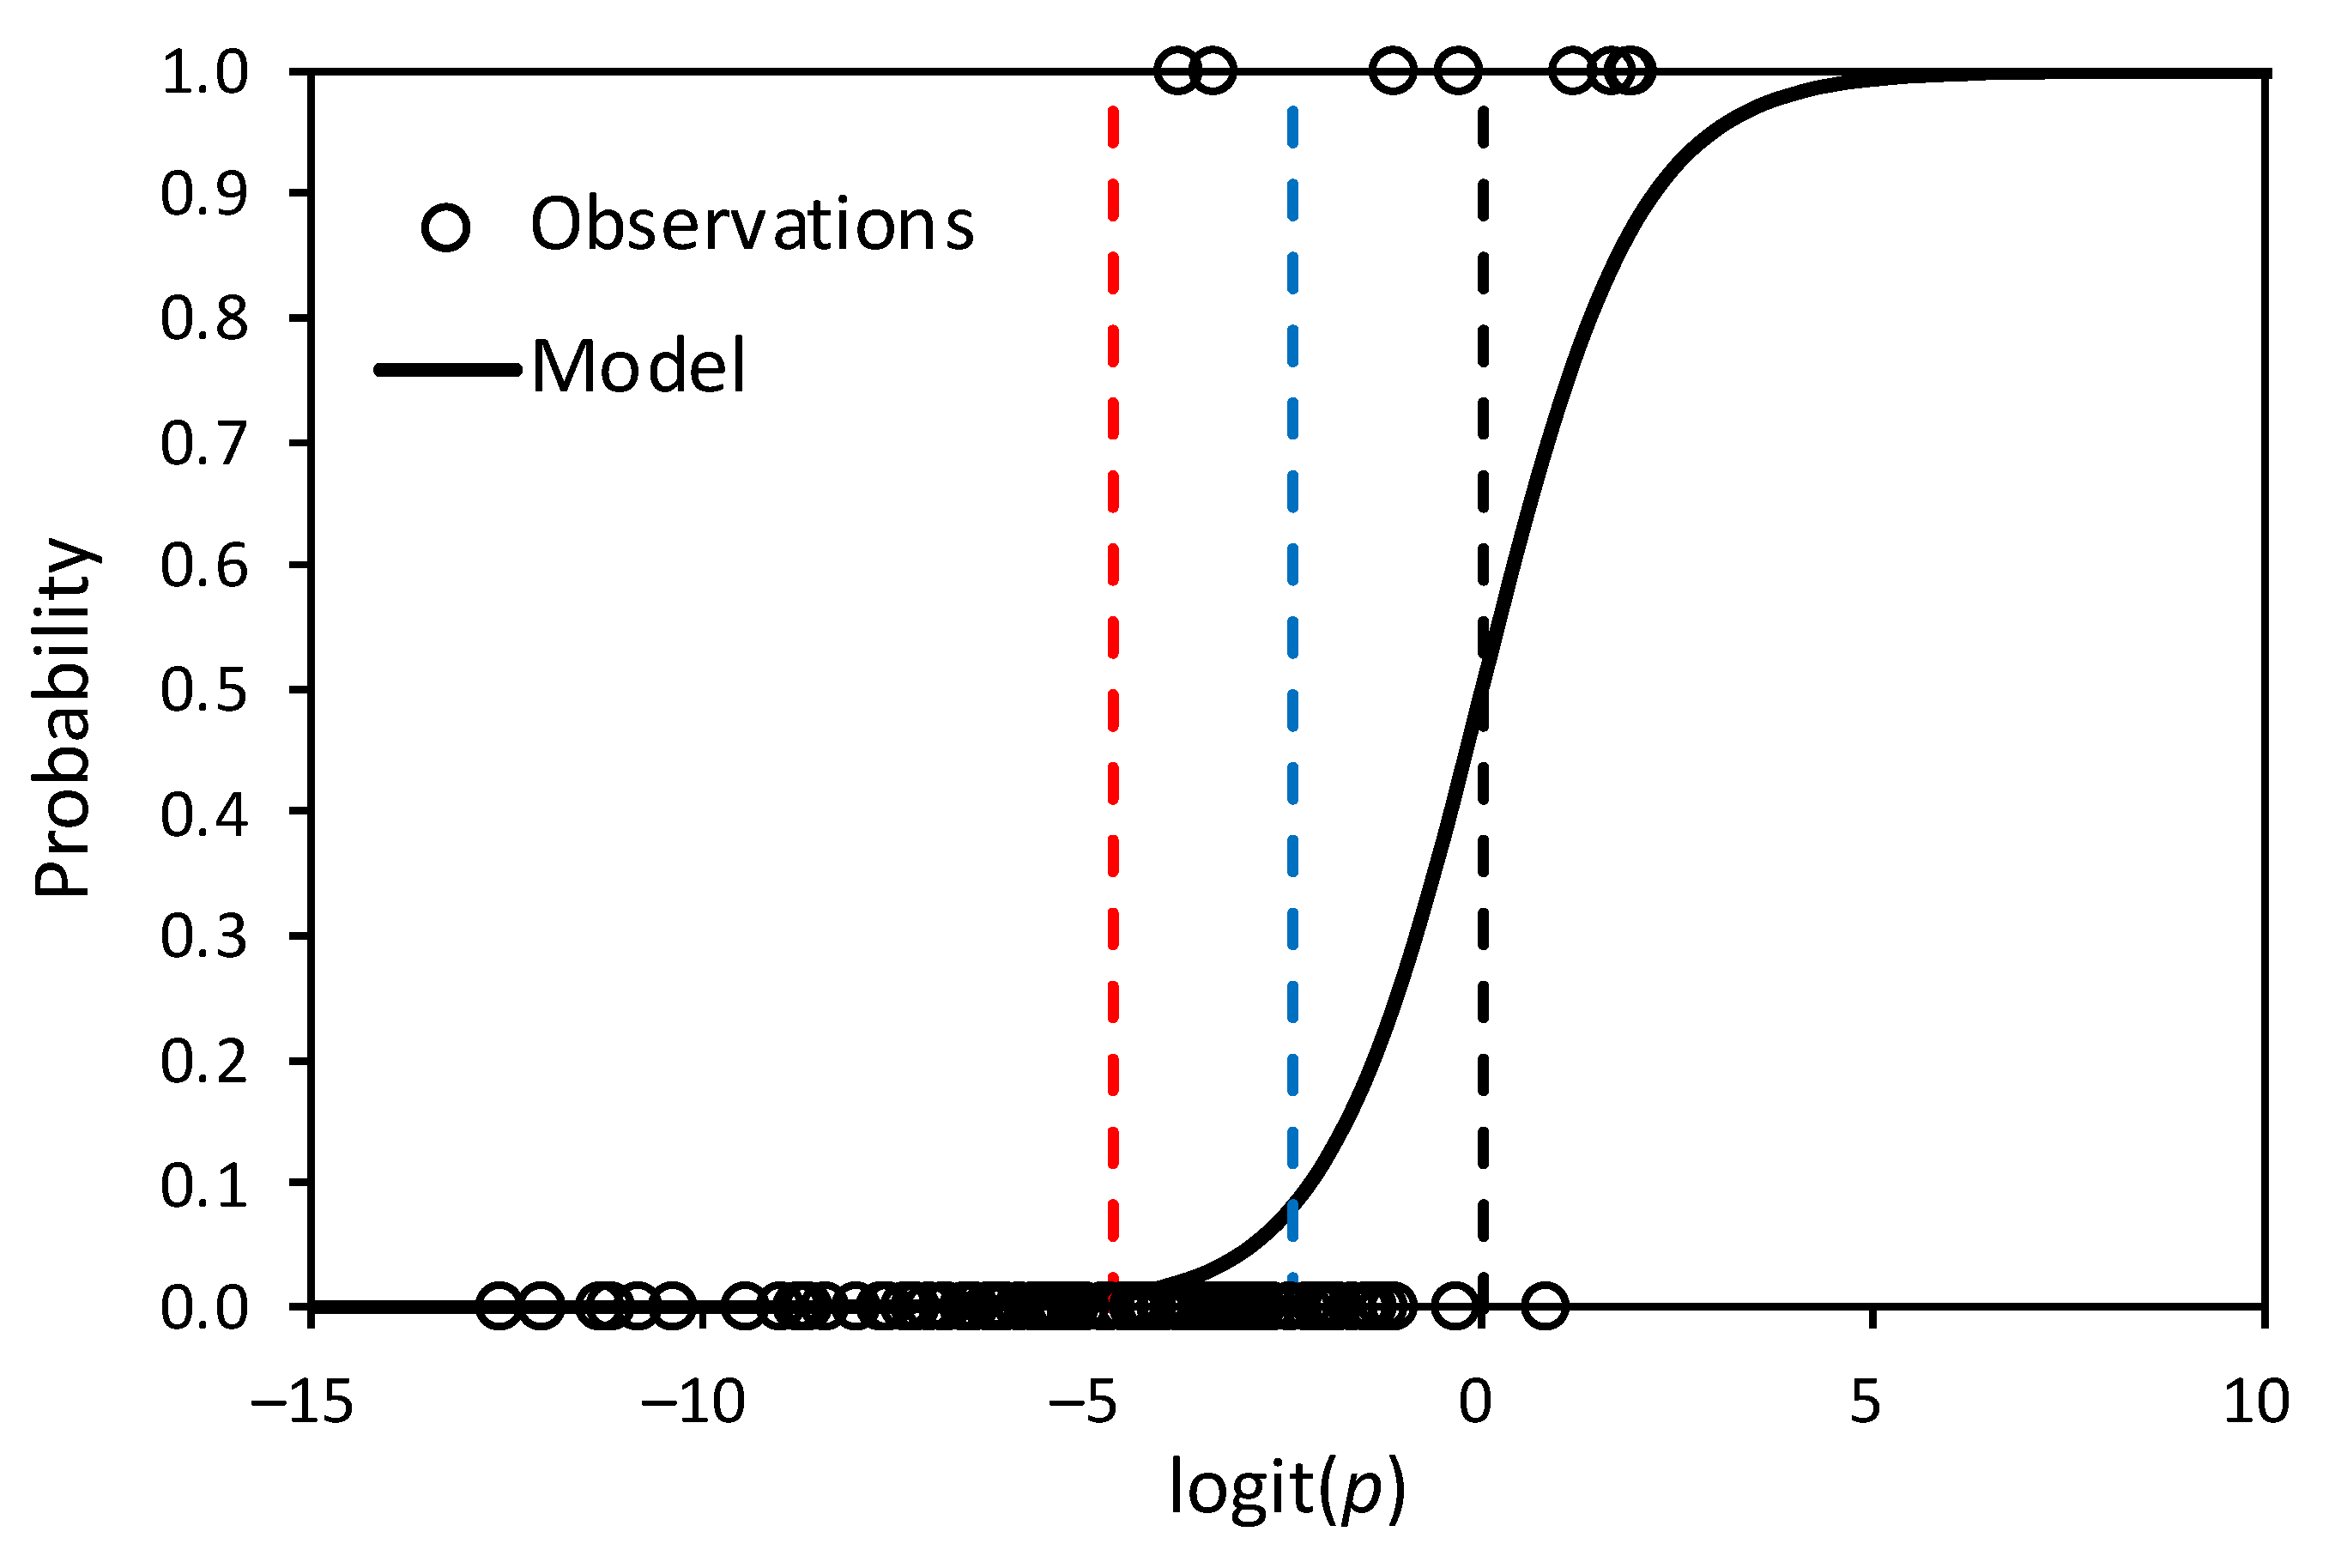
The flash flood probability can be estimated by logistic regression using the significant principal components as predictors and the model coefficients estimated by fitting the model to flash flood observations using maximum likelihood. Cross-validation proves that the model is robust because the estimates of flood probability remain similar to those predicted with the original model. The model shows that the size of a basin is the most important factor in predicting flash flooding, followed by drainage density, relief, bifurcation ratio and basin shape. The logistic model can be used to classify all basins in Sinai into four classes: low, moderate, high and very high susceptibility to flash flooding. The resulting map indicates that the large basins in the mountain ranges of the southern Sinai have a very high susceptibility to flash flooding, several basins in the southwestern Sinai have a high or moderate susceptibility to flash flooding, some sub-basins of wadi El-Arish in the center have a high susceptibility to flash flooding, while smaller to medium-sized basins in flatter areas in the center and north usually have a moderate or low susceptibility to flash flooding. These results are consistent with observations of flash floods that occurred in different regions of the Sinai and with the findings or predictions of other studies.


