Abstract
In developing countries, where economic expansion depends on extractive activities such as agriculture and mining, water quantity and quality considerations need to be examined in tandem with GDP growth and poverty reduction efforts. Poorest households in the Tupiza watershed in Bolivia are located in rural areas where water access for irrigation and safe drinking water is becoming increasingly scarce. Small-scale unregulated mining offers an alternative for revenue making in rural households, although wastewater from industry threatens water quality and new technologies to reduce water pollution are not implemented in this region yet. This study analyses water access and poverty linkages using the Multidimensional Poverty Analysis (MDPA) framework from the Swedish International Development Cooperation Agency (Sida) to guide a survey and to develop indicators using the Shapley-Owen decomposition method and multivariate regressions. A set of household-level policies were included to predict the influence of these policies on poverty reduction estimates. Results have shown that remote communities in rural areas have the lowest value of multidimensional poverty and for some of these communities mining activities represent an alternative that could be considered if their water access conditions worsen over time. While mining can bring better monetary benefits, it can cause the degradation of ecological flows from the produced wastewater. Under the current technologies and processes, it can pose negative impacts on water quality and threatens the public health of these communities.
1. Introduction
Multidimensional poverty estimates show that 1.3 billion people in the world are multidimensionally poor, and 84.2 percent of them live in rural areas [1]. Sustaining people’s livelihood in rural areas depends on water and it is an essential resource for sustainable development. Water is a critical productive input for countries’ socioeconomic development and communities [2,3,4,5,6]. It has been recognized that agricultural water and its management relate to poverty reduction, especially in developing countries [7,8,9]. However, equity consideration needs to be included to ensure that water security can benefit the poorest as well as enhance economic growth [10,11,12].
While access to safe drinking water is recognized as a human right, estimates from 2020 show that the number of people deprived of water around the world is 1.37 billion [1]. In Bolivia, 98% of people in urban areas have access to improved water sources in their premises, while in rural areas, the percentage is 77% [13].
This study focuses on understanding the links between water access and poverty in the Tupiza river basin, located southeast of the Department of Potosí, in Bolivia, which is considered one of the 25 strategic basins in the country due to its socio-economic relevance and environmental vulnerability [14]. The methods used are guided by the literature around the multidimensional poverty approach to understand how different deprivations, including, but not restricted to water, affect people’s lives [15,16,17]. The poverty dimensions considered in this study are based on the Multidimensional Poverty Analysis (MDPA) framework proposed by the Swedish International Development Cooperation Agency (Sida) [11,12]. The MDPA offers four dimensions of poverty: Resources, Opportunities and Choice, Power and Voice, and Human Security, and emphasizes the understanding of the complexity of poverty, knowing who lives in poverty, how it manifests itself in different groups of people, and what are the underlying causes in each context [11,12]. This framework guided a survey design and further development of multidimensional poverty indices by using the Shapley-Owen decomposition method and multivariate regression models. Spatial analysis was performed based on multidimensional poverty indices to identify communities with a concentration of the poorest households. Establishing the relationship between water access and the multidimensional poverty of households can support policy-making efforts and water planning and take the landscape of inequality in the Tupiza watershed into consideration.
The rest of the document is structured as follows. Section 2 describes the study area and its main characteristics. Section 3 presents the methods that were used for the analysis. Section 4 shows the results of the estimations of the multidimensional poverty indices, water index for rural areas as a measure of water access, and poverty models estimated to analyze the relationship between water access and multidimensional poverty in the rural and urban areas of the Tupiza River Basin. Section 5 presents a discussion of the results and their policy implications. Finally, Section 6 summarizes the conclusions of the study.
2. Study Area
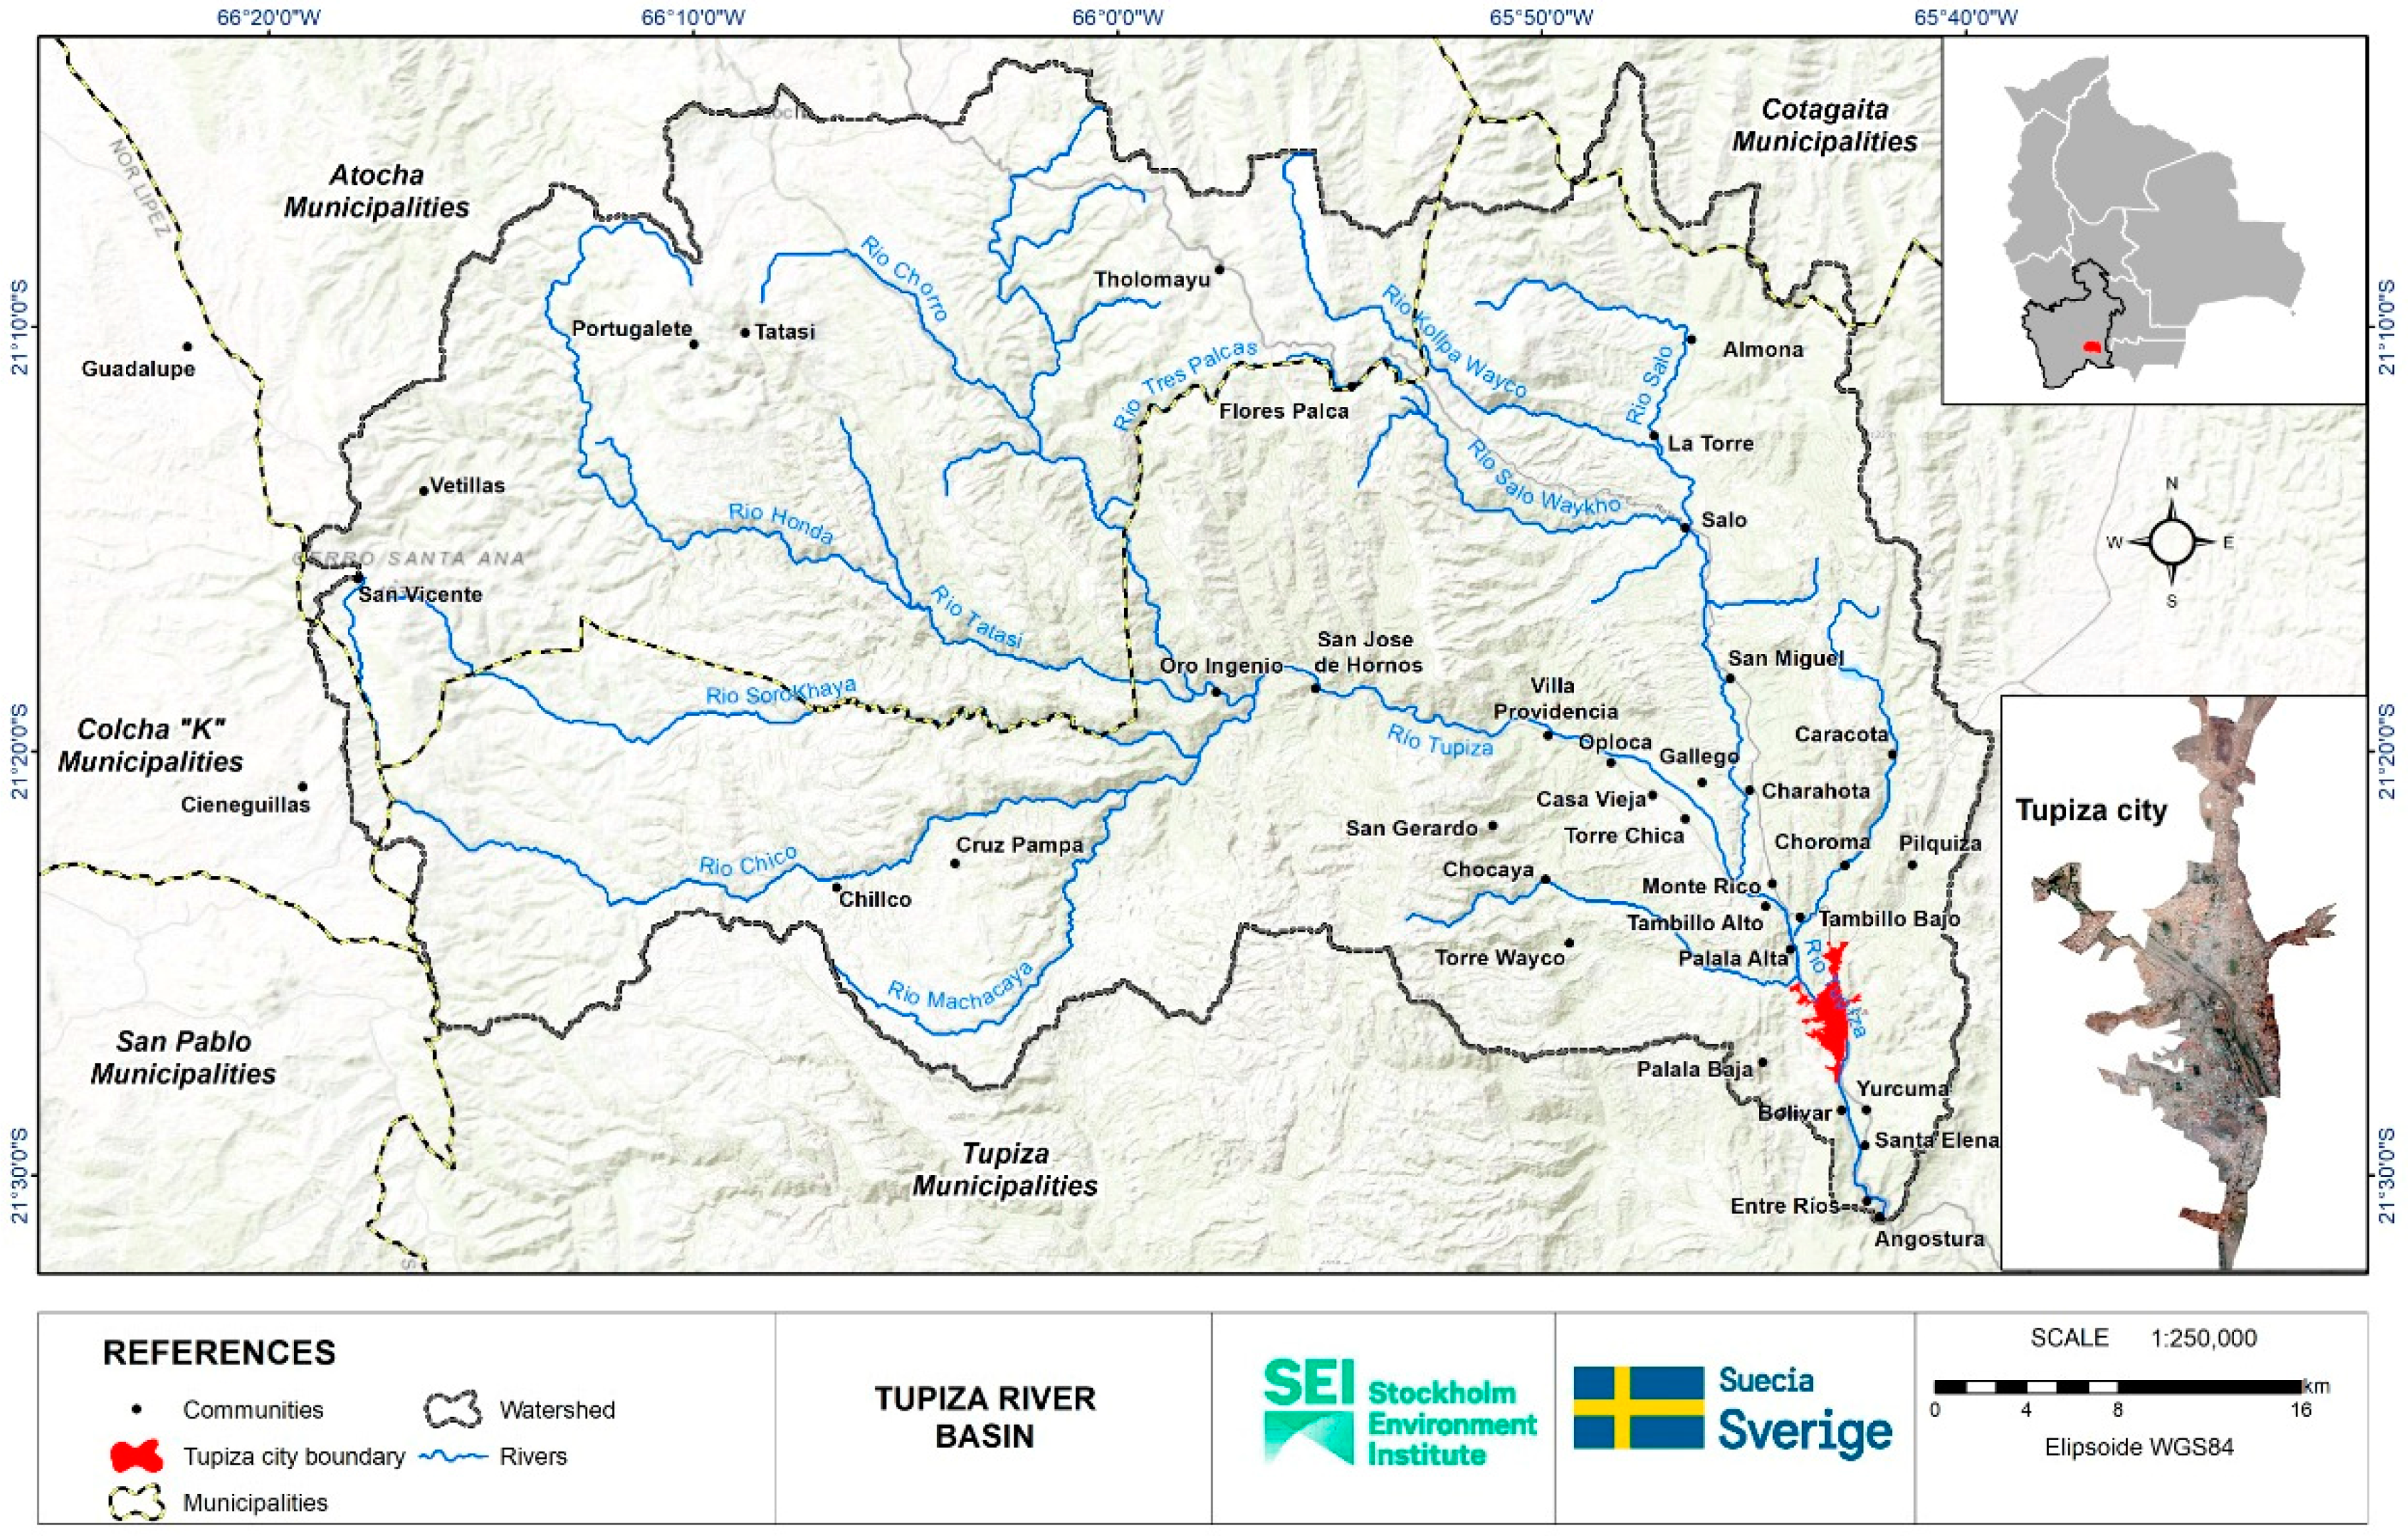
The Tupiza River Basin is in southeastern Bolivia, in the department of Potosí. It has an area of 2309 km2. Its sub-basins flow into San Juan del Oro and Pilcomayo rivers [18]; the last one is one of the main tributaries of the Rio de la Plata Basin. Tupiza River Basin is part of the 25 strategic basins that Bolivia has identified, based on their socioeconomic relevance, socio-environmental vulnerability, and the existence of problems that require urgent attention [14,19].
Three municipalities and their populations are partially in the basin: Tupiza, Atocha, and Colcha K. The estimated population of the basin is nearly 34,000 inhabitants, of which around 27,000 are settled in the city of Tupiza [20], the only urban center in the basin. The rest of the population is distributed over 38 communities, including peri-urban and rural ones (Figure 1).
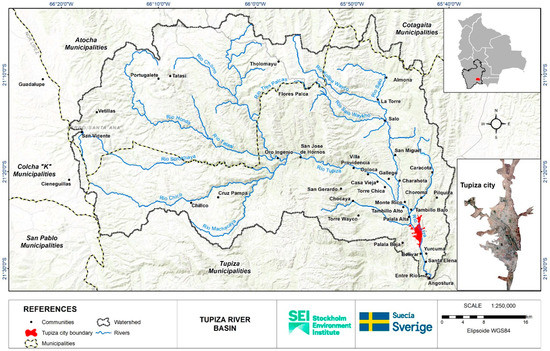
Figure 1.
Communities and urban areas of the Tupiza river basin.
The major economic activities in the Tupiza River Basin are agriculture, mining, and livestock breeding [14]. According to the Municipal Atlas of Sustainable Development Goals in Bolivia and the indicators to measure the SDG 1 (End of poverty), the Unsatisfied Basic Needs are present in more than 57% of the population of the municipality of Colcha K, 40% in Tupiza and 20% in Atocha. Regarding the access to the three main basic services (water, sanitation, and electricity), Tupiza reaches 60%, while the other two municipalities have less than 30% of households with access to the three basic services. The most lacking basic service in the three municipalities is sanitation, while drinking water coverage exceeds 80% of the population, as well as access to electricity that reaches near 90% in Tupiza, 96% in Atocha, and 77% in Colcha K [21].
The Tupiza river basin shows signs of contamination that affect the quality of water flowing through the main river and eventually ends up being consumed by the local population. The presence of heavy metals was evidenced naturally and also by mining activity which, added to erosive effects, causes these elements to be transported in soil, water, and air [18,22]. The dynamic between heavy metals and fine sediments would indicate that areas of degradation of the Tupiza river and the cloudy water that transports them are those with the greatest risk and exposure [22]. Although the effects of mining activities on water quality should be further analyzed, it would be useful to explore some alternatives for new technologies that can be used to reduce water and soil pollution associated with current processes of mineral extraction.
3. Material and Methods
For the case of the Tupiza River Basin, the first step of the analysis was the estimation of multidimensional poverty indices for the urban and rural areas, by including variables for the four dimensions of poverty, the particular characteristics of the basin captured through household surveys, and the application of Shapley-Owen decomposition method. In a second step, poverty models were estimated to establish the relationship between water access and the level of multidimensional poverty in households. Water access was captured by a water index, in the case of the rural area, and by different variables of water for domestic use, in the case of the urban area. The methodology of this study followed the next four steps:
- Design and implementation of a household survey for rural and urban areas.
- Identification of multidimensional poverty variables, according to the MDPA framework.
- Estimation of multidimensional poverty indices and water access index for rural areas by applying the Shapley-Owen decomposition method.
- Estimation of econometric models to establish the relationship between water access and multidimensional poverty in the Tupiza River Basin.
3.1. Survey
A survey was designed to collect information for the analysis of water and sanitation in connection with poverty, as part of the Bolivia-WATCH project led by the Stockholm Environment Institute (SEI). This survey was the base information for the construction of the multidimensional poverty indices and models used in this study. Two household surveys were designed; one for the city of Tupiza (Supplementary Material Document S2), and the second for the rural and peri-urban communities (Supplementary Material Document S1). From now on, the last group will be referred to as rural communities.
The survey for rural communities consisted of 12 sections: (i) General characteristics of the interviewee, (ii) Education level of the interviewee, (iii) Employment, income, and assets, (iv) General characteristics of the household, (v) Characteristics of the dwelling, (vi) Basic services in the household, (vii) Health access, (viii) Land tenure and land use, (ix) Agriculture and irrigation, (x) Livestock breeding, (xi) Mining, (xii) Human security (food security, climate risks, and environmental problems, and community conflicts). In the urban survey, the sections of Agriculture and Livestock were excluded because they represent the economic activities of the rural area only.
The surveys were designed by using the QuestionPro platform, which allows for the completion of offline questionnaires through an application for mobile devices. The information gathering was carried out during January and February 2020 with the work of 10 enumerators previously trained. A total of 513 households were reached in rural communities (±4.2% error and 95% confidence level), and 209 households in the city of Tupiza (±6.7% error and 95% confidence level). After the selection of variables for the construction of the poverty and water indices, several observations with missing data were eliminated. The final samples consisted of 445 households from rural communities (±4.5% to 4% error and 95% confidence level), and 187 households from the city of Tupiza (±7.2% error and 95% confidence level).
The surveys were applied to household heads or decision makers, considering a decision maker as a person of legal age (18 years or older) who is not the head of the household but has decision-making power in it. The sampling strategy tried to balance the number of female and male respondents. Households in the city of Tupiza were selected randomly based on the distribution of zones and house blocks, as well as on the estimation of the number of dwellings per zone. For the rural area, a specific sample was defined per community, according to the number of households in each of them, and surveys were randomly applied, by trying to include concentrated and dispersed areas of each community.
Some of the limitations during the implementation of the surveys were related to the working schedules in rural communities. Because the crop areas are far from the houses, household heads, especially the men, usually go very early in the morning to work on their fields. We dealt with this situation by anticipating our visits in coordination with communities’ authorities. This is also a necessary step in order to inform about the study purposes, to reduce people’s mistrust and to encourage them to accept the project. To ensure that respondents complete the questionnaire, we offered a monetary incentive to each of them after completing the survey. This was also a way to compensate for the time that many of them spent responding the survey instead of doing their regular activities.
3.2. Shapley-Owen Method
By following the MDPA framework and the Shapley-Owen decomposition method, we estimated the Multidimensional Poverty Indices (MPI) in two stages. In the first stage, each of the poverty dimensions has the same weight in the calculation of the MPI [23], as follows:
The urban MPI has only two dimensions because the other ones did not show statistical significance, as explained in Section 3.3.2. Power and Voice indicator did not show sufficient variability and the Human Security variables did not contribute to the explanation of the variance of the MPI index.
In a second stage, the percentages of contributions (relative weights) of the components to the total variance of the previously estimated indices are calculated [24]:
where is the MPI index (rural or urban), represents the relative contribution of each component of the index, whose sum must be equal to 1, and are the components of the MPI index.
This method allows for estimating the weight of each dimension and its components. In this way, each dimension is evaluated from 0 to 1, as well as its components and the final index [24,25]. Where levels close to 0 indicate undesirable conditions (poorest households), and households close to 1 present favorable conditions (less poverty).
Under the Shapley-Owen decomposition method, the Cronbach Alpha test is applied to determine the estimate’s reliability. Cronbach Alpha values equal to or greater than 0.7 show that the index, dimension, or component are valid enough for measuring the reliability of the index [26].
3.3. Multidimensional Poverty Index (MPI)
3.3.1. Poverty Sub-Indices for Rural Communities
Each poverty dimension had a specific sub-index based on its own components. The Resources dimension includes a group of variables associated with housing materials, agricultural capital, and assets in the house. The Opportunities and Choice dimension has basic sanitation services, garbage collection, electricity, and cooking gas. The dimension of Power and Voice is represented by the access to sanitation projects, in the sense that it is assumed that project beneficiaries need a certain level of power and active participation within their community. Finally, the Human Security dimension includes variables on the impact of natural disasters on agricultural production and the existence of internal and external social conflicts in the communities. All these variables are listed in Table 1.

Table 1.
Variables of the Multidimensional Poverty Index for the communities of the Tupiza River Basin.
The variables were normalized, so their values can be expressed in a range from 0 to 1, where 0 refers to undesirable conditions that are related to a higher level of poverty, and 1 represents favorable conditions or less poverty.
3.3.2. Poverty Sub-Indices for the City of Tupiza
Only two dimensions of poverty were considered for the city of Tupiza: Resources and Opportunities and Choice (Table 2). This is due to the fact that the Power and Voice indicator (access to bathroom construction projects, similar to the one used in the rural IMP) did not show sufficient variability and the Human Security variables did not contribute to the explanation of the variance of the MPI index (Alpha Cronbach less than 0.7).
Table 2.
Variables of the Multidimensional Poverty Index for the city of Tupiza.
3.4. Water Index for Rural Communities of the Tupiza River Basin
As a measure of water access for domestic and agricultural uses in rural communities, we estimated an index by using the Shapley-Owen decomposition method. Six indicators were included for the water index; four of them were associated with domestic use and two of them with agricultural use (Table 3). This index will be considered as an explanatory variable in the multidimensional poverty model for the rural area of the Tupiza river basin, in order to determine its relationship with the MPI.
Table 3.
Water Index for rural communities of the Tupiza river basin.
An attempt to construct a water index for the city of Tupiza was made; however, no significant variables were found, using the Shapley-Owen method.
3.5. Relationship between Water Access and Multidimensional Poverty in the Tupiza River Basin
In this study, the effect of water access on multidimensional poverty is analyzed by using a simple linear regression model where the dependent variable is represented by the MPI, previously explained and the water index (rural area), or variables associated with water access (city of Tupiza), and other socioeconomic variables are the explanatory variables. A reduced form of the model can be represented by:
where is the multidimensional poverty index (MPI), water access is represented by the water index, in the case of the rural area, and specific water variables for the city of Tupiza. Finally, are socioeconomic variables not captured by the MPI.
4. Results
The results are presented in five subsections. The first three focus on the multidimensional indices and water index. The fourth subsection shows the relationship between water access and multidimensional poverty indices through multivariate regression model estimations. Finally, the fifth subsection presents the policy implications to reduce multidimensional poverty in the Tupiza River Basin through water policies, based on the results of the econometrical models.
4.1. Multidimensional Poverty Index for Rural Communities
The Multidimensional Poverty Index (MPI) for the rural area of the Tupiza River Basin has the Resources dimension as the one with the greatest statistical weight (43%), compared to the other dimensions. This dimension could not be captured by a sub-index so it was divided into four components and their own marginal contribution to the MPI estimated by the Shapley-Owen decomposition process, as can be seen in Table 4. The Power and Voice dimension, represented by access to bathroom construction projects, is the dimension with the second greatest relative weight. Although, the Opportunities and Choice dimension has a remarkably close relative weight value. Finally, the dimension of Human Security is the one that shows the lowest relative weight for the case of the rural and peri-urban areas of the Tupiza river basin.
Table 4.
Composition of the Multidimensional Poverty Index for the rural area of the Tupiza River Basin.
The different variables that made up the sub-indices for each poverty dimension are shown in Table 5. In the Resources dimension, the quality of housing in terms of improved materials is the one with the greatest statistical weight. In Opportunities and Choice, the access to the different basic services has similar weights. The dimension of Power and Voice has only the indicator of access to bathroom construction projects, which, as mentioned above, has an important weight in the rural MPI. In the dimension of Human Security, the absence of natural disasters has a much greater weight compared to the absence of social conflicts.
Table 5.
Disaggregation of the rural IMP.
The spatial distribution of the rural MPI in the Tupiza River Basin was observed by dividing the index into quintiles. Figure 2 shows that the poorest households are distributed in all the rural and peri-urban communities of the basin. However, those communities far away from the city of Tupiza, which is also the main market for agricultural products, have shown a greater concentration of poor households, and are found mainly in the municipalities of Atocha and Colcha K.
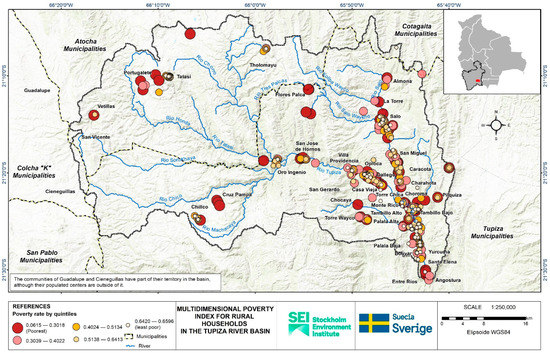
Figure 2.
Multidimensional Poverty Index for rural households of the Tupiza river basin.
4.2. Multidimensional Poverty Index for the Urban Area
The MPI of the city of Tupiza is made up of only two dimensions, Resources and Opportunities, and choice. There was not enough information to estimate a sub-index associated with the Power and voice dimension, while Human security variables were not significant for the index, so it was discarded after several tests.
The dimension of Resources has the greatest statistical weight, with about 57% compared to 43% for Opportunities and Options (Table 6). Human capital stands for 76% of the weight Resources dimension, where access to complementary training (i.e., technical skills, skills to generate own enterprises, among others) is the most important variable. For the Opportunities and Choice dimension, access to sink, water, and soap in households has the highest statistical weight, as part of the Access to basic services sub-dimension. Access to electricity and access to gas were not included because 100% of the households have these basic services.
Table 6.
Disaggregation of the Urban IMP.
The spatial distribution of the MPI for the city of Tupiza shows a greater concentration of poorer households in the extremes of the city or remote areas (Figure 3).
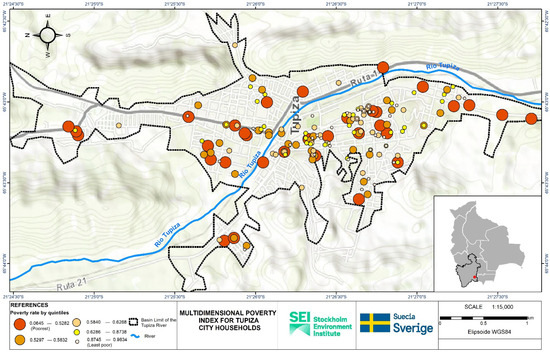
Figure 3.
Multidimensional Poverty Index for households in the city of Tupiza.
4.3. Water Access Index
The Water Index (WI) for the rural area of the Tupiza River Basin is made up of variables related to access and availability of water for domestic and agricultural use. The variables associated with water access for domestic use have greater statistical weight together. Having daily availability of water through a household connection stands as the most important factor in the WI. This is followed by the use of a secondary water source, which represents a strategy used by families to deal with the scarcity of water from the main sources in certain seasons of the year. The continuity in daily access to piped water, which refers to the number of hours that households have access to water daily, is the third most important variable, followed by access to water for irrigation, which measures the proportion of households (with agriculture) that have some type of irrigation system for all their crops. Access to an improved water source is the fifth variable in importance, and refers to access to a water source that is protected from external contamination, mainly fecal. Finally, there is the water infrastructure for the animals, based on the availability of drinking water fountains among the households that have livestock breeding activities (Table 7).
Table 7.
Water Index for rural communities.
For the urban area of the Tupiza River Basin, it was not possible to construct a water index because households showed more homogeneous characteristics in terms of water access. It was estimated that 98% of the households have access to piped water and 100% have access to an improved water source. In this sense, for the construction of the multidimensional poverty model for the city of Tupiza, different variables associated with water access were introduced, in a disaggregated manner, as explanatory variables of the model.
4.4. Relationship between Water Access and Multidimensional Poverty in the Tupiza River Basin
4.4.1. Multidimensional Poverty Model for the Rural Area
The estimated poverty model for the rural area of the Tupiza River Basin shows that the water access index is statistically significant and has a positive impact on the MPI (Table 8). Considering that the MPI is measured on a scale of 0 to 1, where 0 represents the multidimensionally poorest households and 1 the least poor households, the model shows that the higher the water access index, the lower the level of multidimensional poverty in the household. Among other variables associated with water that was relevant and not captured in the water index, we found that the existence of water tanks in the home shows a positive relationship with the MPI, which means that having water tanks is related to a lower level of poverty in rural households. Finally, treating the water before consuming it is also associated with a lower level of household poverty.
Table 8.
Estimates of the poverty model for the rural area of the Tupiza River Basin.
The other relevant variables in the model show the characteristics of the least poor and poorest households in the rural area of the basin. On one hand, households with a house endowed by a mining company, with the main source of income coming from mining or commerce, lifelong residents of the municipality of Tupiza, and with a greater household size, are the households with the lowest level of poverty. Similarly, those households that perceive themselves to have sufficient income and a strong community relationship are among the least poor households. On the other hand, the poorest households in the rural area of the basin are characterized by having income from agriculture, livestock breeding, rents, bonds, and/or retirement, and from diverse sources.
4.4.2. Multidimensional Poverty Model for the Urban Area
The multidimensional poverty model for the city of Tupiza includes different variables associated with water access, but not an index because, as mentioned above, it was not possible to estimate it. The model shows that the variables measuring water access for domestic use are statistically significant and have a positive impact on the MPI (Table 9).
Table 9.
Estimates of the poverty model for the urban area of the Tupiza River Basin.
It is observed that the greater the continuity in the daily access to water in the houses, the lower the level of poverty of the households. Similarly, in households where: water is treated before consuming it, investments are made to improve water access in the home and there are secondary sources of water (such as bottled water), which are less poor households.
The other statistically significant variables of the model show that in households where the level of overcrowding is less than or equal to three people per room, the household head/decision-maker perceives they have sufficient income and they have lived in Tupiza city their lifetimes, are households with a lower level of multidimensional poverty. In contrast, the poorest households are characterized by having their income from rents, cash assistance payments, retirement or activities related to transportation. Other common economic activities of the area, such as mining and commerce, do not have statistically significant impacts on the level of multidimensional poverty in the city of Tupiza.
4.5. Policy Implications
From the multidimensional poverty models for the urban and rural areas of the Tupiza river basin, some variables that could guide the construction of policies aimed at improving water access in the Tupiza River Basin were found. According to the results, the improvement of water access in the basin can lead to the reduction of the levels of multidimensional poverty in the households.
For this analysis, we evaluated some hypothetical scenarios based on the econometrical results. As a first step, households from our samples were divided by poverty quintiles, based on the estimated MPI, both for the rural-peri-urban area of the basin and for the city of Tupiza. The purpose was to observe the effects that policies could have on the MPI of each household and the proportion of households that would rise in quintile, which is equivalent to reducing their poverty level. In this case, by evaluating the policies we mean observing how the significant water variables from the econometric analysis can affect the MPI index by changing their actual values (i.e., simulating improvements in water access conditions by upgrading the values of the discrete variables).
For the rural area, the possible effect of policies aimed at the improvement of each of the variables included in the Water Access Index was observed, in addition to the existence of water tanks in the house and the treatment of water before consumption. We basically estimated the changes on the MPI level by moving up the values of the variables into their scales, since all of them were defined as discrete variables. Among these, the policy that would most help to reduce multidimensional poverty is the provision of storage tanks of water in homes, since 65% of households would have a higher MPI (less poverty) and 50% would rise in quintile.
The number of hours in the continuity of daily access to water in households could reduce the level of multidimensional poverty in about 64% of households in the basin and 14% of them would rise in quintile. A third effective policy to reduce multidimensional poverty is to promote the treatment of water before consumption, which would reduce the poverty levels of 33% of rural households and 9% of them would rise in quintile. Finally, access to secondary water sources would also contribute to the reduction of multidimensional poverty in 33% of rural households, helping to raise 5% of these from the quintile. The other policies have important effects in reducing poverty, but they do not achieve a significant advancement of households towards higher quintiles (Table 10).
Table 10.
Effect of water policies on the level of multidimensional poverty in the rural area of the Tupiza River Basin.
In the city of Tupiza, water access for domestic use is greater and better than in the rural area of the basin. The suggested policies to reduce the levels of multidimensional poverty in households are associated with improving continuity in daily access to water and promoting the treatment of water before its consumption.
A greater continuity in daily access to water would reduce multidimensional poverty in at least 21% of households, and 6% of them would rise in quintile. The policy associated with the promotion of water treatment before its consumption would reduce the poverty level of 13% of households, and 8% of them would rise in quintile (Table 11). This last policy can also have indirect positive effects on the health of the population, since it is related to the quality of water for daily consumption.
Table 11.
Effect of water policies on the level of multidimensional poverty in the city of Tupiza.
5. Discussion
Based on the results, a set of water policies that can effectively reduce the multidimensional poverty of households in the Tupiza River Basin have been identified. These policies include action lines related to: (i) implementation of water tanks in rural households, (ii) implementation of irrigation system projects that reach all the crops that families have, (iii) searching for secondary water sources for rural households, (iv) greater continuity in daily access to water in urban and rural households, and (v) information and training of urban and rural households regarding water treatment options. The findings around these policies are summarized below.
Implementing water tanks in rural homes, either for those who have piped water or to harvest rainwater in homes with no-piped water, showed significant reductions in poverty estimates at the household level. Watershed-level actions can be combined with household-level actions to be effective in securing water. This would require connecting these actions with hydrological and water management models, and considering other aspects such as the water pressure in homes and the current and potential supply of water in the communities, among others. The communities that would most benefit from this policy are Tatasi, Oploca, Salo, and Chillco.
Irrigation projects for all the crops that families have, can potentially contribute to reducing poverty levels in rural communities, particularly Gallego, Salo, Oploca, and Almona. Additional technical aspects need to be considered when implementing this or similar policies, e.g., identifying the most effective and viable irrigation systems for each community, the geographical conditions of the communities, the types of crops, the distances between the plots, the current and potential water sources for irrigation, among other hydric criteria.
Identifying potential secondary water sources for rural households can help families have alternative sources of water for domestic water use, particularly to improve supply conditions during drought season and water scarcity periods during the year. This policy must focus on improved sources of water, since most of the current secondary sources households use are rivers or water ditches exposed to external contamination.
Improving the continuity in daily access to water in urban and rural households via the implementation of home connections (piped water) to households without water on their premises and extending the provision of water to households experiencing water supply intermittencies issues. These actions are difficult to apply in all households, particularly in remote rural areas, and will depend, once again, on the geographical conditions and the current and potential supply of water in each community. Those communities that would have more household benefit from a greater continuity of daily access to water are Oploca, Tatasi, Salo, Villa Providencia, and Chillco. The search for secondary water sources can be a policy that complements well with the improvement in the continuity of daily access to water.
Awareness creation and dissemination of information and training to urban and rural households on water treatment options can improve secure safe drinking water for families and improve people’s health conditions. The communities that could benefit the most from this policy are Oploca, Almona, San Miguel, and Salo.
The multidimensional poverty models estimated in this study suggested that: water policies would have a more significant impact on reducing multidimensional poverty in the rural and peri-urban area of the Tupiza River Basin, not so much in the urban area. This is due to the fact that rural and peri-urban communities show more unfavorable conditions of multidimensional poverty and less favorable access to water than the city of Tupiza.
One limitation of this study is that represents the first approximation for the estimation of multidimensional poverty in households in the Tupiza River Basin. For this reason, we were unable to compare our results to other studies’ results. The construction of the indices responds to a specific design, guided by the dimensions of poverty suggested by the Sida, and the characteristics of the study area, captured at a specific moment in time. There may be future measurements that include different variables and dimensions of poverty. Therefore, the comparison between indices must take into account the particularities of each method and the information used in their construction.
6. Conclusions
This study focused on the understanding of the links between water and multidimensional poverty in the Tupiza River Basin, located in the southeast of the department of Potosí, in Bolivia. The purpose is to make sure that watershed-level policies around water management actions include the most vulnerable and remote areas with higher values of multidimensional poverty and lower water access. The results of the analysis of the relationship between water access and multidimensional poverty showed that, both in the urban area (city of Tupiza) and in the rural and peri-urban communities of the basin, water access for domestic use affects the poverty levels of the households. In the rural and peri-urban areas, water access for agricultural and livestock breeding activities also affects the levels of multidimensional poverty of households.
In the rural area, having daily availability of water through a household connection (piped water) represents the most important factor in the rural water index, followed by access to a secondary water source, continuity in daily access to water, and access to an improved water source. In addition to the water index, the effect of other variables associated with water storage and treatment on poverty was also found. In this sense, it was found that the existence of water tanks in the house and the water treatment before consuming it, can also reduce the level of multidimensional poverty of rural households in the Tupiza river basin.
For the city of Tupiza, it was observed that the greater the daily continuity of water in the houses, the lower the level of multidimensional poverty of the households. Similarly, those homes where water is treated before consumption, investments are made to improve water access at the house and secondary sources of water are used (such as bottled water), represent households with lower levels of multidimensional poverty.
Another interesting output of this study is the indicators around mining. In rural areas, mining activities can secure homes for people, something that affects poverty. However, other studies show that wastewater from mining in rural areas contributes to water pollution and health problems [27,28,29]. These are crucial factors to consider in understanding the potential policy actions around water quantity and quality and the socio-economic challenges in source water areas of the watershed.
In the rural area, differences were noticed not only between communities but also within each community alone. This means there are communities that are further behind than others, and households with worse living conditions within the same community. In this sense, it is necessary that the implementation of policies aimed at improving access to water in the communities prioritize those with poorer households, since this would allow reducing the poverty gaps in the Tupiza River Basin.
Supplementary Materials
The following supporting information can be downloaded at: https://www.mdpi.com/article/10.3390/w14172691/s1. Document S1: Household Survey for Rural Areas, Document S2: Household Survey for Urban Area.
Author Contributions
The conceptualization of this work was conducted by S.E. and L.F., with supervision of L.F., S.E. and M.B. The project administration was provided by L.F. Funding adquisition was hold by M.E. Formal analysis and investigation were conducted by S.E, A.L., M.O. and C.T. Survey data curation was conducted by S.E. and A.L. Visualization of indices results was conducted by B.V. The writing—original draft preparation of this article was conducted by S.E. and the writing—review and editing was conducted by L.F., S.E. and M.O. All authors have read and agreed to the published version of the manuscript.
Funding
This research was funded by the Swedish International Development Cooperation Agency (Sida) through Bolivia WATCH Program (Planit No. 11972).
Institutional Review Board Statement
The study was conducted with verbal consent during the survey and interview process. The surveys follow the ethical protocols from QUATRIM SRL Consultores Asociados led by Luis Villarroel (l_villarro@yahoo.es).
Informed Consent Statement
Informed consent was obtained from all subjects involved in the study.
Data Availability Statement
The data that support the findings of this study are available on request from the corresponding author.
Acknowledgments
We would like to thank the municipalities of Tupiza, Atocha, Colcha-K and all the communities from the Tupiza River Basin who supported us during the entire project. Thanks to the local enumerators for their efforts and hard work traveling to the rural communities. Thanks to Sarah Dicken, Kim Andersson and Adriana Soto for leading the water and sanitation components of the survey. To QUATRIM for executing the survey. Thanks go to David Purkey for his support with contractual aspects. Thanks to the SEI-US water program for its support in the preparation of this article.
Conflicts of Interest
The authors declare no conflict of interest.
References
- Programme (UNDP). Global MPI 2020—Charting Pathways out of Multidimensional Poverty: Achieving the SDGs. Available online: https://ora.ox.ac.uk/objects/uuid:81d285e5-d4f3-4a11-a5e1-d9770a06d03f (accessed on 13 December 2021).
- Shatanawi, M.; Naber, S. Valuing water from social, economic and environmental perspective. In Dialogues on Mediterranean Water Challenges: Rational Water Use, Water Price Versus Value and Lessons Learned from The European Water Framework Directive; University of Jordan: Amman, Jordan, 2011; pp. 109–117. Available online: https://om.ciheam.org/om/pdf/a98/00801473.pdf (accessed on 4 January 2022).
- Barbier, E.B. Water and Economic Growth. Econ. Rec. 2004, 80, 1–16. [Google Scholar] [CrossRef]
- Brown, C.; Lall, U. November. Water and economic development: The role of variability and a framework for resilience. In Natural Resources Forum; Blackwell Publishing Ltd: Oxford, UK, 2006; Volume 30, pp. 306–317. [Google Scholar]
- Grey, D.; Sadoff, C. Water for growth and development. In A theme document of the 4th World Water Forum; Water Commission: Mexico City, Mexico, 2006; p. 55. Available online: https://www.worldwatercouncil.org/en/publications/final-report-4th-world-water-forum (accessed on 10 February 2022).
- Cox, W.E. The Role of Water in Socio-Economic Development: Report 1 of IHP-II Project C1 (on Heightening Awareness of the Socio-Economic Role of Water); United Nation Digital Library: New York, NY, USA, 1987. [Google Scholar]
- Bournaris, T.; Berbel, J.; Manos, B.; Viaggi, D. Economics of Water Management in Agriculture; CRC Press: Boca Raton, FL, USA, 2014. [Google Scholar] [CrossRef]
- Molden, D. Water for Food, Water for Life: A Comprehensive Assessment of Water Management in Agriculture; International Water Management Institute: Earhscan, UK, 2007. [Google Scholar]
- Turner, K.; Fao, R.; Georgiou, S.; Clark, R.; Brouwer, R.; Burke, J. Economic Valuation of Water Resources in Agriculture. From the Sectoral to a Functional Perspective of Natural Resource Management; FAO: Rome, Italy, 2004; Available online: https://scholar.google.com/scholar_lookup?title=Economic+valuation+of+water+resources+in+agriculture.+From+the+sectoral+to+a+functional+perspective+of+natural+resource+management&author=Turner%2C+K.&publication_year=2004 (accessed on 4 March 2020).
- UN Water. Sustainable Development Goal 6: Synthesis Report 2018 on Water and Sanitation; United Nations: New York, NY, USA, 2018. [Google Scholar]
- Sida. Dimensions of Poverty Sida’s Conceptual Framework. Sitrus. 2017. Available online: http://www.sida.se/contentassets/07acf1eb6c9e417db80a74b26692d40f/ebd4b37c-c50d-4081-810b-d7a1d5d63a44.pdf (accessed on 18 April 2021).
- Sida. Multidimensional Poverty Analysis (MDPA). 2017. Available online: https://www.sida.se/contentassets/4ecfd42348644d32abbfdccbed6f15c0/mdpa_poverty_analysis.pdf (accessed on 25 January 2022).
- WHO; UNICEF. Progress on Drinking Water, Sanitation and Hygiene; WHO: Geneva, Switzerland; UNICEF: New York, NY, USA, 2017. [Google Scholar]
- Ministerio de Medio Ambiente y Agua (MMAyA). Programa Plurianual de Gestión Integrada de Recursos Hídricos y Manejo Integral de Cuencas 2017–2020; Plan Nacional de Cuencas: La Paz, Bolivia, 2017. [Google Scholar]
- Alkire, S.; Foster, J. Counting and multidimensional poverty measurement. J. Public Econ. 2011, 95, 476–487. [Google Scholar] [CrossRef]
- Alkire, S.; Foster, J.; Seth, S.; Santos, M.E.; Roche, J.M.; Ballon, P. Multidimensional Poverty Measurement and Analysis: Chapter 1—Introduction. SSRN Electron. J. 2014. OPHI Working Paper No 82. [Google Scholar] [CrossRef]
- Alkire, S.; Foster, J.; Seth, S.; Santos, M.E.; Roche, J.M. Multidimensional poverty measurement and analysis. Chapter 8—Robustness Analysis and Statistical Inference. 2015. OPHI Working Paper No 89. Available online: http://www.ophi.org.uk/multidimensional-poverty-measurement-and-analysis-chapter-8-robustness-analysis-and-statistical-inference/ (accessed on 13 March 2022).
- Ministerio de Medio Ambiente y Agua (MMAyA). Elaboración del Diagnóstico Integral y Formulación de la Propuesta de Lineamientos Estratégicos e Institucionales del Plan Director de la Cuenca del rio Tupiza. Informe final. Empresa Consultora DESMA; Programa Plurianual de Gestión: La Paz, Bolivia, 2018. [Google Scholar]
- Llavona, A. Lecciones del Estado Plurinacional de Bolivia para la adopción del enfoque del Nexo: Análisis del Plan Nacional de Cuencas, el Sistema Múltiple Misicuni y las Políticas de Riego. 2020. Available online: https://repositorio.cepal.org/handle/11362/46546 (accessed on 8 December 2020).
- Instituto Nacional de Estadística (INE). Censo Nacional de Población y Vivienda 2012. In Crecimiento Intercensal por Municipios (National Population and Housing Census 2012, Intercensal Growth by Municipalities); Estado Plurinacional de Bolivia: La Paz, Bolivia, 2013; p. 56. [Google Scholar]
- Andersen, L.E.; Canelas, S.; Gonzales, A.; Peñaranda, L. Atlas municipal de los Objetivos de Desarrollo Sostenible en Bolivia 2020; Universidad Privada Boliviana, SDSN: La Paz, Bolivia, 2020. [Google Scholar]
- Agua Sustentable. Sistema de Monitoreo Público Social. 2013. Available online: https://issuu.com/aguasustentable/docs/13a_sistema_de_monitoreo_publico_so (accessed on 13 June 2020).
- Israeli, O. A Shapley-based decomposition of the R-Square of a linear regression. J. Econ. Inequal. 2007, 5, 199–212. [Google Scholar] [CrossRef]
- Olivera, M.; Fuerte, M. Poppy Cultivation and Eradication in Mexico, 2000–2018: The Effects of Climate. In Evaluating Climate Change Impacts, 1st ed.; Lyubchich, V., Gel, Y.R., Kilbourne, K.H., Miller, T.J., Newlands, N.K., Smith, A.B., Eds.; Chapman and Hall/CRC Taylor and Francis: New York, NY, USA, 2020; pp. 380–398. [Google Scholar] [CrossRef]
- Huettner, F.; Sunder, M. Axiomatic arguments for decomposing goodness of fit according to Shapley and Owen values. Electron. J. Stat. 2012, 6, 1239–1250. [Google Scholar] [CrossRef]
- Brown, J.D. The Cronbach alpha reliability estimate. JALT Test. Eval. SIG Newsl. 2002, 6, 17–18. [Google Scholar]
- Damania, R.; Desbureaux, S.; Rodella, A.; Russ, J.; Zaveri, E. Quality Unknown: The Invisible Water Crisis; World Bank: Washington, DC, USA, 2019; License: Creative Commons Attribution CC BY 3.0 IGO. [Google Scholar] [CrossRef]
- World Bank Group. The Connections between Poverty and Water Supply, Sanitation, and Hygiene in Panama: A Diagnostic; World Bank: Washington, DC, USA, 2018. [Google Scholar] [CrossRef]
- Wijnen, M.; Augeard, B.; Hiller, B.; Ward, C.; Huntjens, P. Understanding and Improving Groundwater Governance. 2012. Available online: https://openknowledge.worldbank.org/bitstream/handle/10986/17228/717420WP0Box370naging0the0invisible.pdf (accessed on 5 December 2021).


Publisher’s Note: MDPI stays neutral with regard to jurisdictional claims in published maps and institutional affiliations. |
© 2022 by the authors. Licensee MDPI, Basel, Switzerland. This article is an open access article distributed under the terms and conditions of the Creative Commons Attribution (CC BY) license (https://creativecommons.org/licenses/by/4.0/).