1. Introduction
The prompt spread of the Severe Acute Respiratory Syndrome-Coronavirus-2 (SARS-CoV-2 virus), responsible for the COVID-19 pandemic, has imposed challenges on the entire world since late 2019. As the extent of the pandemic remains indeterminate, even with the continuing vaccination process, governments have been forced to apply measures to tackle the propagation of the virus. The actions taken to minimize the consequences of the SARS-CoV-2 virus spread differ in every city according to specific characteristics such as population and healthcare system capacity. Social distancing, mandatory face masks, frequent handwashing, and the disinfection of regularly manipulated surfaces have been the most common and effective measures. In this context, the aim of restricting social interactions has sought to avoid the collapse of healthcare systems, delaying the spread of the virus. Consequently, the habits of people have been altered, triggering variations in the water consumption patterns of cities. As water sector workers worldwide have reported [
1,
2,
3], these sudden variations have impacted the operation and finances of water utilities. Hence, understanding how water demand changed and how the systems responded is crucial to prepare for any coming unexpected event and enhance emergency contingency plans.
Several investigations in cities around the world evidenced that sudden variations in the lifestyles of people modified water consumption patterns, potentially affecting the water supply systems. For instance, 86% of responses to a survey in Saudi Arabia indicated an increase of around 50% in their water demand [
4]. Moreover, Abu-Bakar, Williams, and Hallett studied the specific effect of changes in households’ water usage practices in England by analyzing clusters of water consumption patterns and studying how the pandemic modified them. Among their results, users who typically consumed more water in the late morning augmented water demand by 37% on average, and households who usually used more water in the early morning reduced their morning peak contribution from 40% to 20% [
5]. In Hamburg, Germany, the daily water consumption increased by 14.3% in households according to results from linear mixed models. A shift of 1.5 h was noticed in the morning water usage peak, in addition to a more extensive evening peak [
6]. Similar observations were obtained for five towns in the Puglia region in Italy when comparing 2019 to 2020 water demand records. For small towns, the morning peaks were delayed by 2–2.5 h, sporadically merging with the afternoon peaks. In larger towns, a drop in the peak and base water demands was evidenced due to reduced incoming commuters because of the pandemic restrictions [
7].
Not only has domestic water usage been affected, but also other economic sectors. A study conducted in Henderson, Nevada, demonstrated an increase of 11.7–13.1% in residential demand and a drop of 34.1–35.7% and 55.8–66.2% in commercial and schools’ water average daily demand, respectively, by comparing 2020 records to previous years [
8]. In the study of Kalbusch et al. for Joinville, Brazil [
9], an increase of 11% in domestic water demand was demonstrated using statistical tests, while a decrease of 42% was estimated for daily commercial water use. Similarly, a reduction of 53% was evidenced for industrial water demand and 30% for public demand [
9]. Analogously, Li et al. [
10] evaluated the pandemic response exclusively by neglecting the effect of other water consumption variation drivers, such as precipitation or population growth. The authors found an average decrease of 7.9% in the total urban water use in California using multivariate regression models. The total reduction in water demand is mainly due to a decrease in water usage in the commercial, industrial, and institutional sectors of 11.2%, while there was a slight increase in the residential sector of 1.4% [
10].
These water consumption variations have affected the operations and financial performance of water utilities. Numerous utilities have had to work in non-design conditions and with decreased workforce and financial capabilities [
2]. Water supply systems are designed according to an estimation of the future water demand according to historical consumption patterns. However, the pandemic has triggered different scenarios that the systems must confront [
11]. Thus, sudden demand variations, which imply a relocation of water use, might have added more pressure to certain network elements. Furthermore, depending on the tariff structure, the proportion of domestic and non-domestic users, and the water usage changes, utilities were likely to experience revenue losses, heightening the strained circumstances arising from higher operational costs and non-payment from economically affected customers [
12]. For instance, significant drops in industrial and commercial water demand substantially reduce water utility revenues [
13]. Cities dependent on affected economic activities, such as tourism, have been the most affected [
3].
As the World Health Organization (WHO) states, the availability of fresh water is crucial to preserve human health and reduce the spread of the virus, particularly during the COVID-19 pandemic [
14]. Therefore, water supply systems must be resilient to unstable and uncertain situations. Based on the latter, long-term planning is essential for adapting water systems, especially as many cities are facing or expecting to handle water stress due to population growth, gentrification, and climate change. The pandemic experience gives an insight into upcoming water demand variations and revenue modification due to these phenomena [
2]. The analysis of actual water usage changes demonstrates its capability to provide valuable information for water agencies, managers, and policymakers [
15]. In this way, a set of actions can be taken consciously and determinedly to secure present water needs and adapt operations and infrastructure for future water supply requirements. Hence, this study aimed to assess the impact of the pandemic on the water consumption patterns and location in four Colombian cities and its financial consequences on water utilities. Consumption data collected by water utilities were employed for this aim, demonstrating that it should be used as a tool for enhancing water distribution systems. Obtaining and organizing water demand information was a relevant challenge, indicating how water utilities should prioritize good data management to facilitate system analysis, operation, and control.
Following this introduction, the materials and methods used in the analysis are presented, including a detailed description of the case studies. For this study, the data from each city differed significantly among utilities, but it was possible to organize and unify it for the analysis, resulting in valuable outcomes. The results for water demand variations, spatial differences, and financial impacts are presented and discussed in the next section. Financial impacts were found to be one of the most important contributions, showing how water utilities are highly vulnerable to water demand variations. Finally, the last section presents the most relevant conclusions from the study.
3. Results and Discussion
This section presents the non-pandemic water consumption scenario estimation for each case study obtained through multivariate regressions. The outcomes were analyzed concerning water demand changes and spatial differences. Additionally, the impact on water utilities’ revenues was assessed by comparing the expected income for the theoretical non-pandemic scenario to the actual income for water consumed during the COVID-19 pandemic.
3.1. Water Demand Alteration
Initially, two sets of historical data were prepared: the 2016–2018 records for adjusting the models and the 2019 records for validating them. Nonetheless, the results were not satisfactory. Since the time series of available data is short, it was concluded that the entire series was essential to capture the water demand changes and patterns. Hence, using all the information as a training set was preferable. The regression models were fitted independently for each user category in each zone of the case studies (see Spatial Scale in
Table 2), resulting in multiple regression models. Aggregated regression results were estimated to evaluate the prediction capability and the significance of the explanatory variables at a significance level of 5%. The explanatory variables’ significance level is briefly described here, and more details can be found in the
Supplementary Materials.
For domestic water demand, the number of users is a significant predictor variable for most regression models. In contrast, precipitation is not a significant parameter in any case study, whereas temperature, tariffs, seasonality, and commuting population are. The maximum temperature presents a significant influence in City B since the weather presents high variations, and household water usage seems to increase when the temperature rises. Similarly, tariffs in City C are a good explanatory variable, suggesting a savings-oriented culture. The floating population is also significant due to the importance of tourism. Seasonality is a relevant factor in City D, which might be due to the educational activities performed in the city, so the academic calendar influences water demand patterns.
Regarding non-domestic demand, the number of users is significant for commercial demand in Cities A, B, and C, and seasonality and fixed tariffs in City D. Since this category includes the most common businesses visited by travelers, the commuting population was expected to be influential. However, many commuters could either live or arrive at residencies, increasing domestic water demand rather than commercial demand. Further, it is challenging to establish variables that could explain the variations in industrial and public water demand, considering that this profoundly relies on industries and public institutions’ operations, which are usually confidential information. For industrial water demand, the variables evaluated show that the number of users is a significant variable only in City C. For public demand, the number of users is determinant in all cities except City D. As observed with the domestic demand, seasonality in City D significantly explains the public water demand variations, confirming that the academic schedule may influence water consumption patterns.
Finally, total water demand could be determined by a considerably extensive list of parameters since it is the aggregation of water usage. Nonetheless, only the number of users had a statistically significant influence in all cities. These results evidence the struggle to find variables that could explain the variations in water consumption, especially for industrial and public categories, and suggest the need to explore more predictor variables. For instance, output elasticity measures, such as the number of employees or employee hours, are meaningful for explaining commercial and industrial demands [
32]. Related to public demand, the size of buildings, the number of students, the average time spent in universities or schools, and the number of beds in hospitals, among other factors, could affect water usage. Therefore, more accurate models could be computed with this information. However, it was not possible to build these models due to the availability of data and the aggregation of water usage categories presented in this paper.
Thus, although only some of the explanatory variables are statistically significant, the prediction capacity of the models is acceptable.
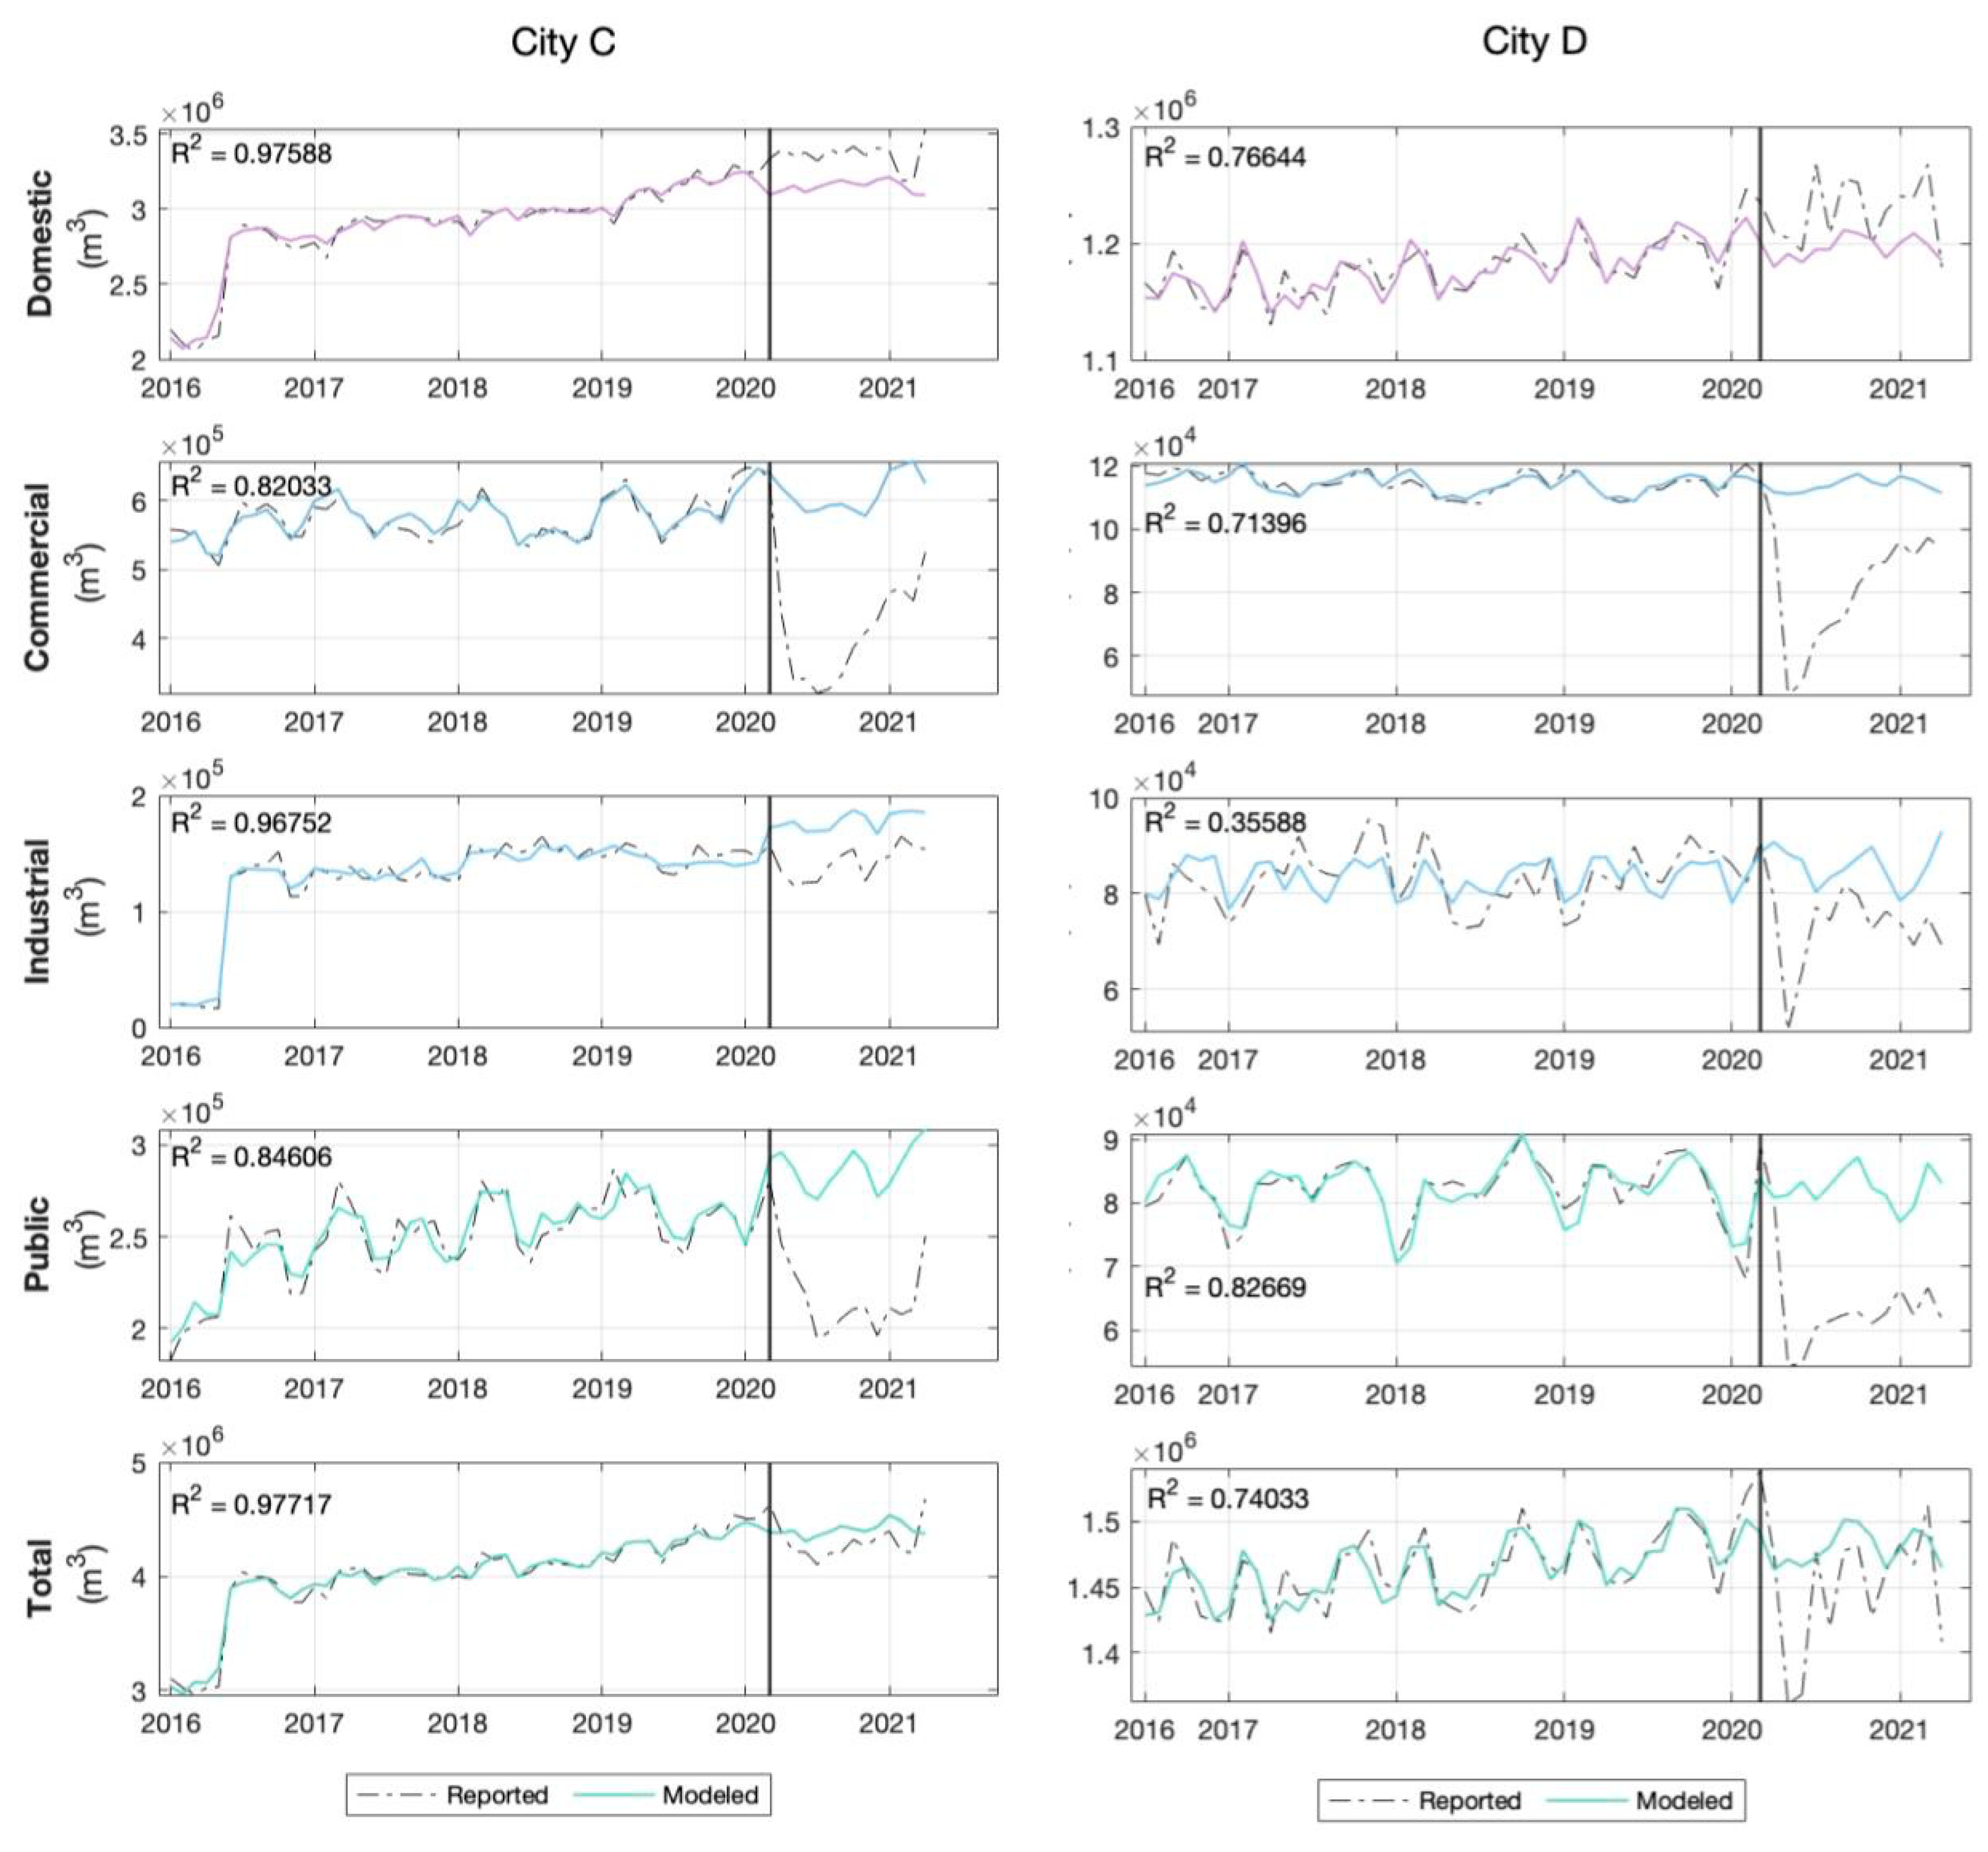
Figure 3 is presented to show the general results, including the accuracy of the models.
The model’s general accuracy is illustrated in
Figure 3 by comparing the predictions (Modeled) and the actual water consumption (Reported) in the four cities for pre-pandemic records (before black vertical lines). The corresponding determination coefficients (R
2) for calibration data are shown on the right of each plot. The prediction capacity of the models is good for almost all models, especially for domestic, commercial, and total water demand. These results allow the estimation of the pandemic’s impact on water demand; however, it is not possible to rely entirely on the obtained values since there is an implicit uncertainty. If the estimations were to be improved, adding new variables and modifying the parameters used in the regression models would be necessary. Furthermore, even though selecting an appropriate modeling method is challenging for academics and researchers, changing the modeling technique could be tested since the autocorrelation between the prediction variables employed for water demand forecasting affects the results [
27]. Nonetheless, for the purpose of this research, the methods used provide reasonable outcomes that allow estimating the effect of the pandemic on water demand, so no further models were investigated.
Moreover,
Figure 3 also presents the actual and the forecasted pandemic water demand (after black vertical lines). The comparison between both time series shows the effects of the pandemic in each case. This pandemic effect assessment is detailed in the following sections for domestic demand by socioeconomic strata; commercial, industrial, public, and total water demand; differences regarding zones in the cities; and financial effects for water utilities.
3.2. Socioeconomic Differences in Domestic Water Demand Changes
Based on the availability of information for City A, the results of the demand assessment cannot be accurately compared with those obtained for the other cities. Data from Cities B, C, and D comprise periods of the pandemic for which stay-at-home measures were less severe. Nonetheless, consistent results for the four cities show different effects of the pandemic on domestic water demand according to the socioeconomic level of users.
Figure 4 shows the percentage difference between the actual and the estimated water demand volumes for each case study in the periods for which data was available. Notably, the water demand pattern for Strata 6 users in City A shows a rare tendency with abnormal peaks going down and up in May–June and July–August, respectively. These peaks may be attributed to data aggregation on a bimonthly basis due to errors in data management, yet the exact cause remains uncertain. Furthermore, between January and February 2020, a 0% difference would be expected because the data were used for fitting the models. Nonetheless, the differences are minor but not zero, which is attributed to the model’s forecasting capacities. Thus, it is not possible to study the obtained values precisely, but the outcomes are still a reasonable estimation of the pandemic impacts.
As seen in
Figure 3, the net pandemic domestic water consumption volumes are slightly larger than the estimated non-pandemic scenario for all the case studies. Hence, results show how COVID-19 provoked increased domestic water consumption in Colombian cities, as seen in multiple case studies worldwide [
4,
5,
6,
7,
8,
9,
10,
15]. This increase is particularly appreciable for Strata 1, 2, and 3 users, which are the most abundant among utility customers. Thus, these changes generated a general increase in domestic demand.
A common interesting observation for the four cities is that the high-strata users had an average diminishing water consumption since the pandemic started. This observation indicates an unusual behavior explained by wealthy people leaving the cities to spend quarantine in calmer places, such as farms, vacation houses, or small towns. A similar phenomenon was observed in the United States, especially in large cities such as New York. For instance, evidence from Federal Reserve Bank of New York/Equifax Consumer Credit Panel (CCP) data shows an increase in out-migration in several urban neighborhoods across counties [
33]. Hence, taking advantage of remote work and study, people relocated to avoid contact with other people, to spend time with their families in less populated areas, or to save money on housing. In this way, their water consumption also relocated, triggering variations in the water demand patterns of big cities, as for the case studies from this research.
These changes in domestic water consumption have direct implications for water utilities. Based on the results, the average water demand increase did not exceed 7% for any case study (see
Table 3), so no operational challenges were expected. However, as high-strata users left the cities, the major revenues dropped, leading to economic losses.
3.3. General Changes in Water Demand
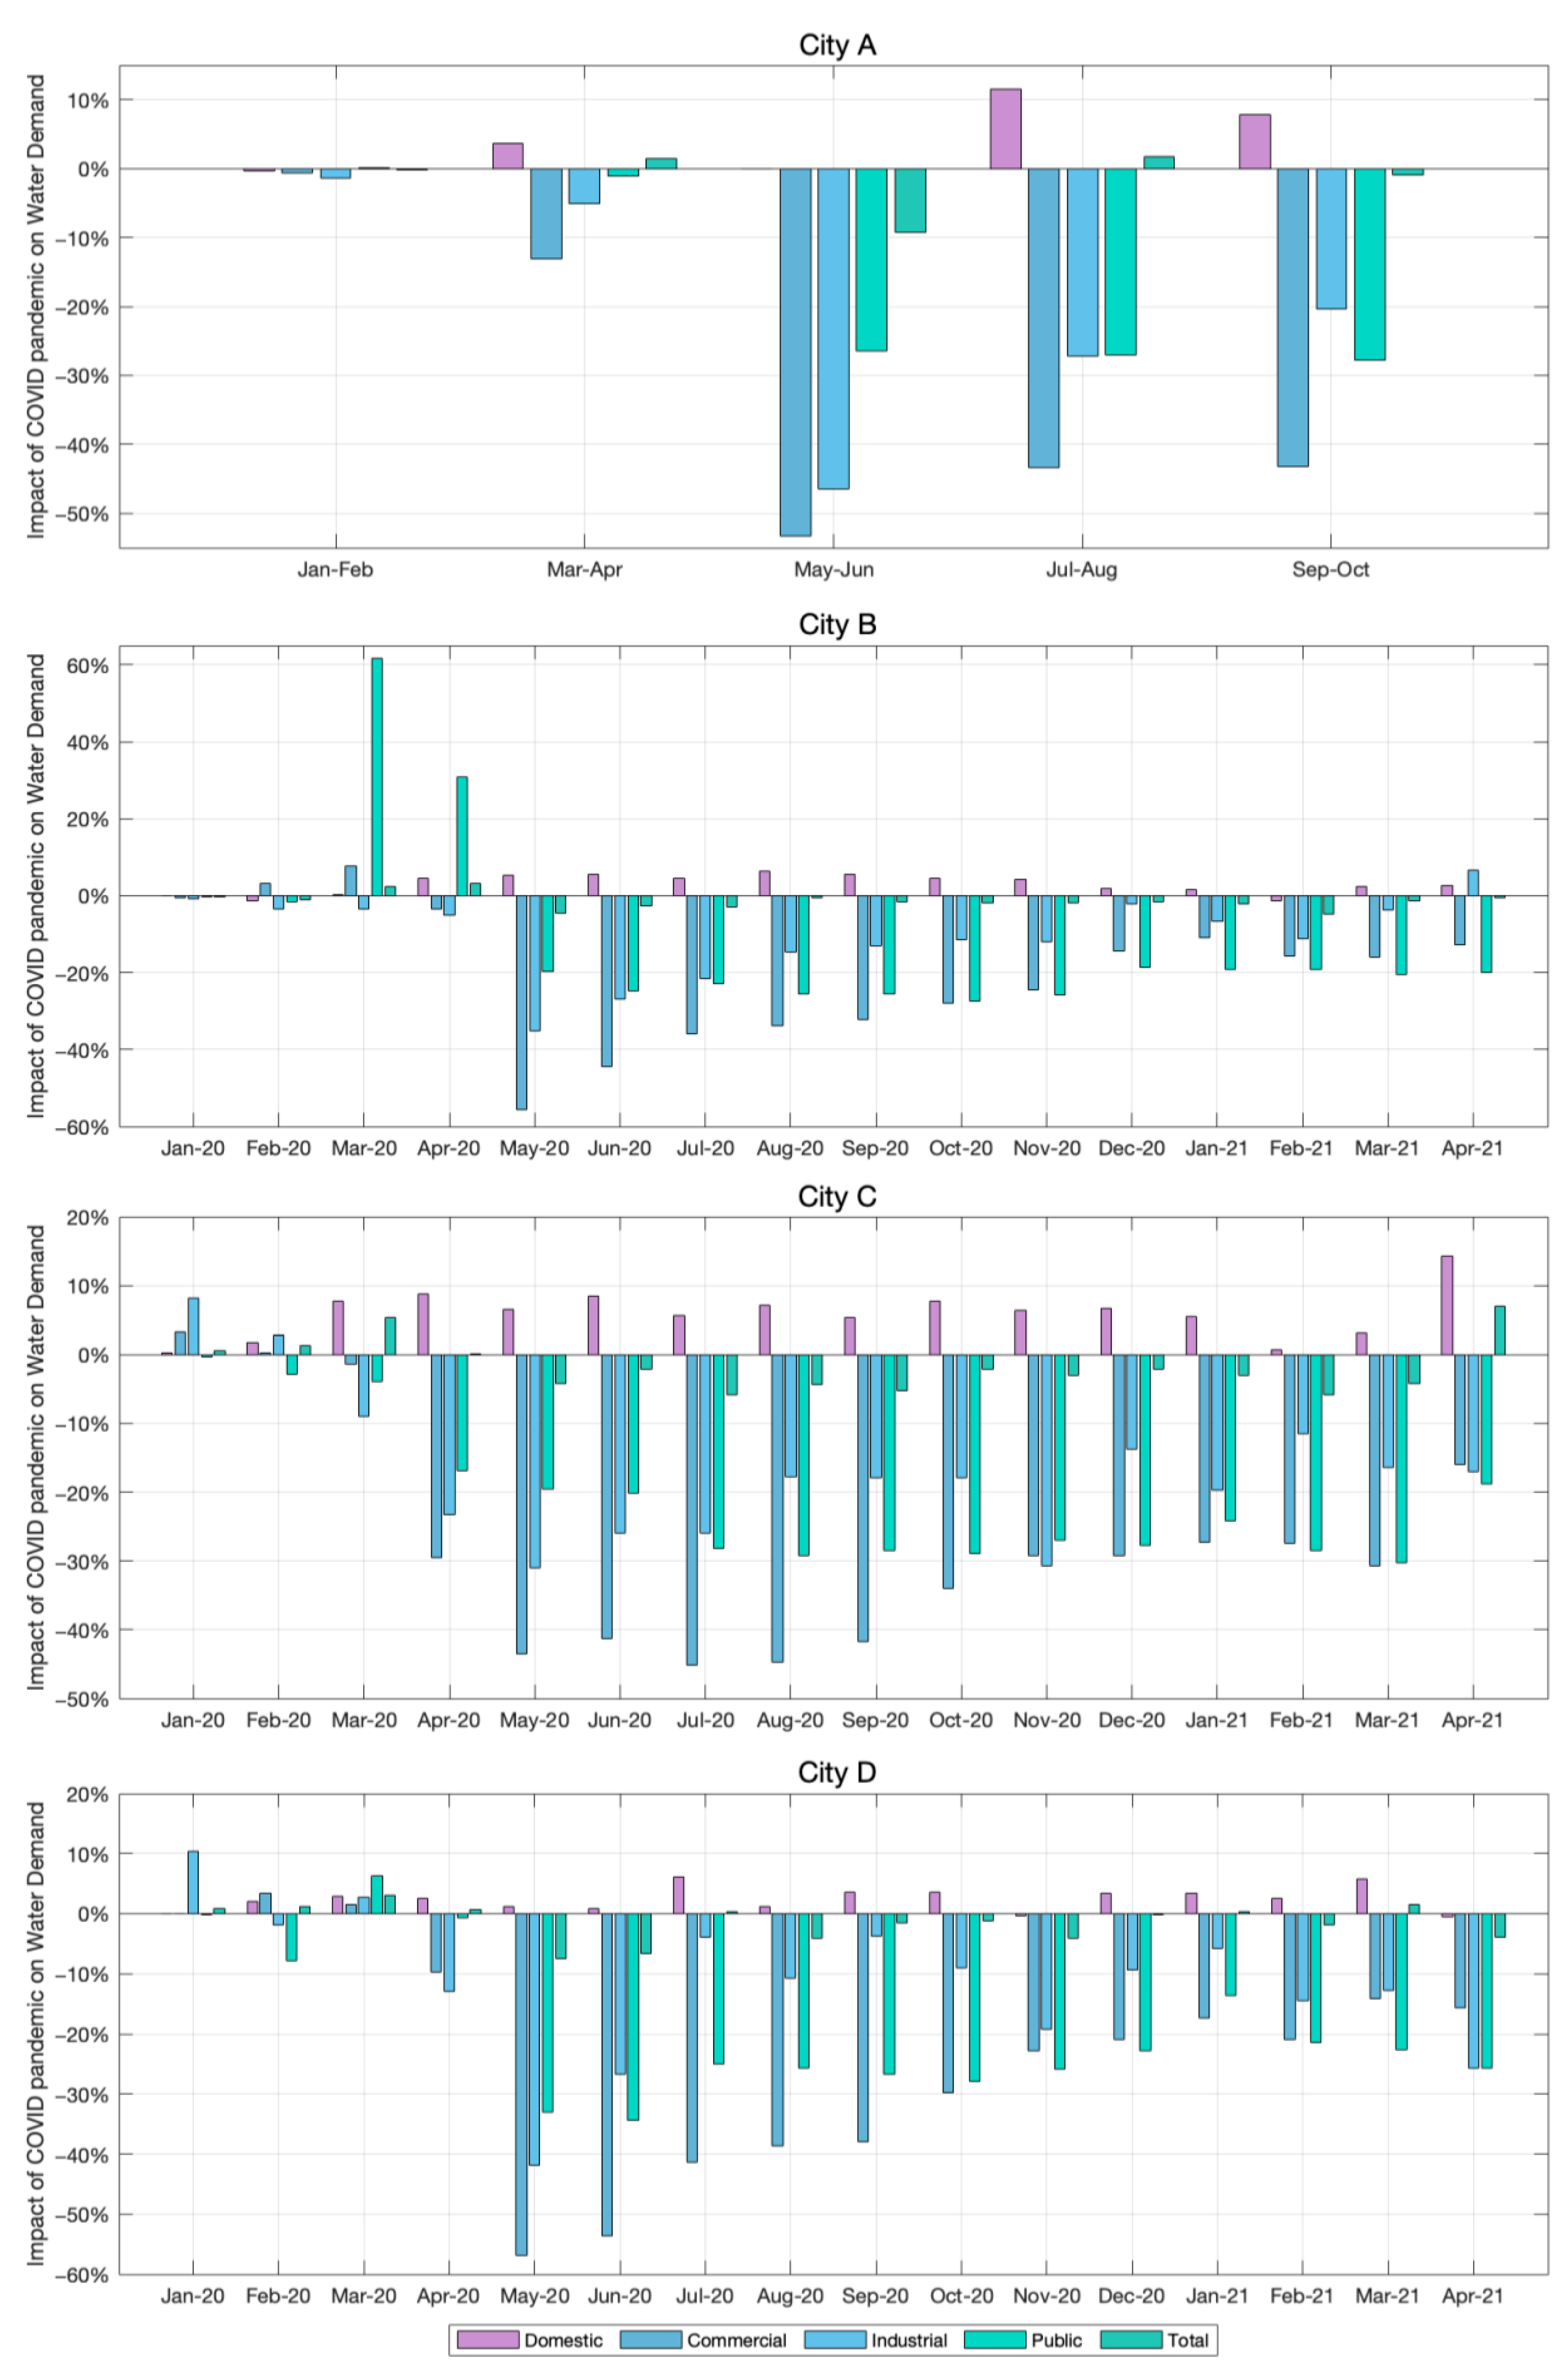
In contrast to the results for domestic demand by socioeconomic strata, the consumption changes for the commercial, industrial, and public categories vary from one case study to another. This effect is associated with the cultural and economic characteristics of the cities. A comparison between the actual and the estimated COVID-19 pandemic water consumption volumes for each user category is presented in
Figure 5. Moreover, the average variations for the available periods are presented in
Table 3.
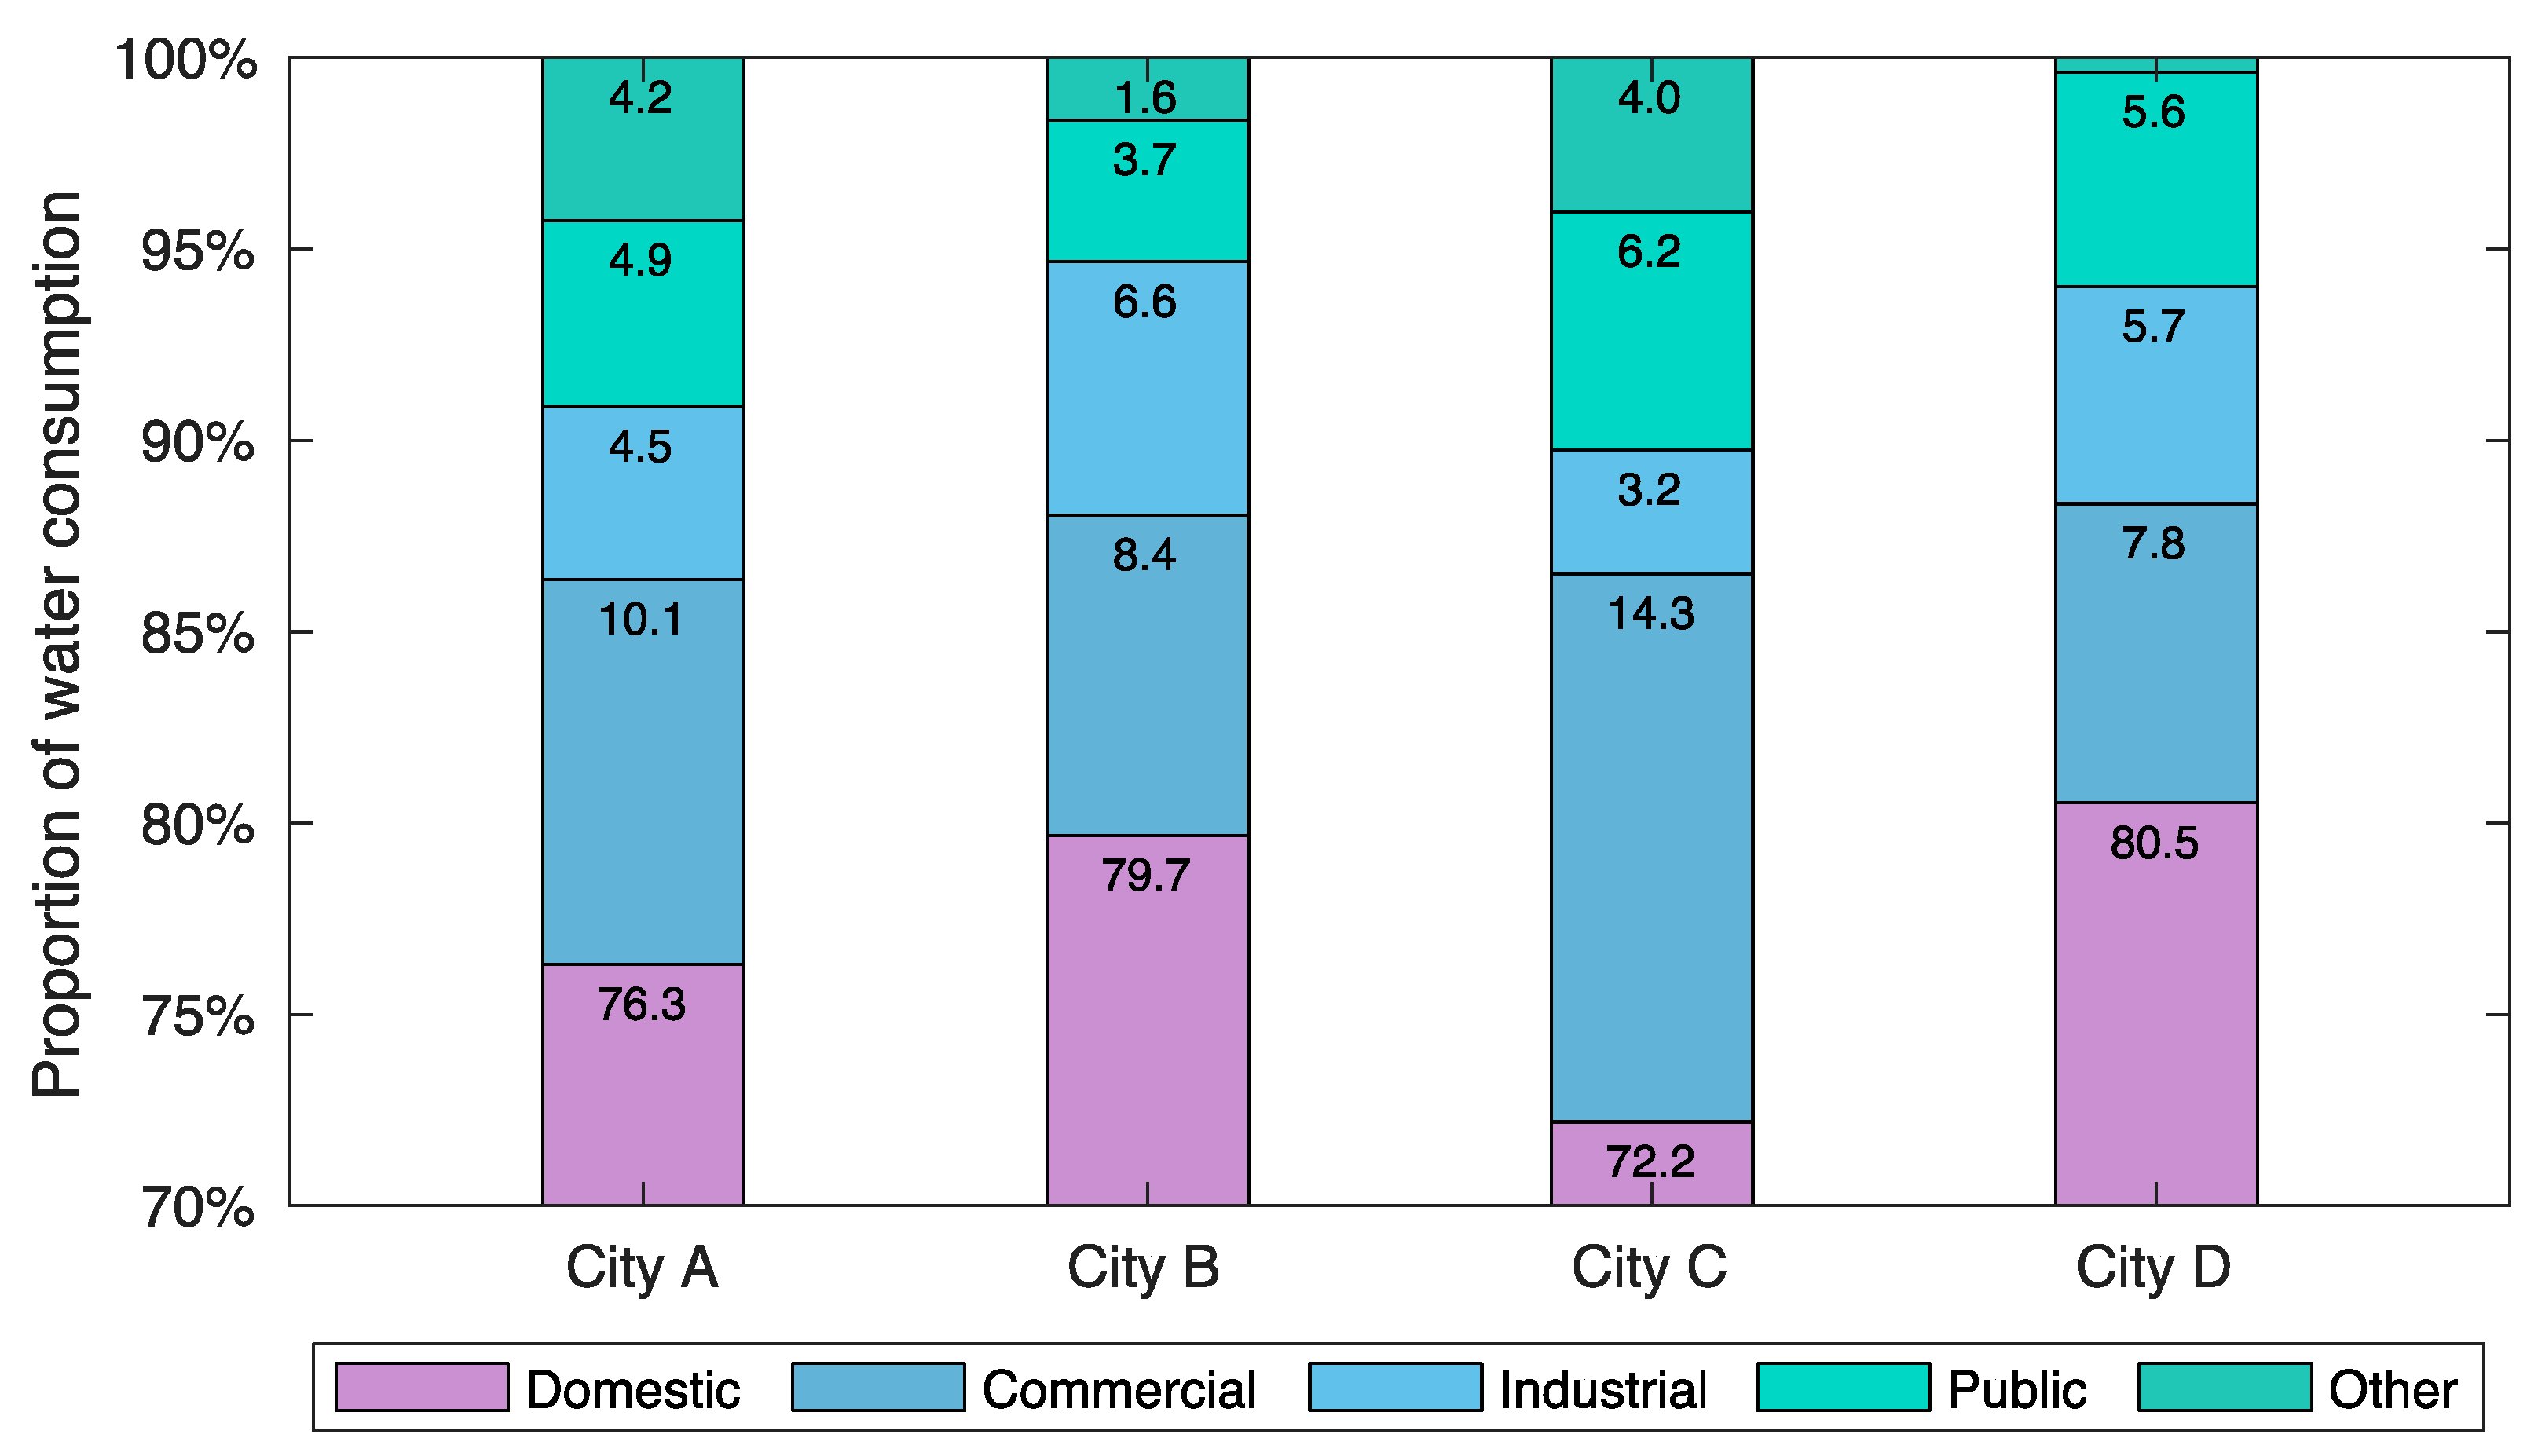
As
Figure 5 shows, monthly domestic water consumption increased slightly or remained practically untouched for all case studies. The cities where domestic demand increased the most (Cities A and C) are where the proportion of high-strata users is the smallest. Therefore, the differences in the magnitude of domestic consumption increase are explained by the reduction in water usage by high-strata users, as previously mentioned. Nonetheless, the changes in domestic water demand are much smoother than the drops in non-domestic water consumption, as occurred in other case studies such as those presented by Irwin et al. [
8], Kalbusch et al. [
9], and Li et al. [
10]. Commercial demand is the category that decreased the most. Here, it is important to consider that City A’s outcomes correspond to a period having more drastic pandemic response measures, so the values presented in
Table 3 seem more drastic. Nonetheless, when considering only the cities with the same data time frame, it is possible to notice how the strongest effects on commercial demand were in City C. This observation is consistent as commercial users are predominant among all the non-domestic users for this case study, corresponding mainly to hotels due to the economic importance of tourism. In this way, results for Colombian case studies are consistent with those of Boyle et al. [
3], indicating that touristic cities have been the most affected during the pandemic.
Regarding industrial water usage, the effect of the pandemic also showed a severe reduction in consumption as only essential activities in industries were allowed to develop normally. Comparing the same time frame (from March to October 2020), the average drop was 25% in City A, 21% in City C, 16% in City B, and 12% in City D. The cities with the largest proportion of industrial water consumption, Cities B and D, had the lowest reduction in industrial demand. Therefore, due to the financial value of industries, it can be presumed that the companies rapidly applied measures to be allowed to operate as usual or at a reduced capacity, so the water demand was less affected. In contrast, the effect for Cities A and C was stronger because of the slower recovery of industrial activities.
Concerning public water demand, the general effect was also an average decrease, as
Figure 5 and
Table 3 present. A limitation appears in analyzing the main reasons for variations in public demand since this category considers diverse institutions and cannot be studied accurately. Nonetheless, the large drop can be associated with the closure of academic institutions, especially for City D, since it is considered a college town. For instance, the sustained reduced monthly consumption appreciated in
Figure 5 for all cities could be related to a significant acceptance of remote studying. Further, the water demand variations are influenced by other institutional activities. In this way, a remarkable observation was the rise in consumption during the first months of the pandemic in City B, which might be due to increased procedures in hospitals and hygiene controls.
Finally, the net demand depends essentially on the proportion of domestic and non-domestic users [
15]. As domestic water consumption is predominant in all the cities, the mild increase in the demand also implied a rise in the total demand. However, as occurred in Henderson, Nevada [
8], Joinville, Brazil [
9], and some Californian cities [
10], this effect was neutralized due to larger commercial, industrial, and public water consumption changes. Therefore, total demand for the Colombian case studies had a small average demand change, as
Table 3 shows.
3.4. Analysis of Spatial Variation
As people stopped consuming water in their workplaces and public spaces due to lockdowns, and performed their entire water-consuming practices within their homes, a portion of non-domestic demand was expected to relocate to residential households [
11]. Based on the results, the fact that total water usage remained almost untouched allows hypothesizing that non-domestic consumption moved to households. Hence, information from water demand was analyzed by spatial zones to study this displacement of water consumption.
Figure 6 is presented to show the distribution of the average variations in water demand in each of the zones in the case studies.
As
Table 2 shows, the data from Cities B, C, and D are divided into multiple district metered areas that allow observing spatial differences. Nevertheless, City A records were unavailable in detailed geographic divisions, so the results are presented for only five administrative supply zones. These zones correspond to the areas the water utility operates for commercial management. Considering these data,
Figure 6 illustrates water demand changes in each zone of the cities through the average relation between actual and expected non-pandemic consumption. Values over 1 correspond to zones where the demand increased and, conversely, where water usage decreased.
Concerning the domestic category, more than 50% of the zones showed a slight rise in water usage. In comparison, another significant proportion (40% in City A, 43% in City B, and 42% in City C) evidenced almost no change. In the case of City D, 62.5% of the zones had almost no change in water demand, and 30% had increased consumption. In Cities B, C, and D, where the size of the zones allows a better understanding of the results, the locations with the lowest proportion of residential users within the cities are where domestic consumption increased the most. Hence, the changes in each zone are related to the proportion of users from each socioeconomic strata, where demand increased in places having more low-strata customers.
Furthermore, left-skewed histograms in
Figure 6 were obtained for almost all the alterations in non-domestic water demand patterns, indicating a decline in consumption in most of the zones. Specifically, commercial water consumption decreased abruptly in the first months of the pandemic in the areas with abundant commercial premises, but it started to return to normal levels in late 2020. However, in the zones with fewer commercial users, consumption remained low. In some areas, the demand was not affected at the beginning of the pandemic and progressively increased when restriction measures were relaxed, resulting in higher average consumption than expected. These findings are more appreciable in City C as the touristic destinations were more demanded in late 2020 when people were allowed to travel.
Regarding the industrial water demand, different affectations can be noticed in
Figure 6 for each case study. As discussed before, the importance of industries generated a rapid consumption recovery in City B, represented by a high proportion of users with average unchanged water demand. An analogous observation was obtained for City D, with a high proportion of industrial average untouched demand. In contrast, the decreasing effect was more significant in Cities A and C, especially for zones with abundant industries. The consumption increased in zones having a small proportion of industrial users. As some utilities reported in the study conducted by Zechman et al. [
1], this effect may have resulted from higher production of essential goods in those places because of commuting limitations, such as food and beverage manufacturing. Similarly, the effect on public water usage differed regarding the predominance of schools, universities, hospitals, and other institutions. For example, the consumption increased during July–August 2020 in zones with healthcare facilities for all case studies and January–February 2021 for Cities B, C, and D. Both terms coincide with periods where contagions of COVID-19 peaked in Colombia, represented in increased hospital water usage.
Finally, the total water consumption histograms in
Figure 6 evidence the general pattern of the classified water demands. In City A, the increases in domestic consumption and reductions in non-domestic consumption balance the net changes completely in each zone. In Cities B, C, and D, most zones also show a net equilibrium between the decreases in non-domestic usage and the rises in domestic water usage. Nonetheless, for Cities B and C, a considerable proportion of zones presented an average increase in demand (41.1% and 44.5%, respectively). These zones correspond to the places with increased industrial and public demand, additional to the domestic rises. This effect in City D is balanced due to the non-increments in industrial demand and the predominance of academic institutions’ water usage drops for public water consumption.
3.5. Financial Impacts Estimation
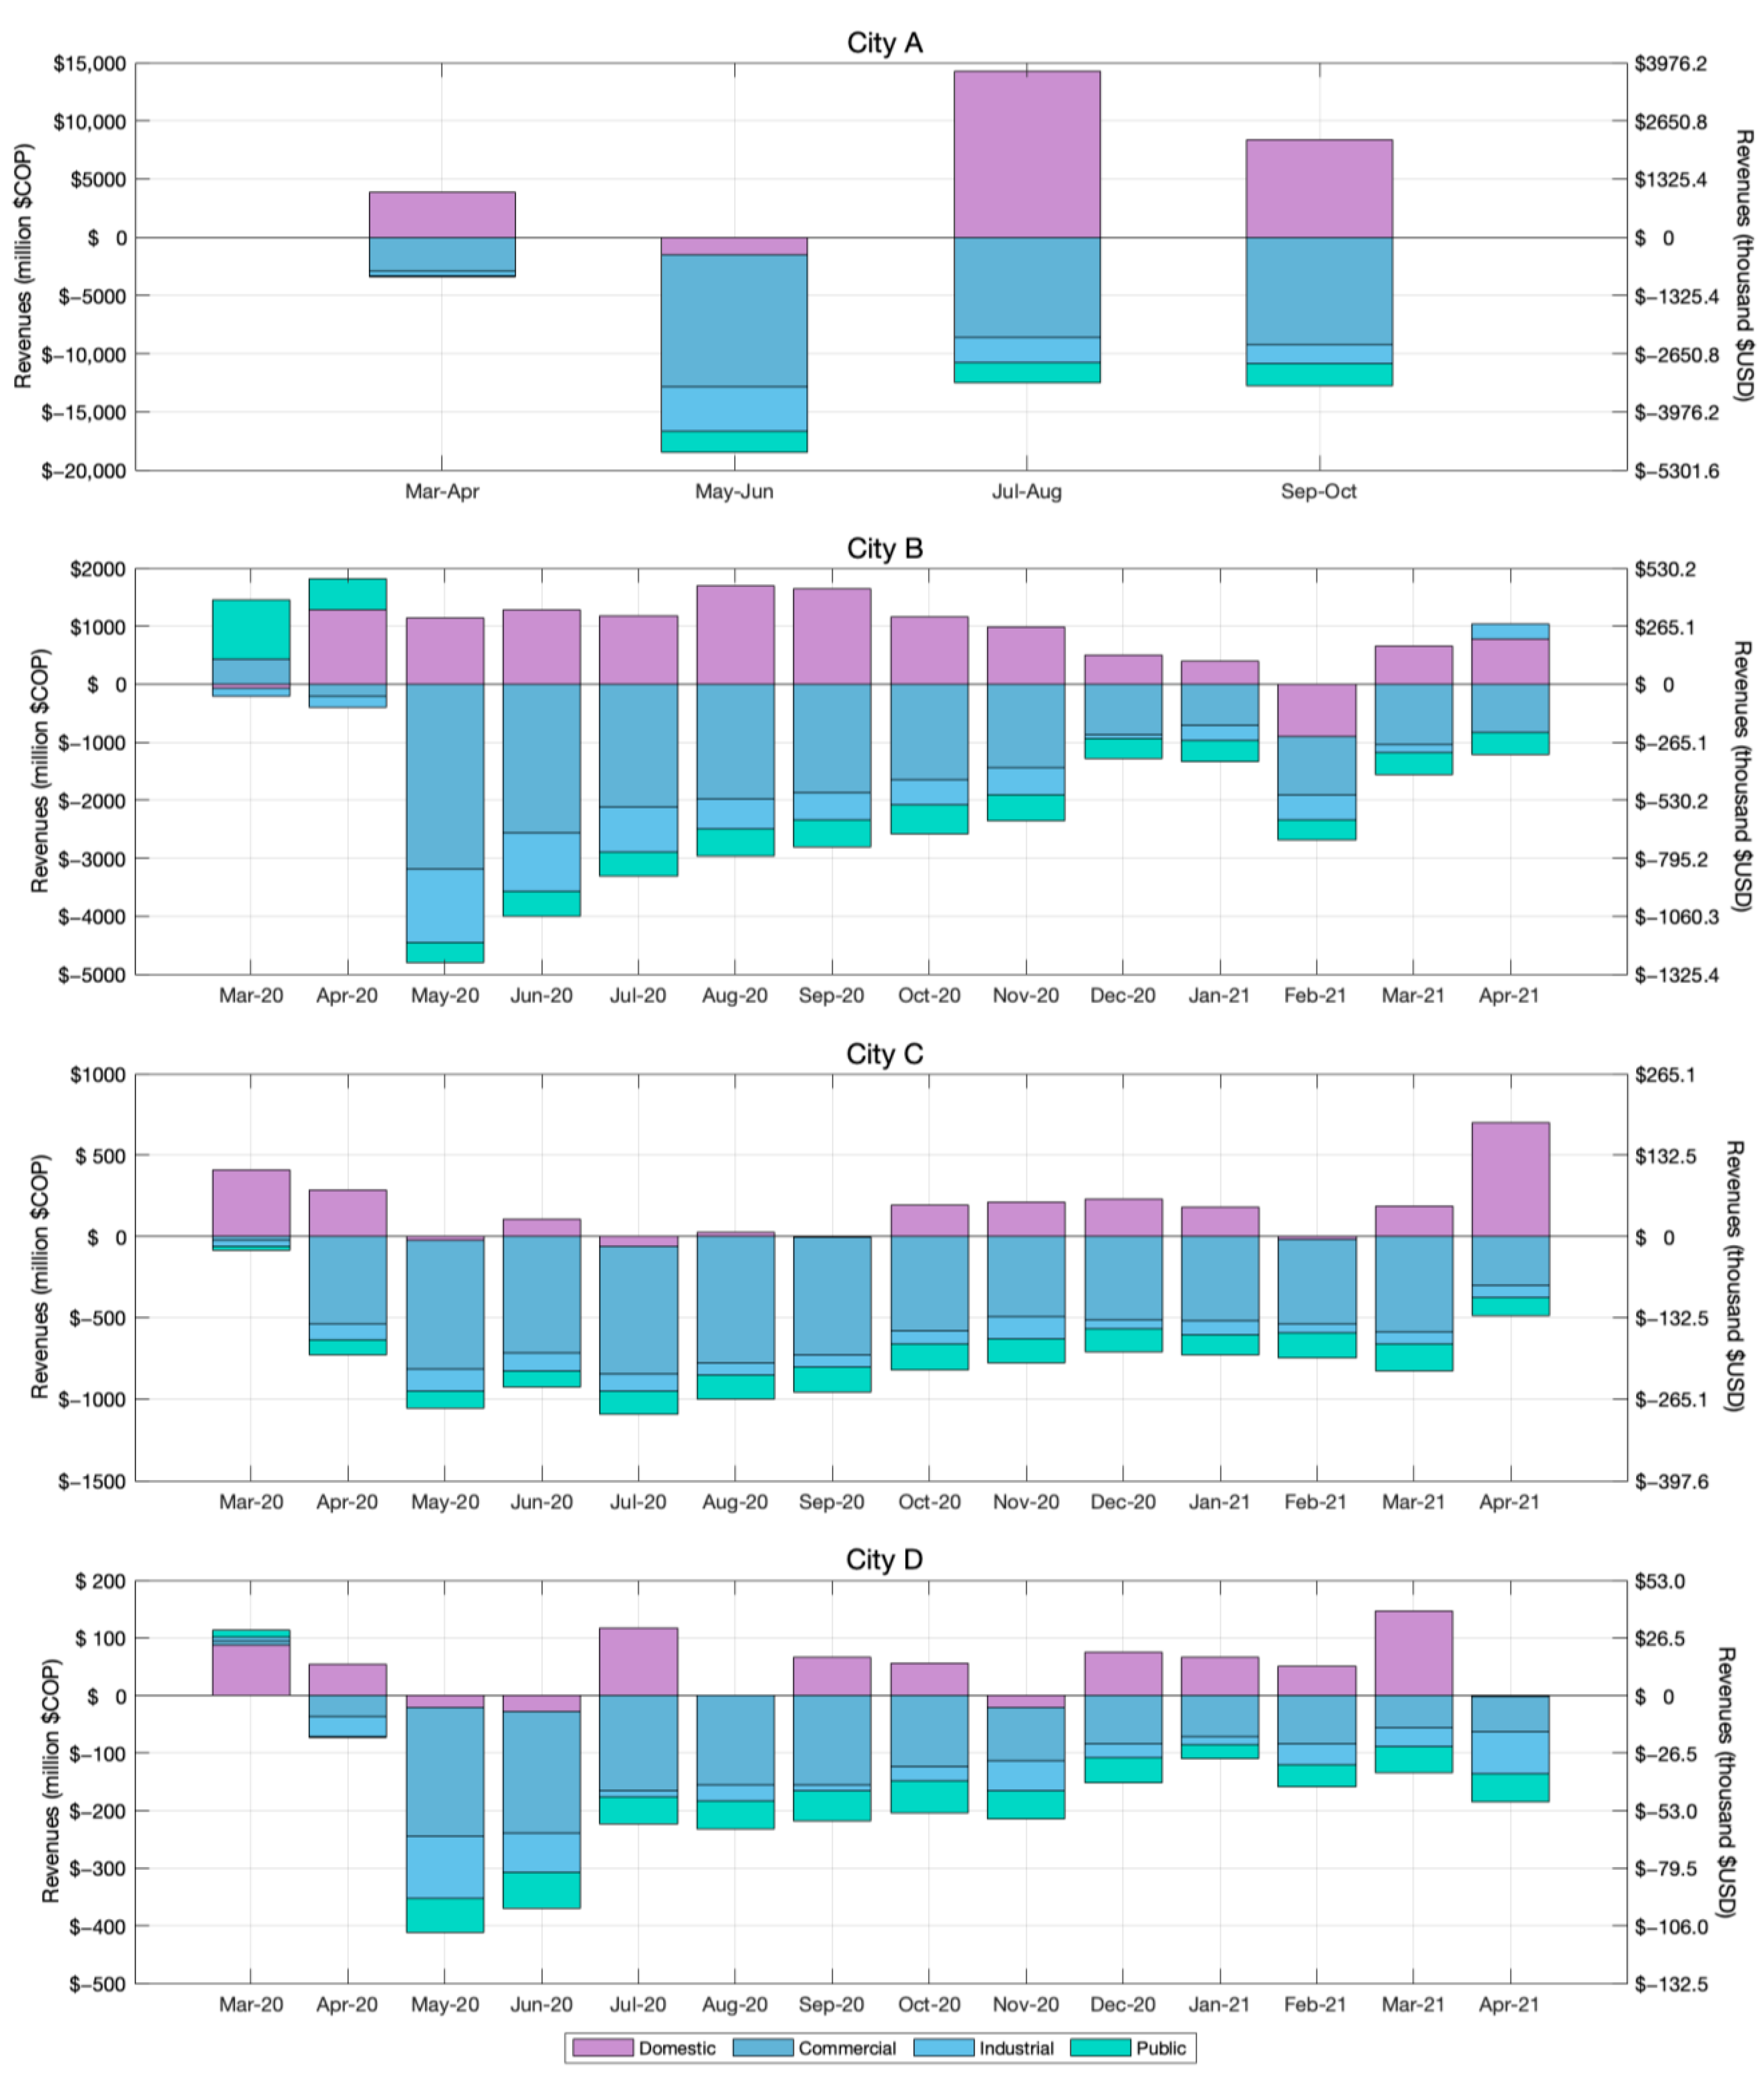
Even though the net consumption changes are mostly counterbalanced between domestic and non-domestic demand in all cities, the relocation of water demand implies a shift in the type of user consuming water. In this way, income for utilities was significantly modified since tariffs are differentiated for the type of user in Colombia. Therefore,
Figure 7 shows the difference between actual and expected revenues for every water demand category.
In general, the first two months of the pandemic in each case study showed positive net revenues. For Cities A, C, and D, this is due exclusively to the increased domestic water demand. In contrast, the increase in public water consumption in City B also generated higher income than predicted. Afterward, revenues suffered a reduction from the expected values because of the drop in non-domestic water consumption. The slight increases in domestic demand reduced the effect of the total water demand reduction; however, the outcomes showed net revenue losses in all case studies. This observation is closely related to that exposed by Nemati [
15], who explained that cities with tiered or budget-based rate structures were the most affected by the pandemic. In Colombia, according to Decree 394 of 1987, the water tariff structure consists of a fixed charge for every billing period, and a volumetric charge for the water volume consumed during the same term [
34]. Tariffs are defined for every type of user, and, additionally, residential customers are billed depending on their socioeconomic strata. Hence, water consumption billing differs for subsidizing Strata 1, 2, and 3 users, reaching discounts up to 20% of the total value. At the same time, Strata 5 and 6 are known as contributors, given that their users have higher rates for covering the excess costs [
20]. Strata 4 is the only one that is neither subsidized nor a contributor.
Thus, the non-domestic and the high-strata domestic water tariffs are the highest. These users are less abundant among utilities’ customers, meaning that water consumption changes have rapid implications for water companies’ income. In this way, since results revealed that these users diminished their normal water usage during the COVID-19 pandemic, the water utilities’ revenues were affected accordingly.
Table 4 presents the results showing this pandemic’s effect on Colombian water utilities. The simple mean water demand average changes for subsidized and contributor users are presented, in addition to the net revenue losses obtained as the addition of the difference between actual and expected revenues shown in
Figure 7. The subsidized users show an increasing trend, while contributors present a decrease for all the cities. In addition, the losses are also shown as the corresponding percentage of the expected income to assess the size of the financial impact on water companies. City C was the most affected case study because of its touristic features, and City B experienced the most rapid recovery due to the prioritization of industrial production activities.
Further, these losses are reinforced by non-payment and billing exceptions, so the financial effect on water utilities was certainly worse. Alterations in water utilities’ finances may have severe effects on the planning of water supply systems, even forcing utilities to cut or delay investments in infrastructure and operational aspects. Therefore, studying water demand changes is crucial for water utilities, and a re-definition of the water rates structure may even be required.
4. Conclusions
In the COVID-19 pandemic context, drinking water availability is essential for ensuring human health and reducing the spread of the virus. The COVID-19 pandemic has undeniably affected the regular behavior of people and communities in many aspects, including water usage practices. An increase in domestic water consumption and a drastic decrease in non-domestic water consumption has been witnessed in multiple cities worldwide. Correspondingly, results from this research evidenced consistent outcomes for four Colombian cities. However, outcomes revealed that specific water demand variations highly depend on the proportion of domestic and non-domestic water usage and the predominant economic sector within a city. In this way, from the case studies of this research, the touristic city was the most affected due to a severe drop in commercial water use. In contrast, the industrial case studies experienced a rapid recovery in water demand because industrial activities were prioritized for the return from stay-at-home orders to normal conditions. Evidently, these changes in water demand also affected wastewater production. For this study, it was not possible to analyze wastewater volumes because all sewer systems in the case studies are combined. Therefore, for cities with combined systems, it is not possible to estimate the effect on wastewater volumes and the corresponding relation with the events modifying drinking water patterns.
Furthermore, the outcomes from this research proved that utilities’ finances are vulnerable to water demand variations, possibly altering investment plans to improve the infrastructure and operations of water supply systems. For Colombian cities, where the tariff structure is based on budget—domestic demand is partially subsidized and non-domestic users have the highest rates—the changes in water demand triggered significant economic losses. Hence, differentiated tariffs diminish the commercial resilience of water utilities and make them more vulnerable to unexpected events, such as the pandemic. In this way, evaluating changes in water demand is crucial so that a continuous and safe water supply service can be secured. To adapt the infrastructure and utilities’ investment plans to changing water demand patterns, evaluating the persistence of water consumption alterations is necessary. Therefore, later investigations should focus on predicting future water demand patterns, and considering the pandemic-driven water demand modification experience, in addition to other unexpected events that might risk the resilience of the water supply systems.


