Article

Communal Wastewater Treatment Plants’ Effectiveness, Management, and Quality of Groundwater: A Case Study in Indonesia

by
Widodo Brontowiyono
1,2,*,
Thomas Boving
3,4,
Adelia Anju Asmara
1,2,
Suphia Rahmawati
1,5,
Andik Yulianto
1,5,
Noviani Ima Wantoputri
1,6,
Annisa Nur Lathifah
1 and
Yuli Andriansyah
7,8
1
Department of Environmental Engineering, Universitas Islam Indonesia, Sleman, Yogyakarta 55584, Indonesia
2
Center for Environmental Studies, Universitas Islam Indonesia, Sleman, Yogyakarta 55584, Indonesia
3
Department of Geosciences, University of Rhode Island, South Kingstown, Rhode Island, RI 02881, USA
4
Department of Civil and Environmental Engineering, University of Rhode Island, South Kingstown, Rhode Island, RI 02881, USA
5
Risk Assessment Analysis Laboratory, Department of Environmental Engineering, Universitas Islam Indonesia, Sleman, Yogyakarta 55584, Indonesia
6
Water Quality Laboratory, Department of Environmental Engineering, Universitas Islam Indonesia, Sleman, Yogyakarta 55584, Indonesia
7
Doctoral Program of Economics, Universitas Islam Indonesia, Sleman, Yogyakarta 55283, Indonesia
8
Department of Islamic Economics, Universitas Islam Indonesia, Sleman, Yogyakarta 55584, Indonesia
*
Author to whom correspondence should be addressed.
Water 2022, 14(19), 3047; https://doi.org/10.3390/w14193047
Submission received: 23 July 2022 / Revised: 12 September 2022 / Accepted: 16 September 2022 / Published: 27 September 2022
(This article belongs to the Special Issue Advances in Wastewater Treatment Processes)

Abstract

:
The Special Region of Yogyakarta is one of the provinces in Indonesia with a large number of communal wastewater treatment plants (CWWTPs). However, less than 40% of CWWTPS in the province are able to be operated well. This study aims to determine the effectiveness of CWWTPs concerning the quality of the surrounding groundwater. The research location was in Mlati, one of three sub-districts with the highest number of CWWTPs and highest population density in the province. Technical data were analyzed in a laboratory, including water quality of CWWTPs and groundwater quality. This study also analyzed non-technical data related to CWWTP management. These data were collected through in-depth interviews with CWWTP managers and users. The data were analyzed systematically, not only quantitatively but qualitatively. The distribution of water quality from CWWTP treatment and groundwater was mapped using inverse distance weighting (IDW). The results show that the CWWTP effluent meets quality standards for pH, temperature, COD, oil and grease, and ammonia. However, some CWWTPs fail to meet the quality standards for the TSS and E. coli parameters. Groundwater has an acidic pH, with ammonia, nitrite, and zinc parameters meeting quality standards, but oil and grease, COD, nitrate, and Pb concentrations exceed quality standards in several wells. This study indicates that the presence of CWWTPs is not correlated with the quality of groundwater due to the inefficiency of the CWWTPs, the unmet coverage area, and the conditions of sanitation facilities at the location.

1. Introduction

Clean water and sanitation are global environmental issues that the Government of Indonesia has prioritized in its Sustainable Development Goals (SDGs) 2030 agenda, e.g., ensuring the availability and sustainable management of clean water and sanitation for all. The Government aims to achieve 90% access to proper sanitation by 2024, refer to the Presidential Regulation of the Republic of Indonesia Number 18 of 2020 concerning the National Medium-Term Development Plan of 2020–2024 [1]. Effective wastewater management practices are one indicator of access to adequate and sustainable sanitation [2]. The study area is in the Special Region of Yogyakarta where the government developed communal wastewater treatment plants (CWWTPs) to increase the number of house connections. By effectively managing domestic waste, access to proper and sustainable sanitation will be achieved.
According to the Regulation of the Minister of Public Works and Housing No. 4 of 2017 on the Implementation of Domestic Wastewater Management Systems, CWWTP methods are divided into two categories. The first category encompasses CWWTPs, which are managed locally. The second category includes local communal treatment systems. The difference between these two systems is in the number of service connections, which are limited to ten connections (50 people) for a local community system and to four thousand connections (20,000 people) for a centralized CWWTP [3]. CWWTPs are of intermediate size, i.e., these facilities are not economically viable for centralized treatment in large cities but too large for local treatment in settlements in densely populated areas. CWWTPs are the focus of this study.
A communal wastewater treatment plant (CWWTP) is a water treatment system used for domestic wastewater treatment. CWWTPs communally were applied by household groups serving 10–100 households or even more. Effluent from installation processing can be channeled to infiltration wells or directly discharged into a body of water, for instance, a river, lake, etc. CWWTP components consist of a wastewater treatment unit, piping networks (control tubs and treatment pits), and household connections. The wastewater treatment unit is simpler than the sewage treatment on a larger scale. Most communal WWTPs focus on primary and secondary treatment to remove particulate and organic matter. However, CWWTPs are mostly not equipped with disinfection and sludge-treatment units [4,5].
The Special Region of Yogyakarta is one of Indonesia’s provinces with a high concentration of CWWTPs. In the city of Yogyakarta alone, there are 87 CWWTP units still operating below the design capacity [6]. Since the late 1990s, referred to as the neighborhood system at the time, CWWTPs have been used in Yogyakarta. Later, CWWTP pilot plants were constructed in areas surrounding the city, namely in Wirogunan, Brontokusuman, and Purwokinanti [7]. However, the development of these CWWTPs was eventually stopped for political reasons and then continued in accordance with the Government’s Community Based Sanitation Development Policy [4,5,8] and with support from non-governmental organizations working in the sanitation sector, such as LPPT-DEWATS and Dian Desa-Pusteklim [9]. Although these early CWWTP designs did not meet the applicable quality standards, they introduced wastewater management issues to the public.
Recently, CWWTPs have faced new challenges as stricter wastewater treatment quality standards have been implemented. One of these challenges is that a CWWTP is now considered a source of pollution, both for surface and groundwater [10]. Technically, this cannot be separated from processing methods, the majority of which continue to rely on previous technology using Anaerobic Baffled Reactor (ABR) [11,12,13]. Not only must that be studied, but things outside of technology still need to be researched, especially non-technical aspects such as social dimensions, economic support, and institutional elements.
Access to adequate sanitation is inextricably linked to access to clean water and drinking water [14]. Protected wells (35%) are the most frequently used source of drinking water in the Special Region of Yogyakarta, followed by bottled water (25%) and drilled/pumped wells (15%) [15]. An analysis of groundwater quality in the study area was published in 2020 [13]. Chemical parameters show that nitrate concentrations in groundwater were 3721–5582 mg/L in 2016 and exceed the quality standard of Regulation of the Minister of Health of the Republic of Indonesia Number 492/MENKES/PER/IV/2010, that is, more than 10 mg/L at six sampling points. At almost all sampling points, the value for the microbiological parameter, specifically E. coli, as well as the total coliform parameter, exceeds the standard of Regulation of the Minister of Health of the Republic of Indonesia Number 492/MENKES/PER/IV/2010 that pathogen bacteria must not be detectable in any 100 mL sample. This may be due to contamination from domestic waste, both direct disposal and seepage into wells from septic tanks located near water sources [16]. The findings indicated that the local sewer pipe and septic tank system is not functioning optimally, so seepage and infiltration of pollutant may occur to the nearest clean water source, such as groundwater. It is also possible that this occur in larger domestic wastewater treatment systems (CWWTPs).
One of the consequences of groundwater pollution by pathogenic bacteria is waterborne diseases such as diarrhea, typhoid, and dysentery [17,18]. The number of people with diarrheal disease in the Special Region of Yogyakarta reached 10,276 in 2020 [15]. According to the Department of Environment and Forestry of the Special Region of Yogyakarta in 2021, diarrhea is the second most common disease, after hypertension [10].
Based on the Environmental Council of Yogyakarta in 2020, community sanitation systems can influence the microorganism contamination of the residents’ groundwater. Although prior studies suggest a connection between groundwater quality and CWWTP systems, only limited research has been conducted in the Special Region of Yogyakarta. Importantly, groundwater quality studies and the evaluation of CWWTPs are generally conducted independently, with no studies combining the two. In this study, the performances of CWWTPs and their effect on the groundwater quality of residents’ well water are evaluated. The observations summarized herein contribute novel insights into the effect of CWWTP on groundwater quality in this part of Indonesia.

2. Materials and Methods

2.1. Research Location

The research location was selected based on data obtained from the Department of Environment and Forestry of the Special Region of Yogyakarta, specifically about the existence and status of CWWTPs in Sleman Regency and the Ngaglik, Depok, and Mlati sub-districts (Figure 1). These sub-districts are areas with the most CWWTP–house connections. However, the study focused only on the Mlati sub-districts due to the COVID-19 situation. Six out of eight CWWTPs were eligible for sampling purposes (CWWTP3 to CWTTP8).
Groundwater quality was determined via monitoring wells with locations based on secondary data analyses of the Regional Environmental Management Performance Information Document (DIKPLHD) of the Sleman Regency in the Government Special Region of Yogyakarta and the Department of Environment and Forestry (DLHK) of the Special Region of Yogyakarta. The monitoring wells were initially selected using the random sampling method; then they were evaluated and changed for purposive sampling and clustering to obtain statistically representative results. The groundwater quality was tested with water from the monitoring wells, which were located within 500 m of a CWWTP and were spread out inside the grid. In total, twenty monitoring wells (W1 to W20) around six CWWTPs were sampled and analyzed.

2.2. CWWTP Effectiveness Data Sampling and Analysis

The water influent and effluent of CWWTPs were taken using the Indonesian National Standard 6989.59 of 2008. All the samples, both sewage and groundwater were taken once. The standard dictates that for the purpose of evaluating the efficiency of the wastewater treatment plant (WWTP), samples were taken at the location before and after the WWTP by taking into account the retention time. The sampling location at the inlet is carried out at the point in the high-tense flow so that good mixing occurs, namely at the point where the waste flows at the end of the production process to the WWTP. If sampling is not possible at the location, then another location can be determined that can represent the characteristics of the wastewater. The sampling location at the outlet is carried out at the location after the WWTP or the point where the wastewater flows before entering the receiving water body (river). The wastewater quality parameters were in accordance with the Ministry of Environment and Forestry of the Republic of Indonesia No. P.68/Menlhk-Setjen/2016 and consisted of pH, Biological Oxygen Demand (BOD), Total Suspended Solids (TSS), oil and grease, ammonia (NH3-N), and total coliform.
Meanwhile, the groundwater was sampled according to Section 58 of the Indonesian National Standard 6989.59 of 2008. The parameters included pH, Total Dissolved Solids (TDS), Total Suspended Solids (TSS), Chemical Oxygen Demand (COD), ammonia, total coliform, and E. coli. The temperature and pH were measured directly in the field with a multimeter. Both CWWTPs and groundwater samples were analyzed in the Environmental Quality Laboratory, Faculty of Civil Engineering and Planning, Islamic University of Indonesia accredited by National Committee of Accreditation of Indonesia. A summary of the analysis methods, specification of equipment, the Limit of Detection (LOD), and other parameters are displayed in Table 1.

2.3. CWWTP Management Analysis

CWWTP management aspects involve non-technical data regarding economic, social, and cultural factors. These aspects were investigated with in-depth interviews supported by questionnaires and observations with managers of the CWWTPs and its users as participants. The Ethical Approval (EA) to take the data was established by The Ethics Committee of the Faculty of Medicine, Islamic University of Indonesia, Number 9/Ka.Kom.Et/70/KE/V/2022. Furthermore, CWWTPs’ operational and maintenance data, such as the availability of Standard Operational Procedures (SOPs), CWWTP problems, community participation, and monitoring of effluent, were collected from CWWTP managers. While service data such as sanitation conditions, socialization of existing CWWTPs, willingness to make monthly payments, participation in observing the CWWTP’s performance, and CWWTP organization were obtained from participating households (five households for each CWWTP). For groundwater analysis, the distance (meters) of the septic tank from the monitoring wells, the depth, the covering of wells, and the existing conditions around the monitoring wells were also investigated. The results were then presented in a graph and analyzed descriptively.

2.4. Groundwater Quality Data Analysis

Both influent and effluent of CWWTP water quality was compared to the standard water quality of the Ministry of Environment and Forestry of the Republic of Indonesia No. P.68/MenLHK-Setjen/2016. On the other hand, groundwater quality testing is used to assess groundwater conditions. It can provide critical information about whether pollutant compounds in groundwater exceed the quality standard of the Ministry of Health of the Republic of Indonesia Number 492/MENKES/PER/IV/2010 regarding drinking water requirements, Number 32 of the Year 2017 for the domestic hygiene sanitation, and Ministry of Environment and Forestry No. PP 22/2021 about the implementation of environmental protection and management. Box plots for each parameter visualize CWWTPs’ water and groundwater quality data. Moreover, a modified Inverse Distance Weighting (IDW) method [19,20,21] was used to describe the distribution pattern of groundwater quality parameters at locations near the CWWTPs as well as outside the CWWTPs’ coverage area. The coverage area was measured by grid-box with radius 500 m × 500 m. The raw and basic map was obtained from Ina-Geoportal [22] with a scale of 1:25,000 and was processed further using ArcGIS 10.3.1 for Desktop [23].

3. Results

3.1. CWWTP Effectiveness

The effectiveness of the treatment process at the CWWTPs was evaluated against the applicability of the Minister of Environment and Forestry Regulation number 68 of 2016 on Domestic Wastewater Quality Standards [24]. More specifically, treated wastewater must meet seven parameters, i.e., BOD, COD, TSS, oil and total grease, temperature, and total coliform. Except for detergent, but including pH, these parameters were analyzed at the inlet and outlet of six CWWTPs (CWWTP2 through WWTP7; Figure 1). According to the results of interviews, there are 625 households connected to these six CWWTPs in the Mlati sub-district. That number of connections remains below the maximum design capacity of the respective CWWTPs. Meanwhile, the Central Bureau of Statistics of Sleman Regency estimates that the Mlati sub-district had 31,783 households in 2020, implying that the proportion of households served or connected to the CWWTPs is less than 2%. This result is similar to previous findings that indicate that many CWWTPs operate well below capacity and that domestic waste is not being processed optimally [25].
Domestic wastewater not connected to the CWWTPs can pollute water resources if it is not treated before being discharged into the environment or water bodies. Because domestic waste in the Special Region of Yogyakarta is still not being managed optimally through CWWTPs, the rivers in the Special Region of Yogyakarta remain polluted. The pollution index in the Winongo, Oyo, Bulus, and Kuning rivers is light to moderate, while the Code River is polluted, and the rivers of Gadjah Wong, Bedog, Conteng, Belik, and Tambak Bayan are heavily polluted [10].
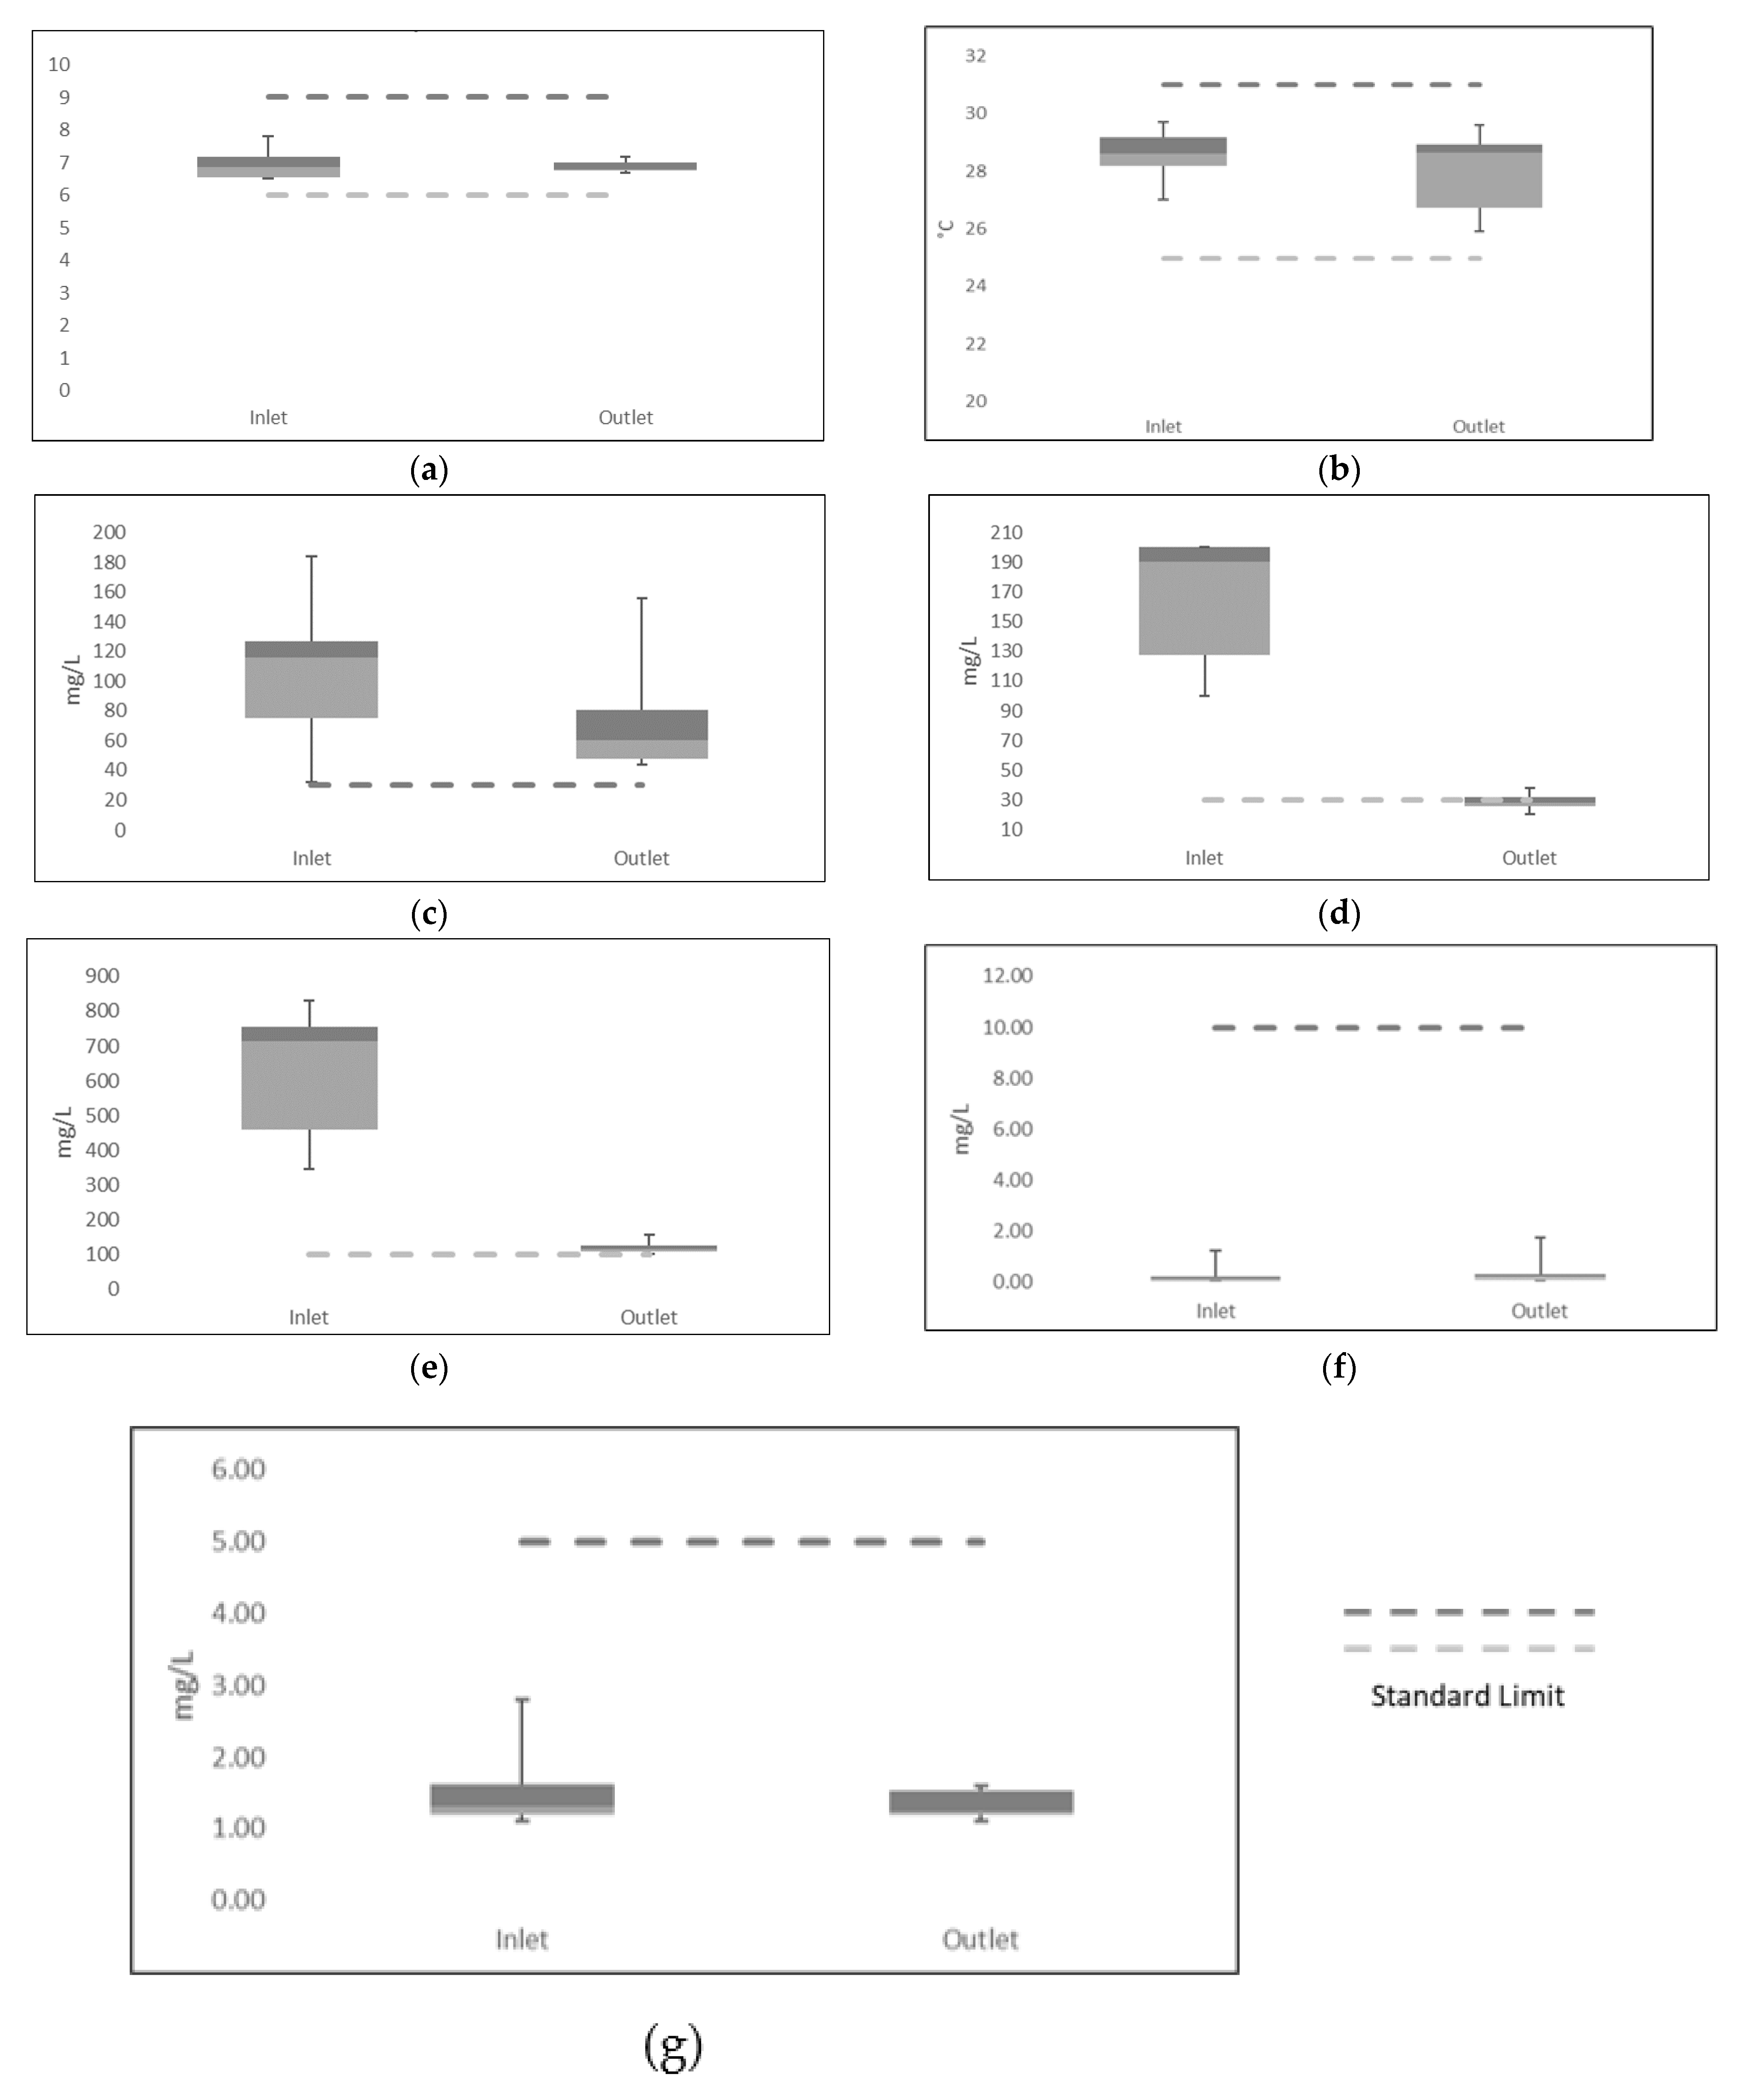
The acceptable domestic wastewater pH standard ranges from 6 to 9. As illustrated in Figure 2a, the pH values of the inlet and outlet at the six CWWTPs met the quality standard. In CWWTP2 to CWWTP4, the pH values at the outlet are lower (7.19; 6.81; 6.75, respectively) than at the inlet (7.81; 7.2; 7.1, respectively), whereas it was higher (6.75; 6.67; 7.04) than the inlet concentrations (6.52; 6.59; 6.5) at the other three locations (WWTP5 to WWTP7). The water temperature at the inlet and outlet was within the quality standards specified. However, the wastewater temperature at the inlet and outlet differed, indicating that the wastewater temperature changed during the treatment process at the CWWTPs.
The results of the TSS analysis of wastewater at the inlets and outlets (Figure 2c) exceed the quality standard for all CWWTPs. Because the concentration of TSS at all sample points tends to cluster on the right side of the distribution, and the frequency of TSS concentration is higher than the average, the distribution of TSS data at the inlet tends to skew to the left (negative skewness). In general, the influent temperature tended to be higher (28.55 on average) than the effluent (27.98 on average). The applicable TSS standard for domestic wastewater is 75 mg/L.
The BOD parameter is critical because it indicates the oxygen required to degrade organic matter contained in the domestic wastewater biochemically. The concentration of BOD at the CWWTPs’ inlet exceeded the quality standard, which is 30 mg/L, at all points (Figure 2d). CWWTP4, CWWTP5, and CWTTP6 had the same BOD concentration with a value of 200 mg/L. It was the highest concentration compared to the other three CWWTPs. CWWTP2 had the lowest BOD concentration with a value of 100 mg/L. The outlet concentration of BOD at CWWTP2 (38 mg/L) and CWWTP4 (32 mg/L) did not meet the quality standard after treatment, whereas the water quality standard was met at CWWTP 3, CWWTP5, and CWWTP7 (range: 20–30 mg/L).
The COD parameter is critical in domestic wastewater analysis because it indicates the oxygen required to degrade the organic matter contained in domestic wastewater chemically. The highest COD concentration (Figure 2e) is at CWWTP5 (830 mg/L), and the lowest is at CWWTP2 (345 mg/L). The COD outlet concentrations ranged from 101 to 156 mg/L, indicating that domestic wastewater treatment at the CWWTPs is not effective.
Figure 2f shows the ammonia concentration at the CWWTPs’ inlet and outlet. At the CWWTP6 sample point, the highest ammonia concentration was 1.26 mg/L, while the lowest concentration, i.e., 0.06 mg/L (LOD was 0.02 mg/L) was the same for CWWTP3, CWWTP4, and CWWTP7. Following treatment, the average ammonia concentration at the outlet increased at all locations (up to 1.77 mg/L at CWWTP6) except for CWWTP5, which decreased to 0.06 mg/L.
Figure 2g illustrates the oil and total grease concentrations at the CWWTPs’ inlets and outlets. The standard for oil and total grease in domestic wastewater is 5 mg/L. This standard is met for all inlet and outlet. The CWWTP3 sample point has the highest concentration of oil and total grease at 2.8 mg/L, while the CWWTP4 sample point has the lowest concentration at 1.1 mg/L.
Following treatment at the CWWTPs, the concentration of oil and total grease at the outlets increased at two points, CWWTP2 and CWWTP4, but remained below the quality standard. At another point, the oil and total grease concentrations decreased. The distribution of oil and total grease concentrations at the outlet is identical to that at the inlet, which tends to skew to the right (positive skewness). This is evident from the higher frequency of data on oil and total grease concentrations, which are below the average. At the outlet, the highest concentration of oil and total grease is 1.6 mg/L, while the lowest concentration is 1.1 mg/L.
According to EPA regulations and the World Health Organization [26], the effluent standard for discharge into the receiving water body for fecal coliform bacteria is 1000 per 100 mL, which is also considered safe for wastewater irrigation use. In Indonesia, the standard of Minister of Environment and Forestry Regulation No. 68/2016 for wastewater is 3000 MPN/100 mL, whereas the standard for wastewater is 10,000 MPN/100 mL in the Special Region of Yogyakarta’s Regulation No. 7 of 201. The Total Coliform results at the CWWTPs’ inlets and outlets are summarized in Figure 2h.
The analysis revealed that the total coliform concentration at CWWTP2, CWWTP6, and CWWTP7 exceeded the standard while at CWWTP3, CWWTP4, and CWWTP5 it met all of the standards. However, all outlets, except at CWWTP3 (160,000 MPN/100 mL), met the Indonesian standard. This demonstrates that five out of six CWWTPs were effective at removing total coliform bacteria contamination. According to survey data, CWWTP3 has issues, specifically odor and clogging. Odor is an indicator of an excess bacterial population [27,28]. When compared to the total coliform concentration at the CWWTP3 inlet, the number was greater. There was also a clogging issue on another CWWTP, but there is no odor issue. However, if this clogging is left, it might cause odors in the future.

3.2. CWWTP Management

3.2.1. In-Depth Interview of CWWTP Managers in the Mlati Sub-District

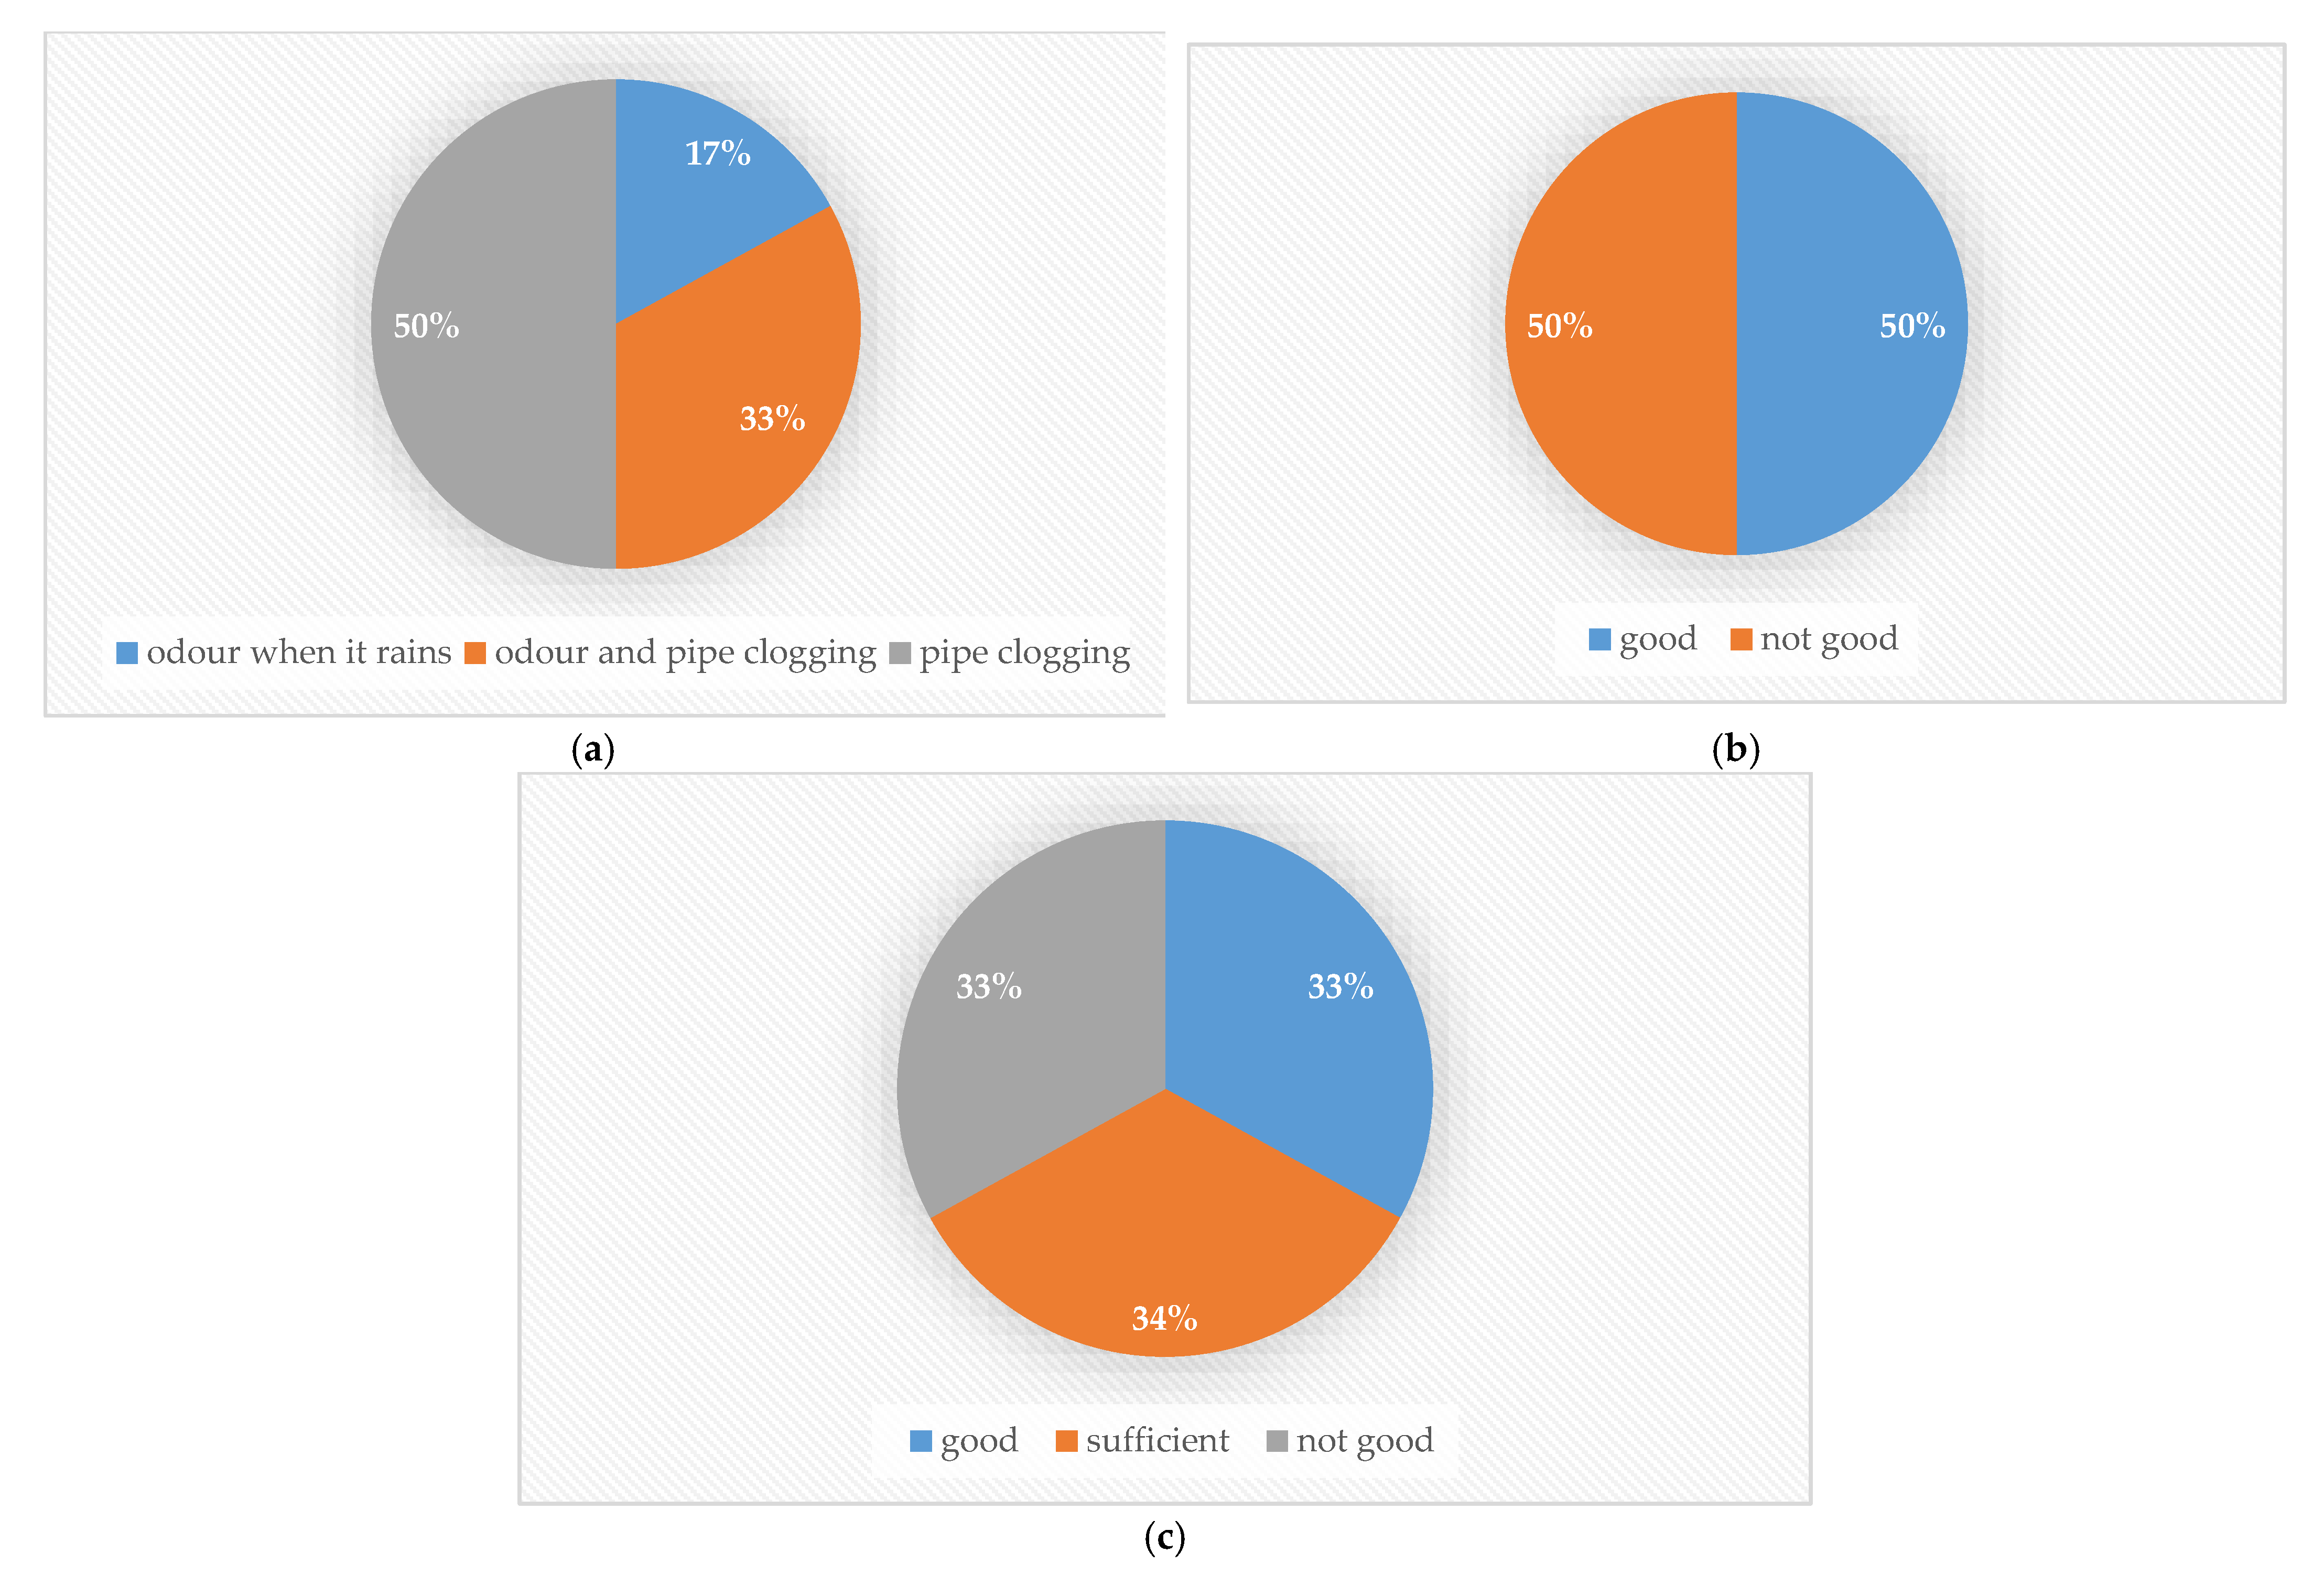
Interviews with managers and customers of CWWTPs elicited information about the treatment facility management. The total number of households using all CWWTPs sampled in the Mlati sub-district, namely CWWTP2 through CWWTP7, remains below the CWWTP’s maximum capacity. Five of six CWWTPs were built by government proposal under the Urban Sanitation and Rural Infrastructure (USRI) program, while the other was built by community and sub-district proposal under the Sanimas (community-based sanitation) program. The land status of the CWWTPs is village treasury land, except CWWTP3, which belongs to a private landowner. The most frequent problem in CWWTP operation is clogging, as noted by 50% of all managers interviewed (Figure 3a.). Furthermore, 17% of managers stated that the CWWTP smells when it rains, and 33% indicated that it smells and is clogged. The presence of garbage in the CWWTP piping network is the leading cause of clogging. In terms of technical problems, such as leaking pipe, clogging, and so on, up to five CWWTPs (83.3%) have never encountered them, while only WWTP3 has experienced them.
Figure 3b,c illustrate citizen participation in CWWTPs operations and payment of CWWTPs fees. In Indonesia, citizens are expected to contribute in various ways to the operation of communal infrastructure, including CWWTPs [29,30,31]. According to the managers interviewed, citizen participation in the operation of the surveyed CWWTPs is equally good and bad, meaning that only 50% of all citizens fulfill their obligations to the CWWTPs. Except for CWWTP7, all CWWTPs received their maintenance and operational funding entirely from private sources. According to the manager of CWWTP7, the operational funding process is supported by community contributions. Subscription fees for the other plants are IDR 5,000 (USD 0.35) for CWWTP2, 3, 5, and 6, and IDR 10,000 (USD 0.70) for CWWTP4. The collected subscription fees are significantly lower than the monthly cost of CWWTPs, which ranges between IDR 50,000 (USD 3.5) and IDR 1,400,000 (USD 100). According to the managers interviewed, citizen participation in paying subscription fees was rated at the same levels (33.3%) as good, moderate, and bad. This means that about 1/3 of the citizens contribute nothing (‘not good’) to run the treatment plant. Only 33.3% showed a ‘good’ payment attitude. The remainder contributed, but just enough to meet the minimum requirements.

3.2.2. In-Depth-Interview of CWWTP Users in the Mlati Sub-District

A total of 32 CWWTP users in the Mlati sub-district responded to our survey; with five respondents each from CWWTP2, 3, 5, and 7 and six respondents each from CWWTP4 and 6. In terms of payment for CWWTP subscription, 84% of respondents pay monthly, while 16% do not pay because in their opinion the CWWTP use is free. Figure 4a depicts the amount of fees paid by CWWTP users. Forty-eight percent of respondents made contributions ranging between IDR 1000 and IDR 5000 (maximum USD 0.4), while the remaining 52% contributed between IDR 5000 and IDR 10,000 (maximum USD 0.7). This is in accordance with information from the CWWTP manager, who states that the subscription fee is IDR 5000 for the first year, and IDR 10,000 for the subsequent years.
Regarding subscription fees, 94% of respondents agree that all users should pay the same fee, while 6% agree that subscription fees should be determined by the users’ economic status. Figure 4b suggests that 69% of the respondents perceive the CWWTP subscription fees as adequate, while only 6% would like to see the cost reduced. About 25% are willing to pay more towards the CWWTP operation. In terms of the CWWTP performance, as many as 63% of respondents said they were satisfied (‘good’), 19% were very satisfied (‘very good’), and 19% had some reservations (‘quite good’).
As displayed in Figure 4c, a total of 37.5% of respondents stated that they were very satisfied with the CWWTP service. In addition, around 37.5% of respondents said they were satisfied, and the remaining 25% said they were quite satisfied with the CWWTP service. In Figure 4d, about 9% stated that there were complaints regarding CWTTP performance, i.e., bad smells because the residents’ houses are not far from the CWWTPs. However, 91% stated that there were no issues.

3.3. Groundwater Quality

Overall, the groundwater monitoring data demonstrate that not all parameters met the quality standards established by Indonesian Minister of Health No. 27 of 2017 regarding requirements for groundwater quality for hygiene and sanitation purposes [32]. Groundwater temperatures were within a 3 °C range of ambient air temperature, 25.1–30.9 °C (average 28.7 °C). For pH, it ranged from 6.0 to 6.9 (average 6.29) and therefore was below the established standard of 6.5 to 8.5. All groundwater samples were odorless.
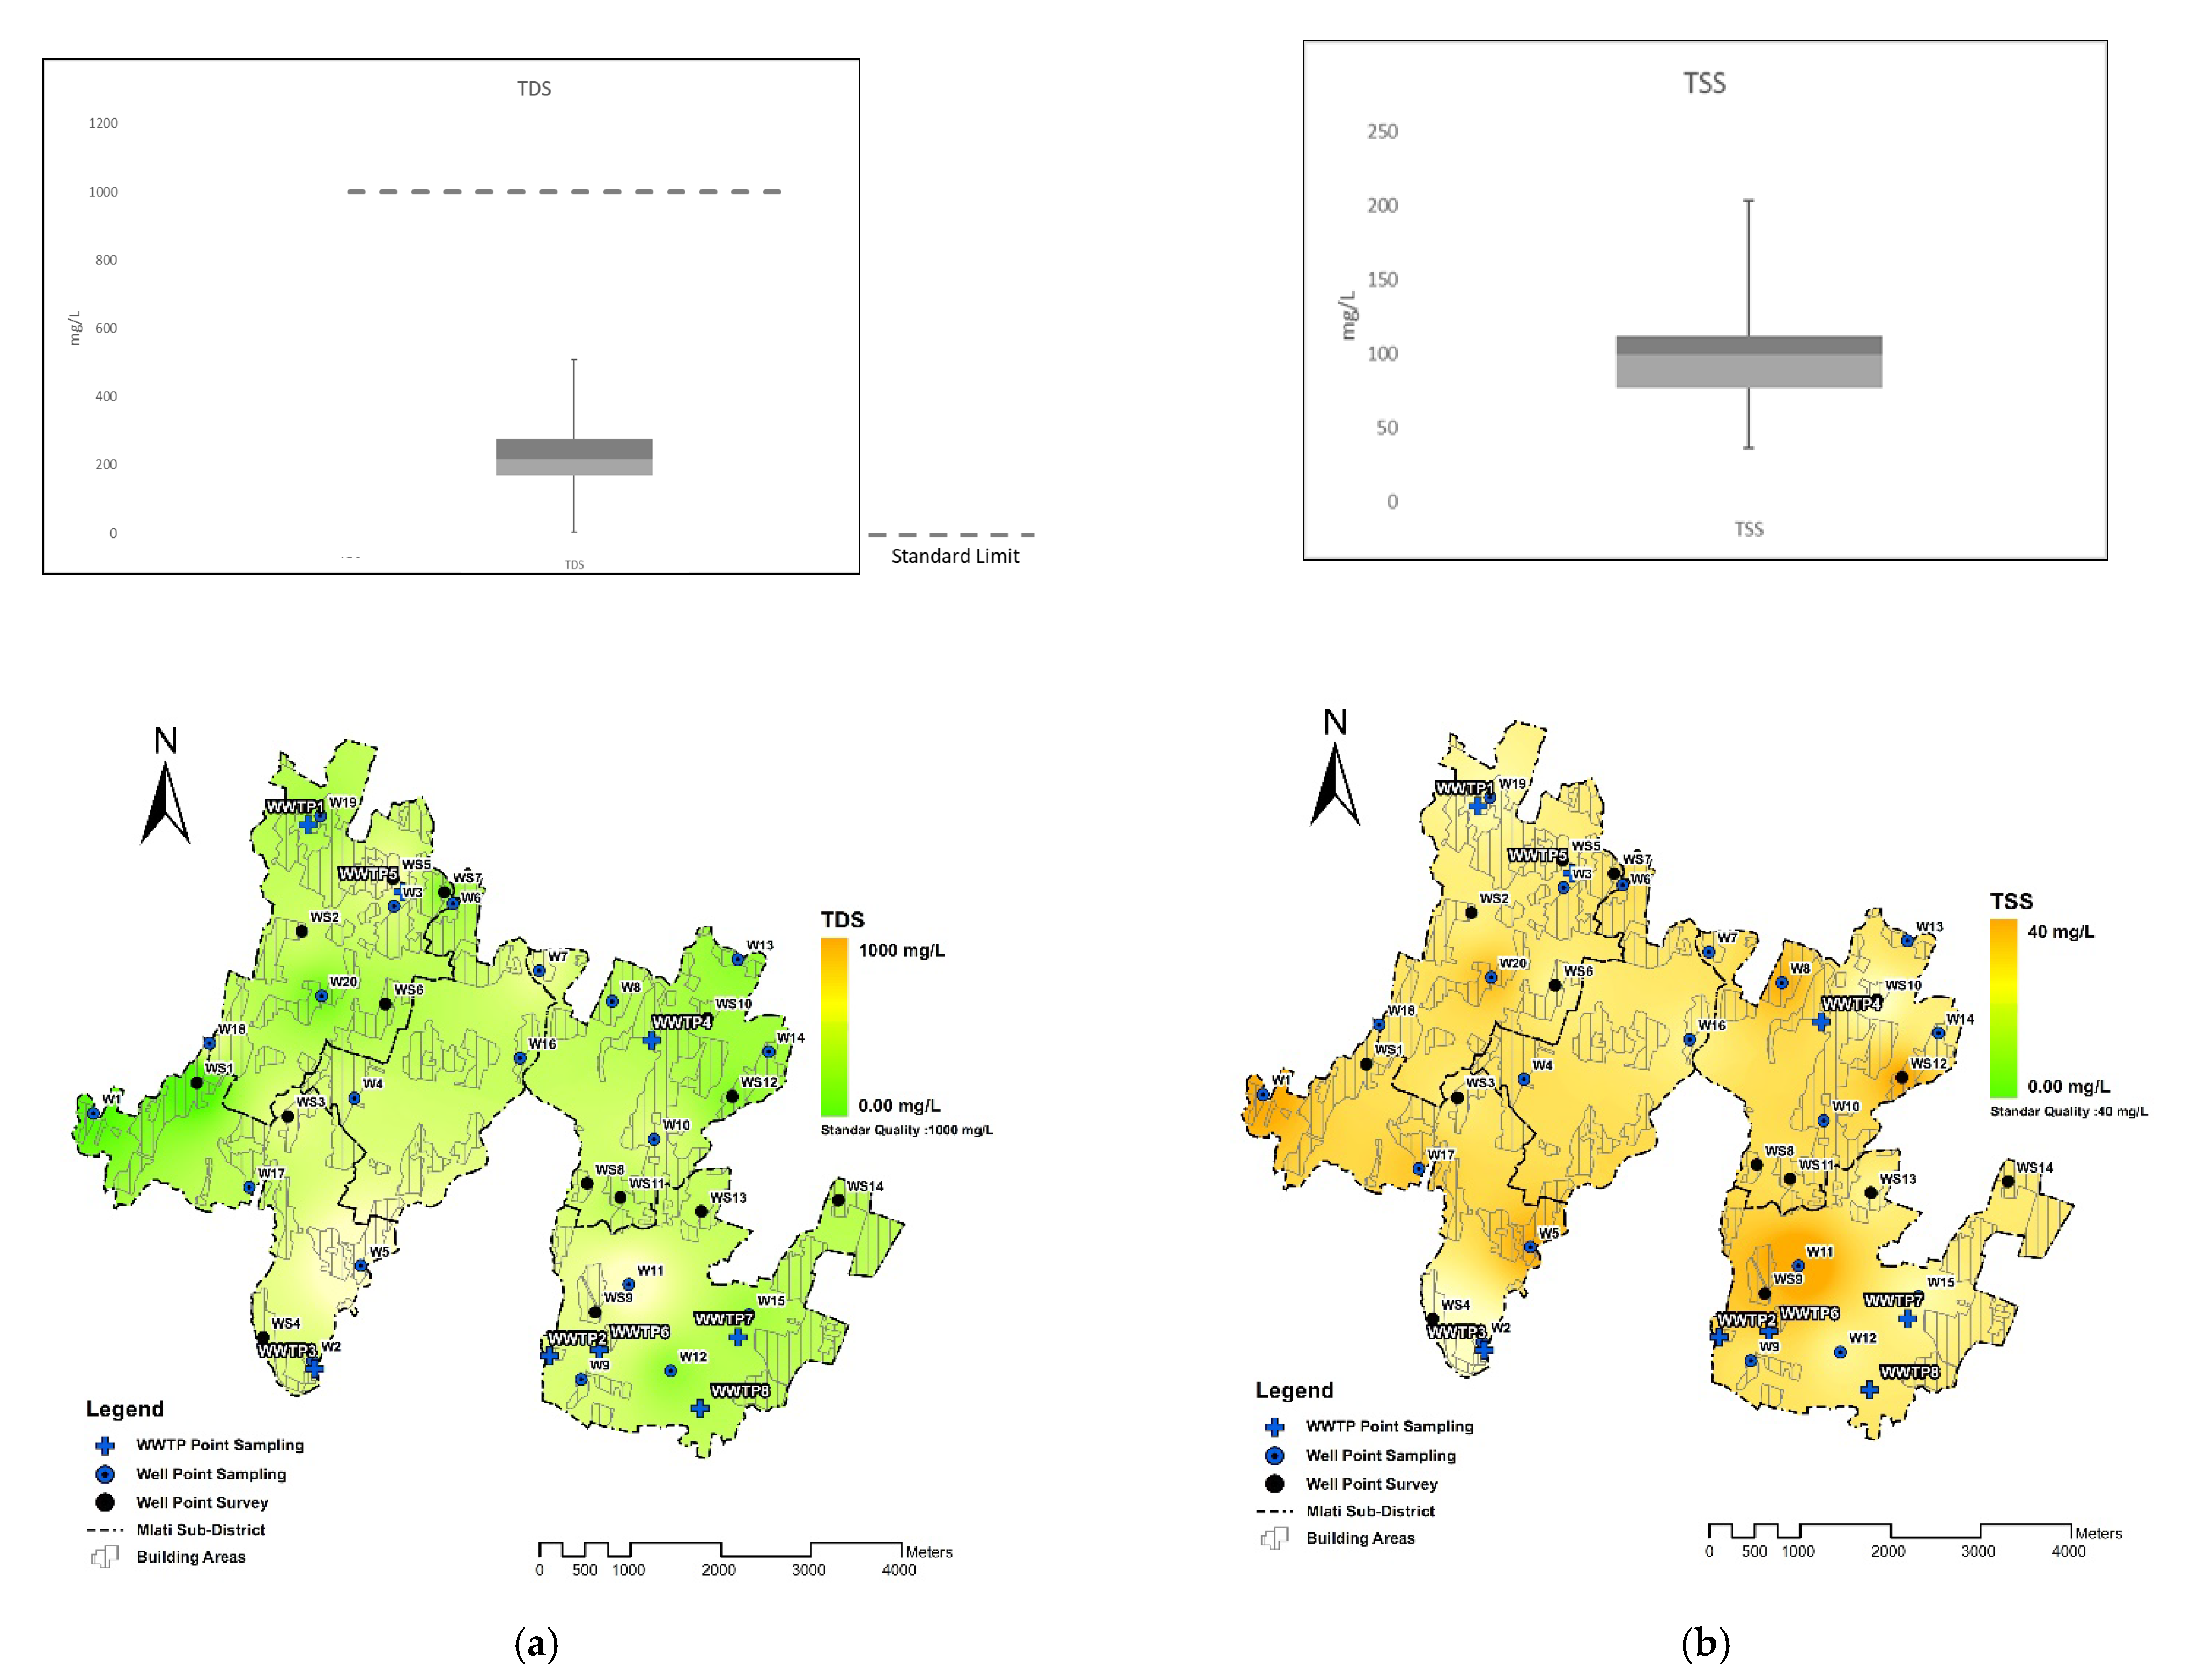
Figure 5 summarizes the results of the analysis of TDS and TSS and their concentration distribution patterns. TDS concentrations ranged between 90 and 448 mg/L (average 228 mg/L) (Figure 5a). The average TDS concentration met the water quality standard, which is 1000 mg/L. TSS concentrations varied between 41 and 204 mg/L (average 108.6 mg/L). Based on Minister of Health of the Republic of Indonesia Number 27 of 2017, the TSS standard does not include the quality parameter of groundwater.
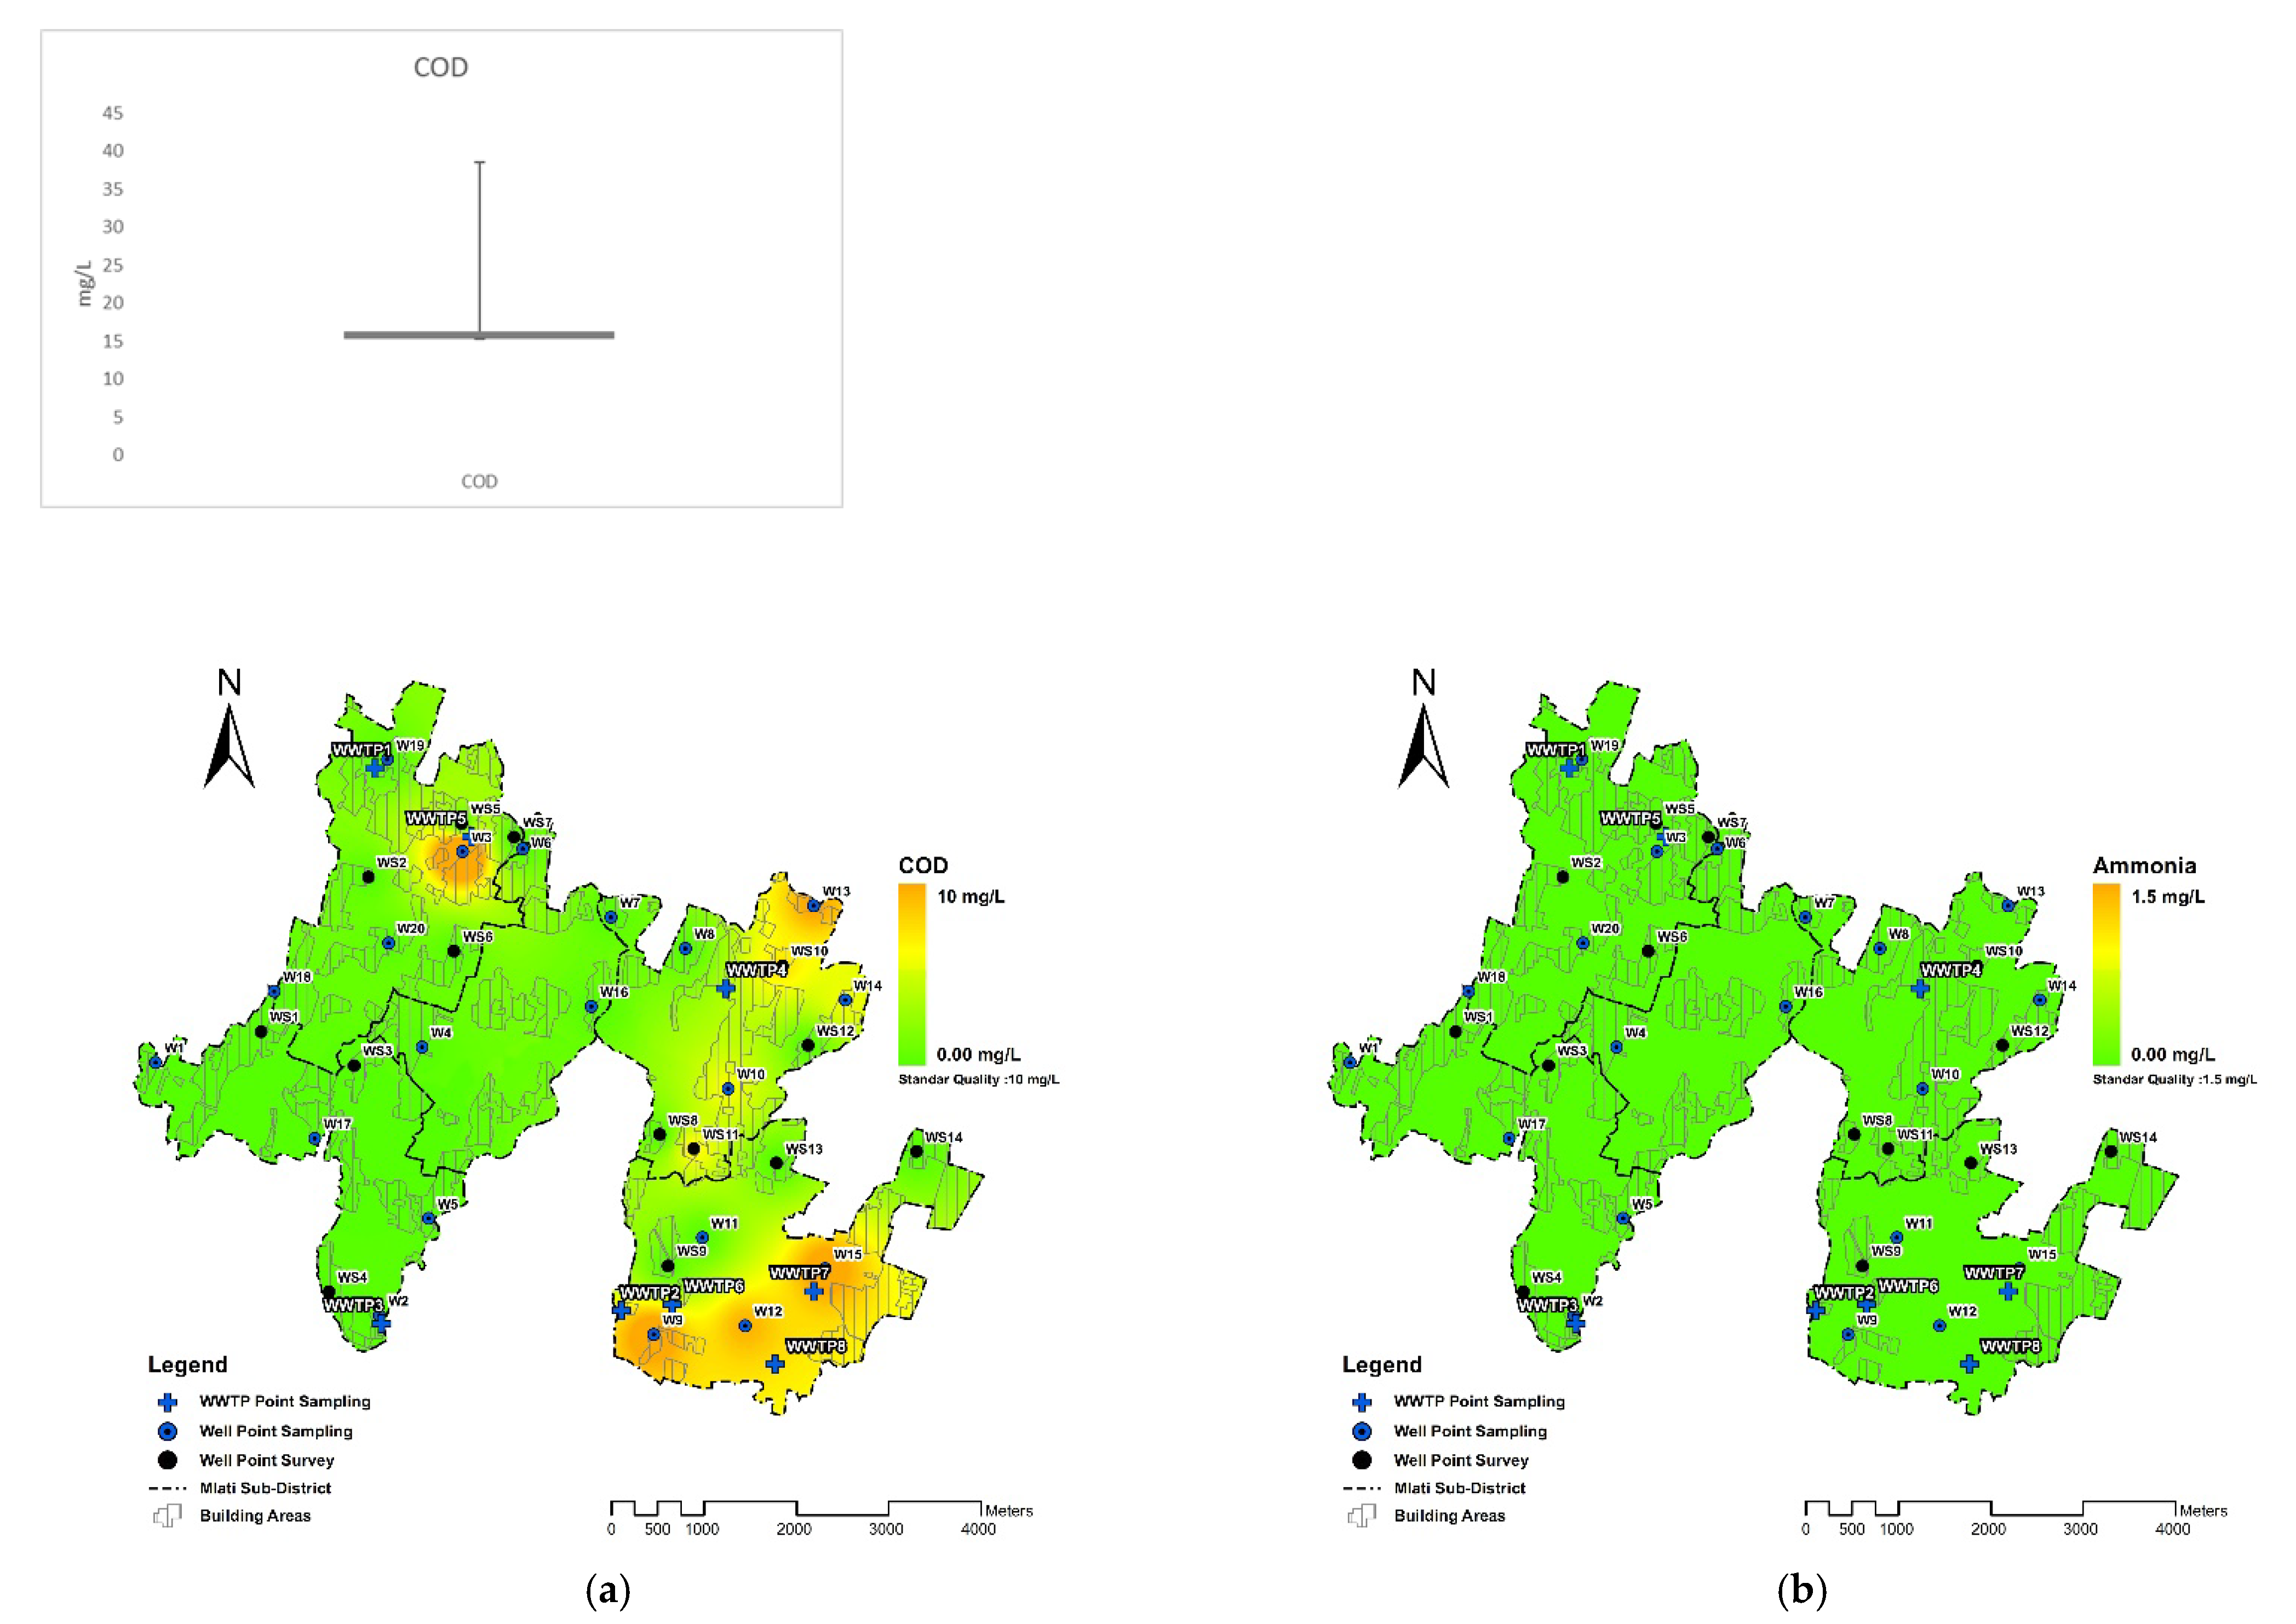
COD levels in groundwater range between 15.3 and 38.6 mg/L (average 18.2 mg/L) (Figure 6a). In Indonesia, there is no quality standard for COD in groundwater used for sanitation and hygiene purposes. In comparison to the first class of standard water quality for surface water (river and lake) according to PP No. 22 of 2021, the maximum allowable COD is 10 mg/L [33]. Meanwhile, the WHO specifies a COD standard of 40 mg/L for groundwater used for domestic purposes [34]. According to the WHO standard, the maximum concentration of COD in the groundwater (38.6 mg/L) approached the limit concentration (40 mg/L). COD concentrations were higher near almost all CWWTPs, except CWWTP3 and CWWTP4. The increased COD near most CWWTP locations can be influenced by a wide range of factors, including the graywater not being fully connected to the CWWTP or the use of infiltration wells, which increases the likelihood of pollution at the site. Another factor is the common practice of dumping graywater (washing water) into the yard. The elevated COD level may also be a result of manure use on agricultural land adjacent to CWWTP1, CWWTP5, CWWTP6, and CWWTP7.
According to the laboratory analysis and the mapping of distribution pattern (Figure 6b), ammonia (NH3-N) was detected everywhere at identical concentrations (0.06 mg/L) above the method detection limit (LOD) of 0.02 mg/L. For comparison, the drinking water quality standard of Permenkes RI No. 492/MENKES/PER/IV/2010 for ammonia is 1.5 mg/L [35]. Meanwhile, the nitrite concentration in groundwater was 0.01 mg/L (LOD is 0.002 mg/L) at all locations, except for W10 (0.11 mg/L) (Figure 7a). The nitrite groundwater quality standard is 1 mg/L. Elevated nitrite concentrations, but well below standard concentration, were observed near CWWTP2, CWWTP5, and CWWTP6. Nitrate concentrations in groundwater were in the range of 0.7–37.5 mg/L (average 7.5 mg/L) (Figure 7b). Four of the twenty sampling points exceeded the permissible quality standard (10 mg/L). These sampling points were W6, W8, W9, and W10 with a concentration range of 14.9–37.5 mg/L. Typically, the highest nitrate concentrations were not found near CWWTPs.
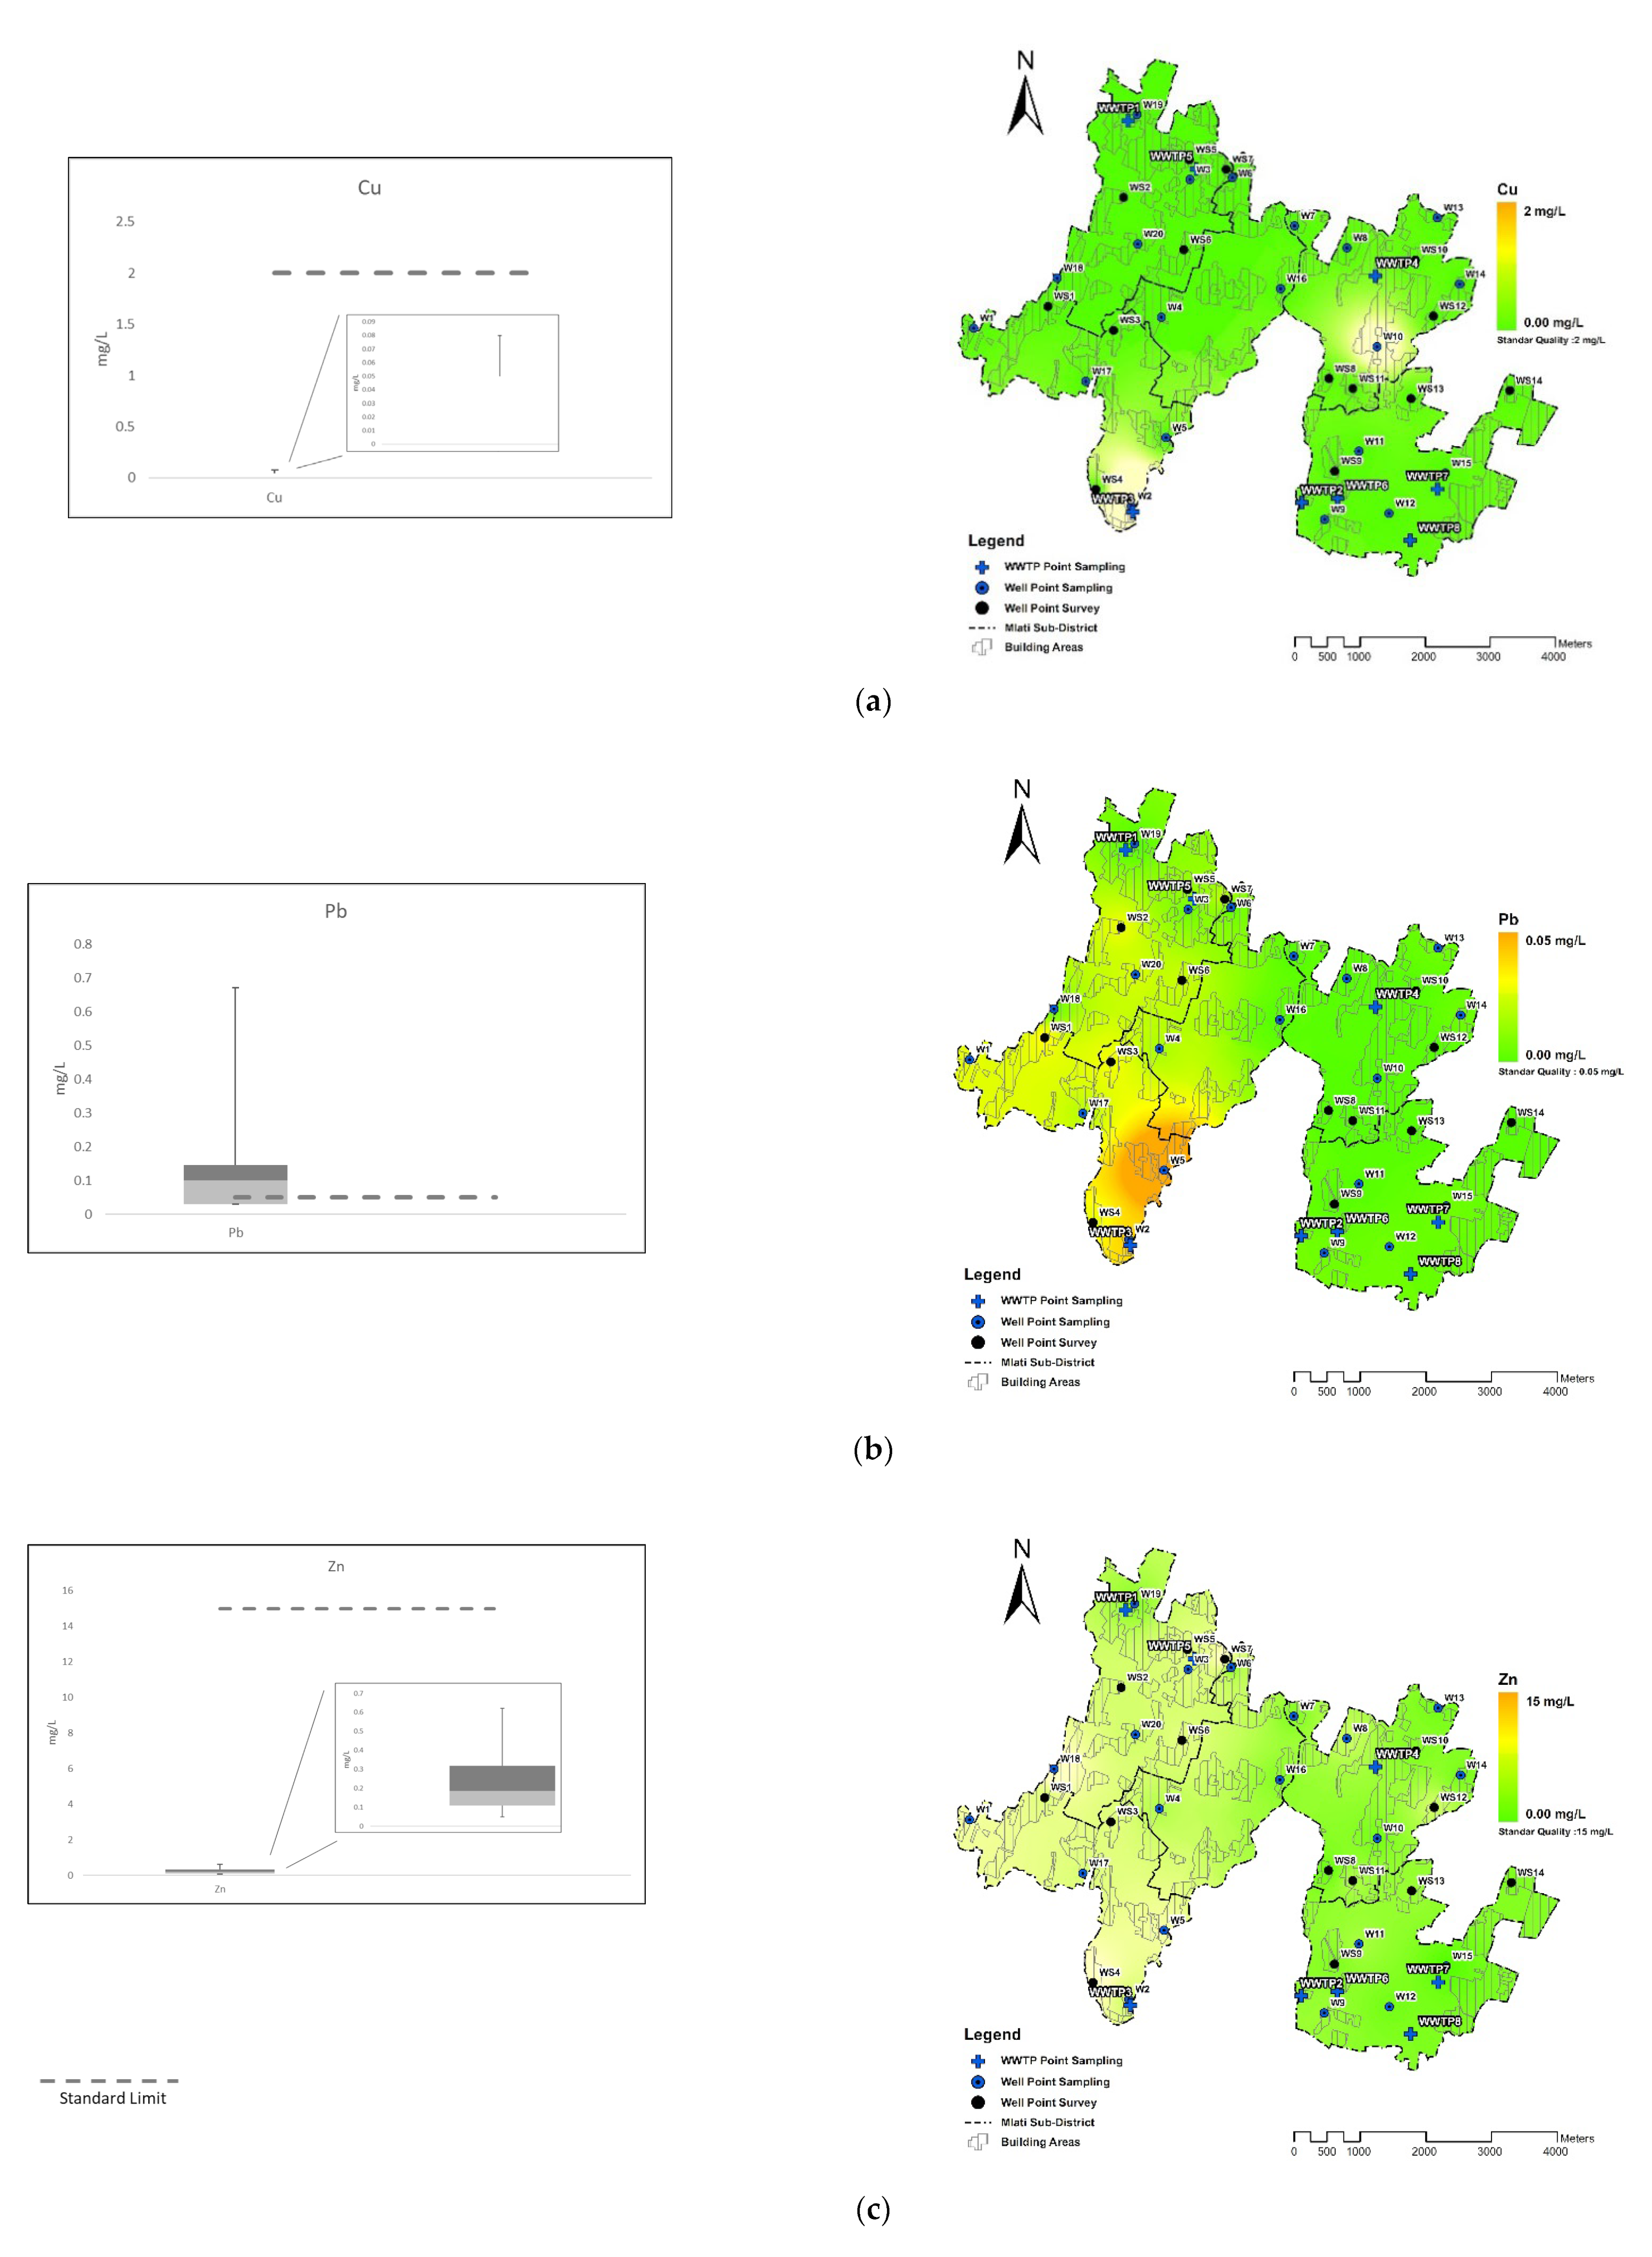
Furthermore, the heavy metal was analyzed for broad groundwater quality clearly even though it was not compared to the effluent quality of CWWTPs directly. Thirteen of twenty sampling points exceeded the groundwater standards for lead (Figure 8). Lead concentrations ranged from 0.03 to 0.67 mg/L (average 0.13 mg/L). The water quality standard for Pb is 0.05 mg/L, refer to the Ministry of Health of the Republic of Indonesia No. 32 Year 2017 for sanitation hygiene [36]. Zinc concentrations ranged from 0.05 to 0.62 mg/L (average 0.23 mg/L). At all sampling points, the Zn concentrations were less than the quality standard of 15 mg/L. The Cu concentration was consistent at 0.05 mg/L at all monitoring points except W2, which had a concentration of 0.08 mg/L. As for other water quality standards, the copper concentration was limited to 1.3 mg/L (US EPA) and 2.0 mg/L (WHO or EU) [37].
Figure 9a illustrates the concentration and distribution of oil fat in groundwater. Oil and grease concentrations ranged from 0.5 to 0.8 mg/L (average 0.6 mg/L). As with COD, there are currently no quality standards for oil and grease parameters in groundwater in Indonesia but up to 1.0 mg/L is typically considered acceptable. Figure 9b,c show the biological parameters collected from 20 wells located throughout the Mlati sub-district. For drinking water, the maximum acceptable concentration of either E. coli or total coliform is not detectable per 100 mL [35,38]. The concentrations of total coliform and E. coli in all of the tested samples exceeded the drinking water standard. The highest total coliform values were found at W5, W6, W13, W12 (1600 MPN/100 mL) while the highest concentration of E. coli was found at W3 (220 MPN/100 mL). Due to the extreme value of E. coli at W3, it is omitted from the box plot figure (Figure 9b). It is noted that the setback distance between a well and a septic tank was less than 10 m in 29% (n = 10) of cases. Half of all wells (n = 17) lacked drainage channels to keep polluted water away from the wellhead [39]. The depth of the wells ranged from 6 to 20 m (average 11.4 m).

4. Discussion

4.1. CWWTP Effectiveness

The temperature conditions in all six CWWTPs were mesophilic (20 to 40 °C range) which is considered ideal for anaerobic treatment [40,41]. Further anaerobic treatment of wastewater via methanogenesis is most effective when the pH is between 6.3 and 7.8 [42]. At the CWWTP outlets, the pH reaches a maximum of 7.19 and a minimum of 6.67 and therefore is in the ideal range of methanogenic treatment processes. If the pH conditions are neutral, the increase in hydrolysis and acidogenesis processes can result in a high efficiency of about 80% in COD removal during the anaerobic treatment process [43,44].
TSS concentrations at all CWWTP outlets exceeded the quality standard, 30 mg/L (range: 44 to 156 mg/L). Causes for the exceedances can be related to insufficient hydraulic retention time (HRT) in the Anaerobic Baffled Reactor (ABR) unit. TSS removal efficiency increases as HRT in the ABR increases. Alternatively, TSS can be derived from bio-flocs that are not heavy enough to settle before the treated water reaches the outlet. This can result in an increase in the TSS concentration at the outlet [45]. With regard to BOD, all but two CWWTPs worked properly. Most CWWTPs treat biological matter by ABR. Hence, BOD can likely be reduced in those two non-complaint systems if the ABR operational and maintenance processes were to be optimized [46]. The BOD/COD ratio indicates a waste’s biodegradability. The optimal BOD/COD ratio for COD removal is between 0.48 and 0.53; however, when the BOD/COD ratio is less than 0.3 or greater than 0.6, the removal of pollutants in wastewater is less effective [47]. In this study, the inlet BOD/COD value for each of the six WWTP points was sub-optimal (0.24 and 0.29). To remove residual organic matter from domestic waste treated with ABR, additional advanced treatment units or post treatment can be added to ensure that the concentration of parameters at the CWWTP outlet meets quality standards [48,49].
The presence of odors and blockages is one of the issues encountered during operations of some CWWTPs. The obstructions are caused by the presence of domestic waste in the pipeline carrying the domestic wastewater to the treatment plants. Clogging can impact the ABR performance and can cause the formation of hydrogen sulfide (H2S) gas from the decomposition of domestic waste in the CWWTP system [50]. According to the laboratory testing, all CWWTPs, except CWWTP6, showed increasing ammonia concentration from the inlet to outlet. The anaerobic condition inside the ABR reactor indicated a not optimal process to produce methane because of the increasing of ammonia concentration. Previous research showed that a rise in ammonia levels indicates an unfavorable anaerobic environment for bacteria that decompose organic matter in aerobic environments [51,52]. Furthermore, previous research on WWTPs in several sub-districts of the Sleman regency showed total coliform concentrations at the outlet ranged between 10 and 95 × 106 MPN/100 mL [52,53], which was significantly greater than what was detected in this study.

4.2. CWWTP Management

This study is unique in analyzing CWWTPs using two perspectives at once, namely from the managers’ and the users’ perspectives. Many previous works in the same context rely mostly on how users perceive CWWTP managers’ performance. Applying two perspectives, as this study did, will help to better understand CWWTP management. Most CWWTPs in the research area were built by the government, which is in line with previous findings related to the construction of such facilities in Yogyakarta and other provinces in Indonesia [54,55,56]. Even though they were built by the government, CWWTP users have proven to have a good sense of ownership and responsibility, as seen in their willingness to contribute. This sense of ownership and responsibility should continue to be developed by further increasing the togetherness between managers and users which in the Yogyakarta tradition is usually manifested in associations or paguyuban [57,58].
Most CWWTP users perceive the subscription fees as adequate, which also can be found in previous works [31,55]. The existence of CWWTPs for users is basically very helpful in reducing environmental problems. Thus, it is natural that they support the government in building CWWTPs. Evidence of such support, through financial contributions and other voluntary assistance, among others means, in the context of Yogyakarta, and many other areas in Indonesia, can be viewed from the spirit of gotong royong. The government and CWWTP managers can improve user support by providing more collaborative works in maintaining the facility or other relevant activities. Better communication in such programs will invite more users to be aware of CWWTPs’ existence and sustainability [58,59]. Furthermore, this study and others found that CWWTPs have not been fully utilized based on their maximum capacity [60]. Thus, improving managers and government commitments to promote CWWTPs among users should be prioritized [61,62].
This study found that most CWWTP users were satisfied with CWWTP managers’ performance, although some complains were still expressed. Such a finding can also be traced from previous works on CWWTPs in many areas [55]. This satisfaction could be a good indication for possible improvements among CWWTP managers. With all limitations shown in CWWTPs’ effectiveness, user satisfaction should be answered by better services as well as more support from the government. CWWTP managers can learn from previous works on what to do to improve user satisfaction such as a more positive attitude, better communication concerning programs, and more community participation [63].

4.3. Groundwater Quality

TDS is a parameter that can be used to determine whether an intrusion or ionic contamination is better than the Electrical Conductivity (EC) value [64]. The results show that the TDS concentration in the groundwater was well under the maximum standard quality of the Minister of Health of the Republic of Indonesia Number 27 of 2017 (1000 mg/L). This is supported by the geographical condition of the study site, whereby the intrusion of a dissolved solid, especially from seawater on the flanks of Mount Merapi, is highly unlikely because there is more than 40 km distance between them. The existing of dissolved solid in the groundwater was to be expected from the local source in the Mlati sub-district.
The groundwater pH in the study area was slightly acidic on average (pH 6.29) and outside the acceptable limits. Although the study area is located in a volcanically active zone, no obvious causes were identified, and further investigations into the origin of the groundwater’s acidity are needed. While average TDS (228 mg/L) met the water quality standards, the average TSS levels (108.6 mg/L) exceeded the standard of 40 mg/L at all monitoring points, except at one sampling location (W2). For comparison, TSS concentrations over 40 mg/L may begin to appear cloudy in most situations [65]. Locations with elevated levels, such as CWWTP4 located in Sendangadi Village, were typically detected in areas with the highest population densities among other regions, with up to 3288 persons per square kilometer [66]. In Indonesia, there are currently no quality standards for COD (average 18.2 mg/L) and oil and grease (average 0.6 mg/L). For comparison, the standard for oils and grease in groundwater in Sri Lanka is 0.2 mg/L [67]. The failure of local domestic wastewater treatment (on-site system) to remove oil and grease is the likely reason for the exceedances [68], but further investigations are required to confirm this source.
Ammonia and nitrate were well below the water quality standard. Although average nitrate concentrations (7.5 mg/L) were below limit, three sampling points, W10, W8, and W6 (23.4; 33.4; 37.5 mg/L, respectively), were in excess of the allowed standard quality (10 mg/L) in groundwater and require attention due to a link to long-term colorectal cancer risk in Yogyakarta. It is noted, however, that the highest nitrate concentrations were not found near CWWTPs in general. The high concentration of nitrate indicates a decomposition process of organic matter that can come from the use of fertilizers (agricultural activities), seepage from septic tank systems, contamination with untreated domestic waste, livestock activities, and so on [69,70]. Several studies show that there has been an increase in nitrate concentrations over several decades. This is due to the change in land use from open land into settlements accompanied by on-site sanitation conditions that do not meet the requirements, causing contamination of groundwater by feces [71]. High ammonia concentration ( NH 4 + ) (1–10 mmol/L) in the groundwater indicated that it was contaminated from leachate and the spilling and intrusion of domestic wastewater [72]. Complementary to this, the ammonia concentration in this study was identified to be near the limit of detection of the method. It is possible that the denitrification process in the groundwater has not yet occurred.
Under the observed slightly acidic groundwater conditions, elevated heavy metal concentrations related to leaching of naturally occurring metals from the bedrock are plausible. That is, heavy metals in groundwater may originate from Mount Merapi’s volcanic activity [73]. However, prior studies suggest that leaching from the original rock only accounts for 5 to 10% of the total [74]. Besides naturally occurring heavy metal sources, select metals in groundwater, such as lead or copper, might be linked to anthropogenic activities such as uncontrolled industrial and domestic waste disposal or mining activities. The observed exceedances of lead in water might also be related to other causes, such as pipe corrosion. In general, Pb concentrations in soils in the densely populated Yogyakarta urban area are higher than in the surrounding suburban areas, presumably due to human activities [75]. Elevated Copper concentrations at levels below US EPA or WHO/EU standards were observed in several locations throughout Yogyakarta and linked to batik industry activities [76].
Confirming prior studies [25], groundwater contamination with total coliform and E. coli is widespread in the study area. For instance, 105 of 133 well-water samples from the Sleman regency did not meet the water quality standards for E. coli and total coliform bacteria [26,35,38]. Our results indicate that CWWTPs reduced bacteria concentration in the groundwater surrounding the treatment plants in some areas. The findings were supported by previous research explaining the disadvantages of ABR reactors for treating domestic wastewater. It was not possible to remove the pathogen bacteria, such as total coliform and E. coli [77]. The disadvantage of ABR may be a good indication of the need for a new method to remove microbiological contamination in CWWTPs. As suggested in some works, an activated sludge system and membrane bioreactor [78] could be considered for further trials in the CWWTP. Furthermore, the most pivotal matter is adding a disinfection unit right before discharge into water bodies or infiltration tanks. However, this method needs more than CWWTP managers’ willingness to be implemented since the government and user involvement will be required.

5. Conclusions

This study suggests that CWWTPs in the study area perform well for some indicator pollutants but fail to treat others. One factor limiting the performance of CWWTPs appears linked to how the operation and maintenance of these systems is financed by the local population as users. Overcoming the lack of funding would likely result in enhanced performance of the treatment plant in some locations. Moreover, there is an indication that well performing CWWTPs are linked to improved groundwater quality in the areas surrounding these plants. However, there are too few households connected to wastewater treatment plants, and the usage of septic systems built too close to drinking water wells remains a big challenge to improving the groundwater quality in the study area. In addition, the local geology and industrial pollution affect the groundwater quality. While little can be done about the influx of geogenic pollutants, stronger governmental oversight of polluting industries should improve groundwater quality. Overall, the interaction between CWWTPs and the local groundwater is complex and often site-specific.

Author Contributions

Conceptualization, W.B.; methodology, W.B.; software, A.A.A.; validation, W.B., T.B. and A.A.A.; formal analysis, W.B., A.A.A., S.R., A.Y., N.I.W., A.N.L. and Y.A.; investigation, W.B., A.A.A. and S.R.; resources, W.B.; data curation, A.A.A., S.R., N.I.W. and A.N.L.; writing—original draft preparation, W.B., T.B., A.A.A., S.R., A.Y., N.I.W., A.N.L. and Y.A.; writing—review and editing, W.B., T.B., A.A.A., S.R., A.Y., N.I.W., A.N.L. and Y.A.; visualization, A.A.A., S.R., A.Y., N.I.W. and A.N.L.; supervision, W.B. and T.B.; project administration, A.A.A.; funding acquisition, W.B. All authors have read and agreed to the published version of the manuscript.

Funding

This research received funding from Universitas Islam Indonesia Grant Penelitian Kolaboratif dalam Rangka Program Percepatan Profesor Universitas Islam Indonesia No. 3356/Rek/10/DSDM/IX/2021.

Institutional Review Board Statement

The study was conducted in accordance with the Declaration of Helsinki, and approved by The Ethics Committee of the Faculty of Medicine, Islamic University of Indonesia (Number 9/Ka.Kom.Et/70/KE/V/2022 on 3 May 2022).

Informed Consent Statement

Informed consent was obtained from all subjects involved in the study.

Data Availability Statement

The data presented in this study are available on request from the corresponding author. The data are not publicly available due to university’s policy.

Acknowledgments

The authors thank Direktorat Sumber Daya Manusia, Universitas Islam Indonesia for financial support for the research that this article was based on. The authors also thank Direktorat Penelitian dan Pengabdian Masyarakat, Universitas Islam Indonesia for administrative support for the research that this article was based on, Direktorat Pengembangan Akademik, Universitas Islam Indonesia for financial support for publishing this article. The authors also thank Ergianzah Reezqiana Sihayuardhi for supporting the map creation for the article.

Conflicts of Interest

The authors declare no conflict of interest.

References

  1. Pemerintah Republik Indonesia Peraturan Presiden (PERPRES) Nomor 18 Tahun 2020 Tentang Rencana Pembangunan Jangka Menengah Nasional Tahun 2020–2024 (Presidential Regulation Number 18 of 2020 Concerning the National Medium-Term Development Plan for 2020–2024). Available online: https://peraturan.bpk.go.id/Home/Details/131386/perpres-no-18-tahun-2020 (accessed on 8 July 2021).
  2. Odagiri, M.; Cronin, A.A.; Thomas, A.; Kurniawan, M.A.; Zainal, M.; Setiabudi, W.; Gnilo, M.E.; Badloe, C.; Virgiyanti, T.D.; Nurali, I.A.; et al. Achieving the Sustainable Development Goals for Water and Sanitation in Indonesia—Results from a Five-Year (2013–2017) Large-Scale Effectiveness Evaluation. Int. J. Hyg. Environ. Health. 2020, 230, 113584. [Google Scholar] [CrossRef]
  3. Kementerian Pekerjaan Umum dan Perumahan Rakyat Peraturan Menteri Pekerjaan Umum Dan Perumahan Rakyat Nomor 04/PRT/M/2017 Tahun 2017 Tentang Penyelenggaraan Sistem Pengelolaan Air Limbah Domestik (Regulation of the Minister of Public Works and Housing No. 4 of 2017 on the Implementation of Domestic Wastewater Management Systems). Available online: https://peraturan.bpk.go.id/Home/Details/104453/permen-pupr-no-04prtm2017-tahun-2017 (accessed on 8 July 2021).
  4. Direktorat Jenderal Cipta Karya Kementrian Pekerjaan Umum RI Program Sanitasi Perkotaan Berbasis Masyarakat (Community Based Urban Sanitation Program). Available online: http://ciptakarya.pu.go.id/spbm-usri/index.php?page=sanitasi/tentang (accessed on 8 July 2021).
  5. Roesiyana, R.; Widayati, W.; Manar, D.G. Partisipasi Masyarakat Di Dalam Program Sanitasi Perkotaan Berbasis Masyarakat Studi Kasus: Kelurahan Banyumanik Kota Semarang (Community Participation in Community-Based Urban Sanitation Program Case Study: Banyumanik Village, Semarang City). J. Politic Gov. Stud. 2015, 4, 341–350. [Google Scholar]
  6. Pemerintah Kota Yogyakarta. Informasi Kinerja Pengelolaan Lingkungan Hidup Daerah Kota Yogyakarta Tahun 2020; Pemerintah Kota Yogyakarta: Yogyakarta, Indonesia, 2021. [Google Scholar]
  7. Saraswati, S.P.; Diavid, G.H.; Nisa, S.A.; Amal, N.; Asriningtyas, V. Feasibility Evaluation of Wastewater Treatment Plant System: A Case Study of Domestic Wastewater System in Sleman Regency, Yogyakarta, Indonesia. J. Civ. Eng. Forum 2021, 7, 309–322. [Google Scholar] [CrossRef]
  8. Sitra, E.; Agustar, A.; Erwin, E. Pelaksanaan Program Sanitasi Total Berbasis Masyarakat (Stbm) Dan Implikasinya Terhadap Perubahan Perilaku Masyarakat Di Kabupaten Lima Puluh Kota (Implementation of Community-Based Total Sanitation Program (STBM) and Its Implications for Changes in Community Behavior in Fifty Cities District). JISPO J. Ilmu Sos. Dan Ilmu Polit. 2019, 9, 344–355. [Google Scholar] [CrossRef]
  9. Pusat Pengembangan Teknologi Pengolahan Air Limbah Profil PUSTEKLIM. Available online: http://pusteklim.org/pusteklim (accessed on 8 July 2022).
  10. Dinas Lingkungan Hidup dan Kehutanan Daerah Istimewa Yogyakarta. Dokumen Informasi Kinerja Pengelolaan Lingkungan Hidup Daerah Daerah Istimewa Yogyakarta Tahun 2020 (Information Document on Environmental Management Performance in the Special Region of Yogyakarta in 2020); Dinas Lingkungan Hidup dan Kehutanan Daerah Istimewa Yogyakarta: Yogyakarta, Indonesia, 2021. [Google Scholar]
  11. Brontowiyono, W.; Yulianto, A.; Utami, S.; Lupiyanto, R. Evaluation of Decentralized Communal Wastewater Treatment in Yogyakarta; Universitas Sebelas Maret: Surakarta, Indonesia, 2009; pp. 1–9. [Google Scholar]
  12. Rahmawati, S.; Luthfi, Z.H.; Yulianto, A.; Wantoputri, N.I. Evaluation of Communal WWTP Performance Based on Technology Management in Kabupaten Sleman D.I. Yogyakarta. Sanit. Value Chain 2021, 5, 41. [Google Scholar] [CrossRef]
  13. Ekarini, F.D.; Rafsanjani, S.; Rahmawati, S.; Asmara, A.A. Groundwater Mapping of Total Coliform Contamination in Sleman, Yogyakarta, Indonesia. IOP Conf. Ser. Earth Environ. Sci. 2021, 933, 012047. [Google Scholar] [CrossRef]
  14. Caesar, D.L.; Prasetya, B.A. Efektifitas Media Poster Dalam Meningkatkan Pengetahuan Sanitasi Dasar Di SDN 01 Wonosoco Undaan Kudus (The Effectiveness of Poster Media in Improving Basic Sanitation Knowledge at SDN 01 Wonosoco Undaan Kudus). J-KESMAS J. Kesehat. Masy. 2020, 6, 83–91. [Google Scholar] [CrossRef]
  15. Badan Pusat Statistik Daerah Istimewa Yogyakarta. Statistik Air Bersih Daerah Istimewa Yogyakarta 2020 (Water Supply Statistics of Daerah Istimewa Yogyakarta 2020); Badan Pusat Statistik Daerah Istimewa Yogyakarta: Yogyakarta, Indonesia, 2021. [Google Scholar]
  16. Yulianto, A.; Pramudita, A.F.; Wantoputri, N.I.; Rahmawati, S. Evaluation of Post-Construction Communal Wastewater Treatment Plants (WWTPs) in Sleman District, Special Region of Yogyakarta. IOP Conf. Ser. Earth Environ. Sci. 2021, 933, 12019. [Google Scholar] [CrossRef]
  17. Ramírez-Castillo, F.Y.; Loera-Muro, A.; Jacques, M.; Garneau, P.; Avelar-González, F.J.; Harel, J.; Guerrero-Barrera, A.L. Waterborne Pathogens: Detection Methods and Challenges. Pathogens 2015, 4, 307–334. [Google Scholar] [CrossRef]
  18. Griffiths, J.K. Waterborne Diseases. In International Encyclopedia of Public Health, 2nd ed.; Quah, S.R., Ed.; Academic Press: Oxford, UK, 2017; pp. 388–401. ISBN 978-0-12-803708-9. [Google Scholar]
  19. Setianto, A.; Triandini, T. Comparison of Kriging and Inverse Distance Weighted (IDW) Interpolation Methods in Lineament Extraction and Analysis. J. Appl. Geol. 2013, 5, 21–29. [Google Scholar] [CrossRef]
  20. Almodaresi, S.A.; Mohammadrezaei, M.; Dolatabadi, M.; Nateghi, M.R. Qualitative Analysis of Groundwater Quality Indicators Based on Schuler and Wilcox Diagrams: IDW and Kriging Models. J. Environ. Health Sustain. Dev. 2019, 4, 903–912. [Google Scholar] [CrossRef]
  21. Shukla, K.; Kumar, P.; Mann, G.S.; Khare, M. Mapping Spatial Distribution of Particulate Matter Using Kriging and Inverse Distance Weighting at Supersites of Megacity Delhi. Sustain. Cities Soc. 2020, 54, 101997. [Google Scholar] [CrossRef]
  22. Badan Informasi Geospasial (BIG). Peta Rupabumi Digital Indonesia (Indonesia’s Digital Topographic Map). Available online: http://tanahair.indonesia.go.id/portal-web/ (accessed on 23 April 2022).
  23. Environmental Systems Research Institute, Inc. ArcGIS 10.3.1 for Desktop; Environmental Systems Research Institute, Inc.: Redlands, CA, USA, 2016. [Google Scholar]
  24. Kementerian Lingkungan Hidup dan Kehutanan RI Peraturan Menteri Lingkungan Hidup Dan Kehutanan No 68 Tahun 2016 Tentang Baku Mutu Air Limbah Domestik (Minister of Environment and Forestry Regulation No. 68 of 2016 Concerning Domestic Wastewater Quality Standards). Available online: https://jdih.maritim.go.id/id/peraturan-menteri-lingkungan-hidup-dan-kehutanan-no-p68menlhksetjenkum182016-tahun-2016 (accessed on 2 January 2022).
  25. Saputri, D.; Marendra, F.; Yuliansyah, A.T.; Prasetya, I.A.A.P. Evaluasi Aspek Teknis dan Lingkungan Instalasi Pengolahan Air Limbah (IPAL) Komunal di Kabupaten Sleman Yogyakarta (Evaluation of Technical and Environmental Aspects of Communal Wastewater Treatment Plant (CWTP) in Sleman Regency, Yogyakarta). J. Rekayasa Proses 2021, 15, 71–83. [Google Scholar] [CrossRef]
  26. World Health Organization Guidelines for Drinking-Water Quality. Available online: https://apps.who.int/iris/bitstream/handle/10665/254637/9789241549950-eng.pdf (accessed on 17 February 2022).
  27. Chen, Y.-C.; Higgins, M.J.; Beightol, S.M.; Murthy, S.N.; Toffey, W.E. Anaerobically Digested Biosolids Odor Generation and Pathogen Indicator Regrowth After Dewatering. Water Res. 2011, 45, 2616–2626. [Google Scholar] [CrossRef] [PubMed]
  28. Indrastuti; Kazama, S.; Takizawa, S. Evaluation of Microbial Contamination of Groundwater under Different Topographic Conditions and Household Water Treatment Systems in Special Region of Yogyakarta Province, Indonesia. Water 2021, 13, 1673. [Google Scholar] [CrossRef]
  29. Prisanto, D.E.; Yanuwiadi, B. Soemarno Studi Pengelolaan IPAL (Instalasi Pengolahan Air Limbah) Domestik Komunal Di Kota Blitar, Jawa Timur (Study on Communal Domestic WWTP (Wastewater Treatment Plant) Management in Blitar City, East Java). Indones. J. Environ. Sustain. Dev. 2015, 6, 74–80. [Google Scholar]
  30. Nilandita, W.; Pribadi, A.; Nengse, S.; Auvaria, S.W.; Nurmaningsih, D.R. Studi Keberlanjutan IPAL Komunal Di Kota Surabaya: Studi Kasus Di RT 2 RW 12 Kelurahan Bendul Merisi Kota Surabaya (Sustainability Study of Communal WWTP in Surabaya City: Case Study in RT 2 RW 12 Bendul Merisi Village, Surabaya City). Al-Ard J. Tek. Lingkung. 2019, 4, 46–54. [Google Scholar] [CrossRef]
  31. Brontowiyono, W.; Boving, T.; Asmara, A.A.; Rahmawati, S.; Yulianto, A.; Wantoputri, N.I.; Lathifah, A.N.; Andriansyah, Y. Non-Technical Dimensions of Communal Wastewater Treatment Plant Sustainability in Peri-Urban Yogyakarta, Indonesia. F1000Research 2022, 11, 542. [Google Scholar] [CrossRef]
  32. Kementerian Kesehatan RI Peraturan Menteri Kesehatan Nomor 27 Tahun 2017 Tentang Pedoman Pencegahan Dan Pengendalian Infeksi Di Fasilitas Pelayanan Kesehatan (Regulation of the Minister of Health Number 27 of 2017 Concerning Guidelines for Prevention and Control of Infections in Health Service Facilities). Available online: https://peraturan.bpk.go.id/Home/Details/112075/permenkes-no-27-tahun-2017 (accessed on 3 January 2022).
  33. Pemerintah Republik Indonesia Peraturan Pemerintah (PP) Nomor 22 Tahun 2021 Tentang Penyelenggaraan Perlindungan Dan Pengelolaan Lingkungan Hidup (Government Regulation (PP) Number 22 of 2021 Concerning Implementation of Environmental Protection and Management). Available online: https://peraturan.bpk.go.id/Home/Details/161852/pp-no-22-tahun-2021 (accessed on 1 September 2022).
  34. Popoola, L.T.; Yusuff, A.S.; Aderibigbe, T.A. Assessment of Natural Groundwater Physico-Chemical Properties in Major Industrial and Residential Locations of Lagos Metropolis. Appl. Water Sci. 2019, 9, 191. [Google Scholar] [CrossRef]
  35. Kementerian Kesehatan RI Peraturan Menteri Kesehatan Republik Indonesia No. 492 Tahun 2010 Tentang Persyaratan Kualitas Air Minum (Regulation of the Minister of Health of the Republic of Indonesia No. 492 of 2010 Concerning Drinking Water Quality Requirements). Available online: https://www.kesehatanlingkungan.com/2019/01/permenkes-492-tahun-2010-persyaratan.html (accessed on 8 July 2022).
  36. Kementerian Kesehatan RI Peraturan Menteri Kesehatan Nomor 32 Tahun 2017 Tentang Standar Baku Mutu Kesehatan Lingkungan Dan Persyaratan Kesehatan Air Untuk Keperluan Higiene Sanitasi, Kolam Renang, Solus Per Aqua, Dan Pemandian Umum (Minister of Health Regulation Number 32 of 2017 Concerning Environmental Health Quality Standards and Water Health Requirements for Sanitary Hygiene, Swimming Pools, Solus Per Aqua, and Public Baths). Available online: https://peraturan.bpk.go.id/Home/Details/112092/permenkes-no-32-tahun-2017 (accessed on 18 July 2022).
  37. Ongen, A.; Dokmeci, H.; Celik, S.; Sabudak, T.; Kaykıoğlu, G.; Dökmeci, A. Copper and Cadmium and Ground and Surface Water in Corlu-Turkey. J. Environ. Prot. Ecol. 2008, 9, 753–762. [Google Scholar]
  38. U.S. Environmental Protection Agency Drinking Water Regulations. Available online: https://www.epa.gov/dwreginfo/drinking-water-regulations (accessed on 17 June 2022).
  39. Muthaz, B.D.A.; Karimuna, S.R.; Ardiansyah, R.T. Studi Kualitas Air Minum Di Desa Balo Kecamatan Kabaena Timur Kabupaten Bombana Tahun 2016 (Study on Drinking Water Quality in Balo Village, East Kabaena District, Bombana Regency in 2016). J. Ilm. Mhs. Kesehat. Masy. 2017, 2, 1–9. [Google Scholar] [CrossRef]
  40. McKeown, R.M.; Hughes, D.; Collins, G.; Mahony, T.; O’Flaherty, V. Low-Temperature Anaerobic Digestion for Wastewater Treatment. Curr. Opin. Biotechnol. 2012, 23, 444–451. [Google Scholar] [CrossRef] [PubMed]
  41. Aslam, A.; Khan, S.J.; Shahzad, H.M.A. Anaerobic Membrane Bioreactors (AnMBRs) for Municipal Wastewater Treatment- Potential Benefits, Constraints, and Future Perspectives: An Updated Review. Sci. Total Environ. 2022, 802, 149612. [Google Scholar] [CrossRef]
  42. Stazi, V.; Tomei, M.C. Enhancing Anaerobic Treatment of Domestic Wastewater: State of the Art, Innovative Technologies and Future Perspectives. Sci. Total Environ. 2018, 635, 78–91. [Google Scholar] [CrossRef] [PubMed]
  43. Wainaina, S.; Lukitawesa; Kumar Awasthi, M.; Taherzadeh, M.J. Bioengineering of Anaerobic Digestion for Volatile Fatty Acids, Hydrogen or Methane Production: A Critical Review. Bioengineered 2019, 11, 437–458. [Google Scholar] [CrossRef]
  44. Menzel, T.; Neubauer, P.; Junne, S. Role of Microbial Hydrolysis in Anaerobic Digestion. Energies 2020, 13, 5555. [Google Scholar] [CrossRef]
  45. Saif, Y.; Ali, M.; Jones, I.M.; Ahmed, S. Performance Evaluation of a Field-Scale Anaerobic Baffled Reactor as an Economic and Sustainable Solution for Domestic Wastewater Treatment. Sustainability 2021, 13, 10461. [Google Scholar] [CrossRef]
  46. Yulistyorini, A.; Camargo-Valero, M.A.; Sukarni, S.; Suryoputro, N.; Mujiyono, M.; Santoso, H.; Tri Rahayu, E. Performance of Anaerobic Baffled Reactor for Decentralized Wastewater Treatment in Urban Malang, Indonesia. Processes 2019, 7, 184. [Google Scholar] [CrossRef]
  47. Siwiec, T.; Reczek, L.; Michel, M.M.; Gut, B.; Hawer-Strojek, P.; Czajkowska, J.; Jóźwiakowski, K.; Gajewska, M.; Bugajski, P. Correlations Between Organic Pollution Indicators in Municipal Wastewater. Arch. Environ. Prot. 2018, 44, 50–57. [Google Scholar] [CrossRef]
  48. Jamshidi, S.; Akbarzadeh, A.; Woo, K.-S.; Valipour, A. Wastewater Treatment Using Integrated Anaerobic Baffled Reactor and Bio-Rack Wetland Planted with Phragmites Sp. and Typha Sp. J. Environ. Health Sci. Eng. 2014, 12, 131. [Google Scholar] [CrossRef]
  49. Widyarani; Wulan, D.R.; Hamidah, U.; Komarulzaman, A.; Rosmalina, R.T.; Sintawardani, N. Domestic Wastewater in Indonesia: Generation, Characteristics and Treatment. Environ. Sci. Pollut. Res. 2022, 29, 32397–32414. [Google Scholar] [CrossRef] [PubMed]
  50. Pochwat, K.; Kida, M.; Ziembowicz, S.; Koszelnik, P. Odours in Sewerage—A Description of Emissions and of Technical Abatement Measures. Environments 2019, 6, 89. [Google Scholar] [CrossRef]
  51. Sonthiphand, P.; Cejudo, E.; Schiff, S.L.; Neufeld, J.D. Wastewater Effluent Impacts Ammonia-Oxidizing Prokaryotes of the Grand River, Canada. Appl. Environ. Microbiol. 2013, 79, 7454–7465. [Google Scholar] [CrossRef] [PubMed] [Green Version]
  52. Seruga, P.; Krzywonos, M.; Pyżanowska, J.; Urbanowska, A.; Pawlak-Kruczek, H.; Niedźwiecki, Ł. Removal of Ammonia from the Municipal Waste Treatment Effluents Using Natural Minerals. Molecules 2019, 24, 3633. [Google Scholar] [CrossRef]
  53. Ranudi, R.S.E. Evaluasi Pengelolaan IPAL Komunal Di Kabupaten Sleman (Evaluation of Communal WWTP Management in Sleman Regency). Bachelor’s Thesis, Universitas Islam Indonesia, Yogyakarta, Indonesia, 2018. [Google Scholar]
  54. Diavid, G.H.; Saraswati, S.P.; Nugroho, A.S.B. Evaluasi Kelayakan Kinerja Sistem Instalasi Pengolah Air Limbah Domestik: Studi Kasus Di Kabupaten Sleman [Feasibility Evaluation of Domestic Wastewater Treatment Installation System Performance: A Case Study in Sleman District]. In Proceedings of the Prosiding Teknik Mesin Untuk SNGBR; Politeknik Negeri Malang: Malang, Indonesia, 2018; pp. 43–52. [Google Scholar]
  55. Nelwan, F.; Sugiana, K.; Kamulyan, B. Kajian Program Pengelolaan Air Limbah Perkotaan Studi Kasus Pengelolaan IPAL Margasari Balikpapan (Study on Urban Wastewater Management Program a Case Study at WWTP Margasari Management of Balikpapan City, Indonesia). J. Mns. Dan Lingkung. 2003, 10, 94–103. [Google Scholar] [CrossRef]
  56. Hafidh, R.; Kartika, F.; Farahdiba, A.U. Keberlanjutan Instalasi Pengolahan Air Limbah Domestik (IPAL) Berbasis Masyarakat, Gunung Kidul, Yogyakarta (Sustainability of Community-Based Domestic Wastewater Treatment Plant (WWTP), Gunung Kidul, Yogyakarta). J. Sains. Tek. Ling. 2016, 8, 46–55. [Google Scholar] [CrossRef]
  57. Surahmat, A.; Rismayanti, R. Strategi Komunikasi Pembangunan dalam Difusi Teknologi Pengolahan Limbah Air (Studi Kasus IPAL Dusun Giriharja dan Biotoilet SDN Babakan Sinyar) (Development of Communication Strategies in Diffusion of Wastewater Treatment Technology (Case Study of WWTP in Giriharja Village and Biotoilet at SDN Babakan Sinyar)). J. Komun. Pembang. 2022, 20, 155–168. [Google Scholar] [CrossRef]
  58. Ajakima, S.O.; Soedjono, E.S. Perencanaan Instalasi Pengolahan Air Limbah Komunal Di Kelurahan Kedung Cowek Sebagai Upaya Revitalisasi Kawasan Pesisir Kota Surabaya (Planning for Communal Wastewater Treatment Plants in Kedung Cowek Village as an Effort to Revitalize Coastal Areas in Surabaya). J. Tek. ITS 2016, 5, D109–D115. [Google Scholar] [CrossRef]
  59. Ulum, G.H.; Suherman, S.; Syafrudin, S. Kinerja Pengelolaan IPAL Berbasis Masyarakat Program Usri Kelurahan Ngijo, Kecamatan Gunung Pati, Kota Semarang (Performance of Community-Based Wastewater Treatment Plant Management in the Usri Program, Ngijo Village, Gunung Pati District, Semarang City). J. Ilmu Lingkung. 2015, 13, 65–71. [Google Scholar] [CrossRef]
  60. Muliana, R.; Ghozali, A. Ariyaningsih Factors Influencing Adequate Sanitation on Domestic Wastewater Management of Black Water Type in Margasari Village. IOP Conf. Ser. Earth Environ. Sci. 2021, 778, 012015. [Google Scholar] [CrossRef]
  61. Fajarwati, A.; Setyaningrum, A.; Rachmawati, R.; Prakoso, B.S.E. Keys of Sustainable Community-Based Waste Management (Lesson Learnt from Yogyakarta City). E3S Web Conf. 2020, 200, 2018. [Google Scholar] [CrossRef]
  62. Purboningtyas, W. Program Citizen’s Charter Terkait Pembangunan Sanitasi IPAL (Instalasi Pengelolaan Air Limbah) Domestik Komunal Dalam Rangka Mewujudkan Sustainable Development (Program Citizen’s Charter Terkait Pembangunan Sanitasi IPAL (Instalasi Pengelolaan Air Limbah) Domestik Komunal Dalam Rangka Mewujudkan Sustainable Development). J. Adm. Publik 2014, 2, 506–510. [Google Scholar]
  63. Fajarini, A.A. Efektivitas Program Instalasi Pengolahan Air Limbah (IPAL) Komunal Di Kawasan Sentra Batik Kliwonan Kecamatan Masaran Kabupaten Sragen (The Effectiveness of the Communal Wastewater Treatment Plant Program in the Kliwonan Batik Center Area, Masaran District, Sragen Regency). Bachelor’s Thesis, Universitas Sebelas Maret, Surakarta, Indonesia, 2015. [Google Scholar]
  64. Rusydi, A.F. Correlation Between Conductivity and Total Dissolved Solid in Various Type of Water: A Review. IOP Conf. Ser. Earth Environ. Sci. 2018, 118, 12019. [Google Scholar] [CrossRef]
  65. Chen, S.; Huang, W.; Wang, H.; Li, D. Remote Sensing Assessment of Sediment Re-Suspension During Hurricane Frances in Apalachicola Bay, Usa. Remote Sens. Environ. 2009, 113, 2670–2681. [Google Scholar] [CrossRef]
  66. Putra, M.G. Pemetaan Lokasi Pembuangan Sampah Ilegal Menggunakan Sistem Informasi Geografis (SIG) Di Kawasan Perkotaan Kabupaten Sleman (the Mapping of Illegal Waste Disposal Using Information Systems Geographical (GIS) in Urban Areas Sleman District). Bachelor’s Thesis, Universitas Islam Indonesia, Yogyakarta, Indonesia, 2018. [Google Scholar]
  67. Indika, S.; Wei, Y.; Cooray, T.; Ritigala, T.; Jinadasa, K.B.S.N.; Weragoda, S.K.; Weerasooriya, R. Groundwater-Based Drinking Water Supply in Sri Lanka: Status and Perspectives. Water 2022, 14, 1428. [Google Scholar] [CrossRef]
  68. Saravanan, S.; Umar Lebbe, M.M.; Premathilaka, K.; Weragoda, S.K.; Goonewardene, N.; Weerasooriya, R.; Vitharana, W.; Sandrasegarampillai, B. Oil and Grease Contamination of Groundwater in Chunnakam Area, Jaffna. In Proceedings of the IWA Water and Development Congress & Exhibition, Colombo, Srilanka, 3 December 2019. [Google Scholar]
  69. Fathmawati; Fachiroh, J.; Sutomo, A.H.; Putra, D.P.E. Origin and Distribution of Nitrate in Water Well of Settlement Areas in Yogyakarta, Indonesia. Environ. Monit. Assess. 2018, 190, 628. [Google Scholar] [CrossRef]
  70. Almasri, M.N. Nitrate Contamination of Groundwater: A Conceptual Management Framework. Environ. Impact Assess. Rev. 2007, 27, 220–242. [Google Scholar] [CrossRef]
  71. Muryanto; Suntoro, S.; Gunawan, T.; Setyono, P.; Nurkholis, A.; Wijayanti, N.F. Distribution of Nitrate Household Waste and Groundwater Flow Direction around Code River, Yogyakarta, Indonesia. Indones. J. Geogr. 2019, 51, 54–61. [Google Scholar] [CrossRef]
  72. Böhlke, J.K.; Smith, R.L.; Miller, D.N. Ammonium Transport and Reaction in Contaminated Groundwater: Application of Isotope Tracers and Isotope Fractionation Studies. Water Resour. Res. 2006, 42, 1–19. [Google Scholar] [CrossRef]
  73. Napsiah, N. Tindakan Warga Merapi PascaerupsiMenjaga Daerah Tangkapan Air (Post-Disaster Act of Merapi Community to Keep Water Catchment Area). J. Penelit. Kesejaht. Sos. 2016, 15, 329–336. [Google Scholar] [CrossRef]
  74. Kjøller, C.; Postma, D.; Larsen, F. Groundwater Acidification and the Mobilization of Trace Metals in a Sandy Aquifer. Environ. Sci. Technol. 2004, 38, 2829–2835. [Google Scholar] [CrossRef] [PubMed]
  75. Budianta, W. Lead Contamination in Soil of Yogyakarta City, Indonesia. J. Appl. Geol. 2015, 4, 90–98. [Google Scholar] [CrossRef]
  76. Ho, G.D. The Assessment of Copper Contaminant Source in Aquifer, Case Study: Mantrijeron Area, Yogyakarta City, Indonesia. Master’s Thesis, Universitas Gadjah Mada, Yogyakarta, Indonesia, 2017. [Google Scholar]
  77. Nasr, F.A.; Doma, H.S.; Nassar, H.F. Treatment of Domestic Wastewater Using an Anaerobic Baffled Reactor Followed by a Duckweed Pond for Agricultural Purposes. Environmentalist 2009, 29, 270–279. [Google Scholar] [CrossRef]
  78. Aghalari, Z.; Dahms, H.-U.; Sillanpää, M.; Sosa-Hernandez, J.E.; Parra-Saldívar, R. Effectiveness of Wastewater Treatment Systems in Removing Microbial Agents: A Systematic Review. Glob. Health 2020, 16, 13. [Google Scholar] [CrossRef] [PubMed]
Figure 1. Study area and sampling location.
Water 14 03047 g001
Figure 2. Comparison of (a) pH, (b) temperature, (c) TSS, (d) BOD, (e) COD, (f) ammonia, (g) oil and grease, (h) the average of total coliform from six CWWTPs at the inlet and outlet.
Water 14 03047 g002aWater 14 03047 g002b
Figure 3. Results of survey of CWWTPs managers on (a) frequent problems in plant operations related to clogging and odors; (b) rating of the citizens’ engagement with the CWWTPs; and (c) reliability of CWWTP subscription fee payments by the citizens.
Water 14 03047 g003
Figure 4. Survey of CWWTP users in the Mlati sub-district regarding (a) monthly fee payment amounts, (b) perception of subscription cost, (c) perception of the CWWTP operational performance, and (d) the perception of CWWTP service.
Water 14 03047 g004
Figure 5. (a) TDS and (b) TSS concentration and distribution pattern.
Water 14 03047 g005
Figure 6. (a) COD and (b) Ammonia concentration and distribution pattern.
Water 14 03047 g006
Figure 7. (a) Nitrite and (b) nitrate concentration and distribution pattern.
Water 14 03047 g007
Figure 8. (a) Copper, (b) Lead, and (c) Zinc concentration and distribution patterns.
Water 14 03047 g008
Figure 9. (a) Oil and fat, (b) Total coliform, and (c) E. coli concentration and distribution pattern.
Water 14 03047 g009
Table 1. Standard method of water parameters.
ParametersIndonesian Standard QualityMethodsEquipment, Standard, and Limit of Detection (LOD)
BODSNI 6989.72:2009TitrimetricIncubator ET 6265 Lovibond (Tintometer GmbH, Dortmund, Germany); Glucose-Glutamic Acid (GGA)
CODSNI 6989.2:2009SpectrophotometryThermo Reactor ECO 25; Velp Scientifica Sri 505445 (Usmate Velate, Monza and Brianza, Italy); Spectrophotometer UV Vis 1700 (Shimadzu, Kyoto, Japan); standard Sigma Aldrich 500 mg/L; LOD 9.71 mg/L
Ammonia (NH3)SNI 06-6989.30-2005SpectrophotometryLAF Biobase (Shandong, China); Spectrophotometer UV Vis 1700 (Shimadzu, Kyoto, Japan); LOD 0.02 mg/L
TSS-TDSSNI 06-6989.3-2004GravimetricOven Memmert UN 110 B420.2432 (Büchenbach, Germany); CRM TSS 100mg/L Sigma Aldrich; TDS 1000 mg/L; LRAC 3286 Sigma Aldrich
SNI 06-6989.10-2004Gravimetric
Nitrite & nitrateSNI 06-6989.9-2004SpectrophotometrySpectrophotometer UV Vis 1700 (Shimadzu, Kyoto, Japan); LOD nitrite 0.002 mg/L, nitrate 0.2 mg/L
PbSNI 2354.5:2011Atomic absorption spectrometryAAS GBC Avanta (Perai, Malaysia); ICP Multi Element Standard Solution IV Merck 1.11355.0100 (New Jersey, United States); LOD 0.03 mg/L
CuSNI 6989.6:2009Atomic absorption spectrometryAAS GBC Avanta (Perai, Malaysia); ICP Multi Element Standard Solution IV Merck 1.11355.0100 (New Jersey, United States); LOD 0.01 mg/L
ZnSNI 06-6989.7-2004Atomic absorption spectrometryICP Multi Element Standard Solution IV Merck 1.11355.0100 (New Jersey, United States); LOD 0.02 mg/L
Total coliform and E. coliSNI 2897:2008Total Plate CountIncubator IN 75 Memmert D320.0208 (Büchenbach, Germany); CRM E.coli Merck VM 919254
Publisher’s Note: MDPI stays neutral with regard to jurisdictional claims in published maps and institutional affiliations.