3.1. Analysis of Pedestrian Escape Time and Number in Each Sample
In order to further understand the changes in the number of pedestrians evacuated over time, according to the range of the number of random samples, the samples of 0–10,000, 10,000–20,000, and 20,000–30,000 pedestrians were divided into three groups, respectively. The specific grouping situation is shown in
Table 4, and the relationship curve between the number of pedestrians who failed to escape and time is drawn, as shown in
Figure 10,
Figure 11 and
Figure 12.
Figure 10,
Figure 11 and
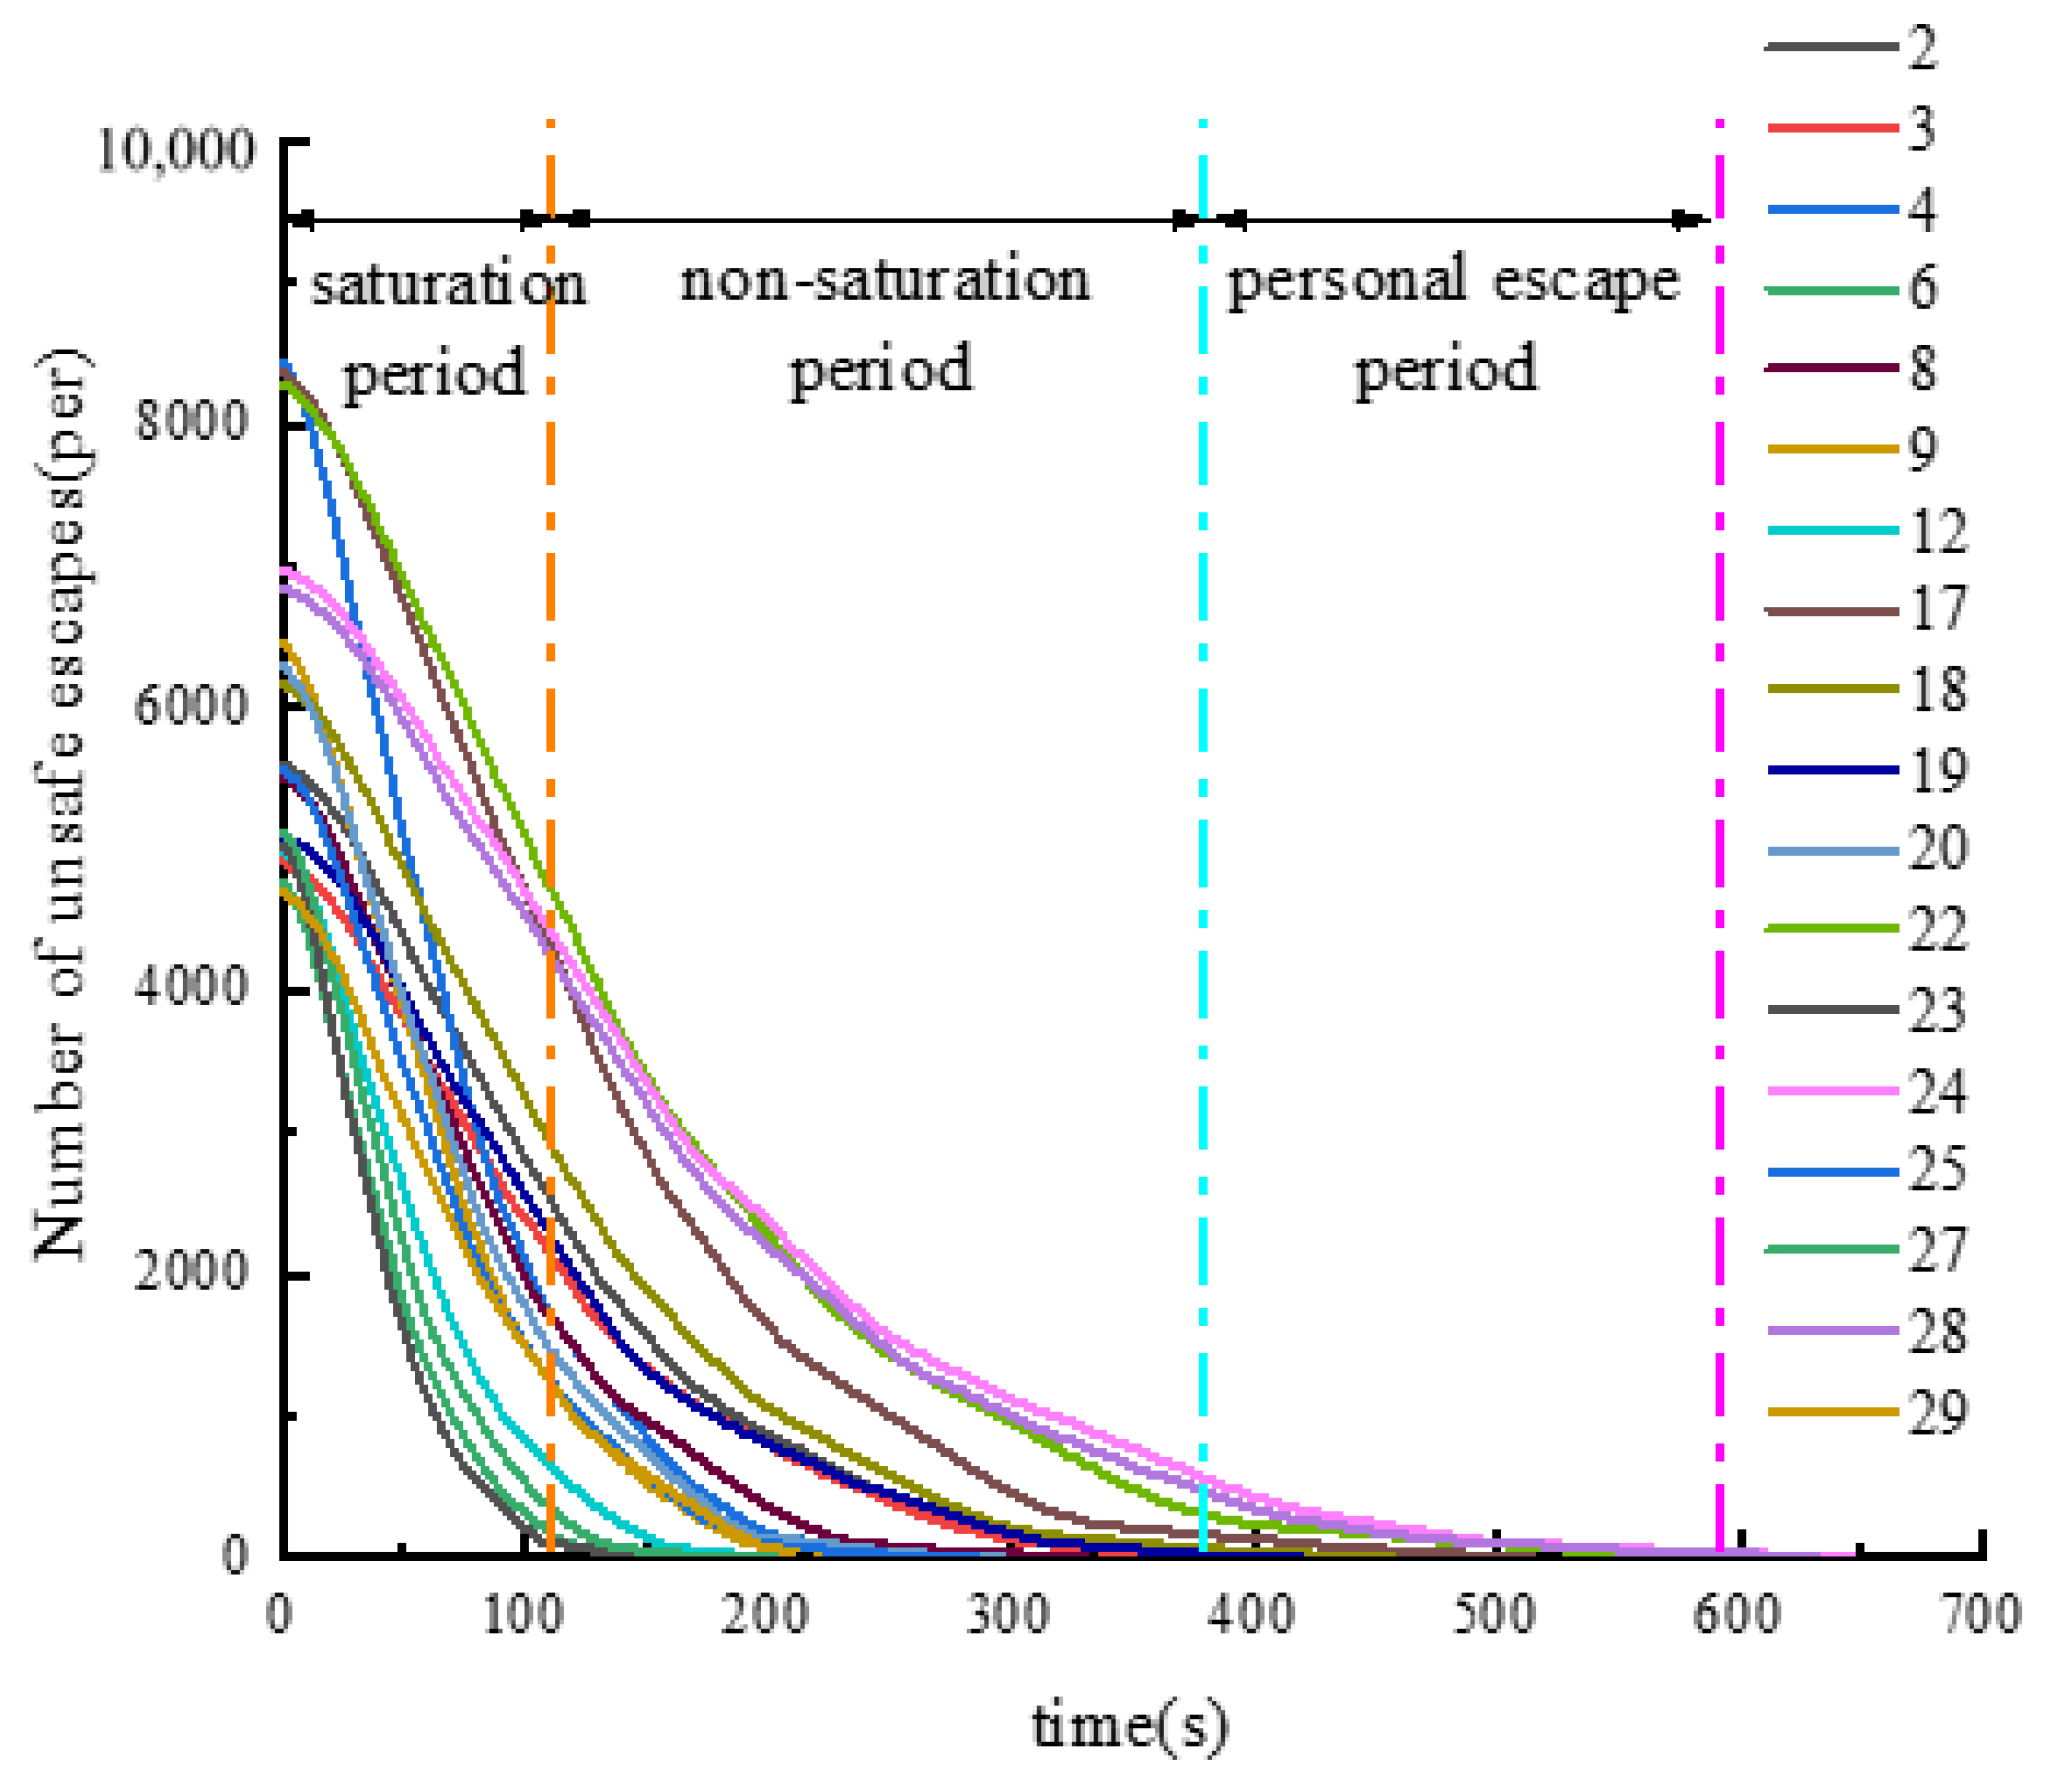
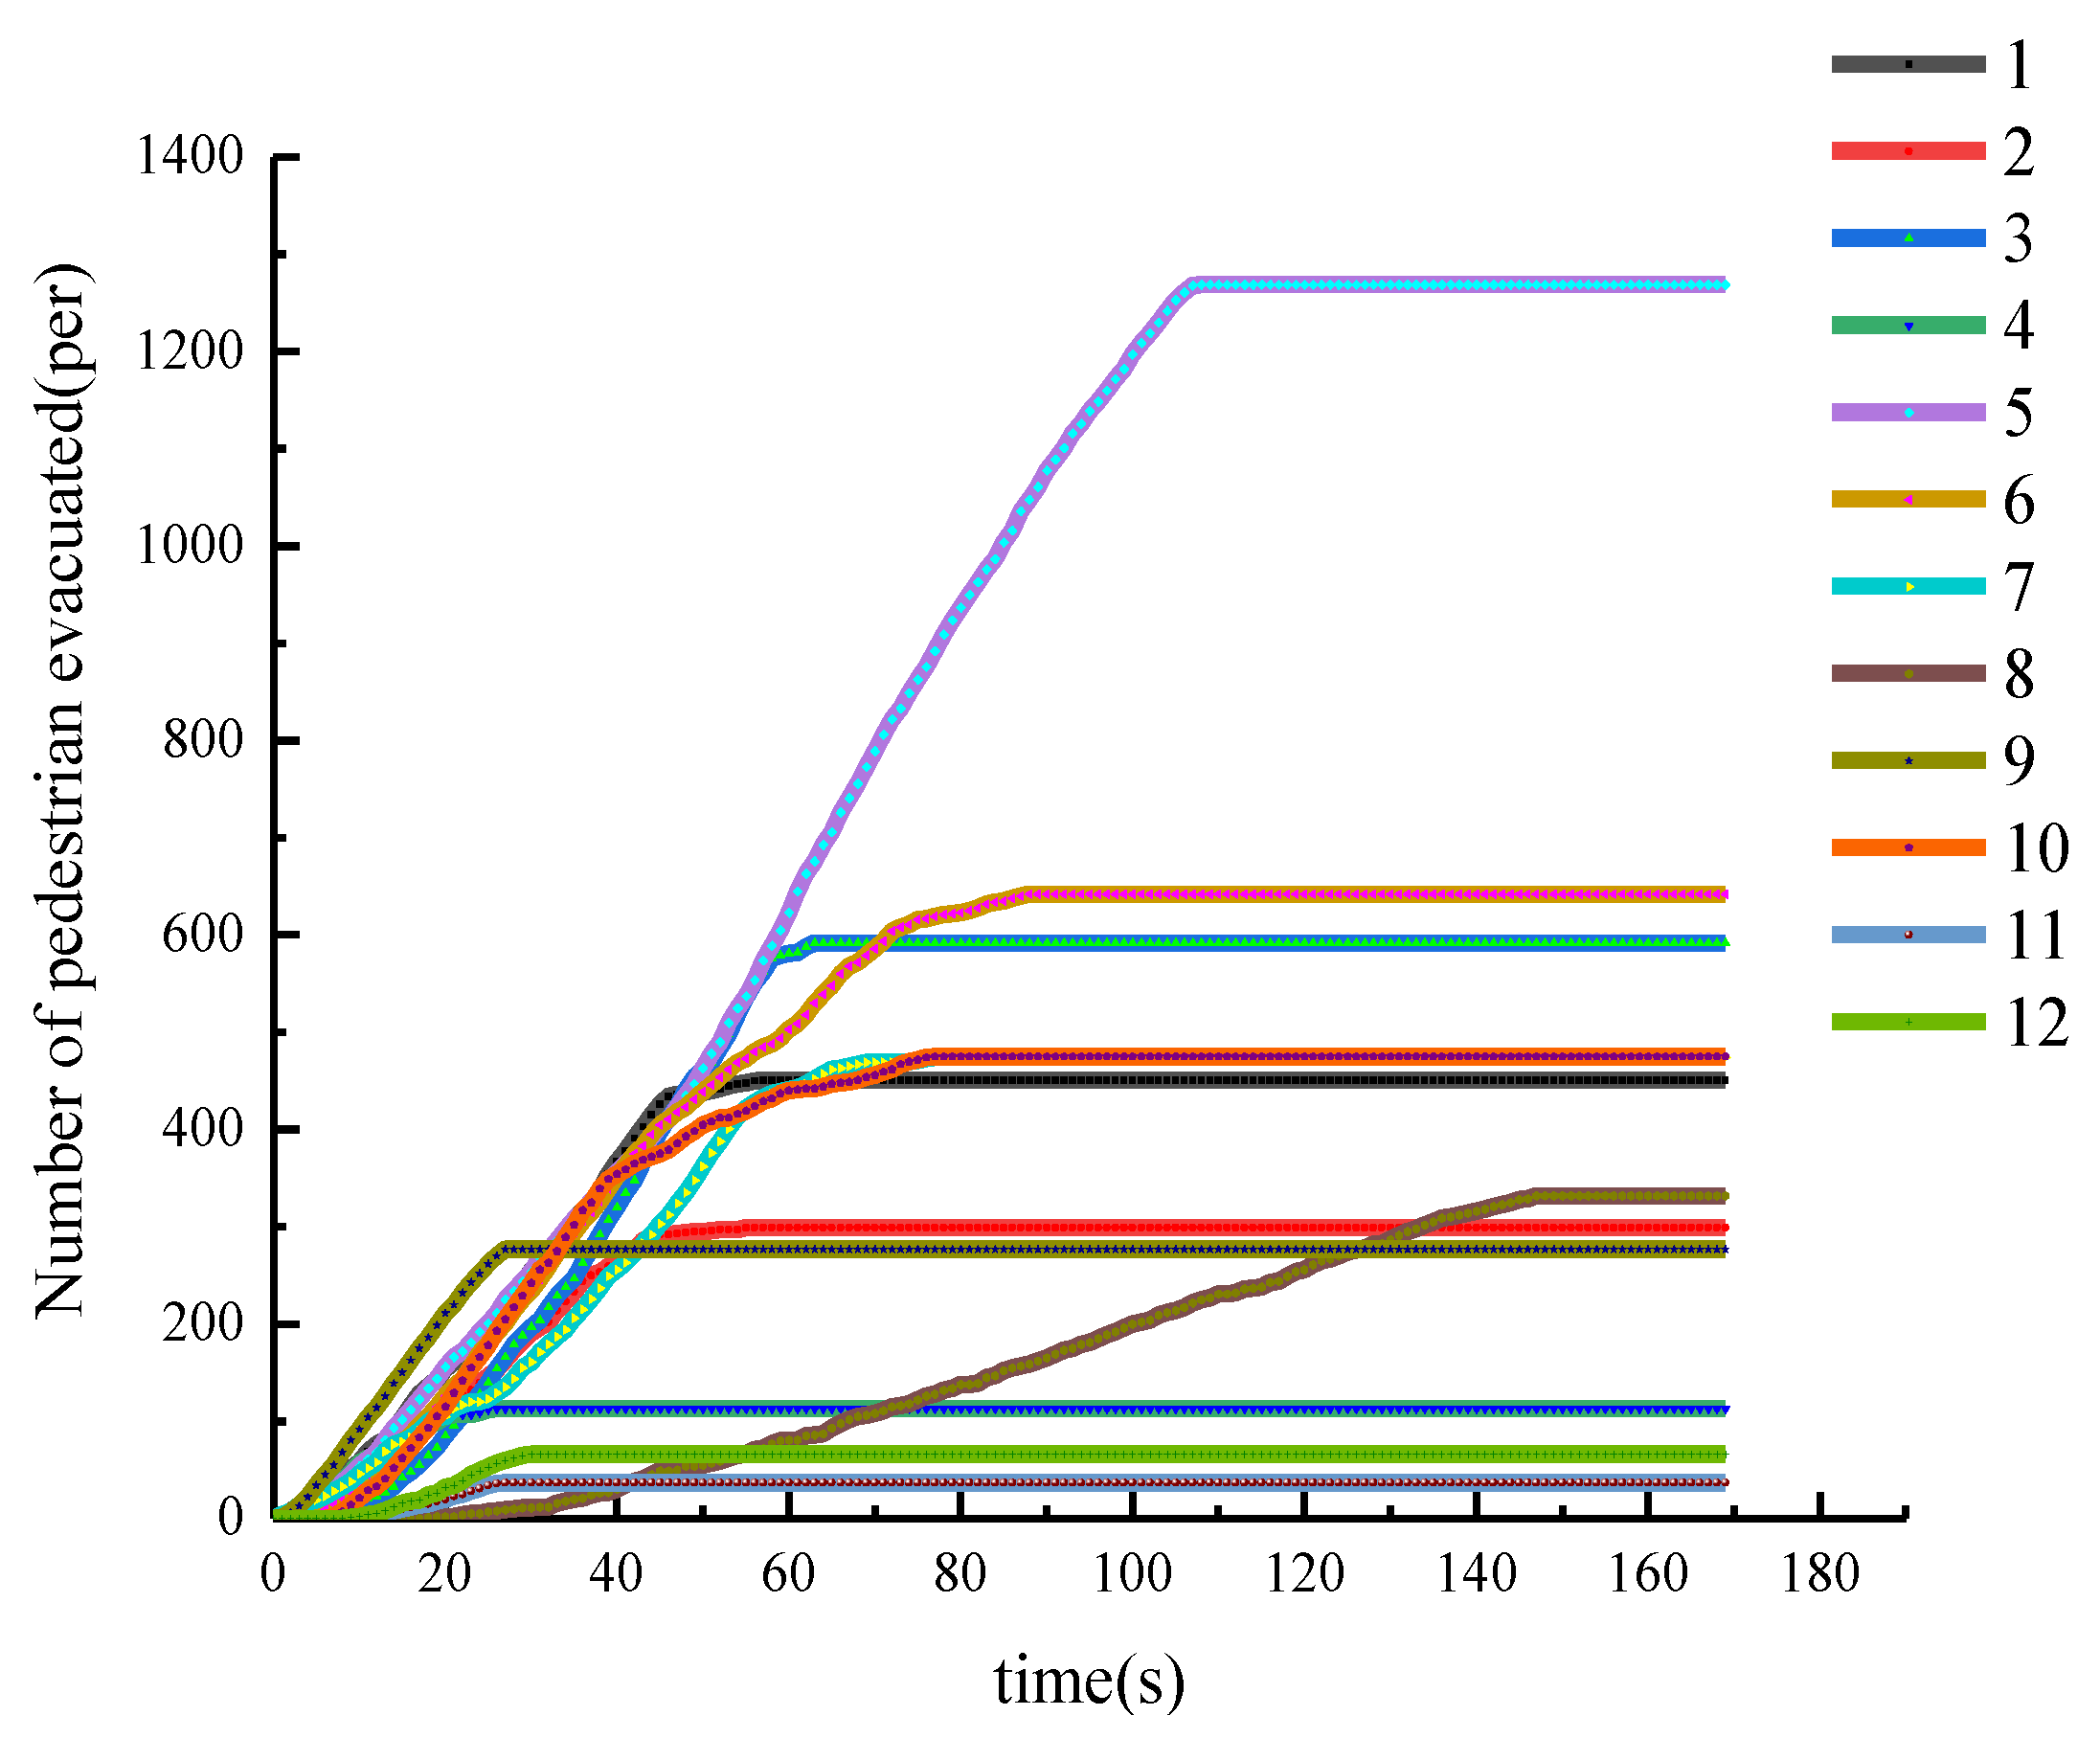
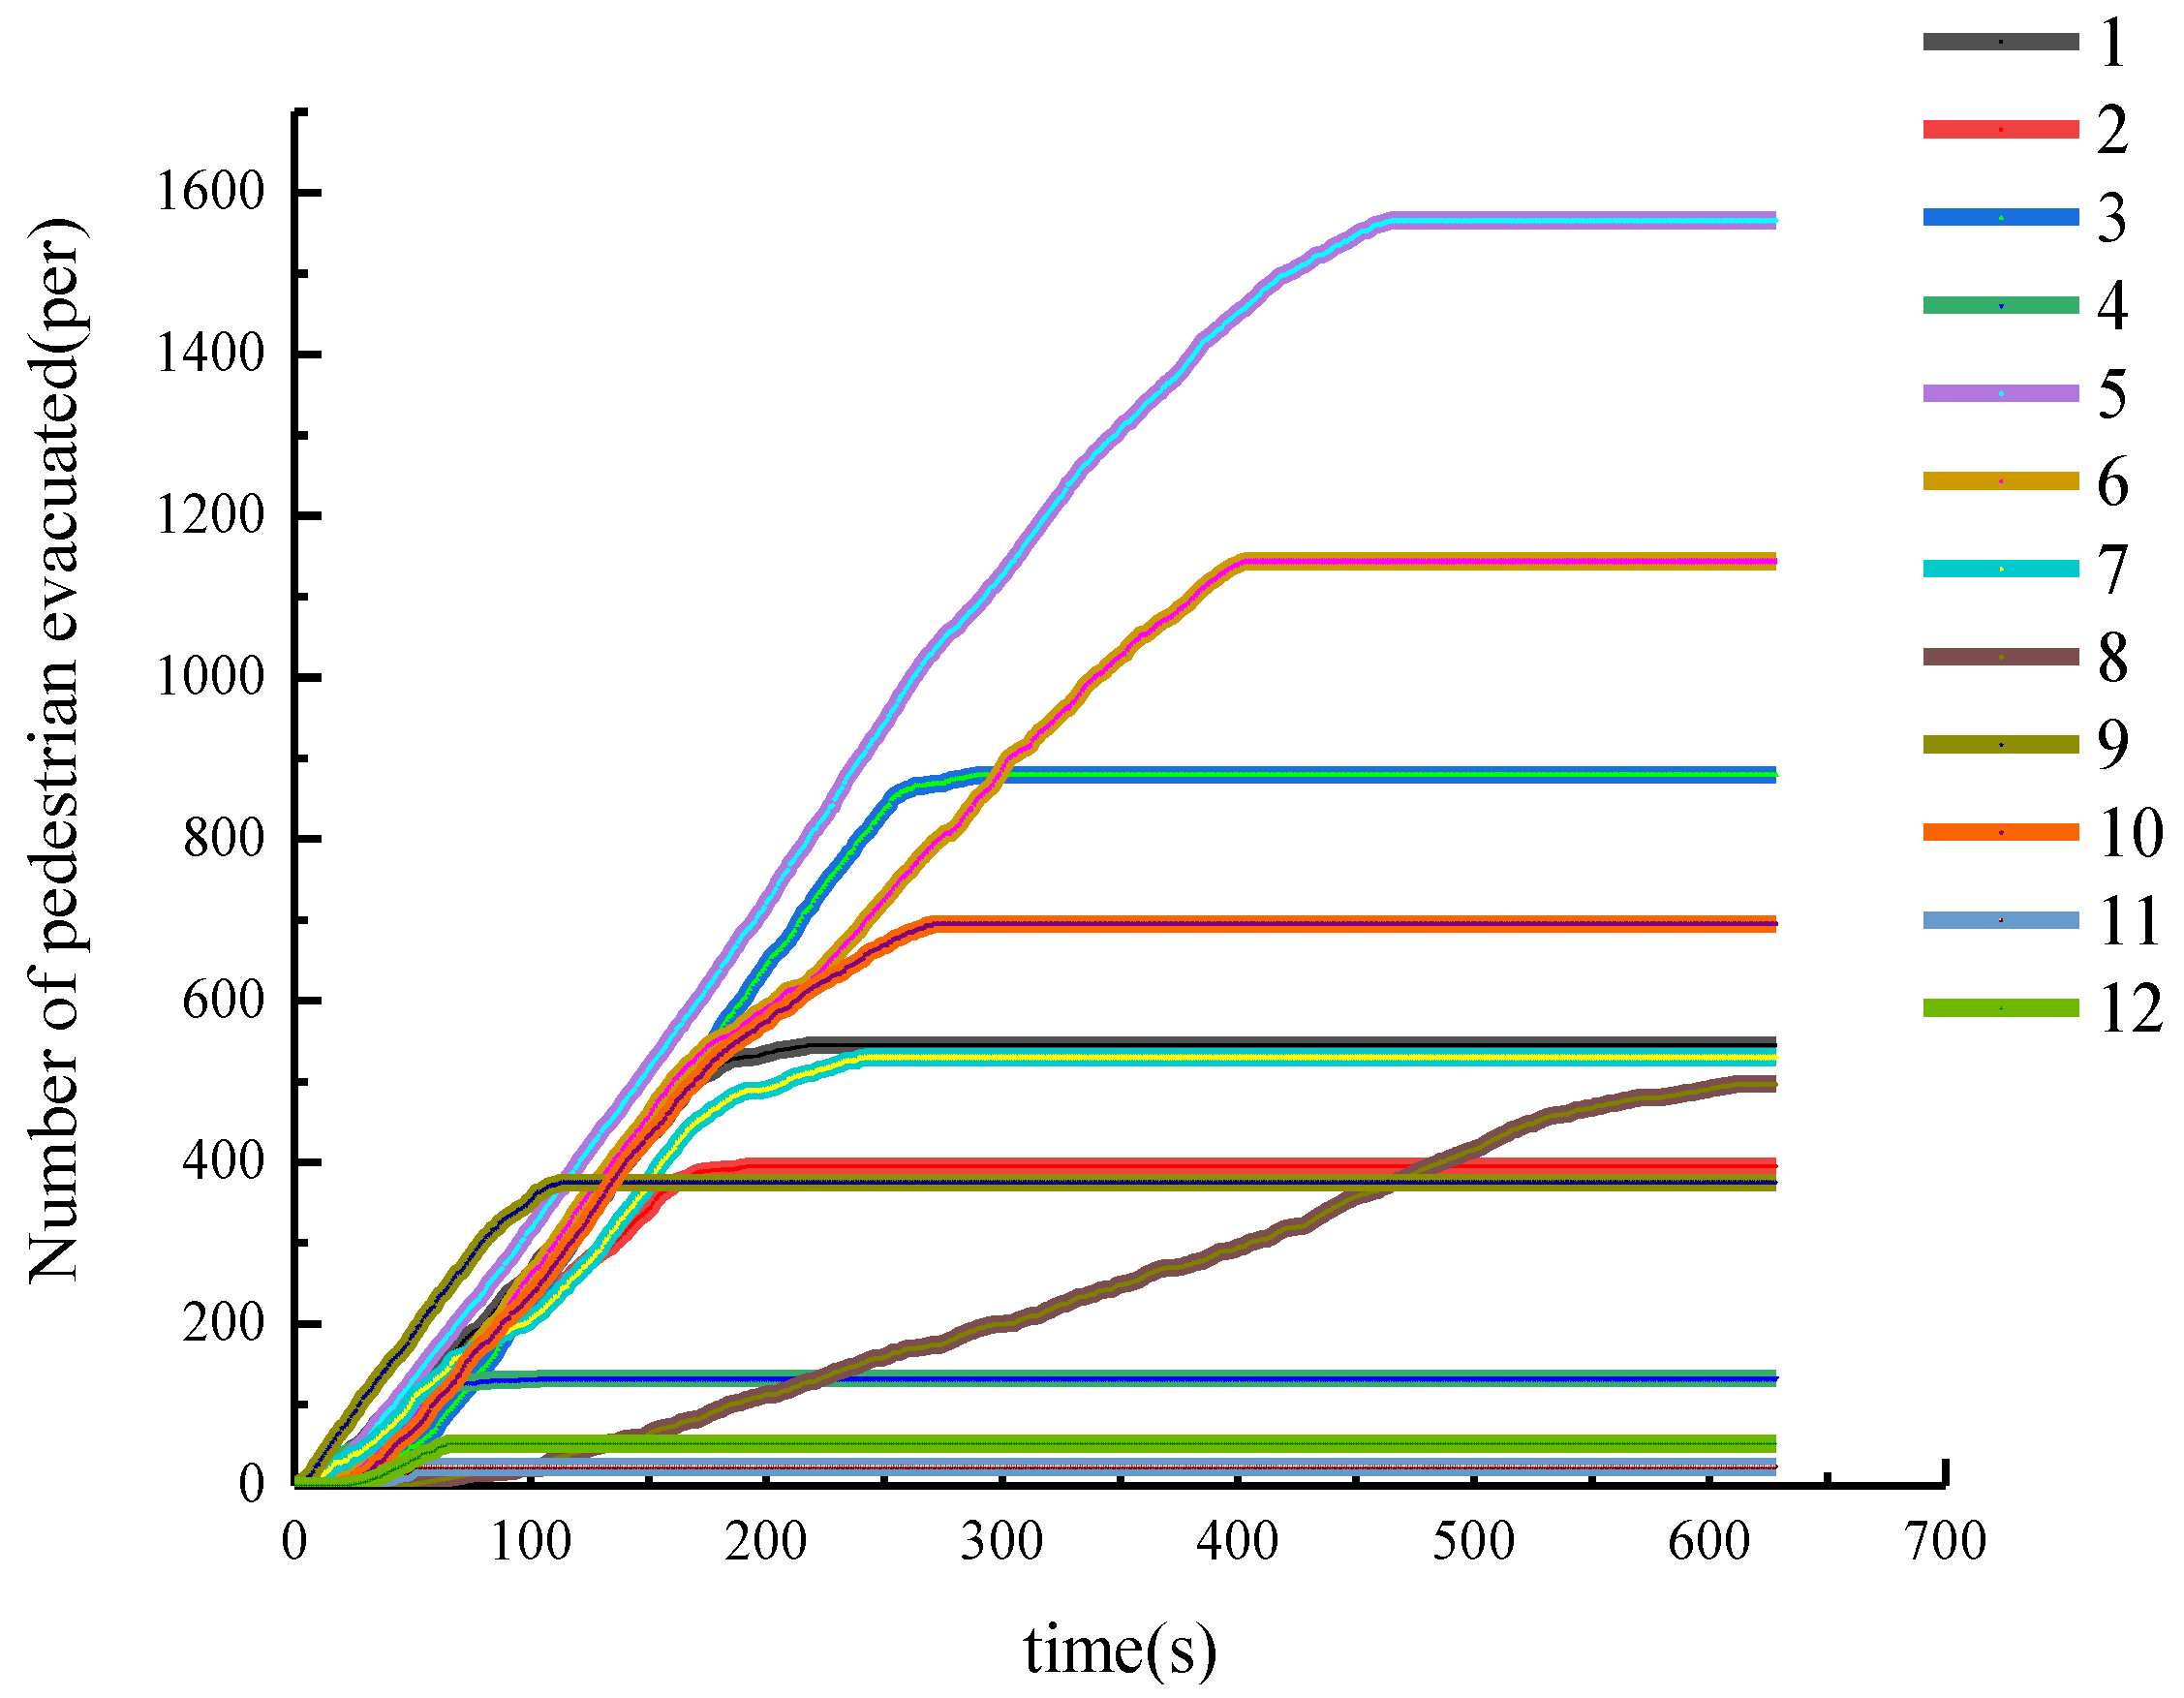
Figure 12 show that all the curves basically show a concave change; that is, with the increase of time, the number of pedestrians fleeing the subway station per unit of time is gradually decreasing. A 3D visualization of the escape was performed (
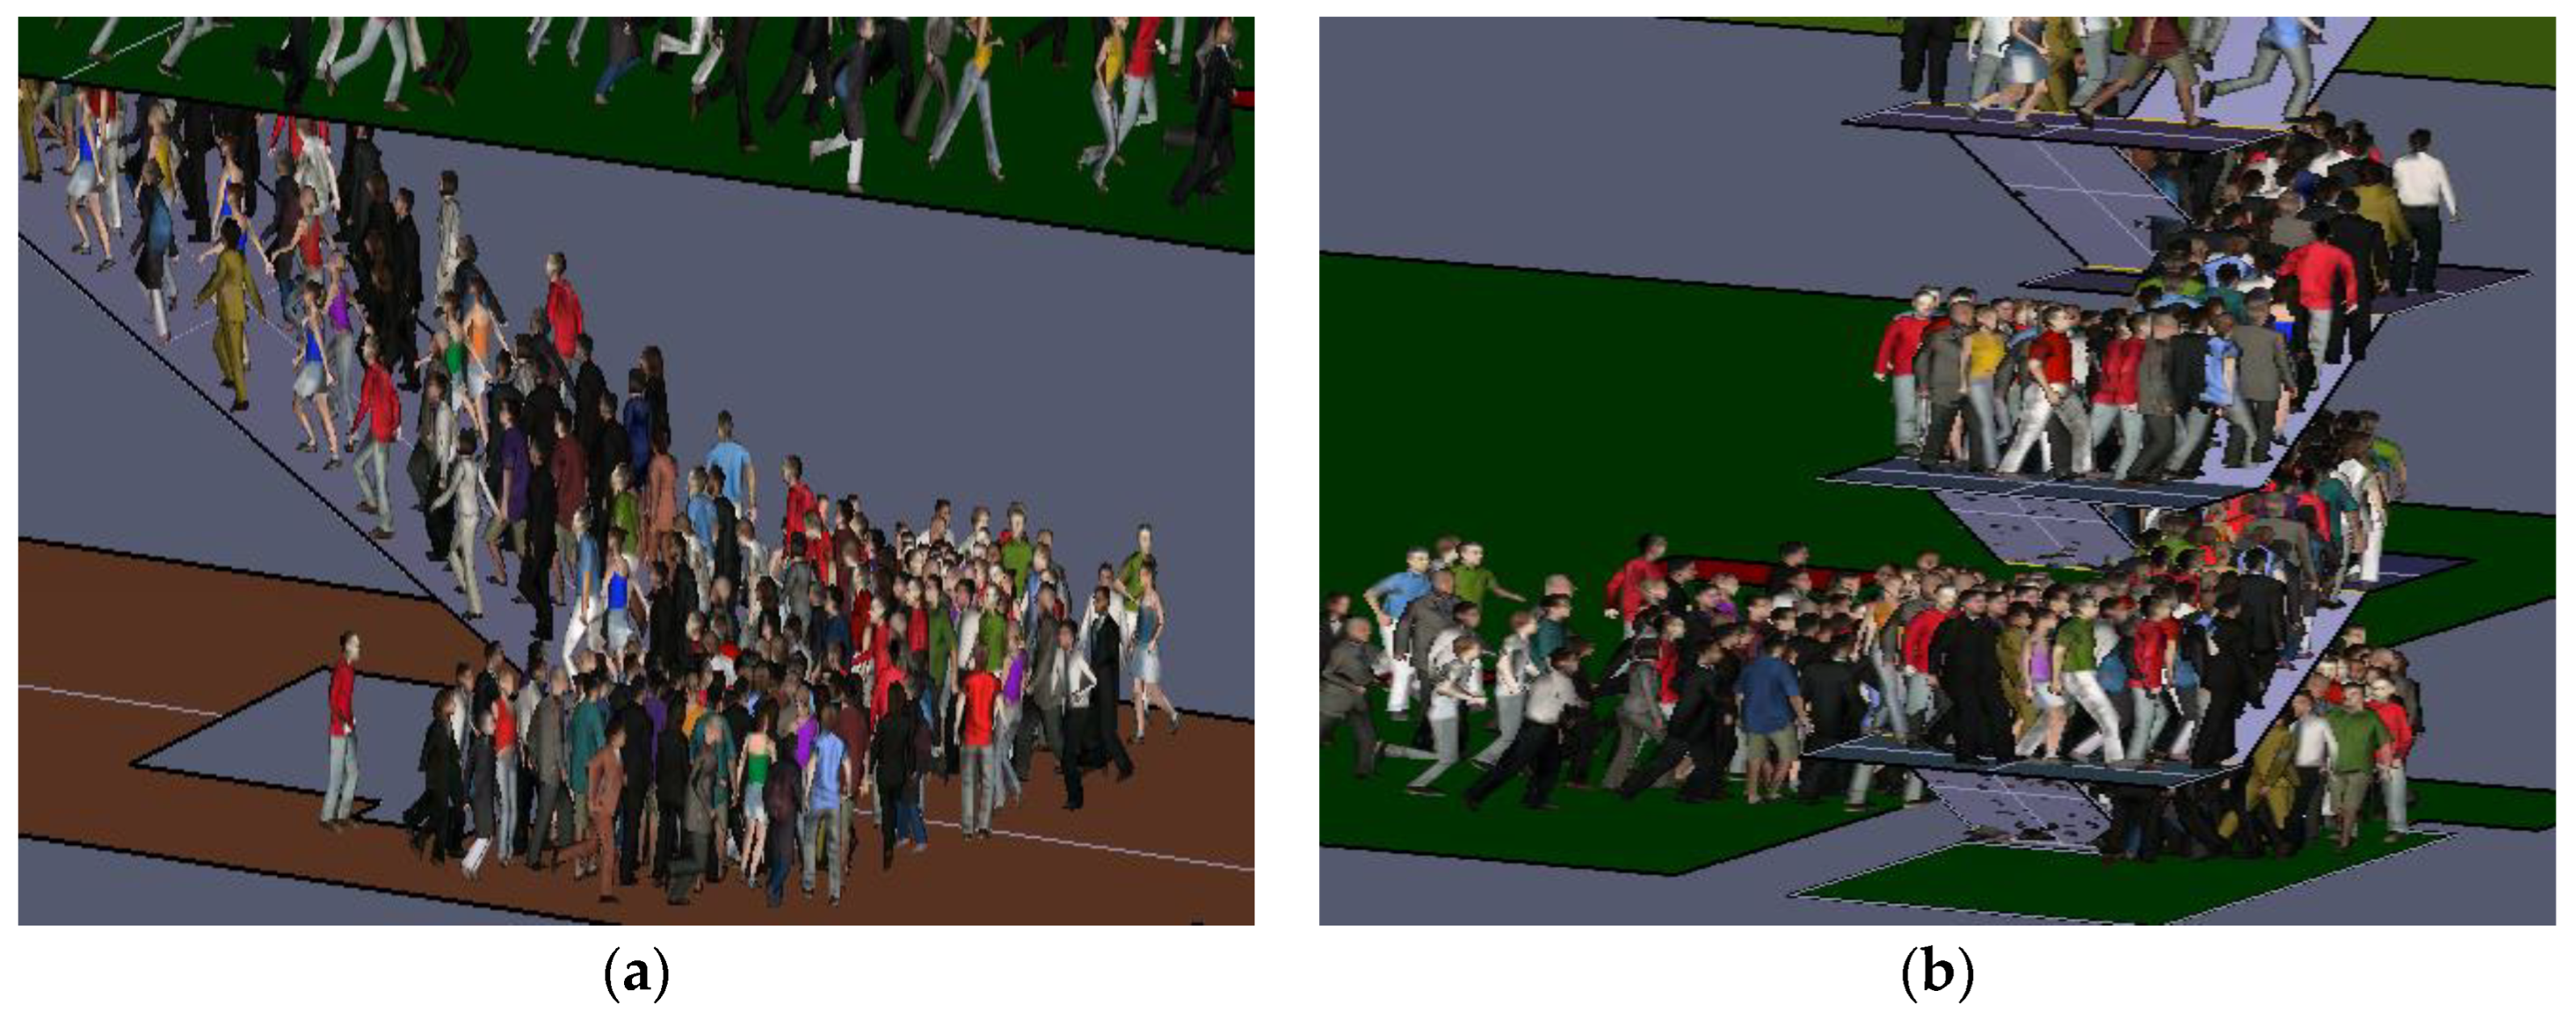
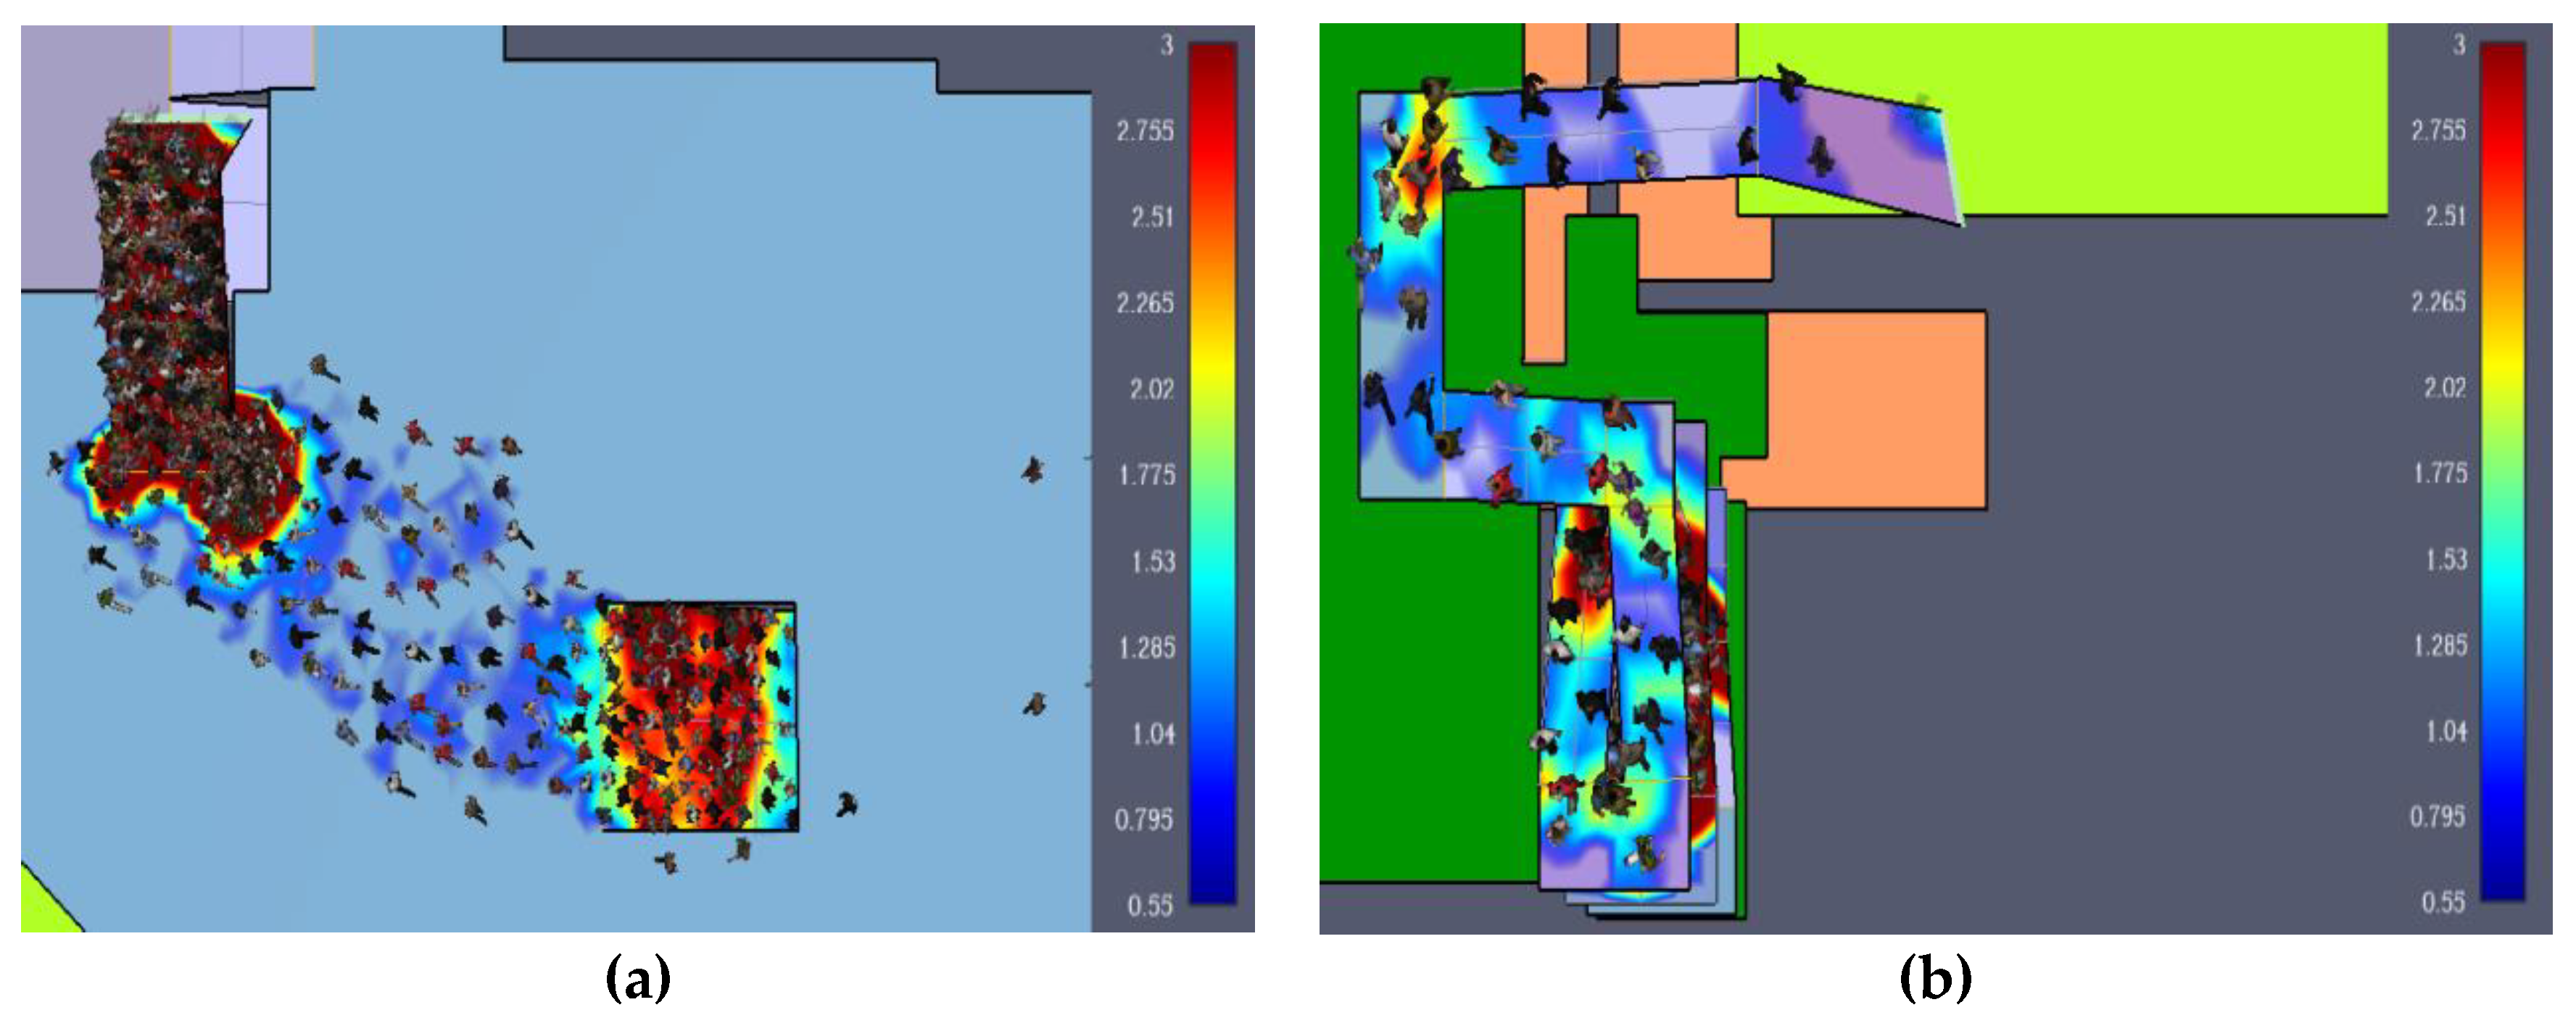
Figure 13). According to the changing form of the curve, pedestrian escape is divided into three periods: saturation period, non-saturation period, and personal escape. For example, within 0~110 s (saturation period) of the samples in group A, all the curves basically decline linearly, and the flow of the pedestrian at all exits in the subway reaches the maximum value at this time. The exit of the passage is in a saturated state, and a large number of pedestrians gather at the exit to escape (
Figure 14a), resulting in congestion. Within 110~380 s (half-saturation period), the slope of the curve decreases. At this time, the pedestrian flow at each exit is relatively small (
Figure 14b), and some exits have even been idle, and no one has passed. Within 380~590 s (personal escape period), the evacuation of pedestrians in the subway has basically been completed, and only a few pedestrians who are injured or have a slow walking speed are left to escape slowly.
3.2. Analysis of Pedestrian Passage Time and Number at Different Exits
Figure 10,
Figure 11 and
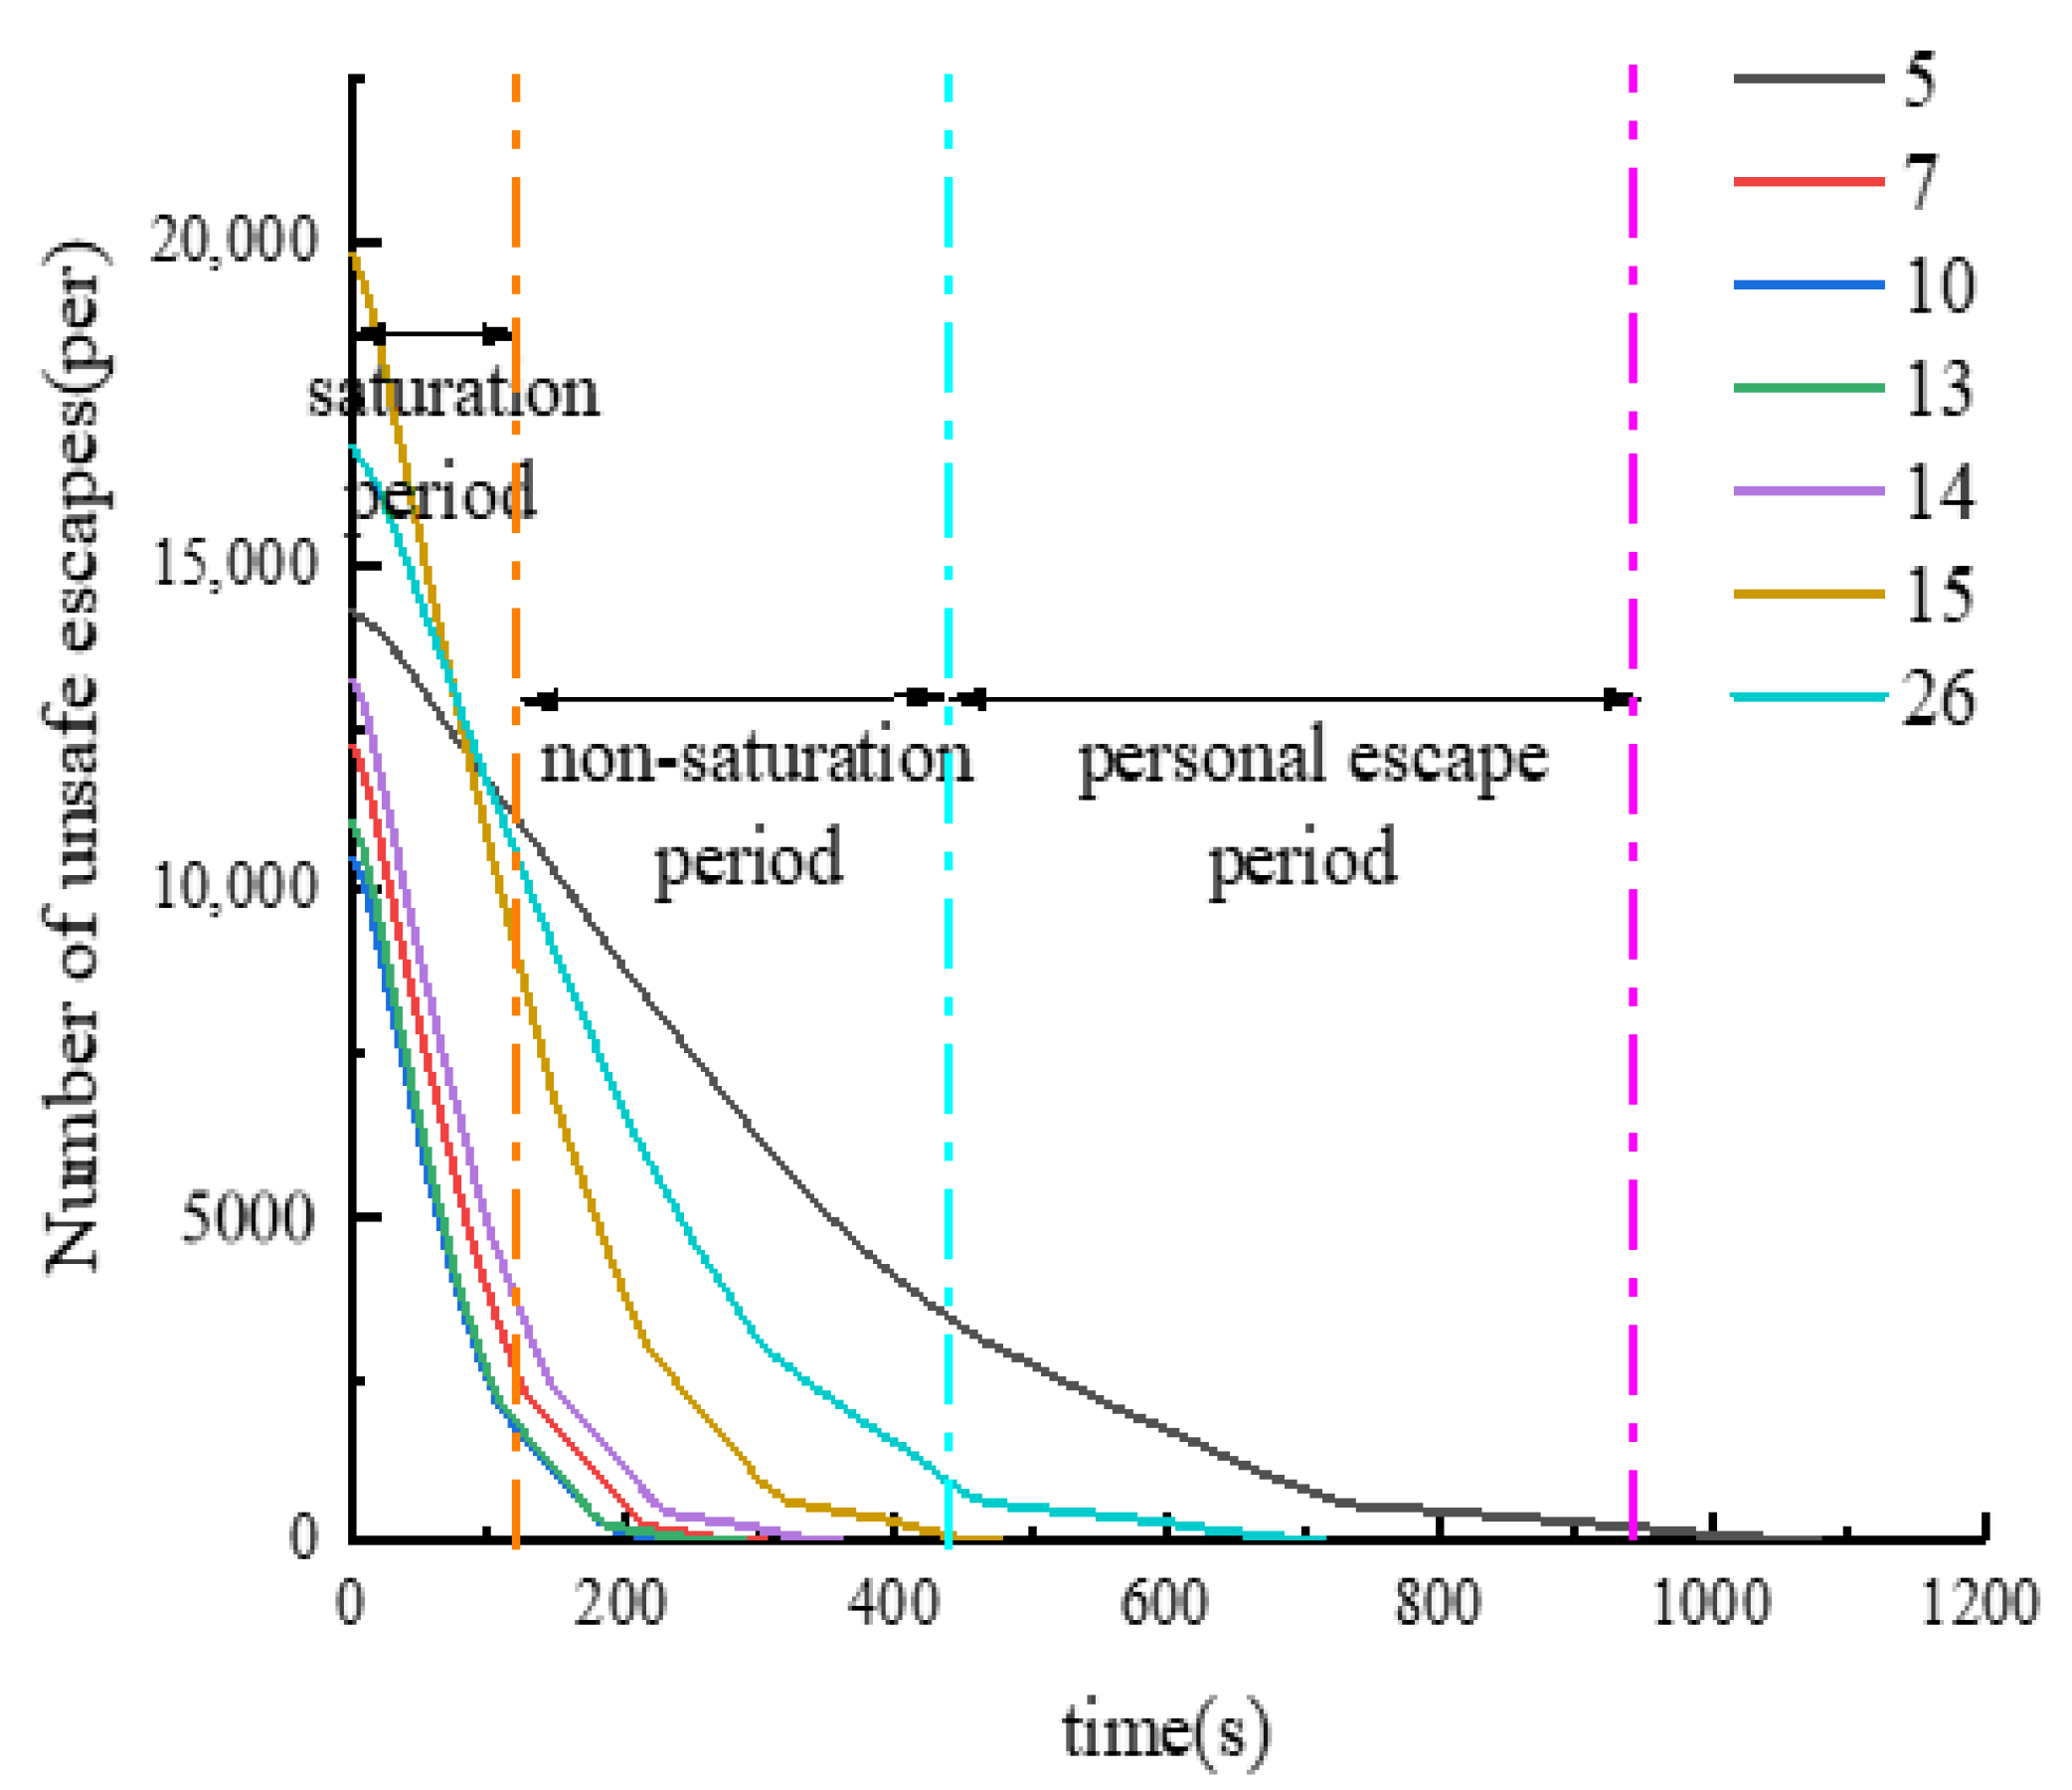
Figure 12 show that the upper limit of escape time is determined by the walking speed of the pedestrian. For example, the total number of pedestrians in sample 5 in
Figure 11 is 14,325, and the total escape time is as long as 1006.8 s, far exceeding the same group of samples. The single-person escape time accounts for more than half of the total time. The fundamental reason is that the walking speed is too slow. When pedestrians are distributed far from the safe passage, the time cost will increase significantly. In addition, due to the slower walking speed, the decreasing slope of the variation curve of sample 5 during the saturation period is also much lower than that of the same group. Although a slower walking speed can reduce stampede incidents caused by crowds, it will also greatly improve the safe evacuation time of all pedestrians. In order to further understand the pedestrian evacuation in the unsaturated period, samples 23 and 28 were randomly selected as examples to analyze the specific conditions of the 12 exits in the subway station during a safe evacuation, as shown in
Figure 15 and
Figure 16.
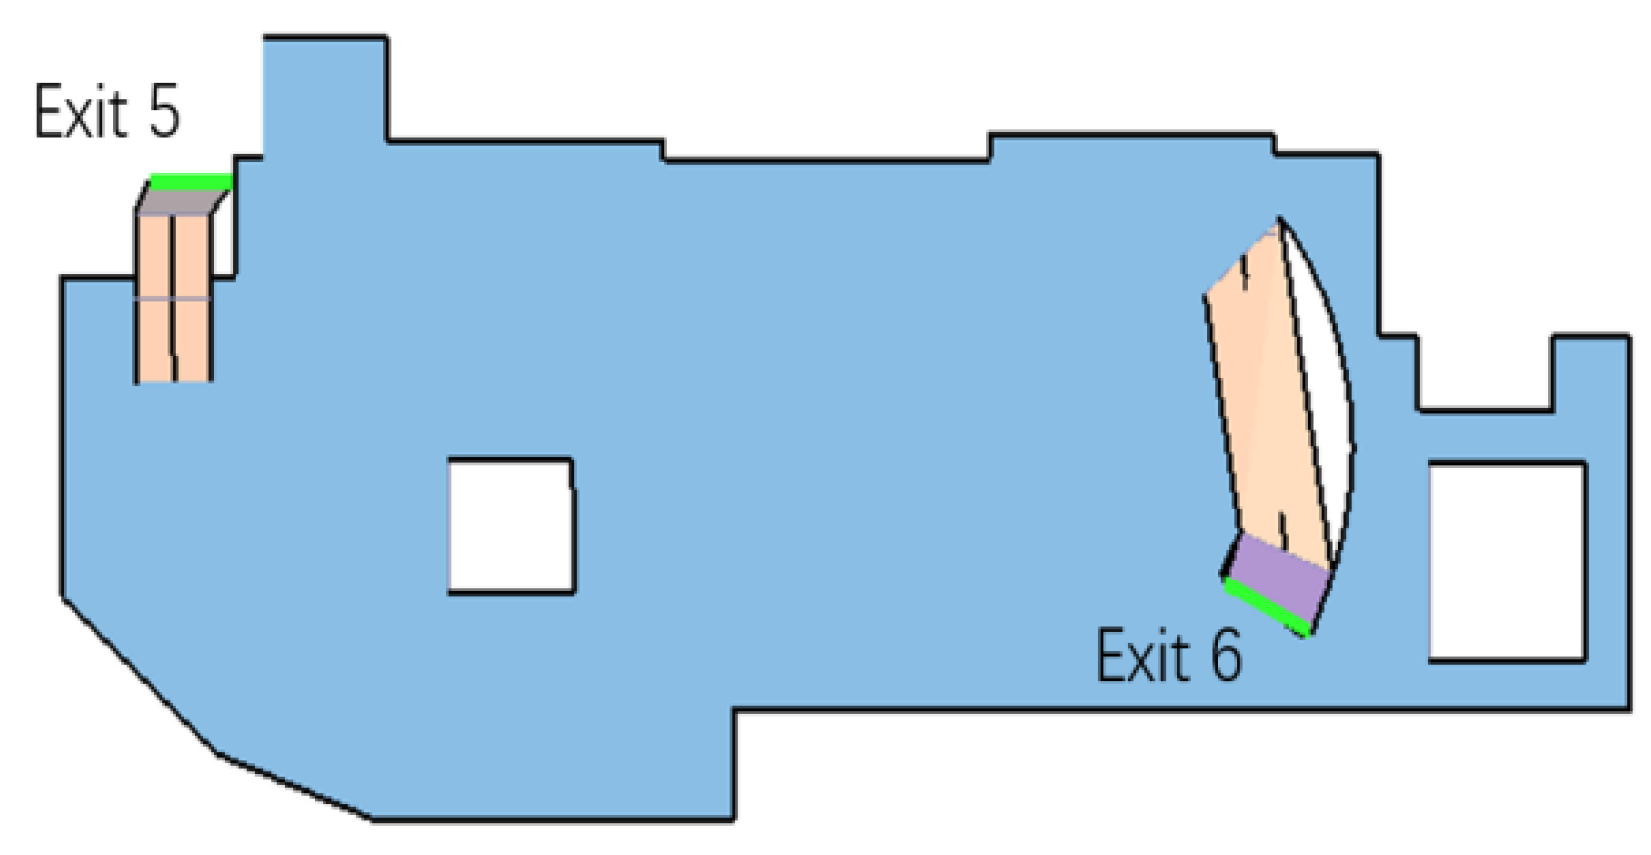
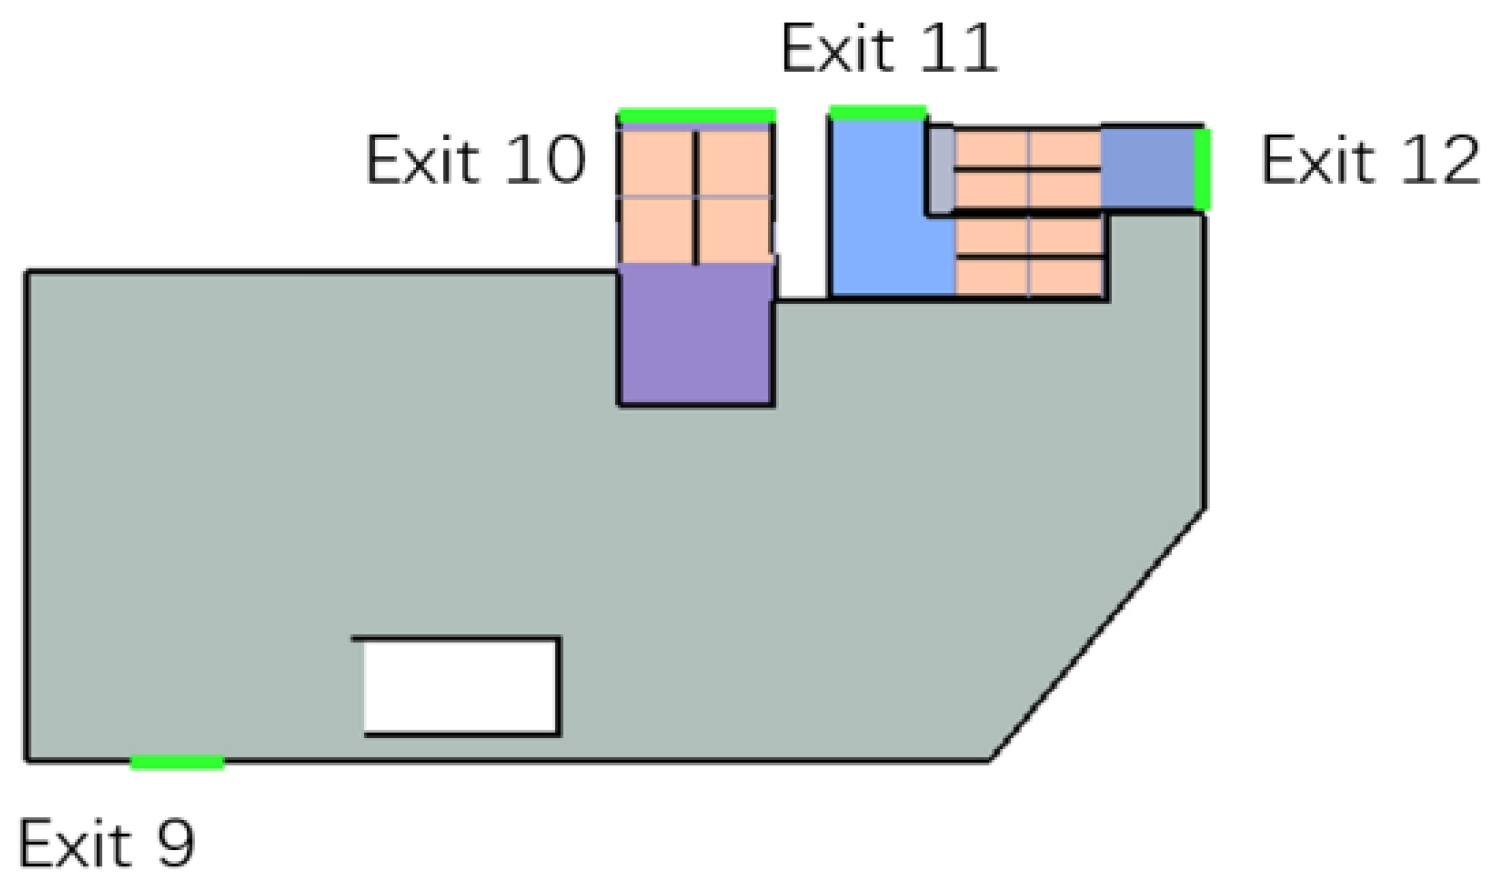
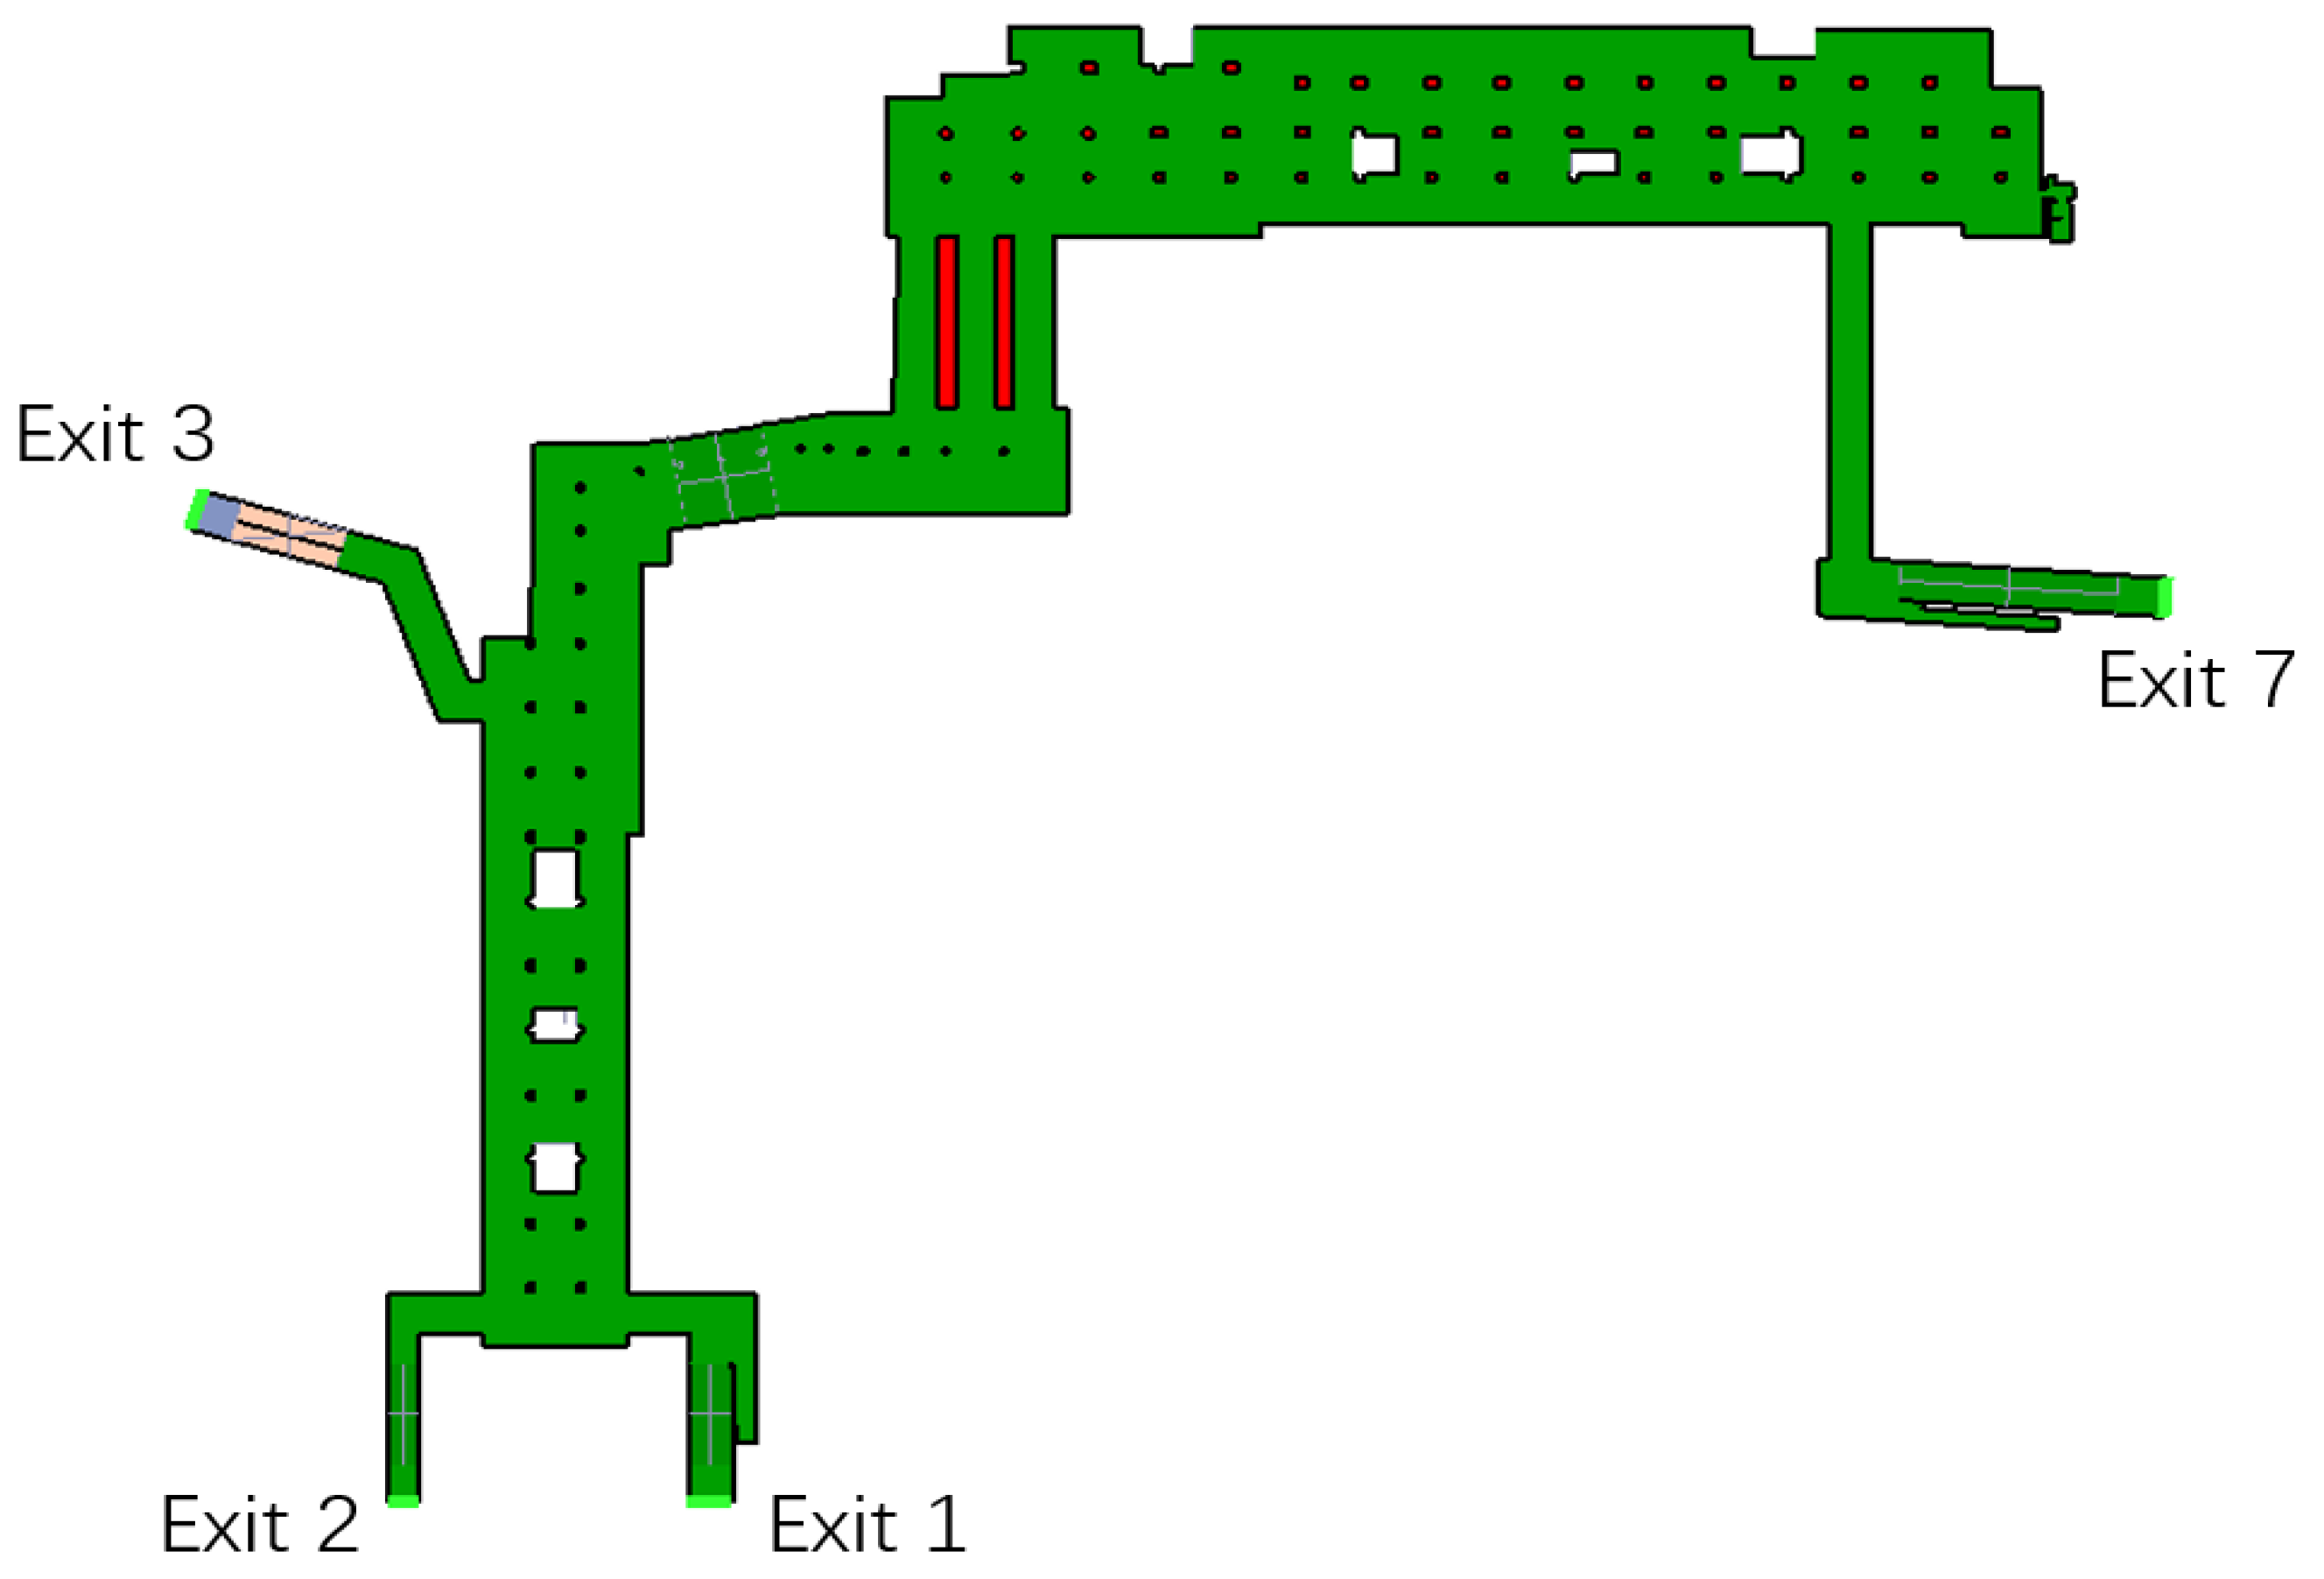
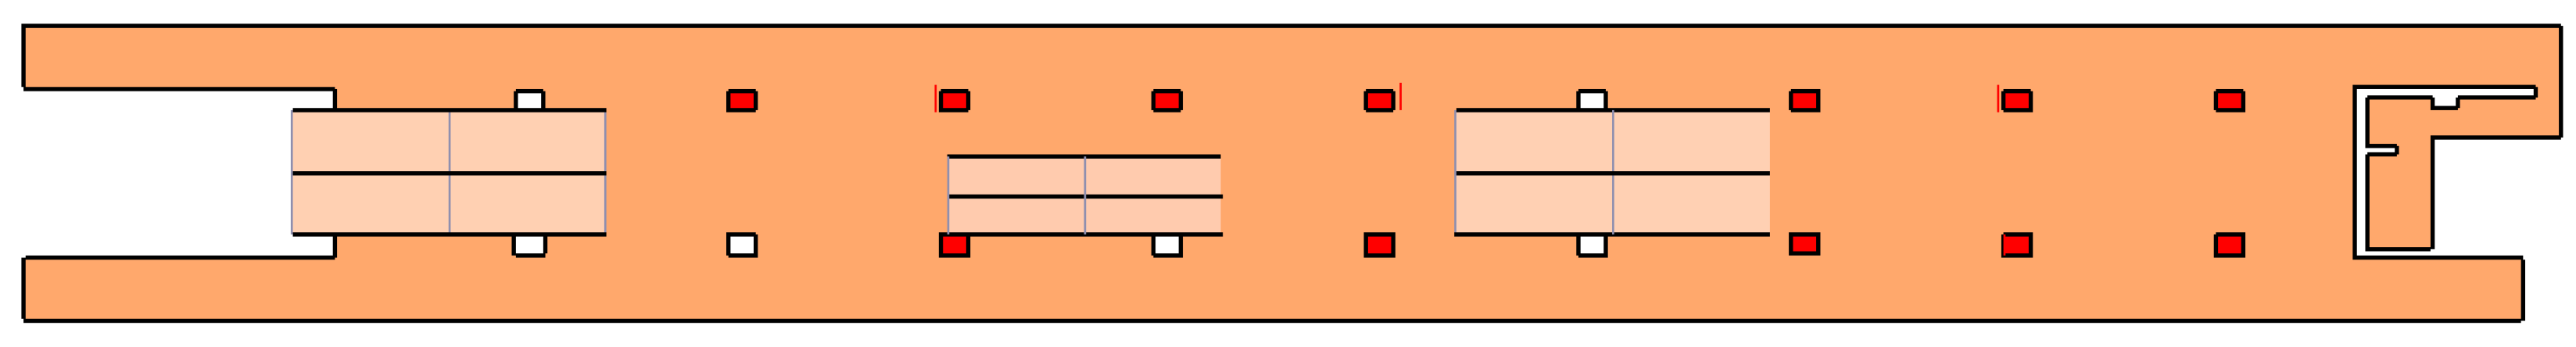
Figure 15 shows the evacuation of pedestrians from all exits in sample 23. The total evacuation time for this simulation is 563 s. Exit 5 has the largest number of escapees, and the maximum flow of pedestrians exceeds seven pedestrians. A total of 1592 pedestrians pass through, accounting for 23.3% of the total number of pedestrians. It is the most important exit in this evacuation process. In addition, it can be seen that all exits in the early evacuation period (0~50 s) were fully utilized. With the advancement of time, Exits 4, 9, 11, and 12 have been unmanned within 50 to 110 s, and these exits will be idle in subsequent moments, and no one will pass. Exits 1, 2, 3, 7, and 10 end at 110~260 s, Exits 5 and 6 end at 400~450 s, and Exit 8 (530~540) is the last exit of this evacuation simulation work.
For comparison only from working hours, Exit 8 is about four times that of Exits 4, 9, 11, and 12, but the number of pedestrians is much lower than that of Exit 5. This result is because Exit 8 is an emergency escape exit, and the stairwell of exit 8 is narrower than other exits. During the evacuation process, the maximum flow of pedestrians at Exit 8 was only two pedestrian/s, while the peak flow of pedestrians at the other exits was greater than seven pedestrian/s. Pedestrian herd behavior leads to serious uneven distribution of evacuation resources, and the narrow stairwells and congestion greatly prolong the safe escape time of pedestrians.
The evacuation curves of sample 23 (
Figure 15) and sample 28 (
Figure 16) were compared, and their overall trend was almost the same. Among them, Exits 5 and 6 are the most important exits for evacuation, and they basically undertake 40% of the evacuation of pedestrians. They are very important exits, and the smooth flow of these two exits should be ensured at all times. In addition, the evacuation guidance of Exits 4, 9, 11, and 12 should be strengthened so as to prolong the passage time of the four exits. Reasonable allocation of evacuation resources to ensure the maximum efficiency of evacuation. The specific parameters of the number of pedestrians passing through each exit of samples 23 and 28 and the passage time are shown in
Table 5 and
Table 6.
3.3. Calculation of Minimum Pedestrian Escape Speed Based on SVM
The above analysis shows that the number of pedestrians and walking speed are important factors affecting the overall evacuation time. In order to further study the internal criteria of whether pedestrians can escape safely during the evacuation, a support vector machine (SVM) [
33] is introduced for data analysis.
The data in
Table 3 and
Table 7 are brought into the SVM theory, the number of pedestrians evacuated and the walking speed factor are used as sample indicators, and the 330 s escape time in the safety specification is used as the critical time point. The escape time is greater than or equal to 330 s, which means that the escape failed. Otherwise, the escape is successful. See
Table 7 for all the statistics.
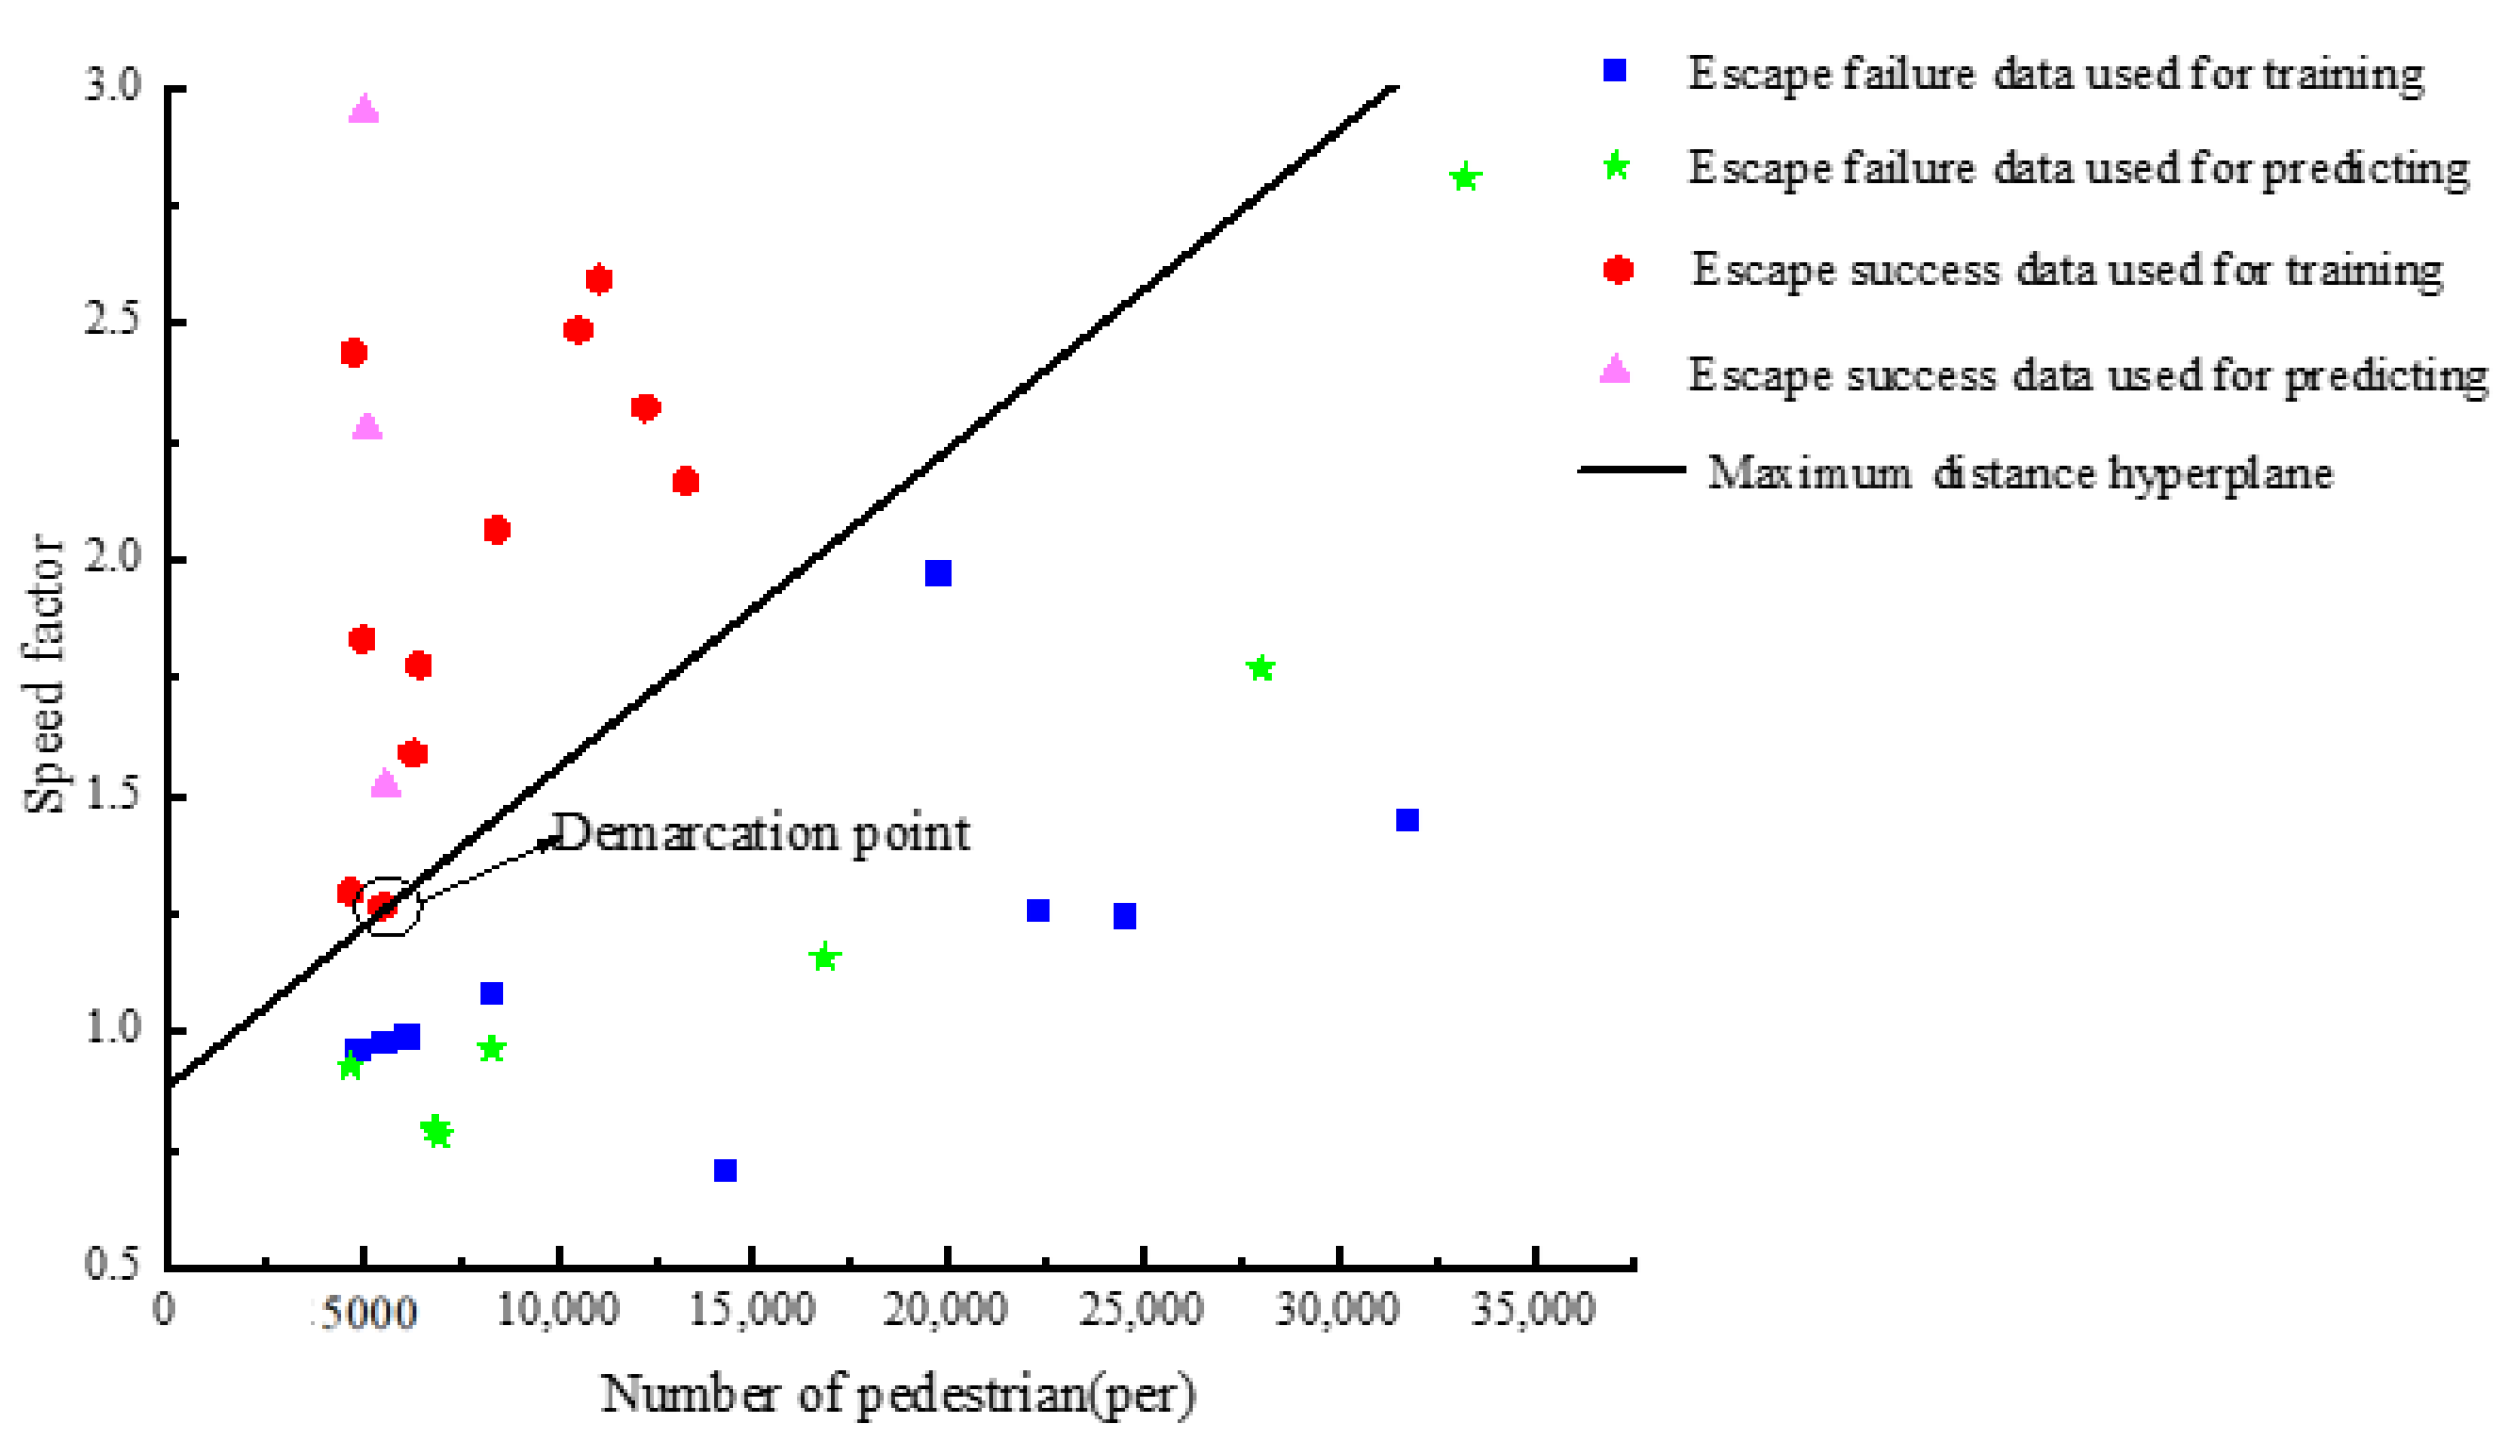
The first 20 groups of samples are used as the training data, and the last 10 groups are used as the test data (only the index data is included in the test data, and the actual data is not included). The available classification result graph is shown in
Figure 17, and the classification result data is shown in
Table 6. The final classification hyperplane result equation is solved as follows:
Among them, y represents the speed factor, and x represents the number of pedestrians. For evacuation simulations with different numbers of pedestrians and walking speed coefficients, if the result is greater than or equal to 0 after it is brought into formula (1), it is determined that the escape is successful, and all pedestrians in the subway can escape safely. If the result is less than 0, it is determined that the escape failed, the subway pedestrians cannot achieve all safe escape.
Table 8 and
Figure 17 show the classification results of this SVM, and the training samples simulated by this classification are all correctly divided. For the predicted samples, comparing the actual classification results in
Table 8, it can be seen that the predicted results are completely correct, and the prediction accuracy is 100%. Therefore, it can be considered that the separation hyperplane equation of this SVM is accurate and effective. That is, by inputting the number of pedestrians in the subway and the walking speed of the pedestrians, it can be determined whether all the pedestrians in the subway can escape within the safety specification time by relying on the Formula (1).
Observing Formula (1), we can see that when x = 1, y is almost equal to 0.8828. The physical meaning of this result is: When there is only one person in the subway station, and the position of the person satisfies the random distribution, then the minimum walking speed to ensure that he can escape successfully is 0.8828 × 1.035 m/s (the walking speed of the old man) = 0.9137 m/s.
In this paper, the basic pedestrian speed is set as 5 km/h. By setting the speed coefficient of 0.5~3, the actual range of pedestrian moving speed will be expanded to 0.52 m/s (1.035 m/s × 0.5)~4.14 m/s (1.38 ms × 3), and the minimum escape speed can be solved in this range. The basic speed of the pedestrian itself is not critical because the speed factor will make the speed range of the pedestrian include the minimum escape speed, and then the SVM can be solved. For example, set the pedestrian’s base speed to be 1 m/s and the actual escape speed is 0.9 m/s, then the speed factor calculated by the SVM is 0.9. Set the pedestrian base speed to 0.5 m/s, and the actual escape speed is 0.9 m/s, then the velocity coefficient calculated by SVM is 1.8. Therefore, the basic speed of pedestrians is not critical. As long as the speed range includes the minimum escape speed, the speed factor will change accordingly, and the final calculated minimum escape speed will be basically the same.
Taking the escape situation of normal pedestrians as an example, assuming that the walking speed factor is set to 1.5. That is, the pedestrians in the subway station escape at a walking speed of 1.5 times the usual walking speed, then the Formula (1) shows that the maximum number of pedestrians carrying the Nanning Mingxiu Road Station is:
In daily traffic, the number of pedestrians in the Mingxiu Road station should be less than 9127 to ensure the safe evacuation of all pedestrians in an emergency. In case of heavy rain or other extreme weather, the walking speed of pedestrians should be smaller, and the specific walking speed should be analyzed according to the actual situation.
3.4. Calculation of Critical Water Level Height Based on Minimum Escape Speed
In
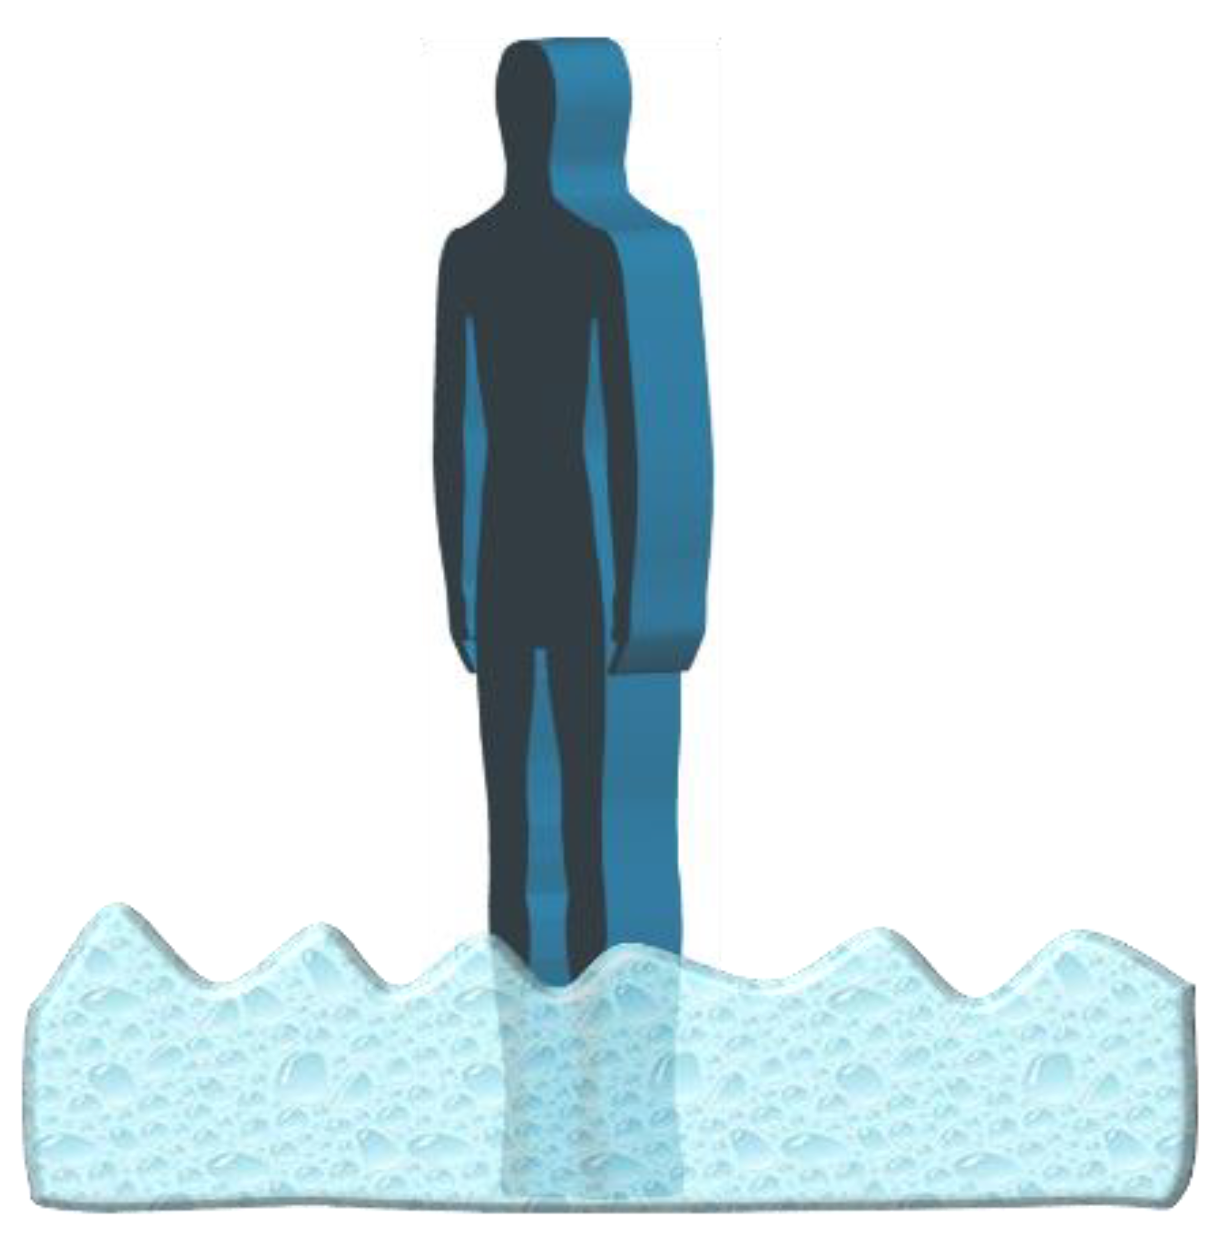
Section 3.3, the SVM model was used to solve the minimum escape speed of pedestrians as 0.914 m/s. However, there will be a flood in the subway station due to a rainstorm (
Figure 18), and when the flood height exceeds the critical value, the resistance and buoyancy brought by the flood will make people unable to reach the minimum escape speed of 0.914 m/s, resulting in the failure of escape.
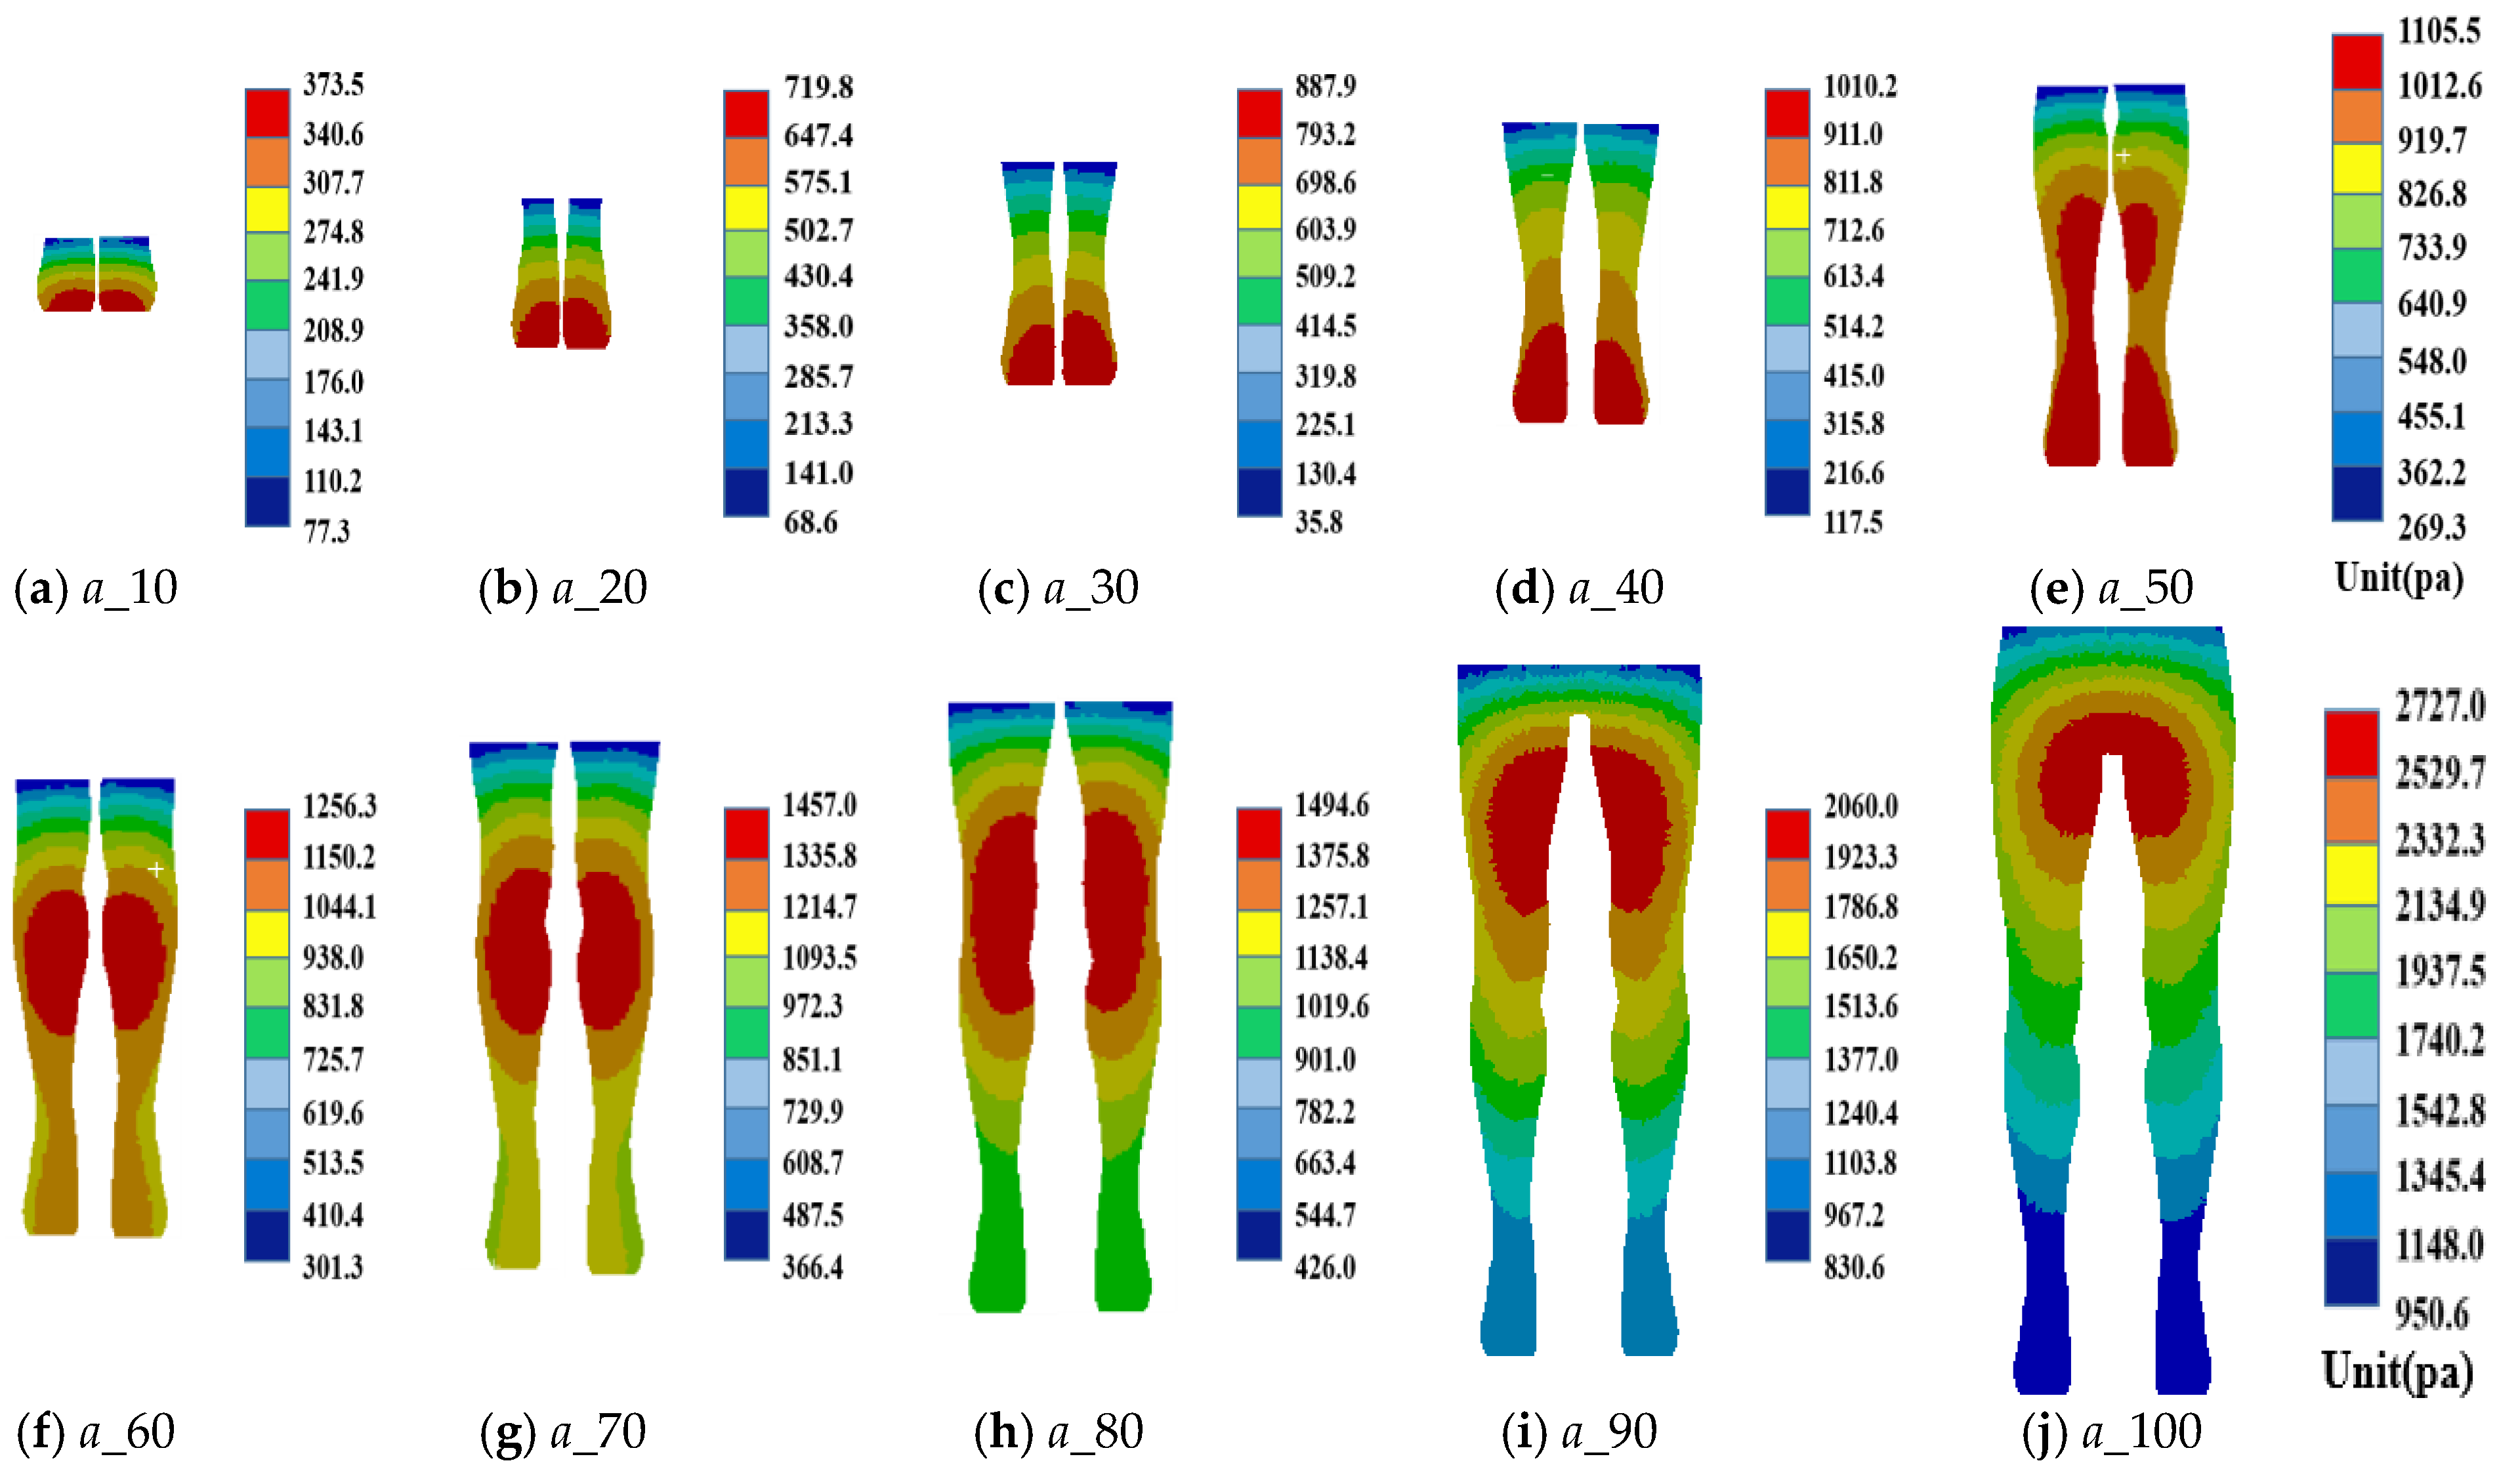
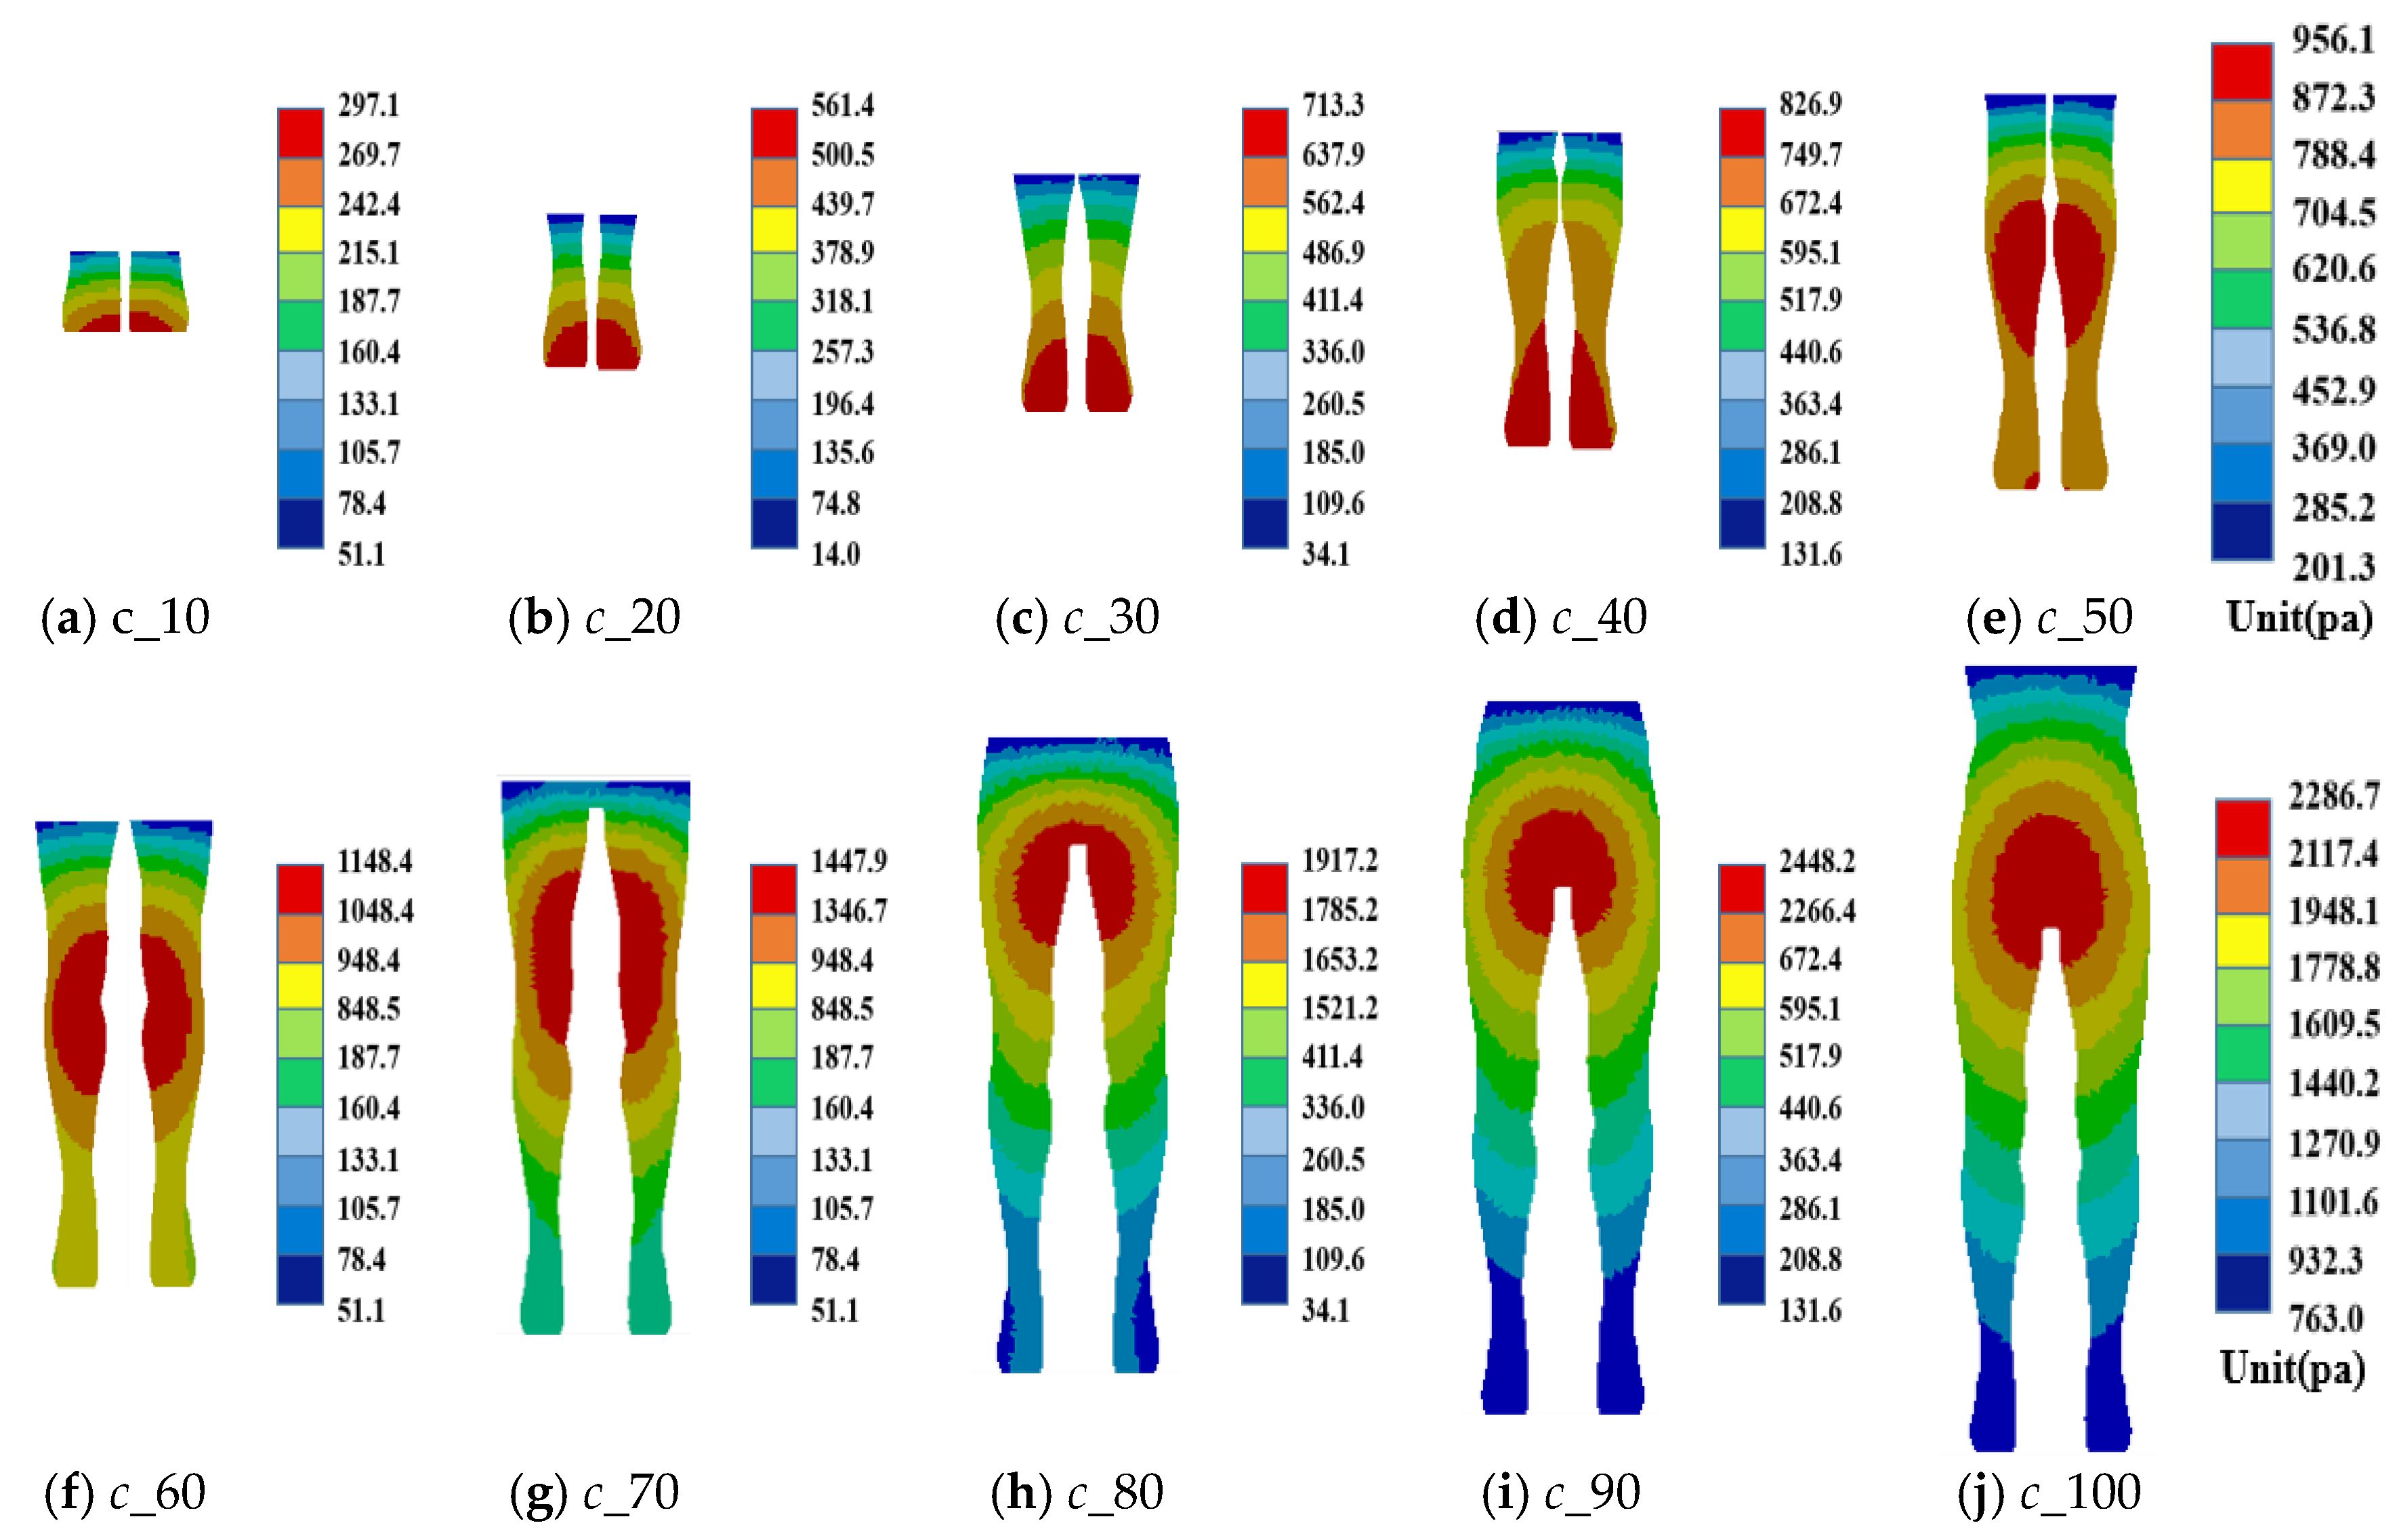
Therefore, when the flood height exceeds the critical value, the walking speed of pedestrians will not reach 0.914 m/s, so the escape will fail. In order to accurately solve the critical value of the height of the flood, a 1:1 contour height model was constructed for all groups (adult, child, elder). The model height was consistent with the simulated height in
Section 3 (adult = 173 cm, child = 140 cm, and the elder = 161 cm). The flood height is set to 10 cm, 20 cm, 30 cm, 40 cm, 50 cm, 60 cm, 70 cm, 80 cm, 90 cm, and 100 cm. Since pedestrians keep relative movement with the flood when moving, the pedestrian velocity = 0.914 m/s and the flood velocity = 0 m/s can be converted to the flood velocity = 0.914 m/s and the pedestrian velocity = 0 m/s so as to simulate the impact resistance of flood flow to pedestrians at different flood heights. Dynamic flood pressure of all groups is shown in
Figure 19,
Figure 20 and
Figure 21, and dynamic flood resistance is shown in
Table 9.
The calculation formula of friction between pedestrians and the ground in flood is as follows:
F represents the friction between the pedestrian and the ground,
f represents the friction factor between the pedestrian and the ground,
M represents the mass of the pedestrian,
g represents the acceleration of gravity (9.8 m/s
2),
W represents the buoyancy of the pedestrian in flood, and the specific expression of buoyancy
W is:
ρ represents the density of the liquid, and
V represents the volume of the flood displaced by the pedestrian standing in it (
Table 10). As for
M, the simplified BMI index of 21.5 [
34] was used as the calculation. Based on the average height in
Section 3, the standard weight of each group was calculated as follows: adult = 64.3 kg, child = 42.2 kg, and the elder = 55.7 kg.
BMI stands for pedestrian mass index, H is the height of the pedestrian, M is the mass of the pedestrian.
The drainage volume data in
Table 10, adults = 64.3 kg, children = 42.2 kg, elderly = 55.7 kg,
g = 9.8 m/s
2,
ρ = 1000 kg/m3,
f = 0.5 [
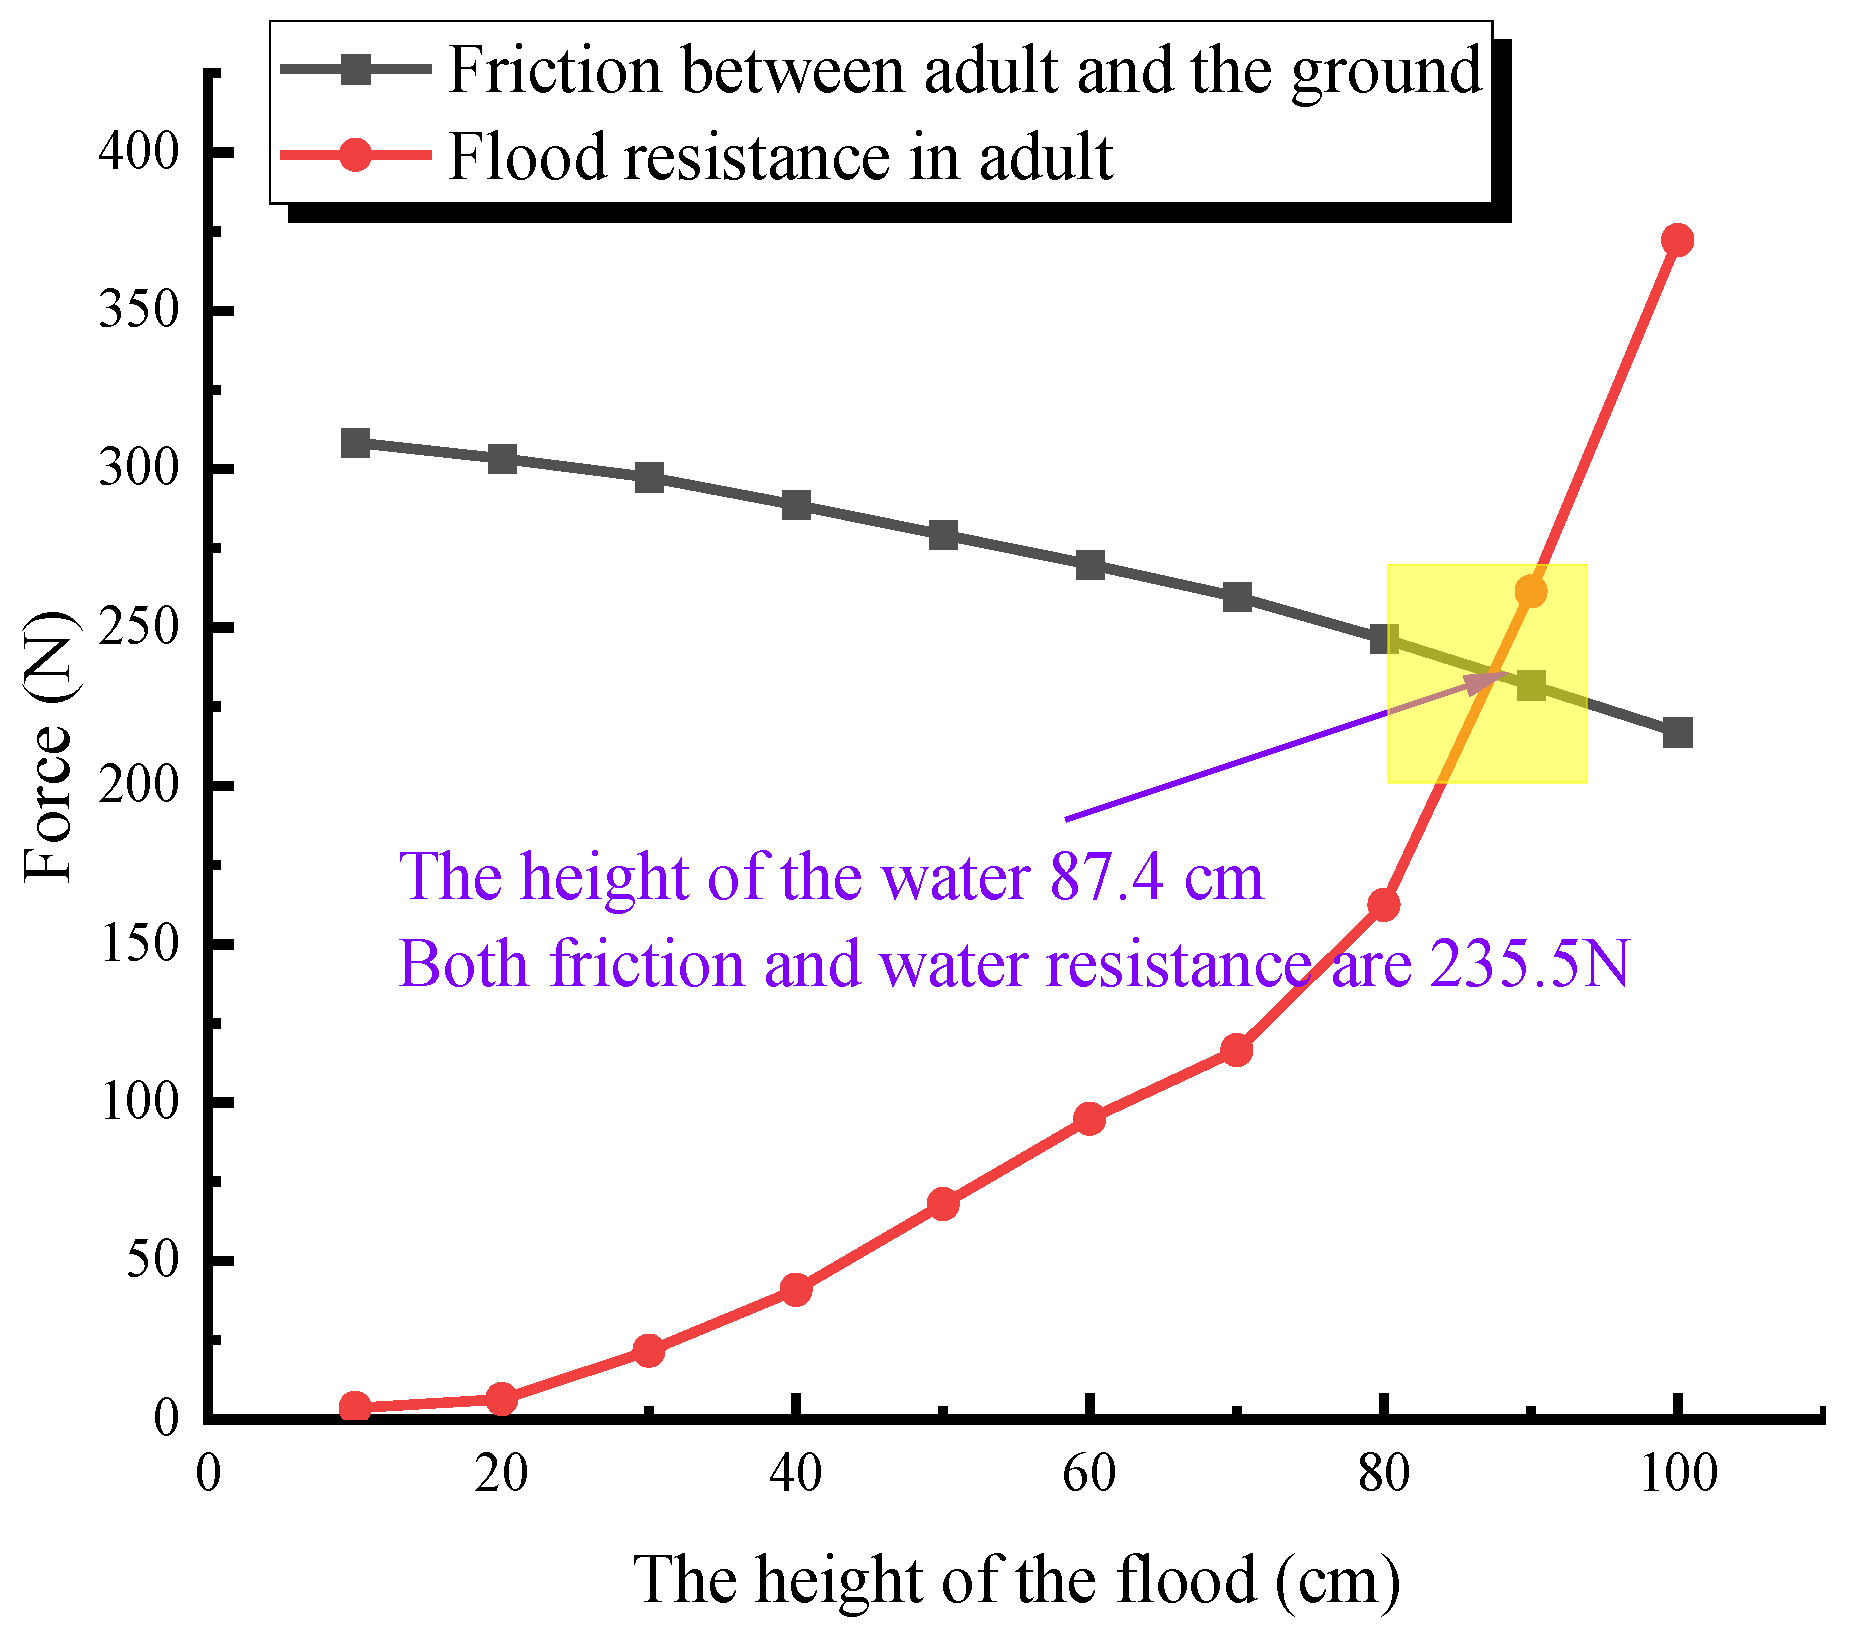
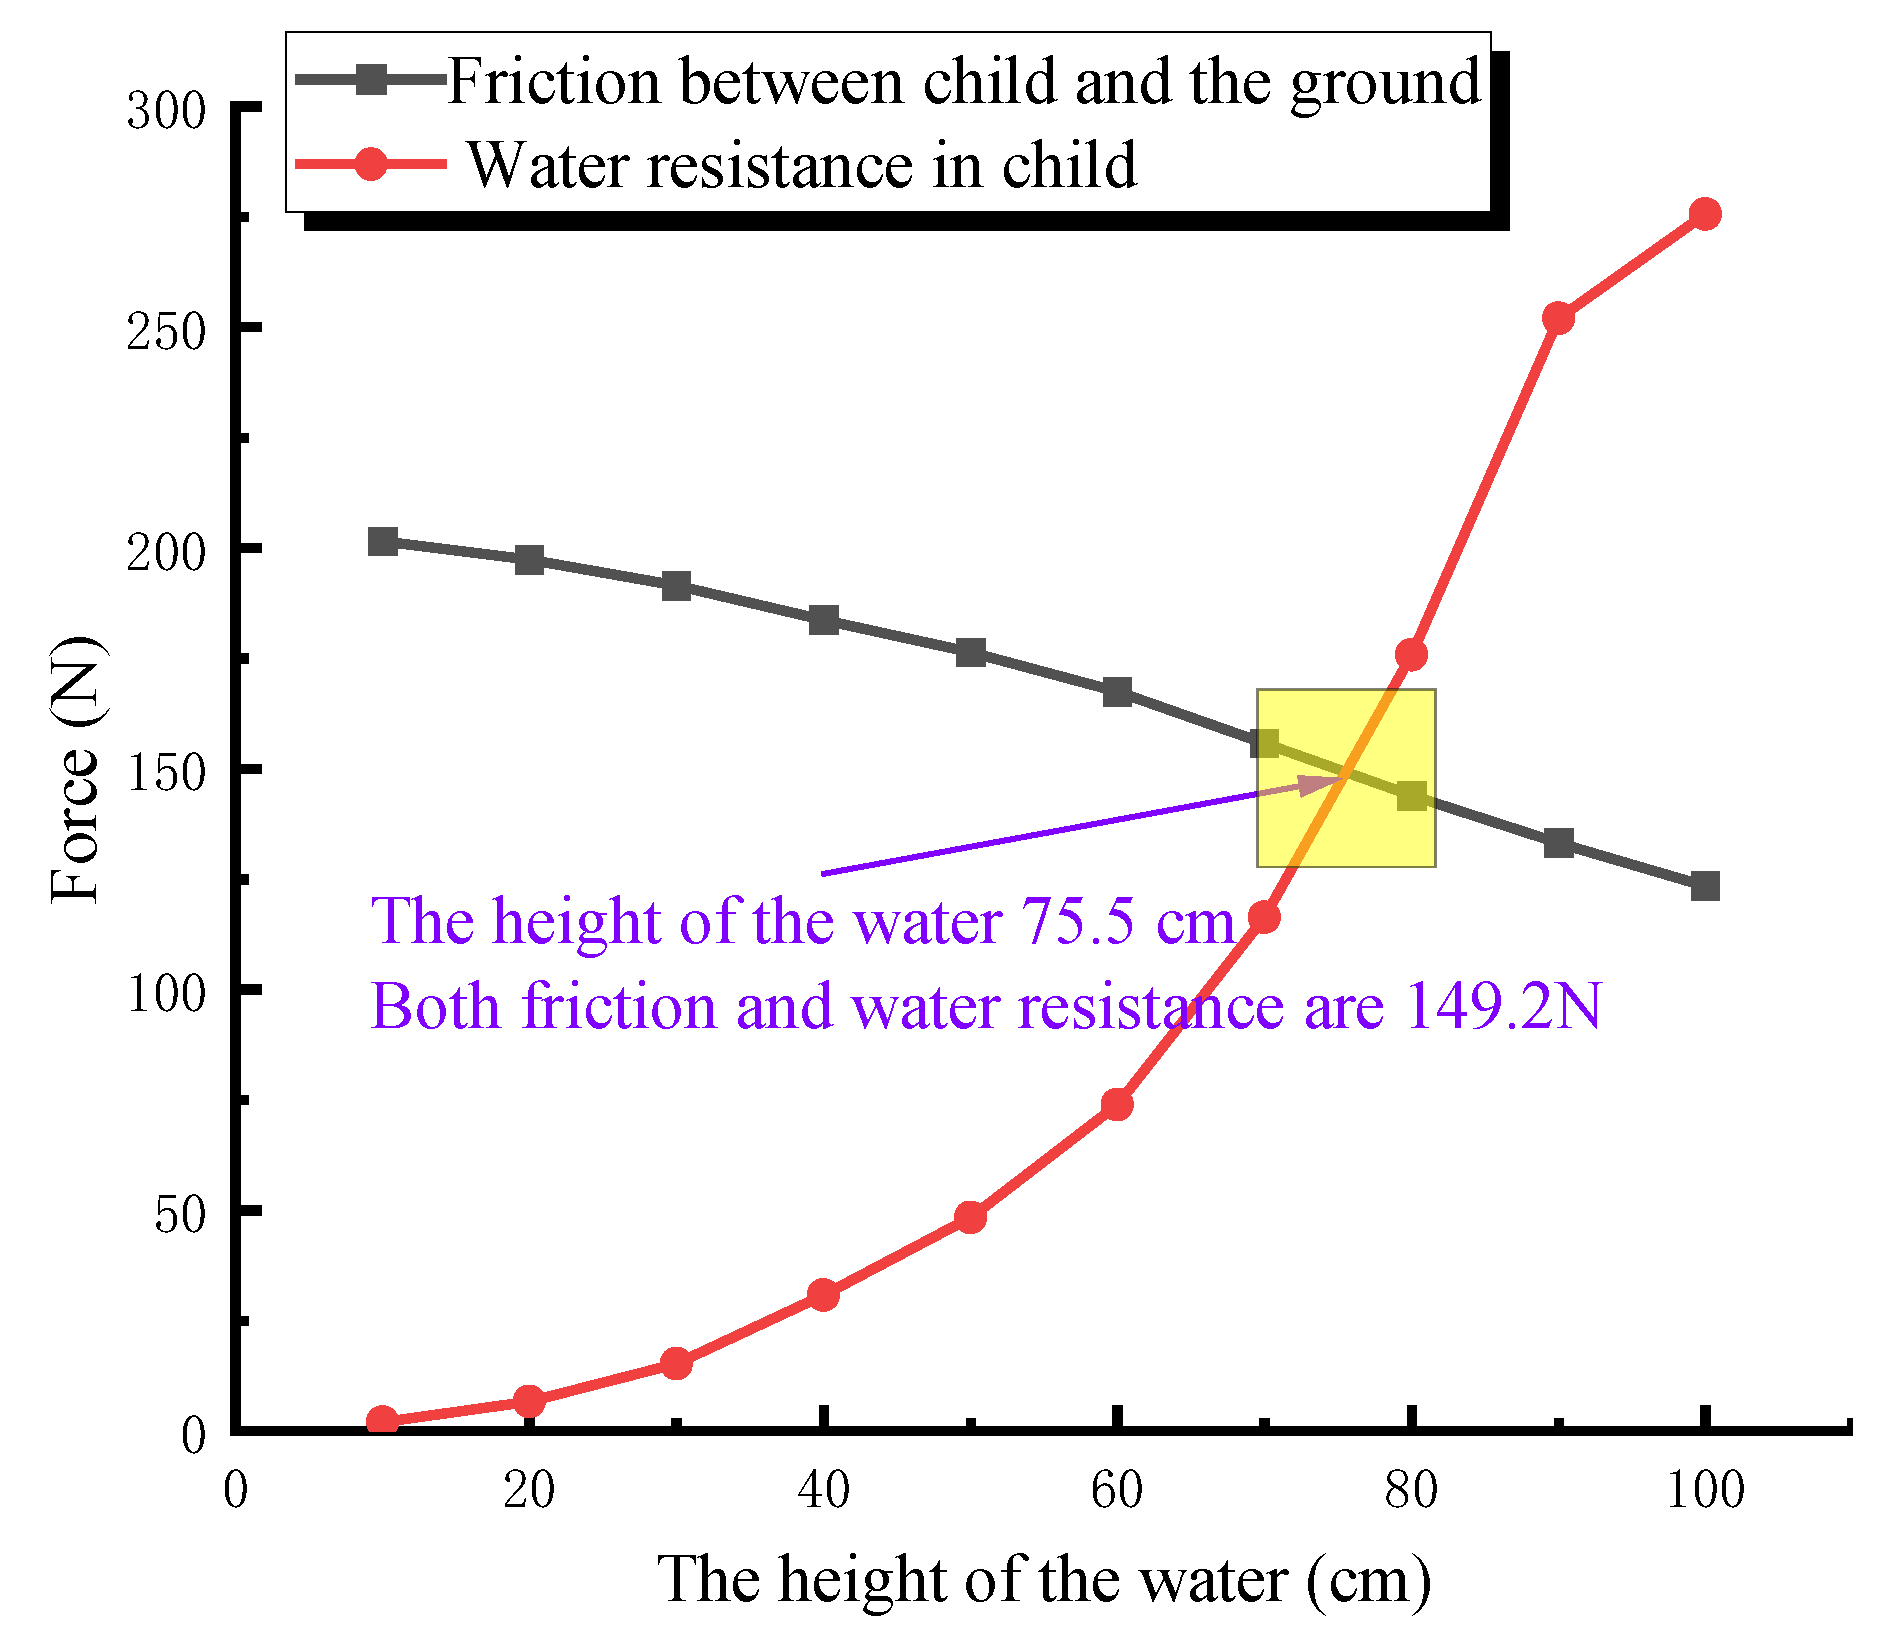
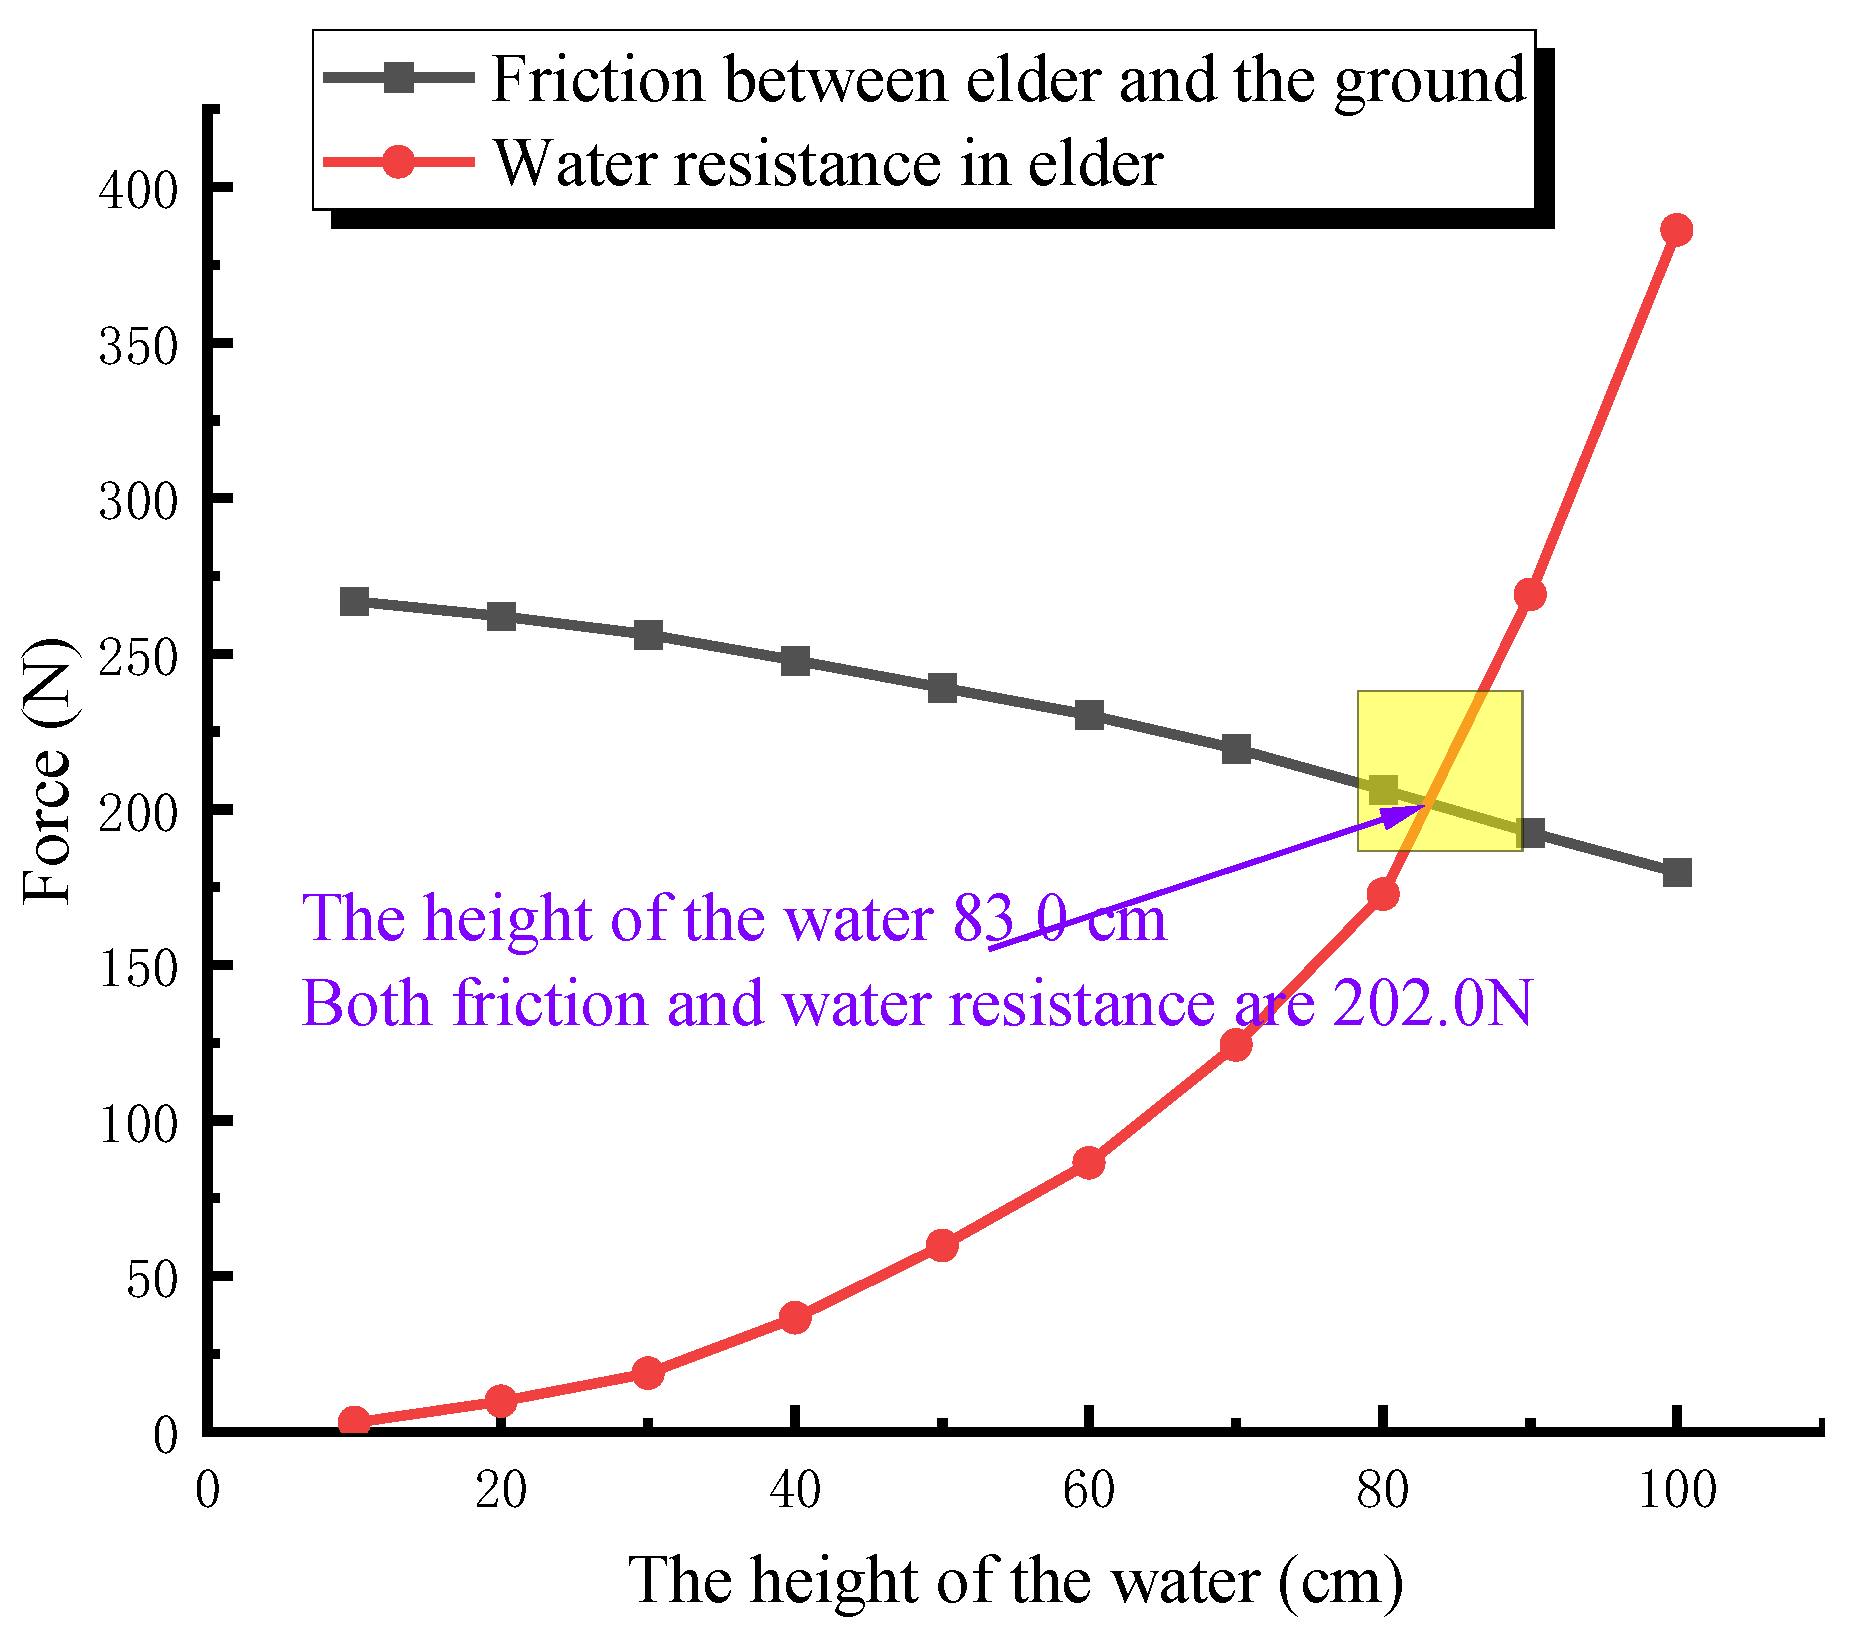
35], are substituted into Equations (3) and (4). The friction force between the pedestrian and the ground at different flood heights is calculated and compared with the flood resistance of the pedestrian.
Table 11 shows the comparison results, and
Figure 22,
Figure 23 and
Figure 24 show the comparison curve.
The intersection of curves in
Figure 22,
Figure 23 and
Figure 24 was calculated, and the critical flood heights for adults, children, and the elder to escape were 87.4 cm,75.5 cm, and 83.0 cm, respectively. For an adult, when the height of the flood in the subway is greater than 87.4 cm, the walking speed of adults cannot reach 0.914 m/s, so the safety escape cannot be completed within the specified 330 s.


 and
and 


