Article

Irrigation Management Based on Theoretical Requirements Reduces Water Consumption in Apple (Malus domestica Borkh.) Orchards without Effects on Fruit Yield and Components

1
Department of Water Resources, School of Agricultural Engineering, University of Concepción, Chillán 3812120, Chile
2
Water Research Center for Agriculture and Mining (CRHIAM), Chillán 3812120, Chile
3
Department of Plant Production, School of Agronomy, University of Concepción, Chillán 3812120, Chile
*
Author to whom correspondence should be addressed.
Water 2022, 14(21), 3441; https://doi.org/10.3390/w14213441
Submission received: 1 October 2022 / Revised: 25 October 2022 / Accepted: 27 October 2022 / Published: 29 October 2022

Abstract

:
This research examines the effects of two irrigation strategies on water use efficiency and fruit yield components of ‘Royal Gala’ and ‘Brookfield Gala’ apple orchards in south-central Chile. The study was carried out during the 2008–2009 and 2009–2010 growing seasons at two sites. A randomized block experimental design was established with two water application treatments: theoretical volume required by the plant (T1) and farm protocol (T2). Soil water content, plant water potential and yield components were evaluated. The soil water content in T2 was near field capacity while T1 was between the permanent wilting point and field capacity for both seasons and varieties. With T1, the seasonal volume applied was 21 to 28% less compared to T2, with season savings of 1600 m3 ha−1. No effect on plant water potential was observed. In ‘Royal Gala’ the lower volume applied in T1 did not lead to significant differences in fruit diameter, weight, or yield in either season as compared to T2. In ‘Brookfield Gala’, yield during the 2008–2009 season increased significantly, by 22.9% in treatment T1, and in the 2009–2010 season, significant reductions (p < 0.05) in fruit diameter (5.3%) and weight (12.9%) were observed in T2. Productivity per volume of applied water in T1 was 32% to 56% greater than that obtained with T2. The results show the effectiveness of the irrigation strategy considering the theoretical volume of water required by the plant.

1. Introduction

In the last decade, an extension of drought periods and decrease in precipitation volumes have been determining factors in Chile being declared a country that is highly vulnerable to climate change [1]. Some researchers have projected an intensification of this phenomenon in the coming years, which would have a negative impact on water availability in the south-central zone, whether for storage or direct use [2].
In Chile, activities linked to agriculture account for around 70% of freshwater consumption [3], and in the south-central zone, apples are second among fruit trees in plantation area and the main fruit tree in terms of production [4]. Among red apples, the ‘Brookfield Gala’ and ‘Royal Gala’ cultivars are major crops [5].
Amid this backdrop, reports published by governmental and non-governmental entities state the importance of improving irrigation infrastructure and optimizing current techniques [6]. However, in 2019, 29.5% of farmers who harvested red apples used traditional, inefficient irrigation methods [4]. Callejas et al. [7] estimate that water consumption per hectare could decrease by up to 50% if other techniques such as drip or microjet irrigation are implemented and 40% more if irrigation techniques that account for climate and crop factors in water application are implemented, without affecting fruit quality.
Due the shortage of water resources, to reduce the volumes of irrigation water used in agriculture makes it necessary to implement more efficient irrigation strategies in apple trees [8]. Localized irrigation through the application of a theoretical water volume improves water replacement and agronomic practices. This controlled method, under suitable design, operation, and management conditions, allows high-quality products to be obtained and the profitability of the agricultural industry to be increased [9].
There is limited information on research that has assessed long-term water supply management options at different levels of scarcity for apple orchards [10]. In the literature there are various successful cases of studies that have managed to reduce water consumption and increase productivity after incorporating different irrigation strategies and technical variables into the estimation of fruit tree water demand. In fact, Naor [11] demonstrated the importance of crop load and irrigation relationships on apples; Francaviglia et al. [12] evaluated the effect of partial rootzone drying irrigation on two apple cultivars under Mediterranean conditions; Du et al. [13] studied alternate partial root-zone irrigation and water use efficiency relationships; and Liao et al. [14] analyzed the combination of different kind of mulching and irrigation deficit in an apple commercial orchard. In the Central Valley of Chile, Lecaros et al. [15] evaluated four irrigation options in commercial ‘Brookfield Gala’ apple orchards, grafted on M.9 dwarf rootstock, determining the water application based on theoretical water demand estimates and the control of soil moisture pattern. They found that different drip irrigation treatments induced different soil wetted volumes and extraction patterns, and produced significant differences in fruit yield and quality on two different soil types: a clay-loam soil irrigated three times per week, and a stony loam soil irrigated daily.
Küçükyumuk et al. [16] studied the effects of regulated deficit irrigation over three years in 10-year-old ‘Braeburn’ apple trees grafted on M.9 dwarfing rootstock. Six irrigation treatments were studied, one of which did not involve an irrigation deficit, another that involved a continuous deficit throughout the season, and four others in which the irrigation deficit was applied in certain phenological stages. The authors concluded that the greatest fruit yield was obtained in the treatment with an irrigation deficit between 40 and 70 days after full bloom. This result was maintained over all three seasons and allowed water savings of 13% to 15%. Meanwhile, Küçükyumuk et al. [17] assessed four irrigation strategies with water applications based on crop coefficient (Kc) variations in 20-year-old ‘Starkrimson Delicious’ apple trees. They found that fruit size and weight behavior relative to the applied water quantity varied between the two seasons. In the first season, the greatest fruit weight and size were obtained with the treatment consisting of the second greatest applied water volume (Kc equal to 1.00), while in the second season, the best results were achieved with the greatest applied water volume (Kc equal to 1.25).
Thus, various studies indicate the importance of carrying out long-term assessments that allow the cumulative effects of irrigation regimes to be understood [8,18].
The objective of this work was to analyze an irrigation management methodology based on the estimation of a theoretical water volume required by two commercial apple orchards and compare it with a protocol based on the application of a fixed water depth or with visual and tactile estimation of soil moisture, in terms of applied water volume, plant water status, and yield components (kg plant−1, fruit diameter and weight) over two continuous growing seasons.

2. Materials and Methods

2.1. Study Site and Soil and Climatic Conditions

The experiment was carried out during the 2008–2009 and 2009–2010 growing seasons at two commercial orchards: a ‘Royal Gala’ apple orchard located southwest of Longaví, Maule Region, Chile, and a ‘Brookfield Gala’ apple orchard located in Negrete Commune, Biobío Region, Chile (Figure 1).
The ‘Royal Gala’ apple trees were established in 2000 (10 years old), grafted on M.26 rootstock and planted with a between-row spacing of 4.0 m and a within-row distance between plants of 1.5 m. The trees have a north-west orientation, trained to a central-axis system with free lateral branches in a horizontal position. The soil consisted of a mixture with volcanic ash (Inceptisol), with a surface slope of about 0.5% to the west, a very light surface stoniness, a loamy texture (ISSS soil texture classification) on the surface, and varying to loamy/sandy at depth, resting on an alluvial substrate with stones and rocks [19]. The soil moisture content at field capacity varies between 0.36 m3 m−3 on the surface and 0.37 m3 m−3 at a depth of 0.9 m, and the permanent wilting point is between 0.20 m3 m−3 and 0.22 m3 m−3. The prevailing climate of the area is temperate Mediterranean, with hot summers and cool, wet winters [20]. In the two study seasons the weather was characterized by a mean annual precipitation of 779 mm year−1 and a pan evaporation of 1297 mm year−1.
The ‘Brookfield Gala’ apple trees were established in 2006 (4 years old), grafted on M.9 dwarfing rootstock and planted with a 3.5 m between-row spacing of 3.5 m and a within-row distance between plants of 1.2 m. The soil conditions were low-lying alluvial, consisting of deep sands of mixed volcanic composition (Palexeralf and Inceptisol complex), with a surface slope of about 0.6% to the south and a loamy-clayey-sandy texture down to a depth of 0.9 m and loamy-sandy in the 0.9–1.2-m stratum. Field capacity varies between 0.44 m3 m−3 and 0.39 m3 m−3 and the permanent wilting point varies between 0.20 m3 m−3 and 0.22 m3 m−3 from the surface to a depth of 1.2 m. The climate of the area presents characteristics of transition between Mediterranean and wet temperate. Mean annual precipitation in this area is 1091 mm year−1, with an annual reference evapotranspiration of 1175 mm year−1 [20].
The physical soil parameters (field capacity and permanent wilting point) were determined using the pressure chamber method [21] at retention energy values of 10 J kg−1 (La Capilla Orchard) or 33 J kg−1 (Santa Eugenia Orchard) and 1500 J kg−1, respectively. The texture analysis was performed using the Bouyoucos hydrometer method [22] in accordance with the international system (SI) for three soil strata (0–30, 30–60, and 60–90 cm) at Santa Eugenia Orchard and four soil strata (0–30, 30–60, 60–90, and 90–120 cm) at La Capilla Orchard.

2.2. Experimental Design

For each cultivar and season, two irrigation treatments were assessed: irrigation scheduled in accordance with the theoretical water volume required by the plant (T1) and an existing producer-managed approach in accordance with an apple grower protocol (T2). The experiment had a randomized block design with four replicates and 6–7 trees per replicate.

2.3. Irrigation Methods

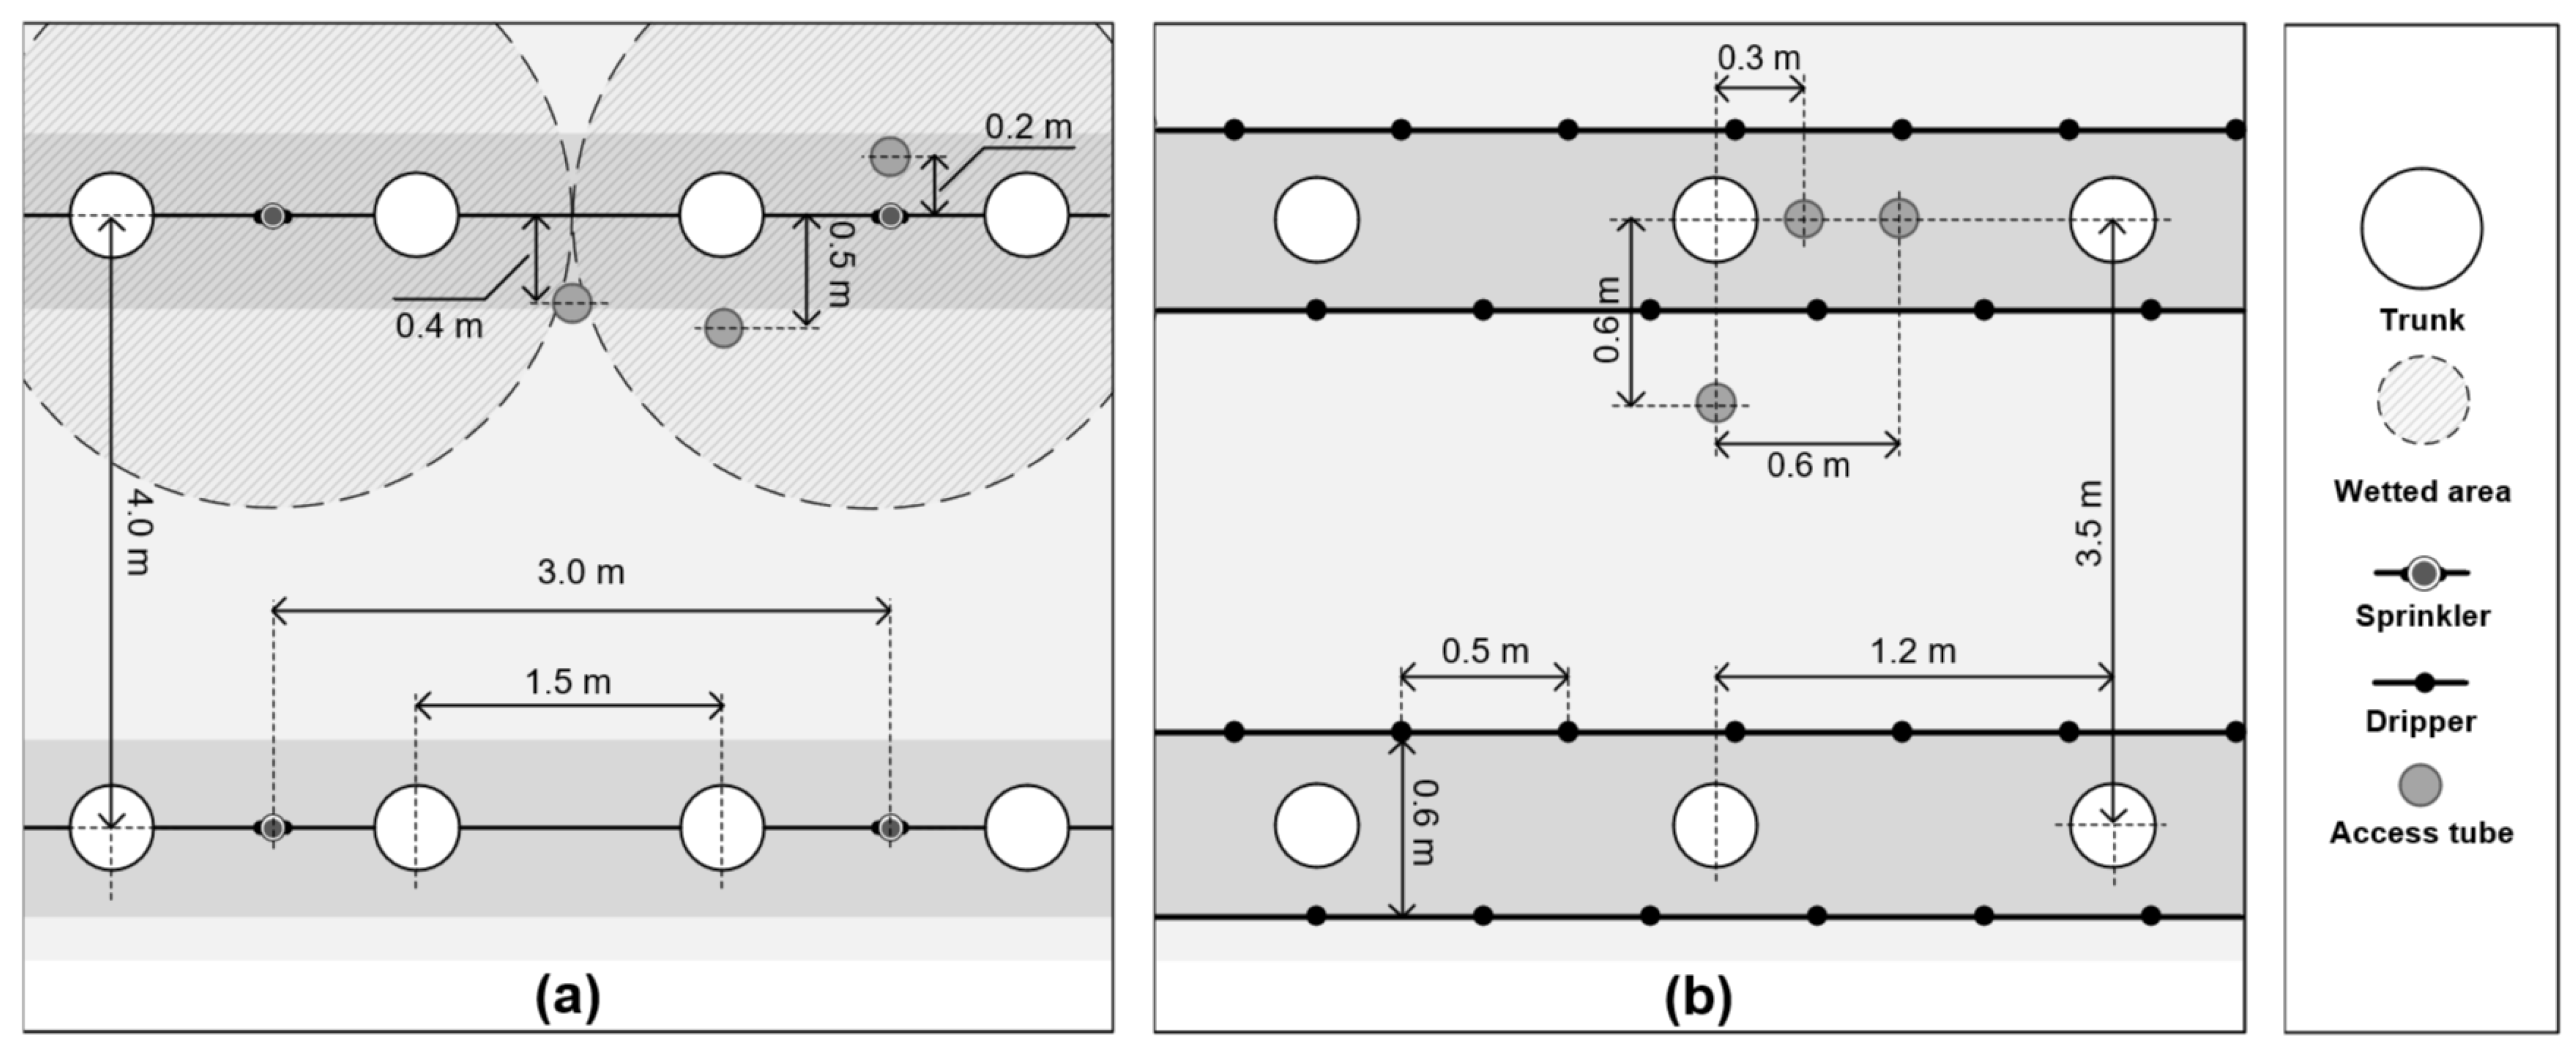
The ‘Royal Gala’ apple trees were irrigated by the selected irrigation microjet system. The emitters were distributed every 3 m per row (0.5 emitters per tree). Each emitter delivered an average flow of 33 L h−1 with a 2.2 m wetting diameter (Figure 2a). The ‘Brookfield Gala’ apple trees were irrigated by a drip system. The drippers were arranged on two laterals per plantation row, separated from each other by 0.6 m, with emitters 0.5 m apart on the lateral (4.8 drippers per tree) and an average flow of 2 L h−1 per dripper (Figure 2b).

2.4. Description of Irrigation Treatments

The theoretical volume of water required by the plant in treatment T1 for the ‘Brookfield Gala’ and ‘Royal Gala’ cultivars was determined in accordance with Equation (1) [23], based on standardized reference evapotranspiration (ET0) and a correction factor (Fc):
V t r = ( D r · D e )     [ E T 0 · F c ( T D E 100 ) ]
where Vtr is the theoretical volume of water required by the plant (L tree−1), Dr is the distance between rows (m), De is the distance between trees in the row (m), ET0 is cumulative standardized reference evapotranspiration since the last irrigation, Fc is a correction factor or crop factor, and TDE is the total distribution efficiency (95%).
For ‘Brookfield Gala’ ET0 was determined using the Penman-Monteith model (FAO 56 P-M) [24], with weather data from the previous week recorded in an automatic meteorological station (Davis Vantage Pro2, Davis Instrument Corporation, Hayward, CA, USA) located on site, and for ‘Royal Gala’ ET0 was determined using class A pan evaporation located on site for the three days prior to irrigation according to Equation (2):
E T 0 = K p ·   E p
where Ep is cumulative pan evaporation over three days (mm) and Kp is the pan coefficient (0.80 for the season).
The factor Fc is an estimated dimensionless crop factor [19] dependent on the selected irrigation systems, plantation type and size, crop density, and the climate of the area. It is obtained through a linear relationship (Equation (3)) with P (shade fraction at midday) and with the constants K1 and K2 [9], obtained through a regression analysis outlined by Fereres and Goldhamer [25]:
F c = K 1 ·   P + K 2
where P = AS/H·L, (0.1 < P < 0.7), AS is the shaded area at noon (m2) determined by measuring the shadow diameter projected on the soil by the tree, in several directions; H is the distance between rows (m) and L is the distance between trees within the row (m). P at noon was determined monthly throughout the irrigation season. Table 1 shows the parameters K1, K2, and P, which were used for each season and apple cultivar.
Irrigation time (IT) in treatment T1 was estimated theoretically in both seasons for both apple tree varieties using Equation (4), with IT in hours:
I T = V t r n ·   Q
where Q is the emitter flow (L h−1 emitter−1), n is the number of emitters per plant (emitters tree−1) and Vtr is the theoretical volume of water required by the plant (L tree−1).
In treatment T1, for ‘Royal Gala’ apple trees the irrigation frequency was 3 days. For ‘Brookfield Gala’ apple trees the irrigation frequency in T1 was determined based on the daily average standardized reference evapotranspiration range of the prior week, varying from 3 days (for ETo from 1 to 3 mm day−1) to 2 days (for ETo from 3 to 5 mm day−1) to 1 day (for ETo from 5 to 7 mm day−1) (Table 2).
In treatment T2, the irrigation times and frequencies were defined in accordance with producer criteria. Thus, for ‘Royal Gala’ apple trees, water application corresponded to a net replacement depth of 28 mm, with a variable irrigation frequency during the season (November and March every 6 days, December and February every 5 days, and January every 3 days). For ‘Brookfield Gala’ apple trees, the farm advisor assessed the level of water depletion in the soil profile based on weekly inspections of soil profile pits in the orchard, thereby determining irrigation frequency and time (Table 2).

2.5. Soil Moisture Measurements

For ‘Royal Gala’ apple trees, a Troxler neutron probe (Troxler Electronic Laboratories, 4302, Durham, NC, USA) was used to determine soil moisture content. The arrangement of aluminum access tubing was 20 cm, 40 cm, and 50 cm from the trunk between rows (Figure 2a). The readings were taken at depths of 15 cm, 45 cm, and 75 cm, comprising the 0–30, 30–60, and 60–90 cm strata. For ‘Brookfield Gala’ apple trees, a Campbell neutron probe (Campbell Pacific Nuclear, 503-DR Hydroprobe, USA) was used to measure soil moisture content. The arrangement of aluminum access tubing was 60 cm from the trunk between rows and 30 and 60 cm between trees above the row (Figure 2b). The measurements were taken in each of the experimental units for the 0–30, 30–60, 60–90, and 90–120 cm soil strata. For ‘Royal Gala’ apple trees, soil moisture was measured before and after irrigation and for ‘Brookfield Gala’ apple trees, soil moisture was measured before irrigation, following the same procedure in both seasons.

2.6. Leaf Water Potential

The plant water potential was determined using a Scholander pressure chamber (Eijkelkamp 3000, Giesbeek, The Netherlands). The measurements were taken in two mature leaves fully exposed to sunlight per replicate, from the middle third section of the trees. Hourly monitoring was carried out between 7:00 and 19:00 at 2–3-h intervals over three days for each season and cultivar.

2.7. Fruit Yield Components

For ‘Royal Gala’ apple trees, the fruit harvest in the 2008–2009 season began in the first week of February of 2009, and in the 2009–2010 season, the harvest began in the last week of February 2010. For ‘Brookfield Gala’ apple trees, the harvest in the 2008–2009 season began in the second week of February 2009, and during the 2009–2010 season, the harvest took place in the third week of February 2010. For both cultivars, after the harvest all the fruits of the trees of each treatment were weighed to determine the yield per plant and then the yield per planted hectare. Fruit equatorial diameter and weight were assessed. Fruit equatorial diameter was measured with a manual vernier caliper and weight with a digital scale. In addition, a count of all the fruits of the studied ‘Brookfield Gala’ trees was carried out and the average number of fruits per tree for each treatment was determined.

2.8. Statistical Analysis

The responses of yield components variables were subjected to a one-way ANOVA analysis of variance with a significance level of 5% to determine differences between the means of each treatment. All the statistical analyses were carried out using RStudio (free software) [26].

3. Results and Discussion

3.1. Applied Water

At the end of the two seasons, the volumes of water applied to ‘Royal Gala’ apple trees in treatments T1 and T2 were 6211 m3 ha−1 and 7850 m3 ha−1 (2008–2009 season, Figure 3) and 4945 m3 ha−1 and 6825 m3 ha−1 (2009–2010 season, Figure 3), respectively.
The cumulative water application levels were similar in treatment T1 in both seasons. However, with T2 there were differences between seasons starting in January. The greatest monthly difference between T1 and T2 was observed in February in the 2008–2009 season, reaching a variation of 575 m3 ha−1 month−1, and in November in the 2009–2010 season, with a variation of 660 m3 ha−1 month−1. Water application in the 2009–2010 season stopped after the earthquake of 27 February 2010. Nonetheless, the water application differences between the two treatments at the end of both seasons remained stable. Thus, irrigation water savings of 20.9% in the 2008–2009 season and 27.5% in the 2009–2010 season were achieved with treatment T1.
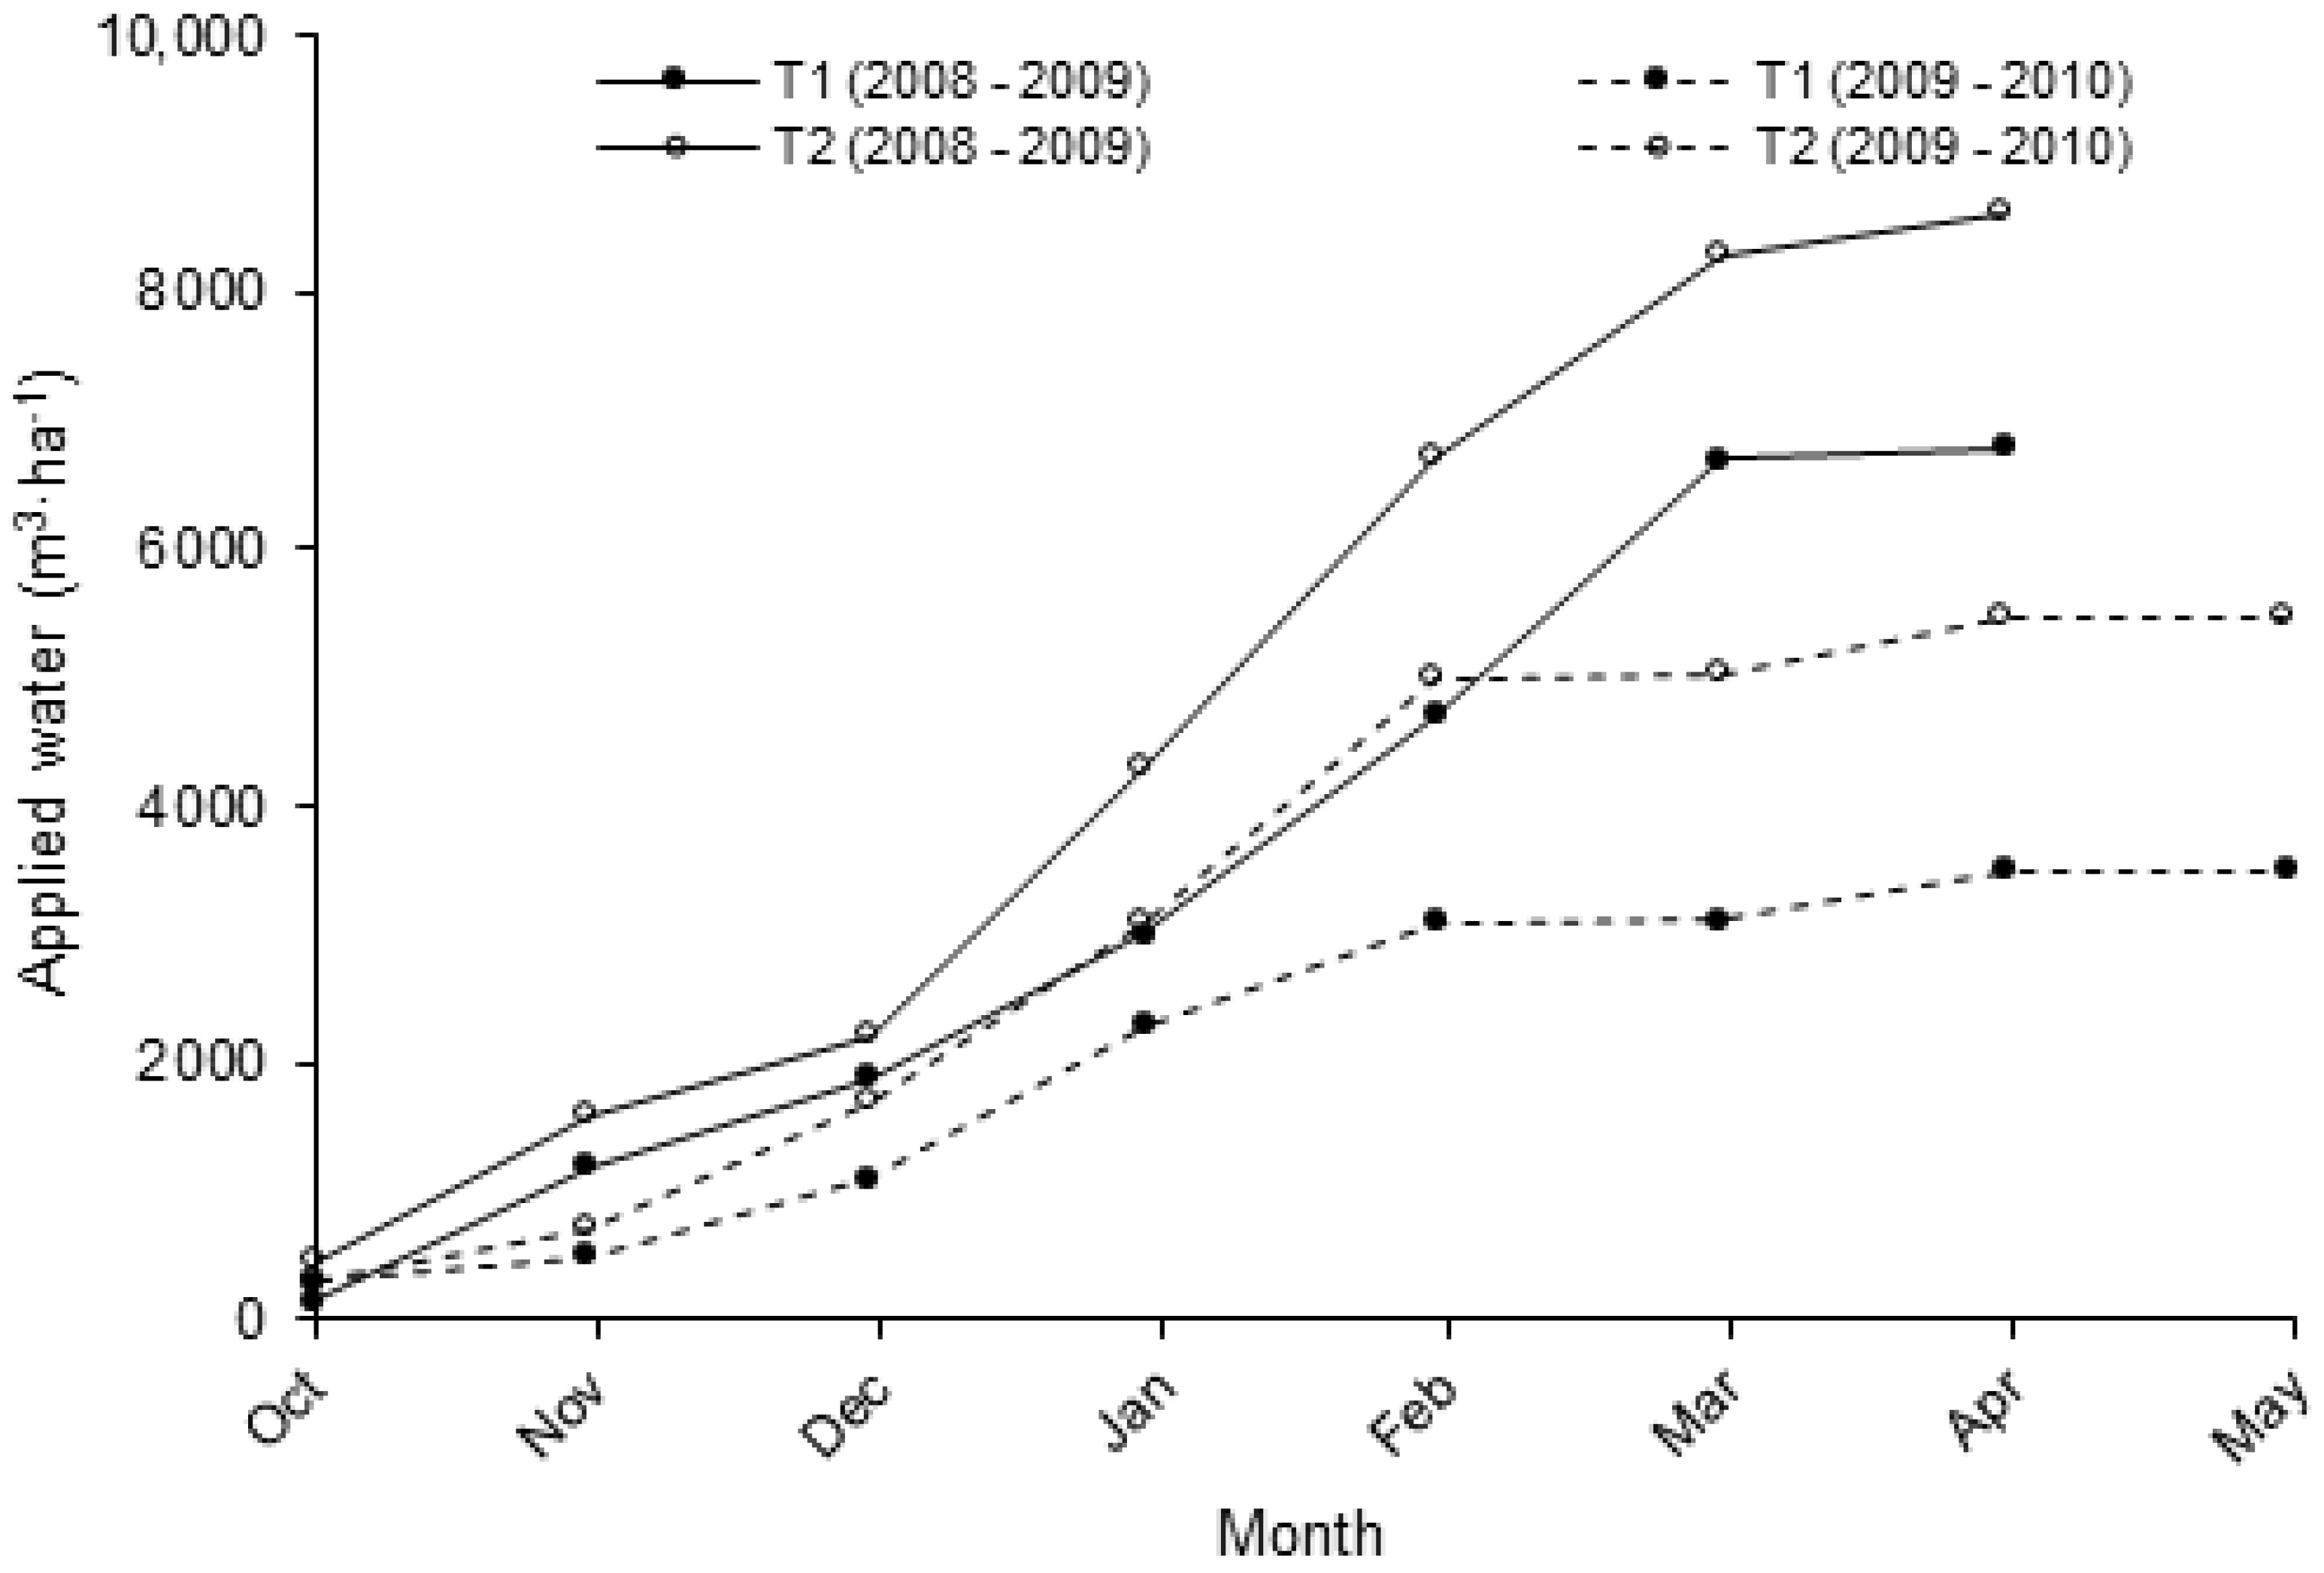
For ‘Brookfield Gala’ apple trees, the total volumes of water applied in treatments T1 and T2 were 6800 m3 ha−1 and 8600 m3 ha−1, respectively (2008–2009 season), and 3500 m3 ha−1 and 5450 m3 ha−1 (2009–2010 season, Figure 4), respectively. The differences observed in the total volume of water applied between the treatments translated into a water savings of 20.9% for T1 relative to T2 in the 2008–2009 season, and 35.8% in the 2009–2010 season. The greatest differences in monthly water application between T1 and T2 were observed in January (2008–2009) and February (2009–2010). A comparison of the two seasons shows that the difference in applied water volume is accentuated in November due to lower water application in the first season, 2009–2010 (Figure 4), and then in March, when no water was applied in either treatment in the 2009–2010 season due to the Earthquake of 27 February 2010 [27].
In general, there were similarities between irrigation water applications on both farms, with water applied reductions greater than 20% maintained in treatment T1. In net terms, this represents a savings of 1600 to 1950 m3 ha−1 season on each farm at the end of each season. Zhong et al. [8] studied eight irrigation deficit treatments (light, moderate, and severe in different fruit growth stages) applied to apple trees (Malus pumila Mill) in northwest China. The traditional irrigation scheme used 7800 m3 ha−1 of water throughout the season. The best results among the 7 remaining treatments were obtained when applying a moderate irrigation water deficit (7000 m3 ha−1), which represented a final savings of 10%. The percent savings reported by Zhong et al. [8] is lower than that found in the present study.
Regarding the magnitude of water applied in T1, Lecaros [10], studied water application in ‘Brookfield Gala’ apple trees based on the recommendation of an online computing platform (AQUASAT), finding a total applied water volume in the January–March trimester of between 2967 m3 ha−1 and 4409 m3 ha−1. These values are similar to the quantity of water applied in both seasons in T1 if only the volume of water applied in the first trimester is considered. Meanwhile, Ortega et al. [28] assessed four levels of water replacement equal to 50%, 75%, 100%, 125% of crop evapotranspiration (the theoretical water volume required by the plant, ETc), along with an existing producer-managed approach. The six-year-old commercial orchard, cultivar Royal Gala and drip irrigated, is in the Central Valley of Chile and 50 km north of the ‘Royal Gala’ orchard, with similar climate characteristics. The total applied water volumes in the season were 8086 m3 ha−1 (farmer protocol), 6377 m3 ha−1 (125% ETc), 4667 m3 ha−1 (100% ETc), 3501 m3 ha−1 (75% ETc), and 2334 m3 ha−1 (50% ETc). The best result among the five treatments was obtained by 100% ETc treatment and the lowest fruit yield by the 125% ETc treatment.

3.2. Soil Moisture Content

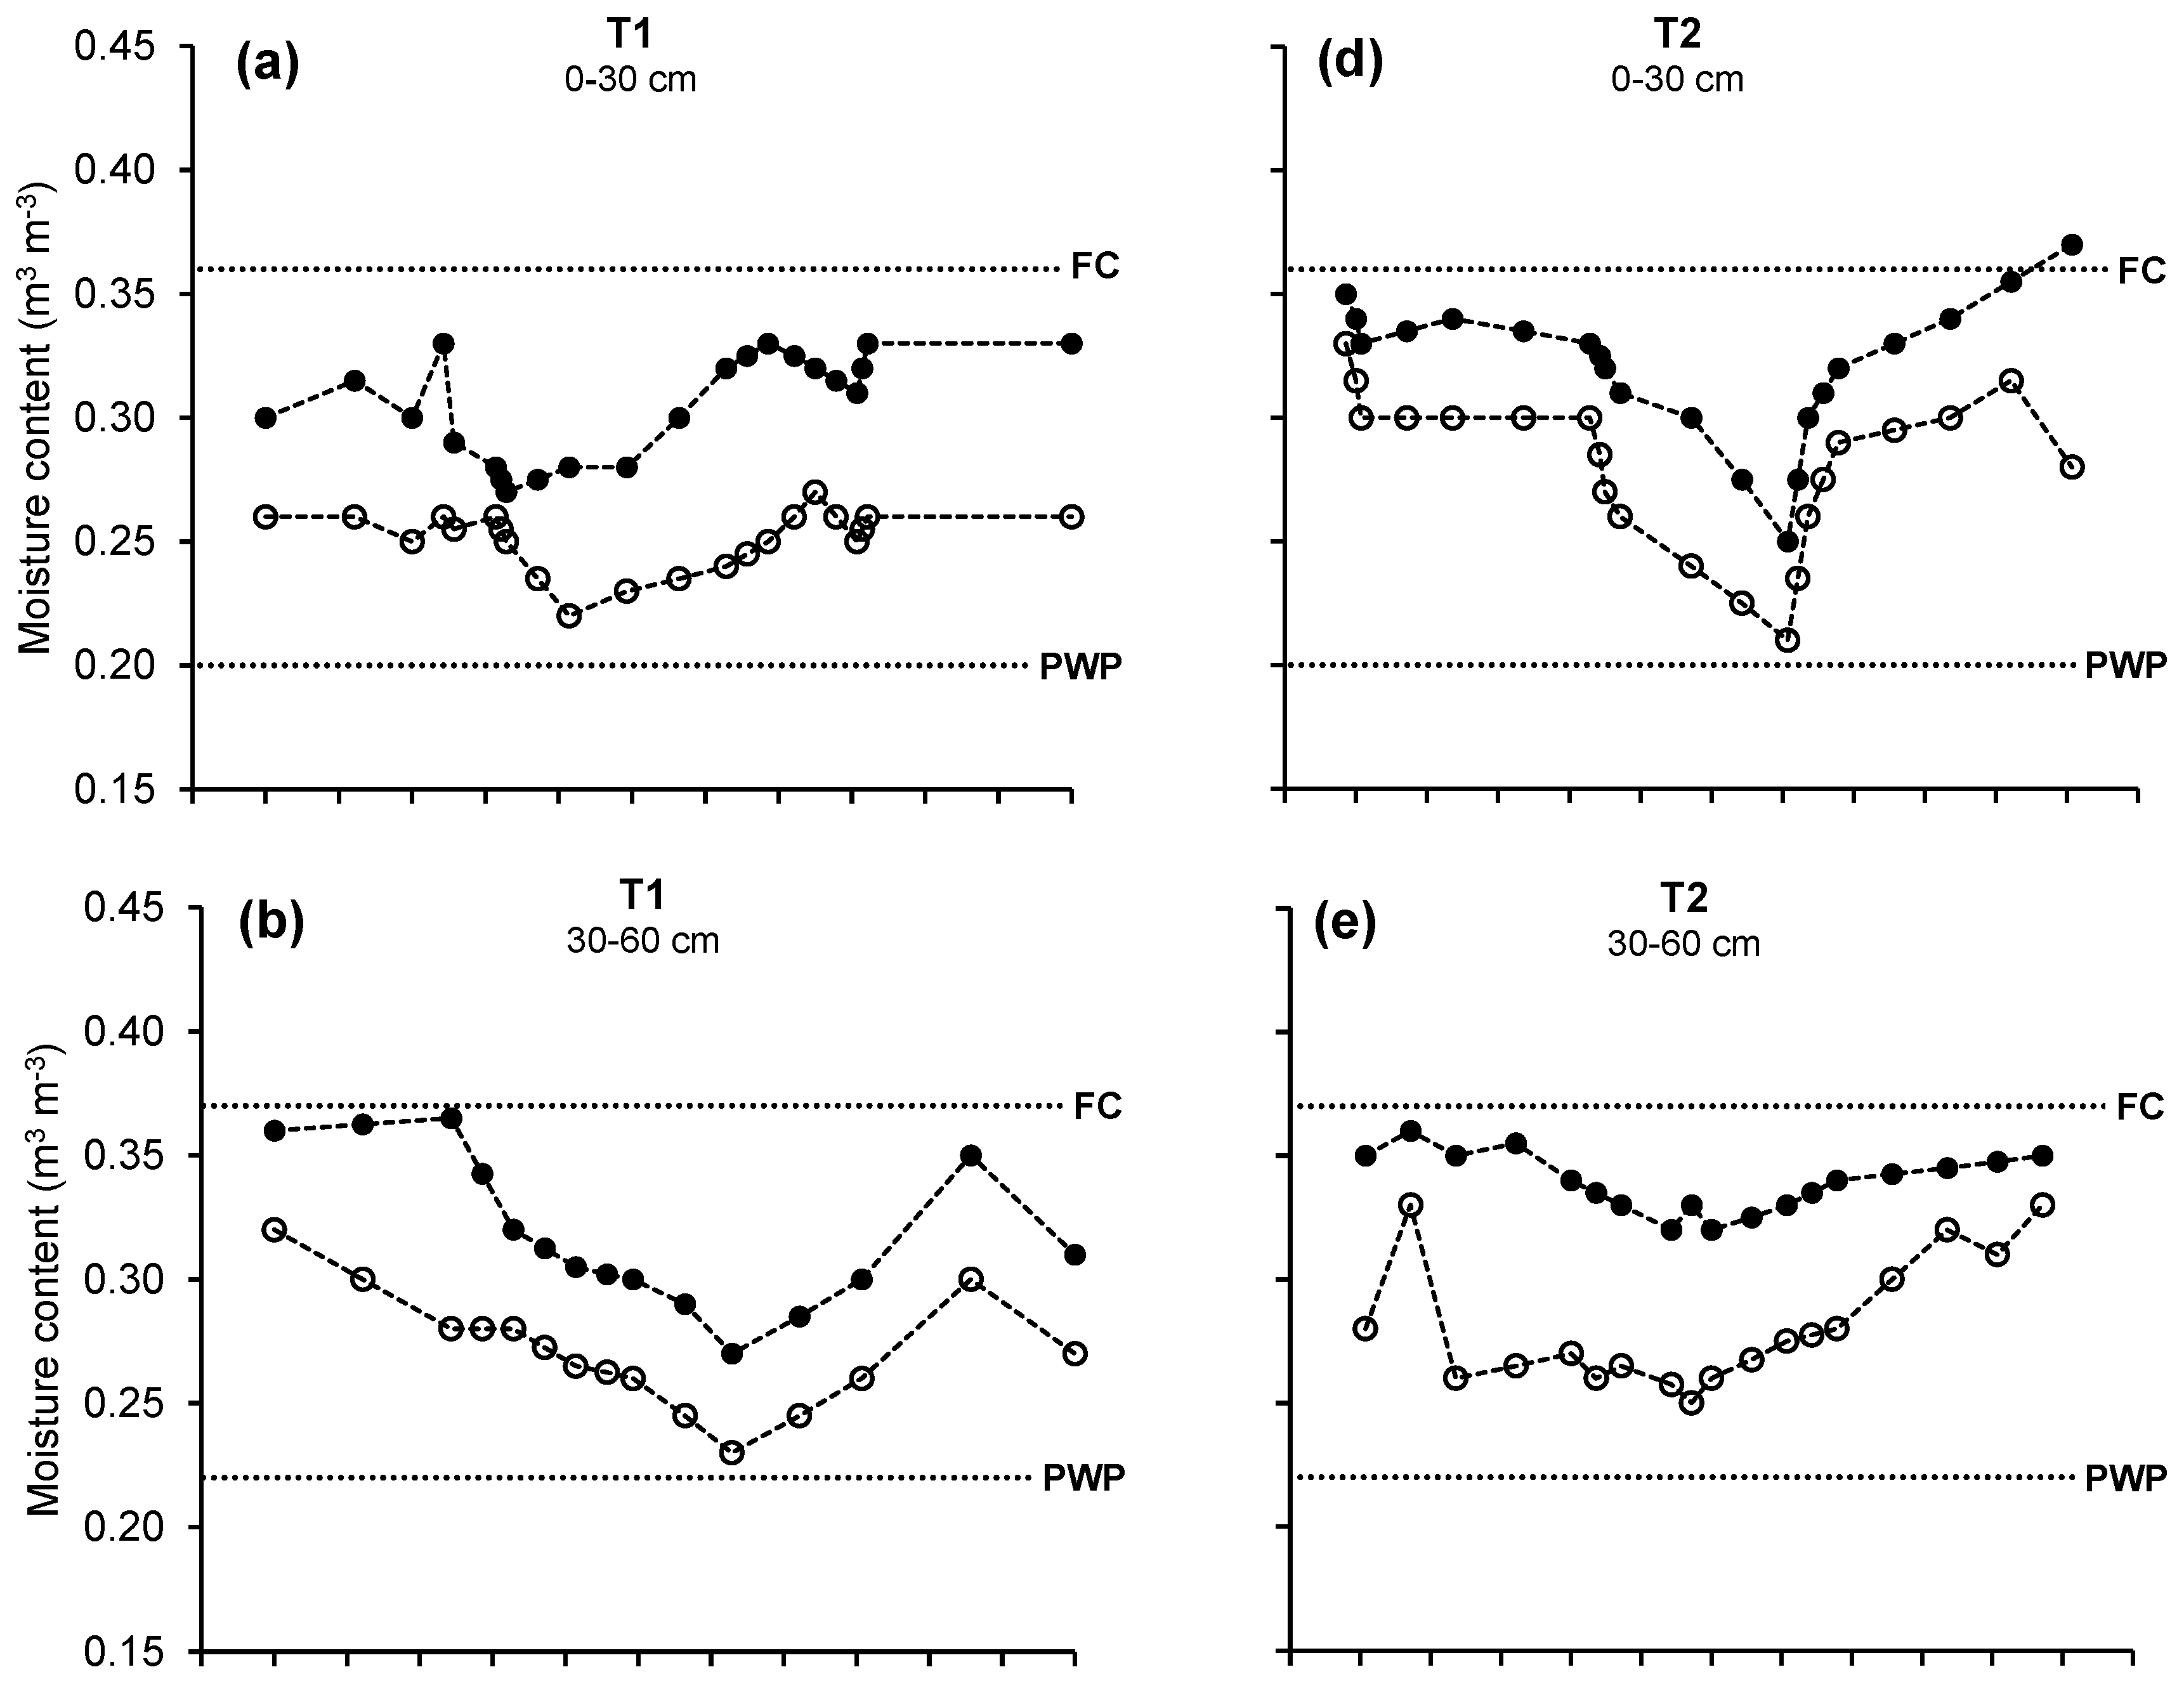
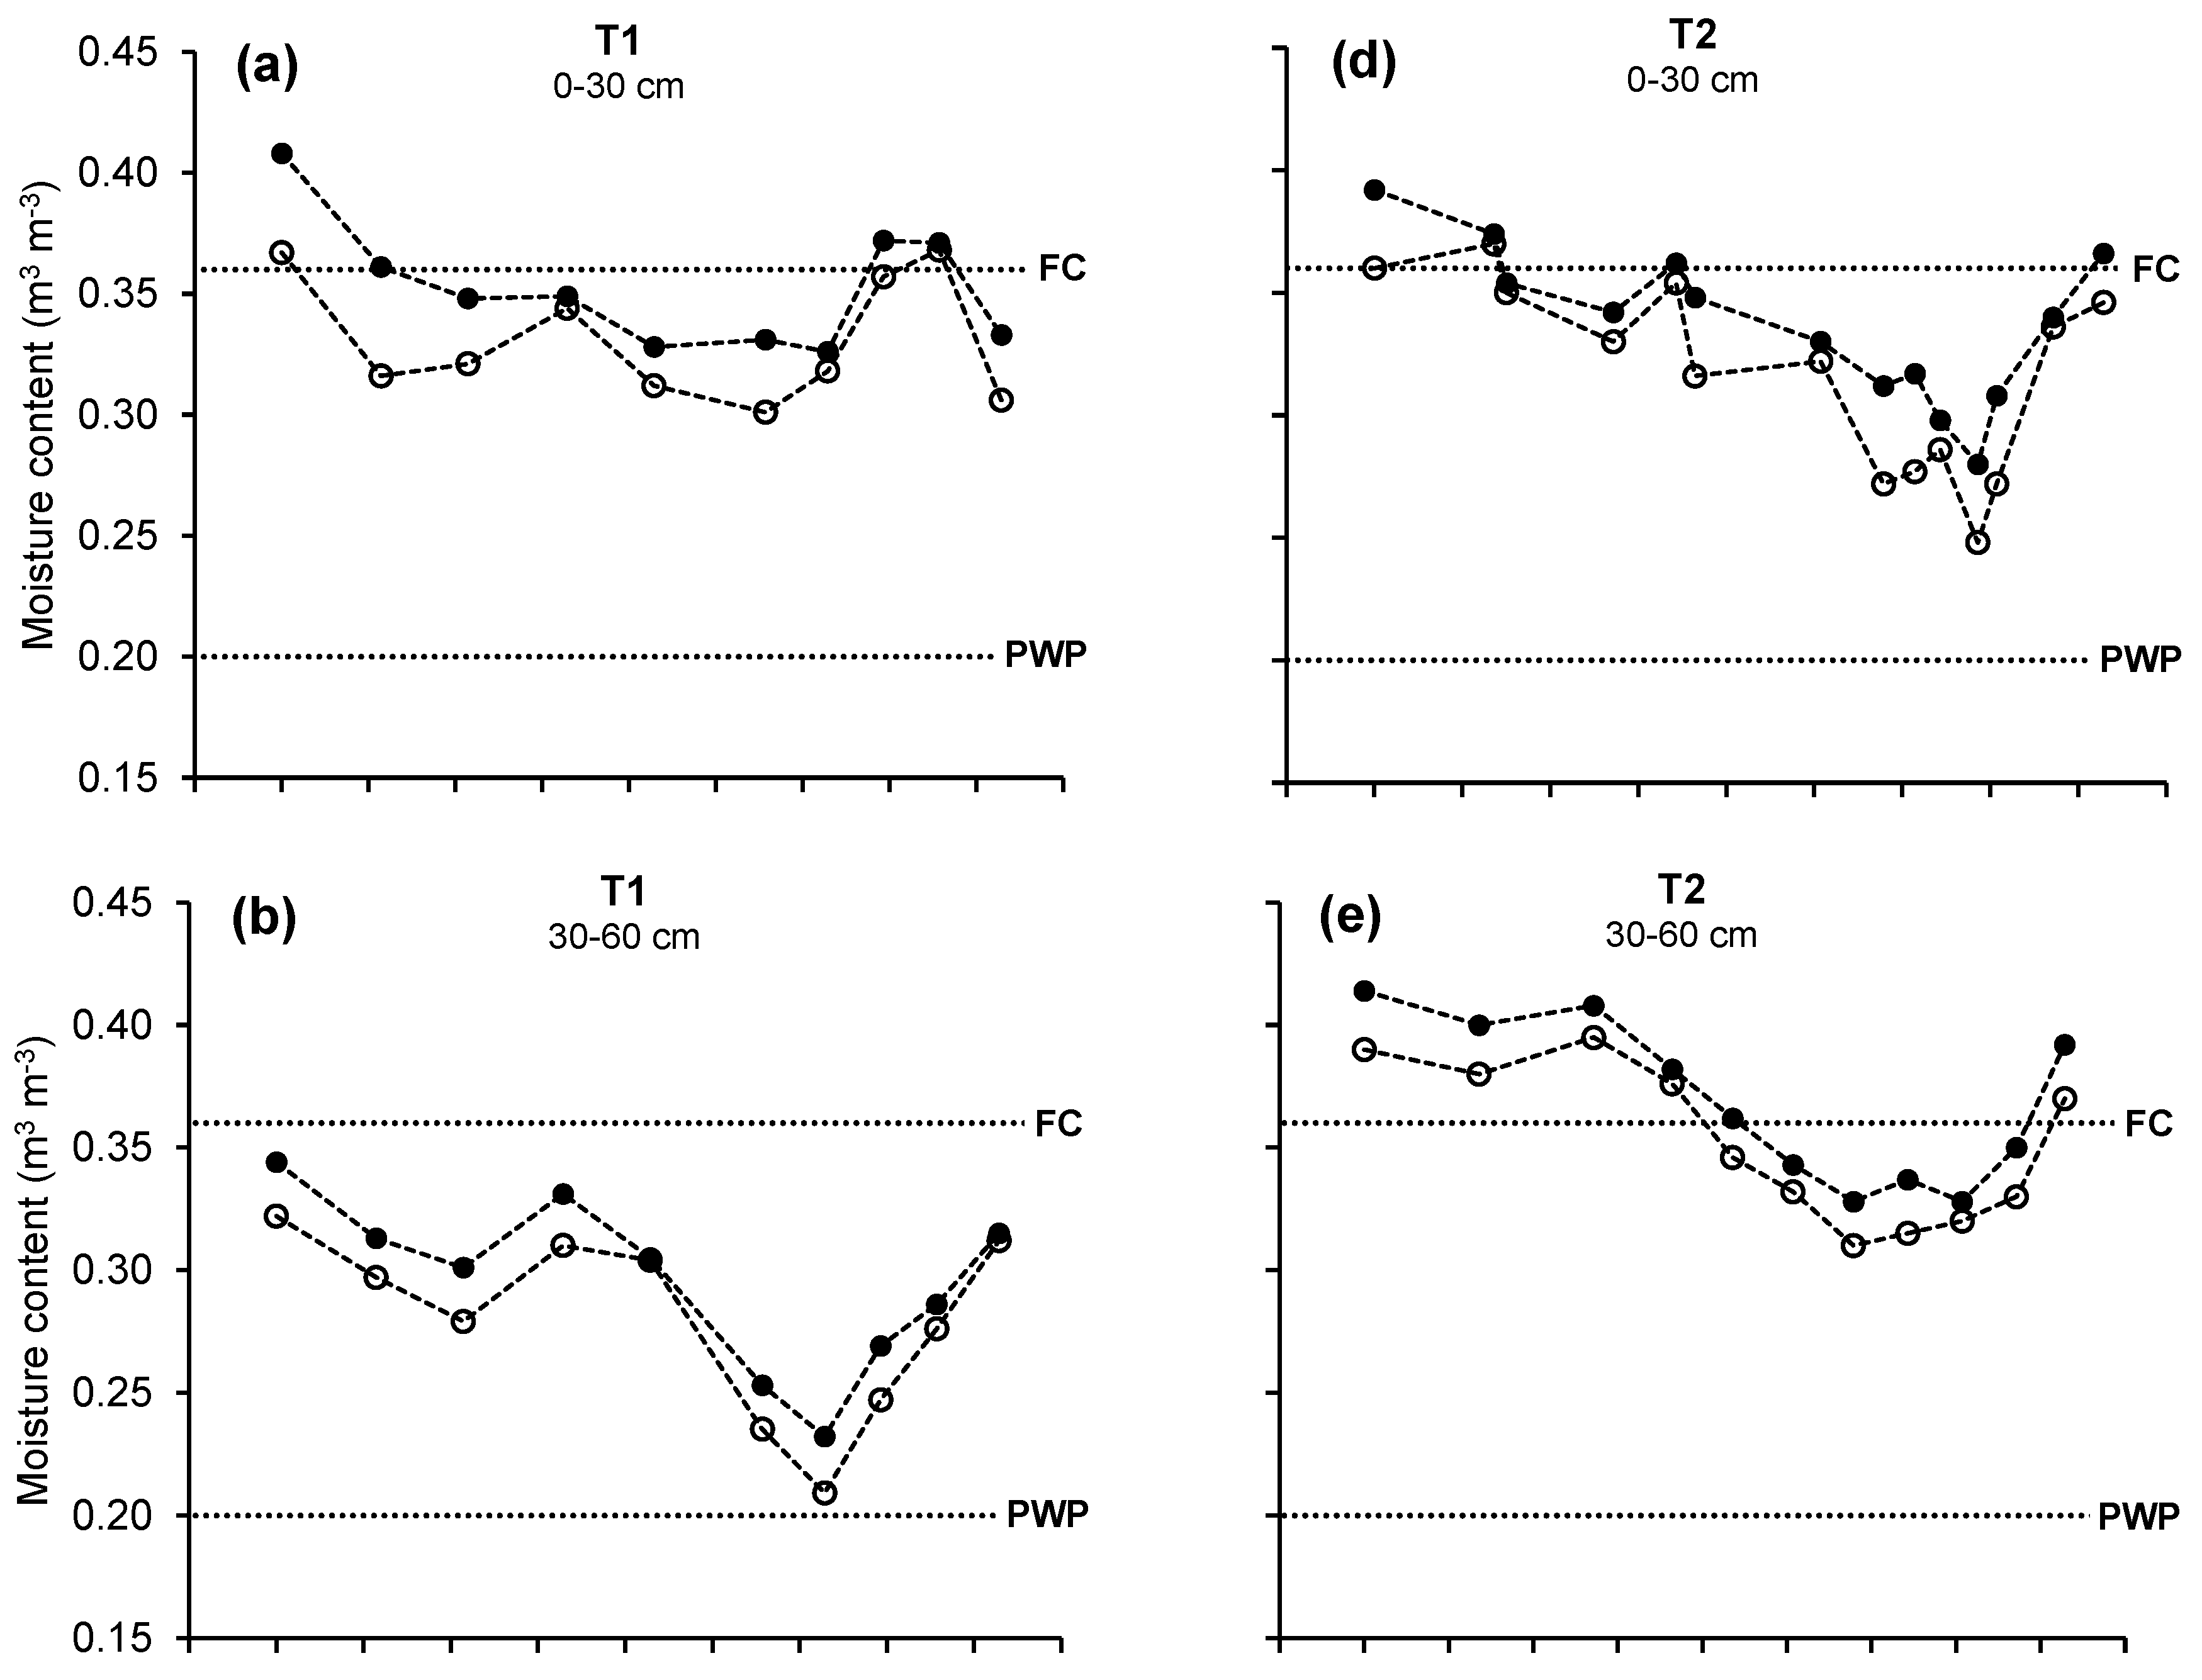
In general, soil moisture in the ‘Royal Gala’ apple orchard remained in appropriate ranges between field capacity and permanent wilting point in both seasons and treatments, before and after irrigation, with a tendency to greater moisture values with T2 (Figure 5 and Figure 6). There were minor differences in moisture content before and after irrigation in the 60–90 cm strata.
At the start of the irrigation season, the soil presented a moisture content close to field capacity after irrigation due to the recent winter rain, low atmospheric water demand, and the lower vegetative development of the trees. Subsequently, with the increase in root activity and greater plant water demand, water extraction from the soil was observed down to the deepest strata. While soil moisture levels near the permanent wilting point were observed in all strata in both treatments before irrigation in the 2008–2009 season, this situation was isolated and associated with the high evapotranspiration in the period in which it occurred. Thus, both treatments provided adequate irrigation water in the soil.
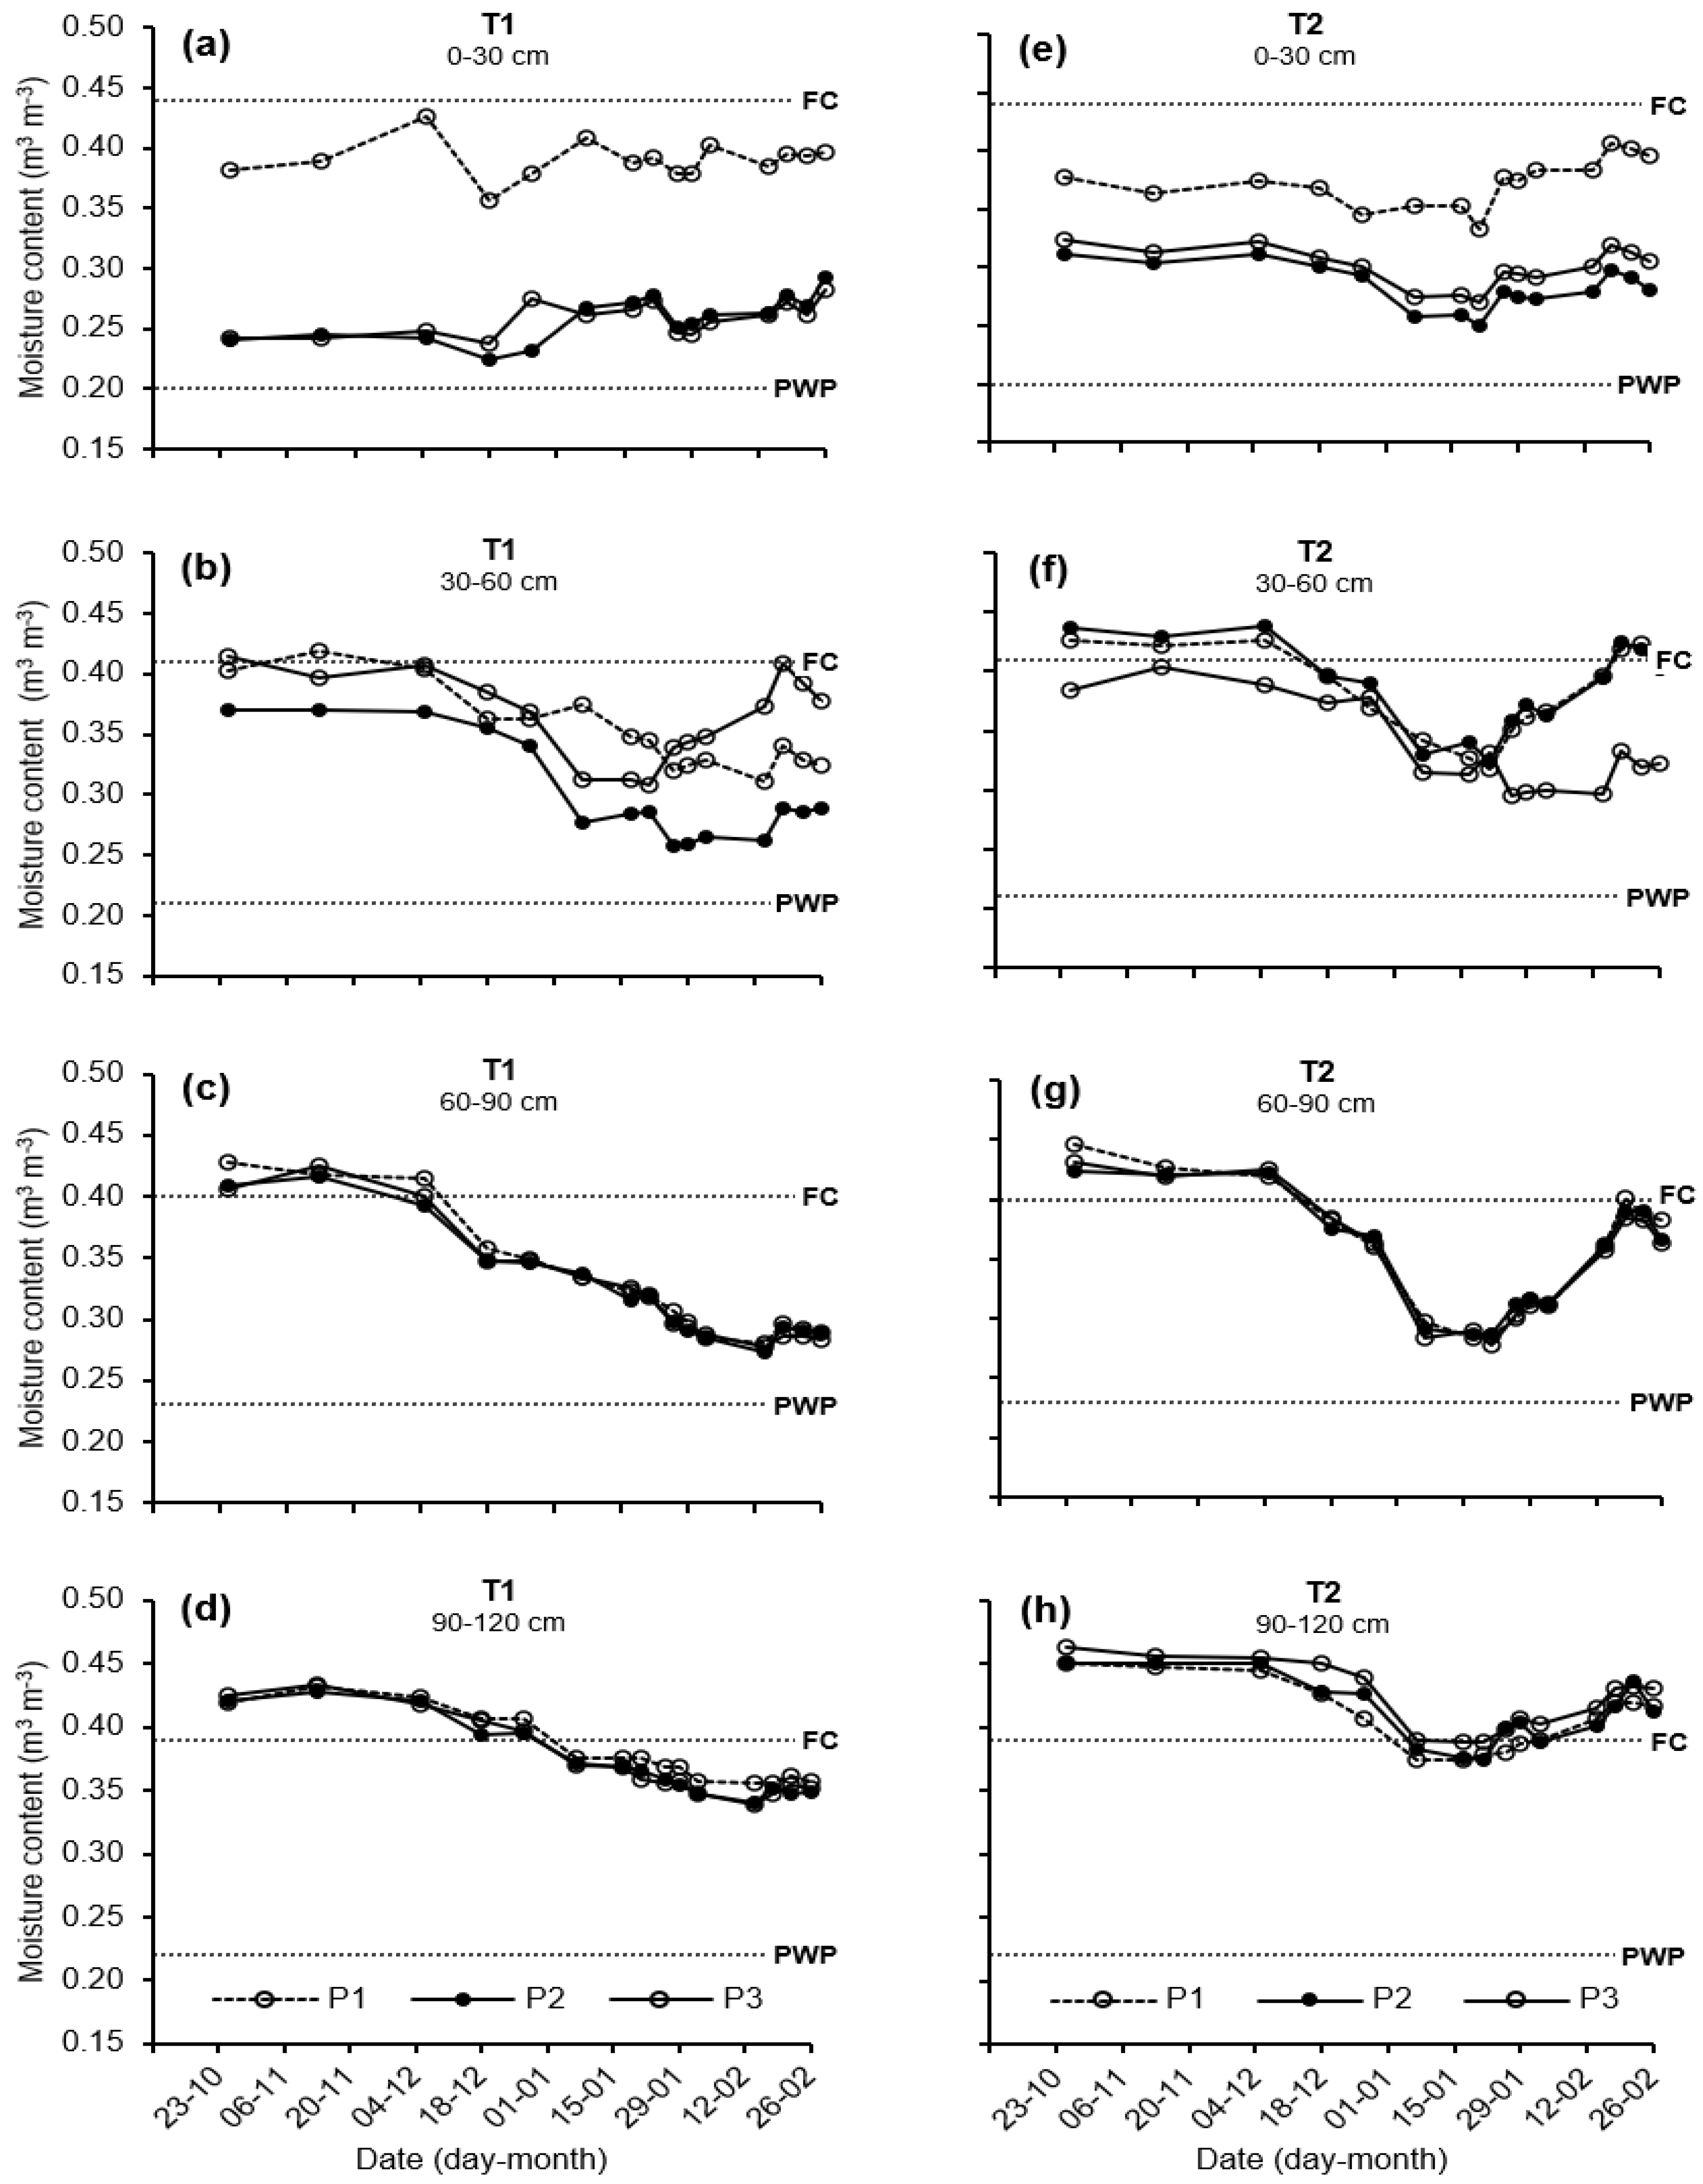
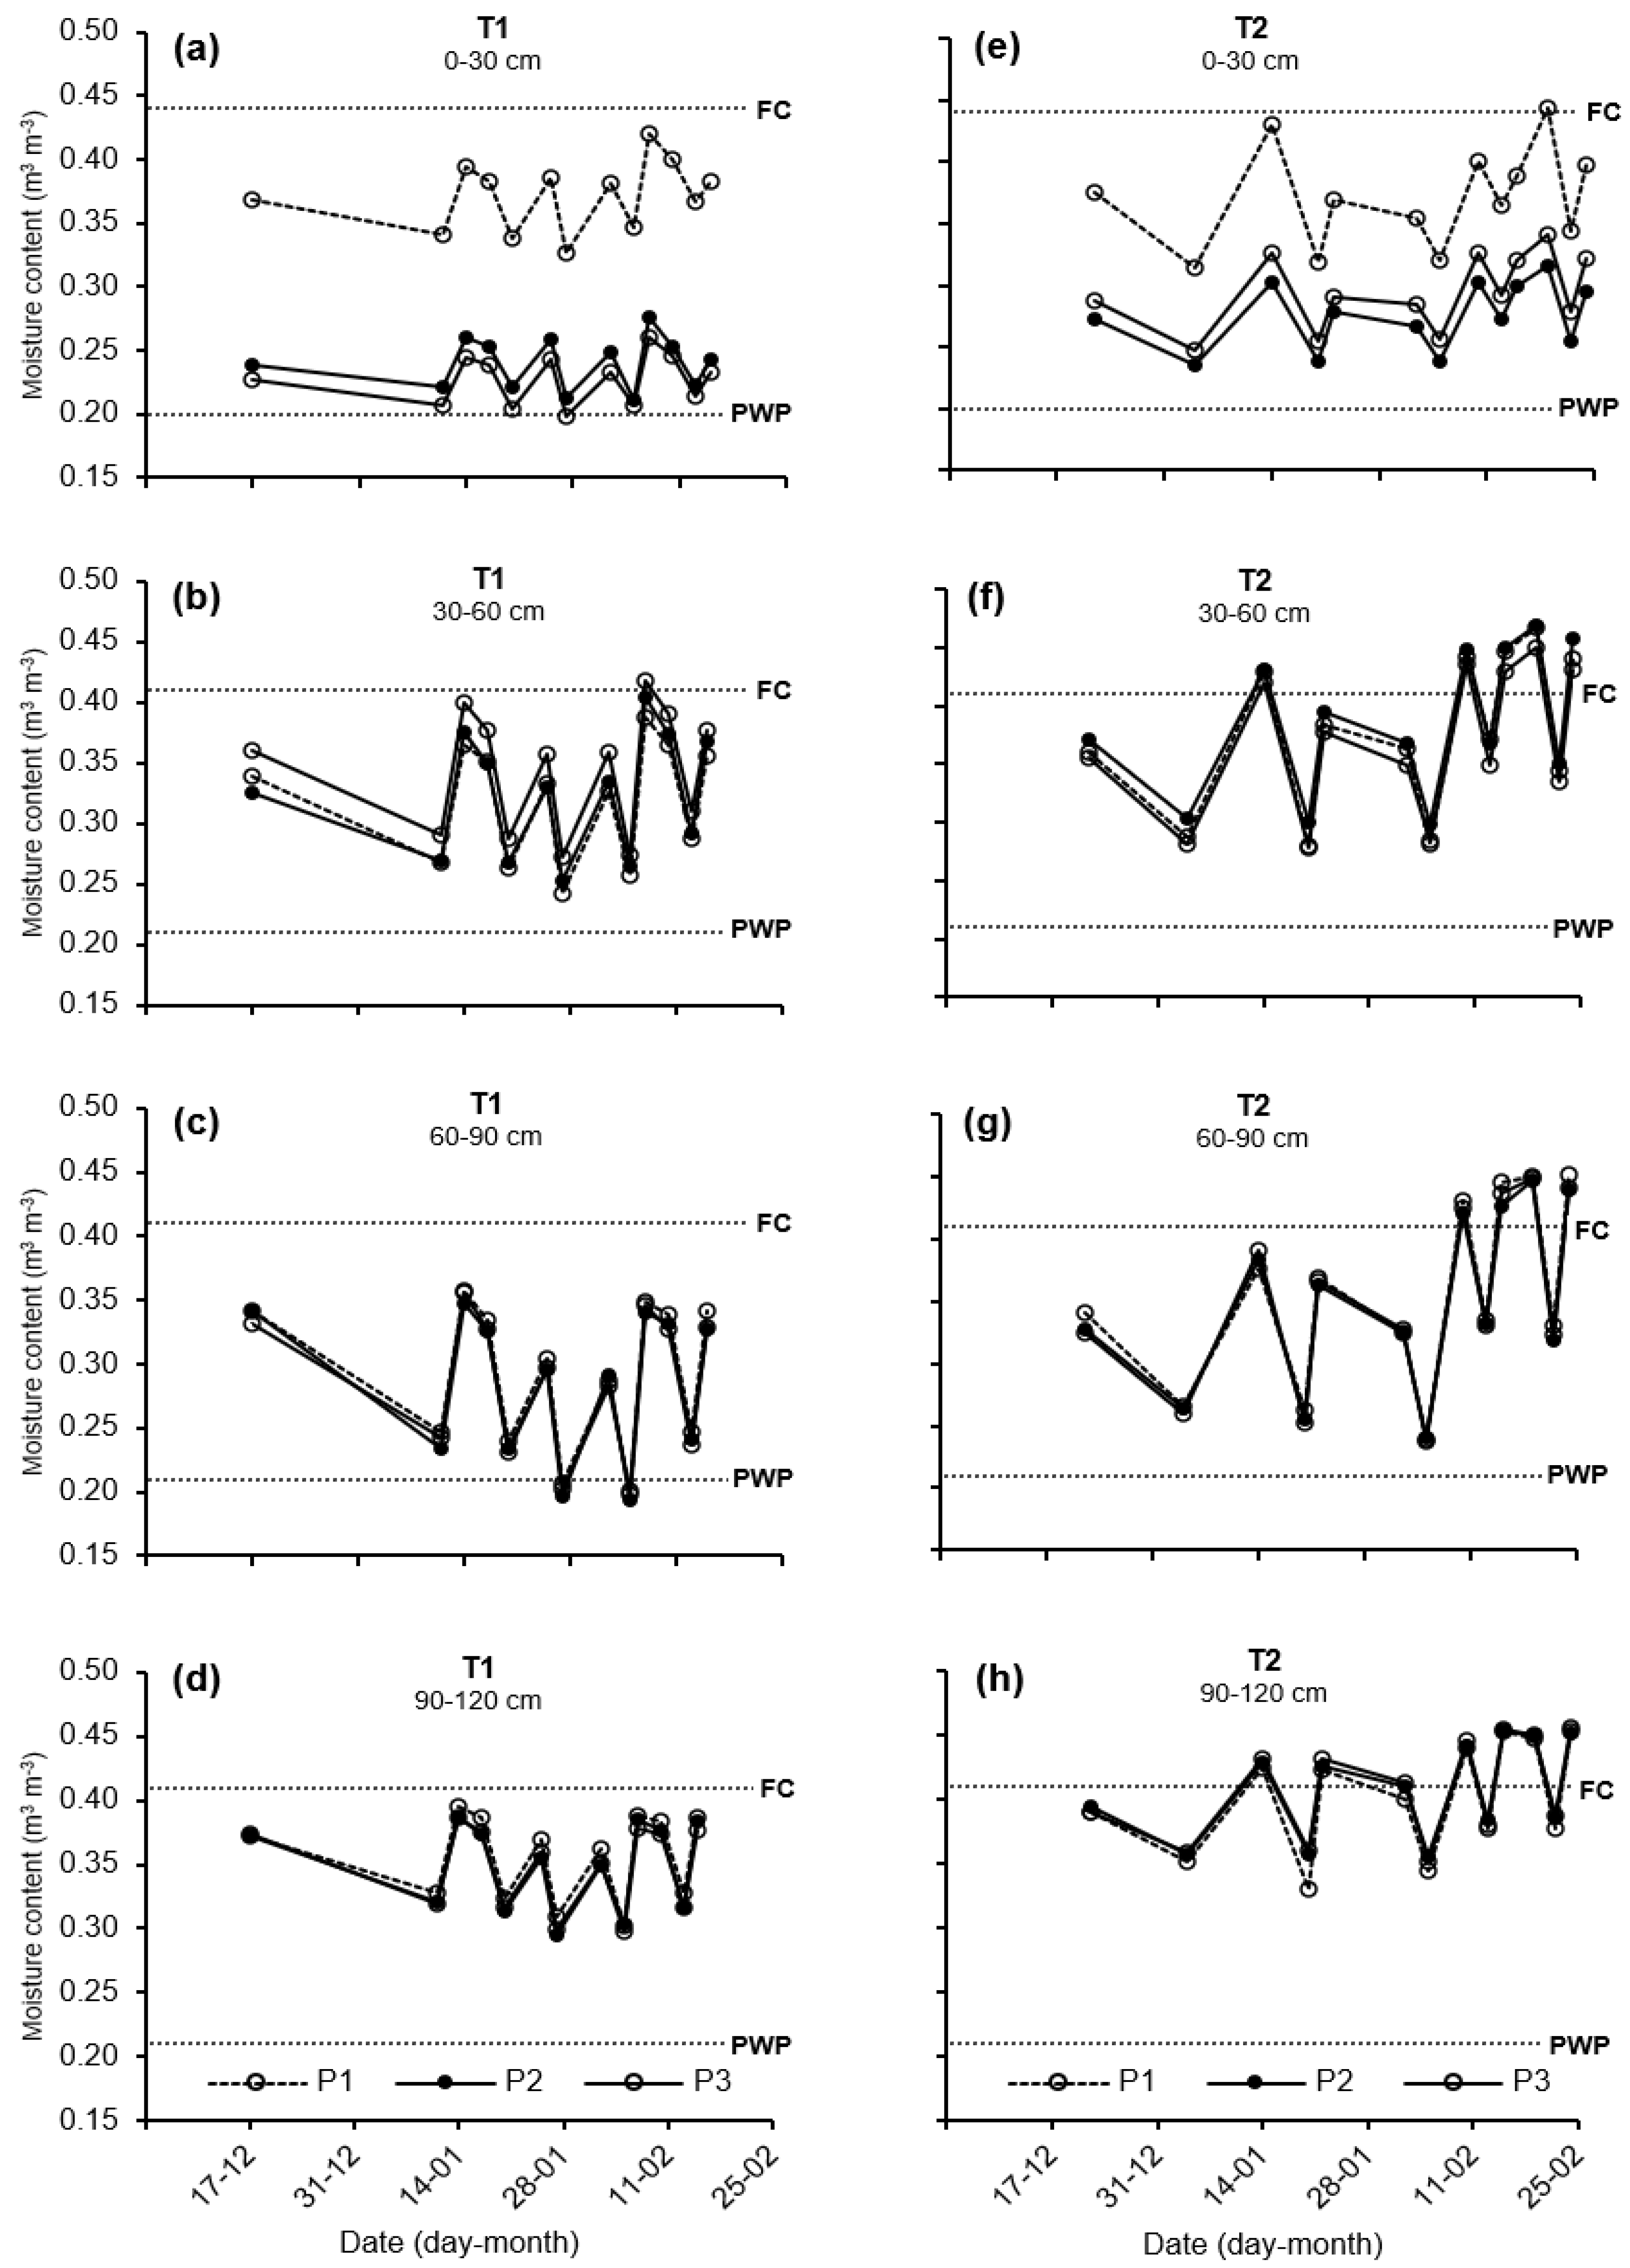
In ‘Brookfield Gala’ apple trees, elevated soil moisture content was observed in both treatments and seasons at both the beginning and end of the irrigation season (Figure 7 and Figure 8). During the 2008–2009 season, in treatment T1 the evolution of moisture content in the 0–30, 30–60, and 60–90 cm strata remained between field capacity and permanent wilting point in all described data (Figure 7). In addition, an increase in moisture content toward the deeper strata was observed, with soil moisture at 90–120 cm remaining near field capacity for a longer period, which seems to indicate that at 90–120 cm the roots present reduced water extraction activity. In the 2009–2010 season a greater soil moisture content than in the previous season was observed, near or greater than field capacity, especially in T2. This situation can be explained, in addition to what was expressed for the previous season, by the occurrence of rainfall at the beginning of the 2009–2010 season (8 mm in December and 18.5 mm in January).
Girona [29] studied the distribution of soil moisture content in a plot of adult apple trees in full production (5 years old at the beginning of the trial), where the main cultivar was ‘Golden Smoothee’ grafted on M.9 dwarfing rootstock and ‘Royal Gala’ pollinator. The author found that the moisture content was low at depths between 30 and 60 cm and then increased starting at 70 cm. In addition, Green and Clothier [30] examined spatial and temporal water consumption patterns in mature, 14-year-old apple trees (Malus domestica Borkh. cv. ‘Splendour’ on MM.106 rootstock) in Palmerston North, New Zealand. They found that around 70% of the water uptake occurred in the first 40 cm of depth, where there was greater density of fine roots. This demonstrates the possible reduced development of the root system of the grafted apple tree, which extracts predominantly surface moisture, and would explain the observed results in terms of greater soil moisture for treatments T1 and T2 in the deepest soil layers.
Some authors have found that excess soil moisture, such as in the case of T2, does not necessarily lead to better fruit quality characteristics. Leib et al. [31] compared the effects of deficit irrigation and partial rootzone drying versus a control treatment on fruit quality in 6-year-old ‘Fuji’ apple trees (Malus domestica Borkh. c.v. Fuji) in three continuous seasons. In the control treatment water was applied via microjet to maintain soil moisture near field capacity (0.27 m3 m−3) in the 90–120 cm layer. In the other two irrigation strategies, the water applied was 35% and 50% lower than the control treatment and soil moisture reached below 0.15 m3 m−3 and above the permanent wilting point (0.08 m3 m−3). No statistically significant differences in fruit weight and size at the end of the three seasons in any of the three treatments were found.

3.3. Leaf Water Potential

The leaf water potential (ΨH) in ‘Royal Gala’ apple trees varied between −0.5 MPa and −1.8 MPa throughout the day in both seasons and treatments (Figure 9).
No statistically significant differences (p < 0.05) between the irrigation treatments in any of the analyzed cases were observed. While the soil moisture content results approached permanent wilting point values in both treatments and seasons in the month of January (Figure 5 and Figure 6), this was not evident in the leaf water potential results (Figure 9). Therefore, greater water application in T2 did not have a differentiating effect on the water status of the plant relative to the irrigation management in T1.
In ‘Brookfield Gala’ apple trees, ΨH varied between −1.9 and −0.2 MPa and statistically significant differences were observed only between 10:00 and 12:00 on 17 (Figure 10a), 20 (Figure 10b), and 24 February 2009 (Figure 10c), when the leaf water potential in T1 was less than in T2 (p < 0,05). This could be related to the moisture content throughout the soil profile in T1, which was lower than in T2 at the end of February (Figure 7).
Özmen [32] found a close relationship between soil moisture content and leaf water potential in ‘Granny Smith’ apple trees measured at midday, with an R2 coefficient of 0.97 between the two variables. In this investigation, ΨH varied between −2.7 MPa when the soil moisture content was near the permanent wilting point and −1.2 MPa when the soil moisture content was near field capacity. Bhusal et al. [33], meanwhile, studied the responses of ‘Hongro’ and ‘Fuji’ cultivars grafted on M.9 rootstock under conditions of drought water stress and compared them with a well-irrigated control treatment over 60 days. The first drought effects were observed starting after 15 days. At that point, the leaf water potential at midday was between −1.5 and −2.0 MPa in the trees under drought treatment, and it decreased to −2.8 MPa at day 60. In the control treatment, the water potential remained between −1.0 MPa and −1.5 MPa throughout the period. The extreme drought conditions between days 15 and 60 negatively affected the leaf morphological characteristics, total chlorophyll content, the net photosynthesis rate, and the abscisic acid concentration in the xylem sap.
Naor et al. [34] found midday ΨH values of up to −2.7 MPa in a commercial orchard of drip-irrigated 6-year-old ‘Golden Delicious’ apple trees in Israel, with no differences between High (440 mm) and Low (210 mm) irrigation treatments. Similar ΨH values had been reported by Mpelasoka et al. [35] for a 4-year-old ‘Braeburn’apple trees, grown on MM.106 rootstock, in lysimeters under drip irrigation in New Zealand, where trees were irrigated with about 40% of the amount of water used in the well-watered control irrigation treatment.
While it is possible that the lower soil moisture availability in the apple trees to which T1 was applied had an effect on the leaf water status in that period, the values obtained in this study are within the limits reported in the literature, and therefore do not reveal a negative impact of lower water application. In the 2009–2010 season this phenomenon was not observed and the leaf water potential measurements and curves maintained the same trend, without statistically significant differences (p < 0.05).

3.4. Fruit Yield Components

No statistically significant differences in ‘Royal Gala’ yields were observed between the two treatments in each season, and average values were between 43.3 ton ha−1 and 46.2 ton ha−1 (Table 3).
Meanwhile, in the ‘Brookfield Gala’ cultivar only one statistically significant difference (p < 0.05) of 6.5 ton ha−1 between the yields of the two treatments in the 2008–2009 season was observed. In this case, apple trees under treatment T1 presented greater production (22.9%), associated with a higher number of fruits per tree in that treatment (Table 4).
Unlike in the 2008–2009 season, in the 2009–2010 season no statistically significant differences in yield between the two treatments were observed, despite the increase in the number of fruits per tree in treatment T2 (Table 4). These results corroborate the effectiveness of the irrigation water application strategy based on the application of a theoretical volume required by the plant, as it allows the production level to be maintained with less irrigation water consumption than in the farm protocol.
In both cultivars the benefit of using controlled water management, without harming production, is apparent. This situation was also observed by Parra et al. [36], who assessed controlled irrigation in a 20-year-old ‘Top Red Delicious’ apple orchard and compared it with farmer management. The study, which was carried out in Cuauhtémoc, Chihuaha, México, at an altitude of 2100 masl, showed that it was possible to achieve a savings of up to 7370 m3 ha−1 season−1 with controlled irrigation and increase production from 30 ton ha−1 (farmer management) to 38 ton ha−1.
Although in general the production levels did not differ between treatments, the ‘Brookfield Gala’ yield reported in this study is below levels achieved by other authors. For example, Lecaros et al. [15] found yields per season of 42.1 ton ha−1 and 59.5 ton ha−1 for 4-year-old ‘Brookfield Gala’ apple trees. Similarly, Zhong et al. [8] reported yields above 40 ton ha−1 for 8 of 9 controlled irrigation treatments applied to 5-year-old apple trees.
Regarding the number of fruits, during the 2008–2009 season the number of fruits produced by ‘Brookfield Gala’ trees under T2 was statistically lower than that obtained with T1 (Table 4). By contrast, in the 2009–2010 season, the number of fruits in T2 increased significantly and was greater than that achieved with T1. These values may appear contradictory, since excess irrigation water seems to have opposite effects on the number of fruits produced by trees to which T2 was applied in the 2008–2009 and 2009–2010 seasons.
In the literature there are cases that support both positions. For example, Ortega et al. [28], in the Central Valley of Chile, obtained 20% and 40% fewer fruits using an irrigation strategy for Royal Gala apple trees based on replacement levels equal to 125% and 150% of actual evapotranspiration, respectively. This situation is similar to that observed in the 2008–2009 season and could be explained by the greater premature fruit drop when excess water is applied (T2), as reported by Assaf et al. [37]. By contrast, Martins et al. [38], in Petrolia, Brazil, studied two two-year-old apple cultivars and observed a greater number of flowers and higher fruit-set percentage when water replacement levels of up to 120% of crop evapotranspiration were applied, which led to a greater number of fruits per tree when a greater amount of water was applied. This situation is what was reported for the 2009–2010 season.
The foregoing suggests that an irrigation strategy based on a theoretical estimation of water required by the plant offers stability in the number of fruits to be harvested. In addition, it is worth mentioning that the ‘Brookfield Gala’ orchard was planted in 2006; therefore, it would still have been in the process of reaching the mature commercial orchard stage.
Regarding irrigation water productivity, Table 5 shows a summary of water use efficiency (kg of harvested fruit per m3 of applied water) in the treatments and seasons for each studied variety. This parameter is widely used in the literature to assess crop water consumption [8,28,36,39,40].
The results indicate that productivity was greater in the 2009–2010 season for both varieties and treatments, which is related to the lower water application resulting from the 2010 earthquake and a maintenance of production levels relative to the previous season. In addition, productivity per volume of applied water in T1 was 32% to 56% greater than that obtained with T2.
Osorio [39] created an irrigation water productivity reference for red apples, emphasizing the urgent need to improve water use efficiency. The author determined theoretical productivity values between 7.9 kg m−3 and 11.9 kg m−3 for the geographic areas in which the apple varieties studied here are located (Biobío Region and Maule Region). The productivity of treatment T2 does not reach the lower limit of this range in either of the two seasons or apple varieties. By contrast, T1 productivity reaches or nears this range in both seasons and apple varieties, except for the 2008–2009 ‘Brookfield Gala’ harvest. These results show that the technification of irrigation management allows water resources to be better used. By way of comparison, Parra et al. [36] reached productivity values of up to 7.6 kg of fruit per m3 of applied water in ‘Top Red Delicious’ orchards. Meanwhile, Ortega et al. [28] obtained efficiencies of up to 18.2 kg of fruit per m3 of applied water in ‘Royal Gala’ apple orchards in the Maule Region, Central Valley of Chile, which is an objective for future studies.
Regarding fruit size, at the end of the 2008–2009 season the diameters reached by ‘Royal Gala’ apples were 7.4 cm and 7.5 cm in treatments T1 and T2, respectively. However, in the 2009–2010 season they were 6.8 cm and 6.5 cm in T1 and T2, respectively (Table 6). Thus, in ‘Royal Gala’ apple trees irrigation water management did not affect fruit development and growth. Meanwhile, in ‘Brookfield Gala’ apple trees, differences in fruit diameter at harvest in were observed only in the second season. All the diameters achieved met or exceeded the value of 6.5 cm required by the market [41].
Parra-Quezada et al. [42] assessed three levels of fruit load and two levels of irrigation water application in ‘Empire’ apple trees grafted on 4-year-old M.9 rootstock. In their investigation, they noted that fruit diameter was not directly influenced by irrigation deficit, but rather by the fruit load on the tree. This situation is consistent with the results obtained in the present study, in which a greater number of fruits in treatment T2 led to smaller-diameter apples in the 2009–2010 season for the ‘Brookfield Gala’ cultivar.
With respect to fruit weight, in ‘Royal Gala’ apples similar results between treatments for each season were observed, continuing the pattern of the other fruit yield components (Table 6). Meanwhile, in ‘Brookfield Gala’ apples statistical differences in fruit weight were observed only between the treatments applied in the 2009–2010 season. The lower fruit weight may be associated with a greater number of fruits per tree (Table 4) and a smaller fruit diameter (Table 6) achieved with T2 in this season.
In general, the ‘Royal Gala’ and ‘Brookfield Gala’ fruit weights are within the range reported by other authors and exceed the minimum weight limit of 90 g required for export [43].

4. Conclusions

The irrigation strategy based on a theoretical volume of water required by the plant (T1) allowed reductions in water volume applied of over 20% relative to the farm management protocol (T2), with a decrease of more than 1600 m3 ha−1 on each farm at the end of each season.
In both seasons and for both apple cultivars, the soils to which T2 was applied presented a greater moisture content, near field capacity, while those under T1 remained between permanent wilting point and field capacity. The soil moisture content at the beginning and end of the season was determined by climate characteristics and lower plant water demand, respectively. Apple tree water potential behavior was similar throughout the day in both treatments and both seasons, and no effect of water applied on water potential was observed; thus, a greater quantity of water applied in the farm protocol did not improve the water status of the plant.
In ‘Royal Gala’ apple trees there were no differences in yield components such as fruit production, fruit diameter, and fruit weight between the two studied treatments in the two seasons. However, in ‘Brookfield Gala’ apple trees there was greater production and a higher number of fruits per tree with the application of a theoretical volume of water required by the plant (T1) in the 2008–2009 season. In the 2009–2010 season, there was an increase in the number of fruits per tree in T2, which caused a decrease in fruit diameter and weight, but no significant production differences relative to T1. This similarity in production levels between the two treatments and the decrease in water use in T1 allowed irrigation water productivity to increase by between 36% and 52%; therefore, a determination of theoretical irrigation water demand allows better use of water resources.

Author Contributions

Conceptualization, S.Q., E.H. and J.J.; methodology, S.Q. and E.H.; software, S.Q.; formal analysis, S.Q., E.H., R.M.B. and J.J.; investigation, S.Q.; resources, E.H.; data curation, S.Q.; writing—original draft preparation, S.Q. and J.J.; writing—review and editing, J.J., E.H. and R.M.B.; visualization, S.Q., J.J.; supervision, E.H.; project administration, E.H.; funding acquisition, E.H. All authors have read and agreed to the published version of the manuscript.

Funding

This research was funded by ANID/FONDAP/15130015: Water Research Center for Agriculture and Mining (CRHIAM), Chile.

Data Availability Statement

Not applicable.

Acknowledgments

The authors are grateful to the: Water Research Center for Agriculture and Mining ANID/FONDAP/15130015 and the COPEFRUT for their support of this research study. We also thank Elías Fereres for his valuable editorial comments.

Conflicts of Interest

The authors declare no conflict of interest. The funders had no role in the design of the study; in the collection, analyses, or interpretation of data; in the writing of the manuscript; or in the decision to publish the results.

References

  1. Alvarez-Garreton, C.; Pablo Boisier, J.; Garreaud, R.; Seibert, J.; Vis, M. Progressive Water Deficits during Multiyear Droughts in Basins with Long Hydrological Memory in Chile. Hydrol. Earth Syst. Sci. 2021, 25, 429–446. [Google Scholar] [CrossRef]
  2. Boisier, J.P.; Rondanelli, R.; Garreaud, R.D.; Muñoz, F. Anthropogenic and Natural Contributions to the Southeast Pacific Precipitation Decline and Recent Megadrought in Central Chile. Geophys. Res. Lett. 2016, 43, 413–421. [Google Scholar] [CrossRef] [Green Version]
  3. Ministerio de Obras Públicas, Dirección General de Aguas. Estimación de La Demanda Actual, Proyecciones Futuras y Caracterización de La Calidad Los Recursos Hídricos en Chile: Resumen Ejecutivo S.I.T. N°419; Hídrica Consultores SPA y Aquaterra Ingenieros Ltda (UTP): Santiago, Chile, 2017; Available online: https://dga.mop.gob.cl/Estudios/01%20Informe/Informe%20Final%20Vol%20II.pdf (accessed on 1 October 2022).
  4. ODEPA-CIREN. Catastro Frutícola, Principales Resultados; ODEPA-CIREN: Santiago, Chile, 2019; Available online: https://bibliotecadigital.ciren.cl/handle/20.500.13082/28954 (accessed on 20 September 2021).
  5. ODEPA-CIREN. Catastro Frutícola, Principales Resultados; ODEPA-CIREN: Maule, Chile, 2016; Available online: http://bibliotecadigital.ciren.cl/bitstream/handle/123456789/26205/Cfpr_VIIR_2016.pdf?sequence=1&isAllowed=y (accessed on 20 September 2021).
  6. Olmos, X. Sostenibilidad Ambiental de Las Exportaciones Agroalimentarias. Los Casos de Chile, Colombia, El Ecuador y El Uruguay; CEPAL-ECLAC: Santiago, Chile, 2017; Available online: http://hdl.handle.net/11362/43288 (accessed on 20 September 2021).
  7. Callejas, R.; Reyes, R. Estrategias Para Enfrentar Condiciones de Sequía En Frutales. Rev. Frutícola 2019, 41, 8–16. Available online: https://hdl.handle.net/20.500.14001/63489 (accessed on 20 September 2021).
  8. Zhong, Y.; Fei, L.; Li, Y.; Zeng, J.; Dai, Z. Response of Fruit Yield, Fruit Quality, and Water Use Efficiency to Water Deficits for Apple Trees under Surge-Root Irrigation in the Loess Plateau of China. Agric. Water Manag. 2019, 222, 221–230. [Google Scholar] [CrossRef]
  9. Holzapfel, E.; Arumí, J.L. Tecnología de Manejo de Agua Para Una Agricultura Intensiva Sustentable, 1st ed.; Holzapfel, E., Arumí, J.L., Eds.; Universidad de Concepción: Concepción, Chile, 2010; ISBN 9789562273299. [Google Scholar]
  10. Girona, J.; Behboudian, M.H.; Mata, M.; del Campo, J.; Marsal, J. Exploring Six Reduced Irrigation Options under Water Shortage for “Golden Smoothee” Apple: Responses of Yield Components over Three Years. Agric. Water Manag. 2010, 98, 370–375. [Google Scholar] [CrossRef]
  11. Naor, A. Crop load and irrigation interactions-a new dimension of RDI. Acta. Hortic. 2014, 1038, 113–120. [Google Scholar] [CrossRef]
  12. Francaviglia, D.; Farina, V.; Avellone, G.; Lo Bianco, R. Fruit yield and quality responses of apple cvars Gala and Fuji to partial rootzone drying under Mediterranean conditions. J. Agric. Sci. 2013, 151, 556–569. [Google Scholar] [CrossRef]
  13. Du, S.; Kang, S.; Li, F.; Du, T. Water use efficiency is improved by alternate partial root-zone irrigation of apple in arid northwest China. Agric. Water Manag. 2017, 179, 184–192. [Google Scholar] [CrossRef]
  14. Liao, Y.; Cao, H.X.; Xue, W.K.; Liu, X. Effects of the combination of mulching and deficit irrigation on the soil water and heat, growth and productivity of apples. Agric. Water Manag. 2021, 243, 106482. [Google Scholar] [CrossRef]
  15. Lecaros, F.; Holzapfel, E.; Fereres, E.; Rivera, D.; Muñoz, N.; Jara, J. Effects of the Number of Drip Laterals on Yield and Quality of Apples Grown in Two Soil Types. Agric. Water Manag. 2021, 248, 106781. [Google Scholar] [CrossRef]
  16. Küçükyumuk, C.; Yildiz, H.; Meriç, M.K. The Response of Braeburn Apple to Regulated Deficit Irrigation. J. Agric. Sci. 2020, 26, 154–163. [Google Scholar] [CrossRef]
  17. Küçükyumuk, C.; Kaçal, E.; Ertek, A.; Öztürk, G.; Kurttaş, Y.S.K. Pomological and Vegetative Changes during Transition from Flood Irrigation to Drip Irrigation: Starkrimson Delicious Apple Variety. Sci. Hortic. 2012, 136, 17–23. [Google Scholar] [CrossRef]
  18. Silveira, L.K.; Pavão, G.C.; dos Santos Dias, C.T.; Quaggio, J.A.; Pires, R.C.d.M. Deficit Irrigation Effect on Fruit Yield, Quality and Water Use Efficiency: A Long-Term Study on Pêra-IAC Sweet Orange. Agric. Water Manag. 2020, 231, 106019. [Google Scholar] [CrossRef]
  19. CIREN. Estudio Agrológico VII Región: Descripciones de Suelos, Materiales y Símbolos. 1997. Available online: https://bibliotecadigital.ciren.cl/handle/20.500.13082/2276 (accessed on 1 October 2022).
  20. Del Pozo, A.; Del Canto, P. Áreas Climáticas y Sistemas de Producción en la VII y VII Regiones; Instituto de Investigaciones Agropecuarias, Quilamapu: Chillán, Chile, 1999. [Google Scholar]
  21. Klute, A. Methods of Soil Analysis, Part 1: Physical and Minerological Methods, 2nd ed.; American Society of Agronomy, Inc.: Madison, WI, USA; Soil Science Society of America, Inc.: Madison, WI, USA, 1986; Volume 1, ISBN 9780891188643. [Google Scholar]
  22. Bouyoucos, G. Hydrometer Method Improved for Making Particle Size Analyses of Soils. Agron. J. 1962, 54, 464–465. [Google Scholar] [CrossRef]
  23. Holzapfel, E.; Hepp, R.; Mariño, M. Effect of Irrigation on Fruit Production in Blueberry. Agric. Water Manag. 2004, 67, 173–184. [Google Scholar] [CrossRef]
  24. Allen, R.; Pereira, L.; Raes, D.; Smith, M. Crop Evapotranspiration—Guidelines for Computing Crop Water Requirements—FAO Irrigation and Drainage Paper 56; FAO: Rome, Italy, 1998. [Google Scholar]
  25. Fereres, E.; Goldhamer, D.A. Deciduous fruit and nut trees. In Irrigation of Agricultural Crops. Agronomy Monograph 30; Stewart, B.A., Nielsen, D.R., Eds.; ASA-CSSA-SSSA: Madison, WI, USA, 1990; pp. 987–1017. ISBN 0-891188-102-4. [Google Scholar]
  26. Jeelani, M.I.; Nazir, N.; Sharma, M.K.; Bhat, A.; Gul, M.; Kumar, B. R Codes for Randomized Complete Design. Int. J. Inf. Sci. Syst. 2018, 6, 1–8. [Google Scholar]
  27. ECLAC. The Chilean Earthquake of 27 February 2010: An Overview; United Nations Publication: Santiago, Chile, 2010; LC/R 2160; 32p, Available online: https://repositorio.cepal.org/bitstream/handle/11362/3161/S2010191_en.pdf?sequence=1 (accessed on 20 September 2021).
  28. Ortega, S.; Carrasco, M.; Morales, R. Optimización Del Uso Del Agua y Rendimiento En Un Huerto Comercial de Manzanos (Cv Royal Gala). Rev. Frutícola 2014, 1, 10–16. Available online: https://hdl.handle.net/20.500.14001/40743 (accessed on 10 October 2020).
  29. Girona, J. Estrategias de Riego En Frutales Bajo Condiciones de Sequía; IRTA: Catalunya, Spain, 2007; Available online: http://www.recercat.cat/handle/2072/4676 (accessed on 21 September 2021).
  30. Green, S.; Clothier, B. The Root Zone Dynamics of Water Uptake by a Mature Apple Tree. Plant Soil 1999, 206, 61–77. [Google Scholar] [CrossRef]
  31. Leib, B.G.; Caspari, H.W.; Redulla, C.A.; Andrews, P.K.; Jabro, J.J. Partial Rootzone Drying and Deficit Irrigation of “Fuji” Apples in a Semi-Arid Climate. Irrig. Sci. 2006, 24, 85–99. [Google Scholar] [CrossRef]
  32. Özmen, S. Responses to Irrigation onto Apple Tree Grown under the Farmer Condition: A Case Study of Düzce Region. J. Tekirdag Agric. Fac. 2016, 13, 37–47. [Google Scholar]
  33. Bhusal, N.; Han, S.G.; Yoon, T.M. Impact of Drought Stress on Photosynthetic Response, Leaf Water Potential, and Stem Sap Flow in Two Cultivars of Bi-Leader Apple Trees (Malus × Domestica Borkh.). Sci. Hortic. 2019, 246, 535–543. [Google Scholar] [CrossRef]
  34. Naor, A.; Klein, I.; Doron, I. Stem Water Potential and Apple Size. J. Am. Soc. Hort. Sci. 1995, 120, 577–582. [Google Scholar] [CrossRef] [Green Version]
  35. Mpelasoka, B.S.; Behboudian, M.H.; Gree, S.H. Water Use, Yield and Fruit Quality of Lysimeter-Grown Apple Tree Responses to Deficit Irrigation and Crop Load. Irrig. Sci. 2001, 20, 107–113. [Google Scholar] [CrossRef]
  36. Parra, R.; Ortiz, P.; Amado, J.; Chávez, N. Productividad y Crecimiento de Manzano Bajo Déficit de Riego Controlado. Terra Latinoam. 2009, 27, 337–343. [Google Scholar]
  37. Assaf, R.; Levin, I.; Bravdo, B. Effect of Irrigation Regimes on Trunk and Fruit Growth Rates, Quality and Yield of Apple Trees. J. Hortic. Sci. 1975, 50, 481–493. [Google Scholar] [CrossRef]
  38. Martins, C.; Lima, W.; Bezerra, J.; Coelho, P.; Jurema, E.; da Silva, B. Flowering, Fruiting and Physiology of Apple Tree under Different Irrigation Levels in the Brazilian Semiarid Region. Comun. Sci. 2017, 8, 99–108. [Google Scholar] [CrossRef] [Green Version]
  39. Osorio, A. Determinación de La Huella Del Agua y Estrategias de Manejo de Recursos Hídricos; Instituto de Investigaciones Agropecuarias, Centro Regional de Investigación Intihuasi: La Serena, Chile, 2013; Available online: https://hdl.handle.net/20.500.14001/8621 (accessed on 1 October 2022).
  40. Tong, X.; Wu, P.; Liu, X.; Zhang, L.; Zhou, W.; Wang, Z. A Global Meta-Analysis of Fruit Tree Yield and Water Use Efficiency under Deficit Irrigation. Agric. Water Manag. 2022, 260, 107321. [Google Scholar] [CrossRef]
  41. Steduto, P.; Hsiao, T.; Fereres, E.; Raes, D. Respuesta Del Rendimiento de Los Cultivos al Agua; FAO: Roma, Italy, 2012; ISBN 978-92-5-308564-4. [Google Scholar]
  42. Parra-Quezada, R.A.; Robinson, T.L.; Osborne, J.; Parra-Bujanda, L.B. Efecto de Carga de Fruto y Déficit Hídrico en la Calidad y Producción de Manzana. Rev. Chapingo Ser. Hortic. 2008, 14, 49–54. [Google Scholar] [CrossRef]
  43. FAO. Codex Standard Por Apples. Codex Stan 299–2010. 2010. Available online: http://www.fao.org/fao-who-codexalimentarius/sh-proxy/en/?lnk=1&url=https%253A%252F%252Fworkspace.fao.org%252Fsites%252Fcodex%252FStandards%252FCODEX%2BSTAN%2B299-2010%252FCXS_299e.pdf (accessed on 1 October 2022).
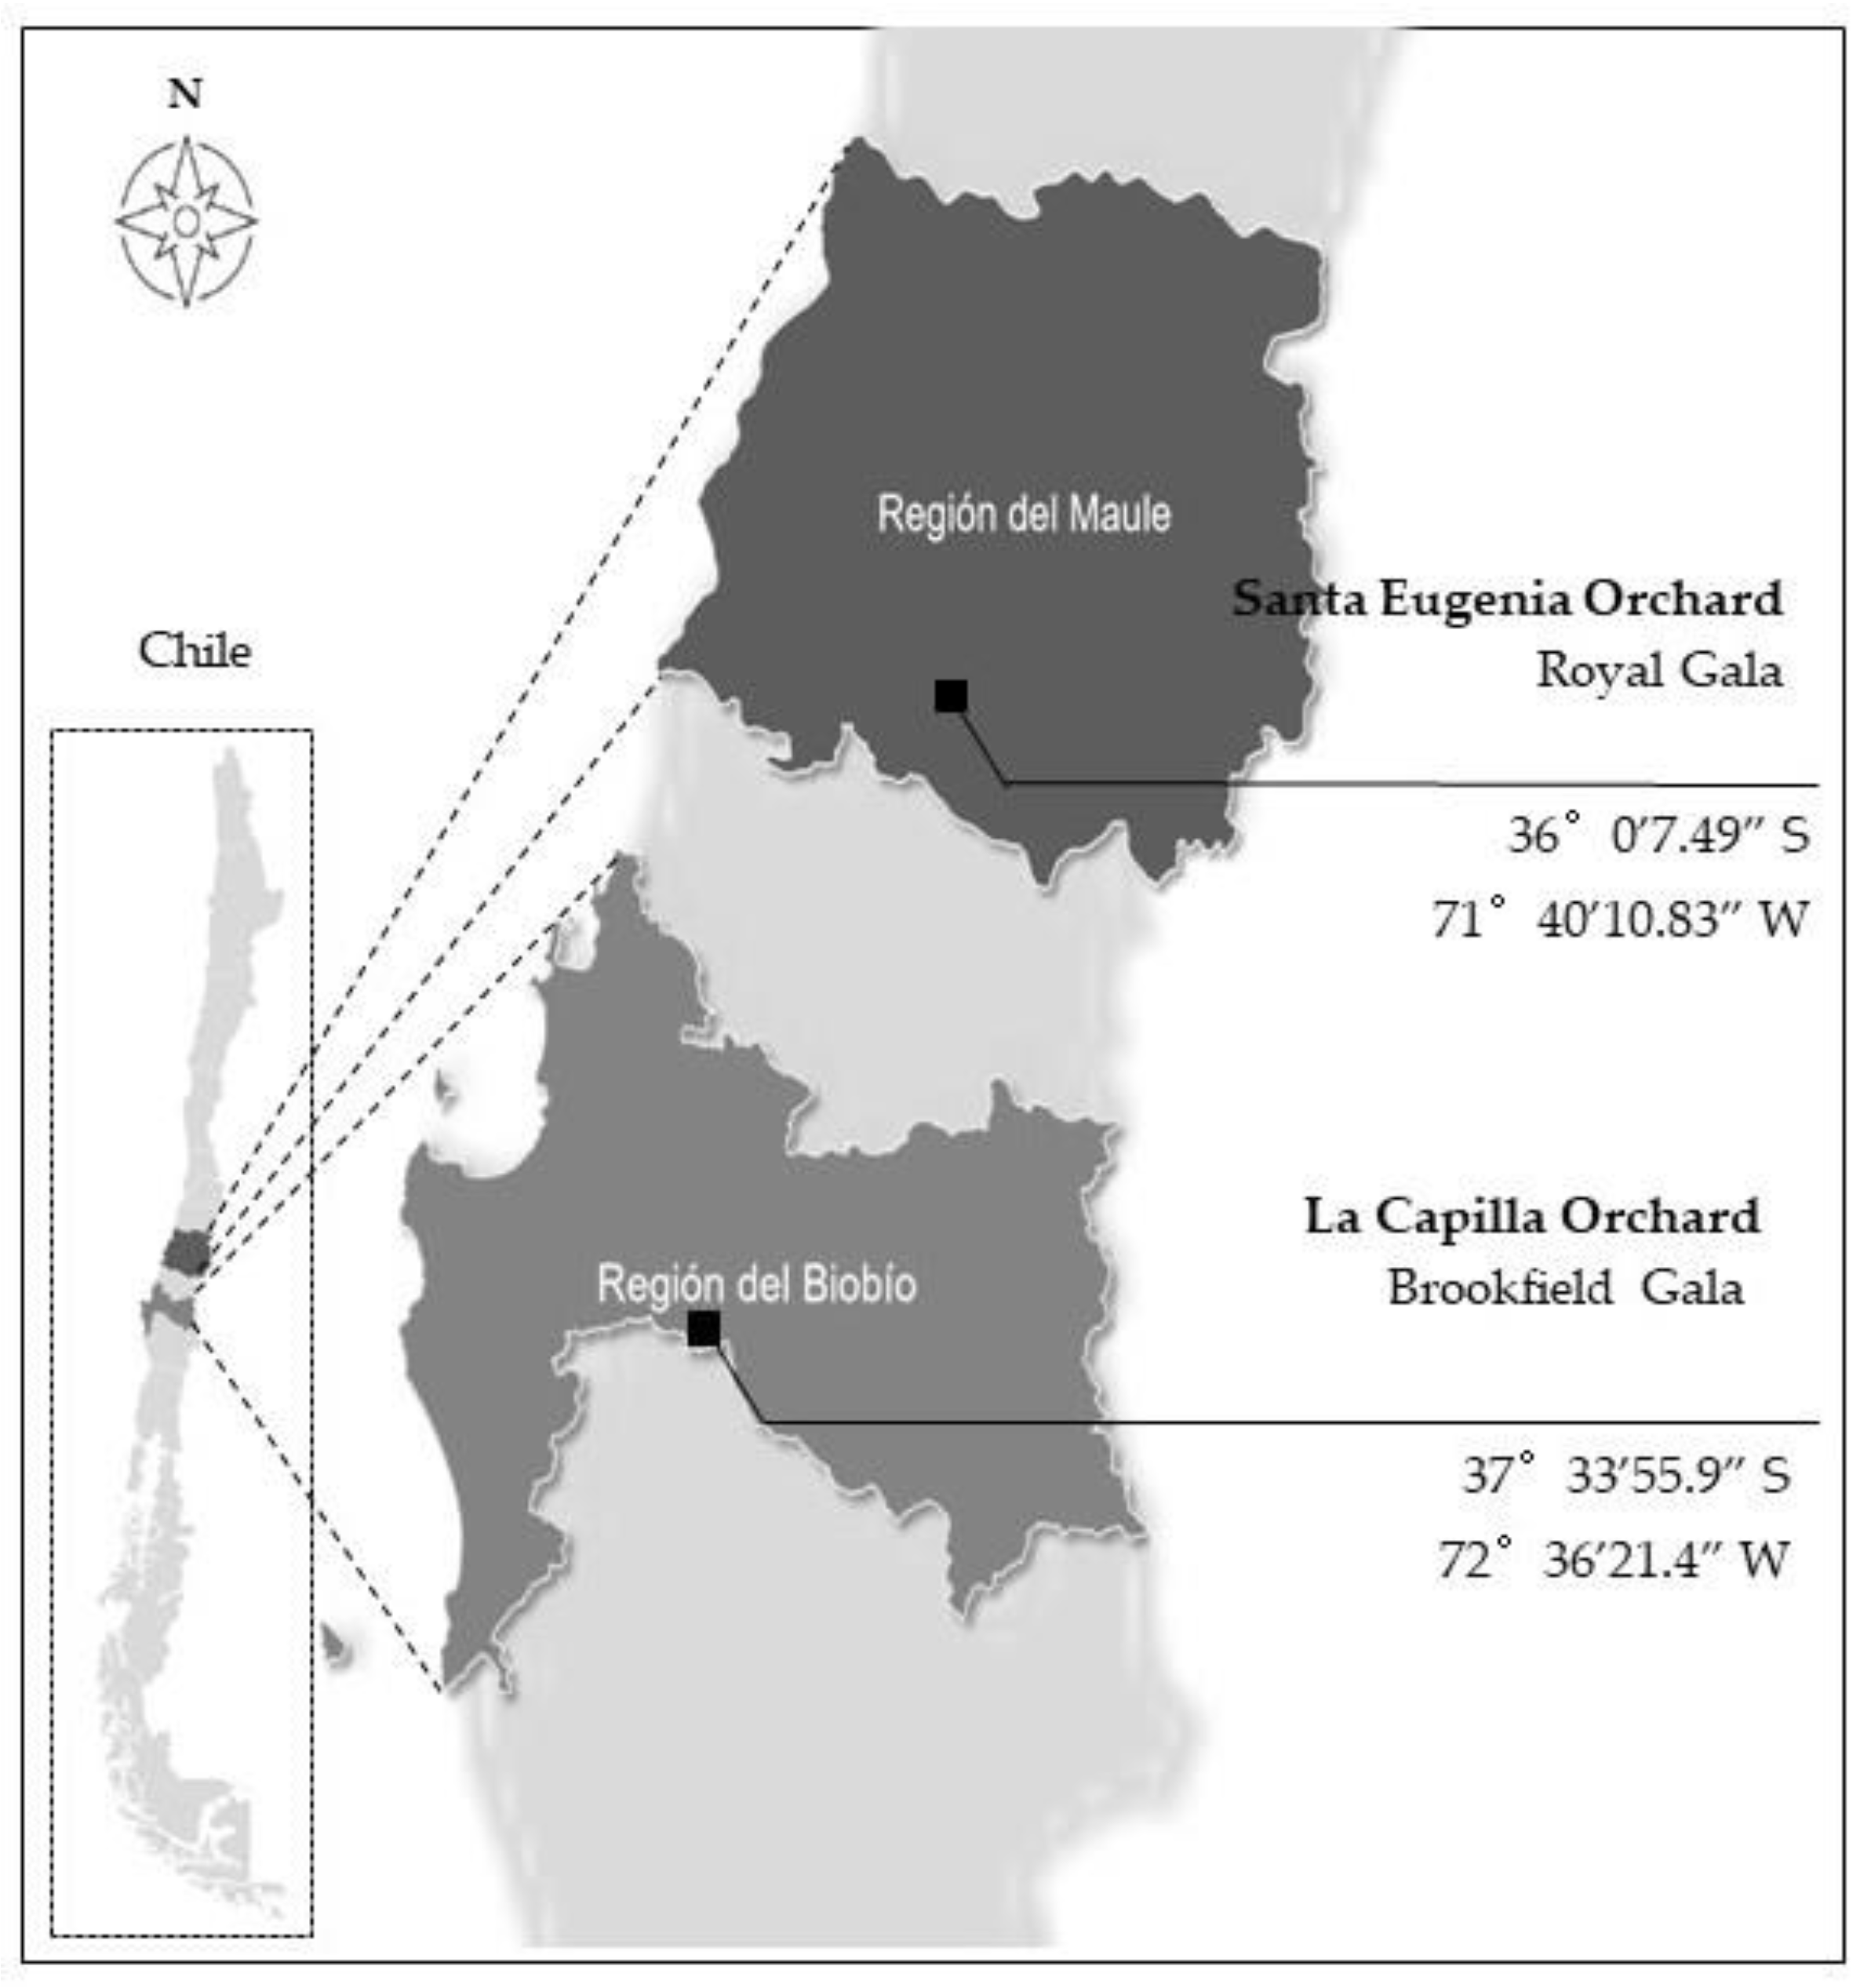
Figure 1. Locations of Santa Eugenia-Orchard (‘Royal Gala’ apple orchard) and La Capilla-Orchard (‘Brookfield Gala’ apple orchard).
Water 14 03441 g001
Figure 2. Irrigation scheme and locations of neutron probe access tubes in (a) ‘Royal Gala’ and (b) ‘Brookfield Gala’ apple orchards.
Water 14 03441 g002
Figure 3. Cumulative applied water during the 2008–2009 and 2009–2010 irrigation seasons in two water application treatments via microjet irrigation of ‘Royal Gala’ apple trees. T1: Irrigation with theoretical volume of water required by the plant. T2: Irrigation with farm protocol.
Water 14 03441 g003
Figure 4. Cumulative applied water during the 2008–2009 and 2009–2010 irrigation seasons in two water application treatments via drip irrigation of ‘Brookfield Gala’ apple trees. T1: Irrigation with theoretical volume required by plant. T2: Irrigation with farm protocol.
Water 14 03441 g004
Figure 5. Cycles of soil moisture content before and one day after irrigation in the (a,d) 0–30 cm, (b,e) 30–60 cm, and (c,f) 60–90 cm strata throughout the 2008–2009 irrigation season for two microjet irrigation treatments of ‘Royal Gala’ apple trees. T1: Irrigation with theoretical volume required by the plant. T2: Irrigation with farm protocol. Each point is the average of 12 readings. FC is field capacity and PWP is permanent wilting point.
Water 14 03441 g005aWater 14 03441 g005b
Figure 6. Cycles of soil moisture content before and one day after irrigation in the (a,d) 0–30 cm, (b,e) 30–60 cm, and (c,f) 60–90 cm strata throughout the 2009–2010 irrigation season for two microjet irrigation treatments of ‘Royal Gala’ apple trees. T1: Irrigation with theoretical volume required by the plant. T2: Irrigation with farm protocol. Each point is the average of 12 readings. FC is field capacity and PWP is permanent wilting point.
Water 14 03441 g006aWater 14 03441 g006b
Figure 7. Cycles of soil moisture content before irrigation in the (a,e) 0–30 cm, (b,f) 30–60 cm, (c,g) 60–90 cm, and (d,h) 90–120 cm strata throughout the 2008–2009 irrigation season for two drip irrigation treatments of ‘Brookfield Gala’ apple trees. T1: Irrigation with a theoretical volume required by the plant. T2: Irrigation with farm protocol. Each point is the average of 12 readings. FC is field capacity and PWP is permanent wilting point. The moisture content measurement points are P1: 60 cm from the trunk between rows, P2: 30 cm from the trunk within the row, and P3: 60 cm from the trunk within the row.
Water 14 03441 g007
Figure 8. Evolution of soil moisture content before irrigation in the (a,e) 0–30 cm, (b,f) 30–60 cm, (c,g) 60–90 cm, and (d,h) 90–120 cm strata throughout the 2009–2010 irrigation season for two drip irrigation treatments of ‘Brookfield Gala’ apple trees. T1: Irrigation with theoretical volume required by the plant. T2: Irrigation with farm protocol. Each point is the average of 12 readings. FC is field capacity and PWP is permanent wilting. The moisture content measurement points are P1: 60 cm from the trunk between rows, P2: 30 cm from the trunk within the row, and P3: 60 cm from the trunk within the row.
Water 14 03441 g008
Figure 9. Hourly evolution of leaf water potential (ΨH) in ‘Royal Gala’ apple trees for two water application treatments during the 2008–2009 season on: (a) 15–01–2009, (b) 01–02–2009, and (c) 15–02–2009, and during the 2009–2010 season on: (d) 15–01–2010, (e) 15–02–2010, and (f) 15–03–2010 (date: day-month-year). Each point is the average of eight repetitions. Means with the same letter for the same hour indicate that there are no significant differences according to the ANOVA test (p < 0.05). T1: Irrigation with theoretical volume required by the plant. T2: Irrigation with farm protocol.
Water 14 03441 g009
Figure 10. Hourly evolution of leaf water potential (ΨH) in ‘Brookfield Gala’ apple trees for two water application treatments during the 2008–2009 season on: (a) 17–02–2009, (b) 20–02–2009, and (c) 24–02–2009, and during the 2009–2010 season on: (d) 04–03–2010, (e) 06–03–2010, and (f) 10–03–2010 (date: day-month-year). Each point is the average of eight repetitions. Means with the same letter for the same hour indicate that there are no significant differences according to the ANOVA test (p < 0.05). T1: Irrigation with theoretical volume required by the plant. T2: Irrigation with farm protocol.
Water 14 03441 g010
Table 1. Correction factor Fc and parameters K1, K2, and P, for the 2008–2009 and 2009–2010 seasons for ‘Royal Gala’ and ‘Brookfield Gala’ apple trees.
‘Royal Gala’‘Brookfield Gala’
Parameter2008–2009
Season
2009–2010
Season
2008–2009
Season
2009–2010
Season
K11.281.281.541.54
K20.110.110.110.11
P0.700.700.450.47
Notes: K1, K2: linear correlation constants; P: average shade fraction in the irrigation season.
Table 2. Irrigation characteristics in commercial orchards of ‘Royal Gala’ and ‘Brookfield Gala’ apple trees in the 2008–2009 and 2009–2010 seasons.
Treatment‘Royal Gala’‘Brookfield Gala’
2008–2009
Season
2009–2010
Season
2008–2009
Season
2009–2010
Season
Irrigation frequency (days)
T1331 to 31 to 3
T23 to 63 to 61 to 31 to 3
Irrigation time (hours per irrigation)
T1 (Equation (4))3 to 6 3 to 6 1 to 4 1 to 4
T210104 to 83 to 6
Notes: T1: Irrigation with theoretical volume required by the plant. T2: Irrigation with farm protocol.
Table 3. ‘Royal Gala’ and ‘Brookfield Gala’ apple production for two water application treatments during the 2008–2009 and 2009–2010 seasons.
SeasonTreatmentFruit Yield (t ha−1)
‘Royal Gala’‘Brookfield Gala’
2008–2009T146.2 a34.3 a
T244.3 a27.9 b
2009–2010T145.3 a33.4 a
T243.3 a37.2 a
Notes: Means with the same letter for the same season and variety indicate that there are no significant differences according to the ANOVA test (p < 0.05). T1: Irrigation with theoretical volume required by the plant. T2: Irrigation with farm protocol.
Table 4. Number of fruits per ‘Brookfield Gala’ apple tree at harvest for two water application treatments during the 2008–2009 and 2009–2010 seasons.
SeasonTreatmentNumber of Fruits per Tree
2008–2009T168 a
T253 b
2009–2010T162 a
T293 b
Notes: Means with the same letter for the same season indicate that there are no significant differences according to the ANOVA test (p < 0.05). T1: Irrigation with theoretical volume required by the plant. T2: Irrigation with farm protocol.
Table 5. Water productivity in ‘Brookfield Gala’ and ‘Royal Gala’ apple trees in two seasons and two irrigation management treatments.
SeasonTreatmentWater Use Efficiency (kg m−3)
‘Royal Gala’‘Brookfield Gala’
2008–2009T17.445.04
T25.643.24
2009–2010T19.169.54
T26.346.83
Notes: T1: Irrigation treatment with a theoretical volume required by the plant. T2: Treatment in accordance with farm protocol.
Table 6. Fruit quality in ‘Royal Gala’ and ‘Brookfield Gala’ apple trees at harvest for two water application treatments during the 2008–2009 and 2009–2010 seasons.
Treatment‘Royal Gala’‘Brookfield Gala’
2008–2009
Season
2009–2010
Season
2008–2009
Season
2009–2010
Season
Equatorial diameter (mm)
T17.4 a6.8 a8.0 a7.6 a
T27.5 a6.5 a8.0 a7.2 b
Fruit weight (g)
T1171.6 a195.7 a210.0 a197.3 a
T2172.1 a192.8 a215.0 a171.9 b
Notes: Means with the same letter for the same season and variety indicate that there are no significant differences according to the ANOVA test (p < 0.05). T1: Irrigation with theoretical volume required by the plant. T2: Irrigation with farm protocol.
Publisher’s Note: MDPI stays neutral with regard to jurisdictional claims in published maps and institutional affiliations.