Article

Macroinvertebrate-Based Biomonitoring of Coastal Wetlands in Mediterranean Chile: Testing Potential Metrics Able to Detect Anthropogenic Impacts

1
Department of Wetland Ecology, Estación Biológica de Doñana, EBD-CSIC, Américo Vespucio 26, 41092 Sevilla, Spain
2
Bahía Lomas Research Center, Universidad Santo Tomás, Santiago 8370003, Chile
3
Instituto de Ciencias Marinas y Limnológicas, Universidad Austral de Chile, Valdivia 5090000, Chile
4
Núcleo Milenio INVASAL, Concepción 4030000, Chile
*
Author to whom correspondence should be addressed.
Water 2022, 14(21), 3449; https://doi.org/10.3390/w14213449
Submission received: 12 October 2022 / Revised: 26 October 2022 / Accepted: 27 October 2022 / Published: 29 October 2022
(This article belongs to the Section Biodiversity and Functionality of Aquatic Ecosystems)

Abstract

:
Coastal wetlands are suffering from anthropogenic alterations worldwide. Aquatic monitoring based on macroinvertebrates has been successfully used to assess the ecological condition of many aquatic systems worldwide. Nonetheless, studies are still insufficient for the coastal wetlands of the South Pacific. Here, we present a preliminary attempt to select metrics based on aquatic macroinvertebrates to incorporate into coastal wetlands biomonitoring in the Chilean Mediterranean ecoregion. We sampled 25 sites in ten coastal wetlands during the austral spring of 2019. We used an integrated index that considers both human activities at catchment and at local scales to identify sites less or more disturbed. We tested a total of 70 metrics (either traditional or new metrics) representing different aspects of community structure/composition, functions and tolerance to pollution. Two metrics were finally retained: detritivore abundance (traditional metric) and geometric mean body size (new metric). These metrics were able to detect sites impacted by human activities. Thus, they might be considered as candidate metrics for the biomonitoring of these systems and to develop future indices. Moreover, because of their generality, they might also be applicable to coastal wetlands in other Mediterranean regions, including sites where taxonomic identification is still a challenge.

1. Introduction

Coastal wetlands are dynamic environments between the land and the sea that provide a wide range of benefits to human wellbeing, e.g., water and food supply, biodiversity sustaining and protection from natural events such as storm surge and tsunamis [1]. However, they have experienced profound alterations due to human activities (e.g., agriculture, urbanization), which strongly modified hydrology, water quality and the associated biological communities [2,3,4,5]. Approximately 63% of all coastal wetlands have been lost since 1900 [6]; the remaining wetlands in coastal areas are still suffering extensive modifications, mainly as a consequence of increases in population and urbanization and massive tourism development [7]. Thus, developing tools to assess the ecological condition of coastal wetlands is critical to support correct and efficient management and conservation strategies.
Biological monitoring using bioindicators is key for detecting and quantifying human impacts on wetlands [8]. Hundreds of methods have been developed in the last few decades [9], most based on macroinvertebrates, because they have limited movements and traits variation and are sensitivity to anthropogenic and natural stressors [9,10,11]. Biological monitoring using multimetric indices (MMIs) has become popular worldwide to evaluate the ecological condition of different types of aquatic ecosystems, including streams, ponds, wetlands and lagoons, among others [12,13,14,15,16]. This is because MMIs combine various aspects of the biological community responsive to human impacts (e.g., richness, diversity, function, pollution tolerance (see [17])) into a single measure, and MMIs can allow the classification and identification of the cause of degradation. Nonetheless, only a few MMIs have been produced for transitional waters such as coastal wetlands [9], although system MMIs seem more consistent than individual metrics in detecting anthropogenic pressures [18].
There are hundreds of wetlands scattered along the coastline in Chile, but only recently have they started to receive attention for conservation and biomonitoring [5,19]. Coastal wetlands in Chile are valuable systems of high social and ecological importance [20]. Nonetheless, many of them have been lost in the past, especially in the Mediterranean zone of Chile (25–39 °S), where ca. 73% of the national population live [5,21], and land uses (agriculture, livestock production and industries) have had and still have great impacts on water resources [22,23]. Nonetheless, biomonitoring studies of these systems are still lacking. Understanding how human activities affect these ecosystems in the Mediterranean region is therefore a priority for their conservation. This necessitates identifying potential metrics for biomonitoring that can also be used to develop new tools, such as the MMI, to identify which wetlands deserve priority for conservation.
With this aim, we studied 10 coastal wetlands in two regions of Mediterranean Chile (Valparaiso and Coquimbo). The former has suffered more intense urbanization and greater pressures due to tourism than the latter [24]. This study represents the first attempt to select and test metrics based on macroinvertebrates for the monitoring of coastal wetlands in the Chilean Mediterranean ecoregion.

2. Materials and Methods
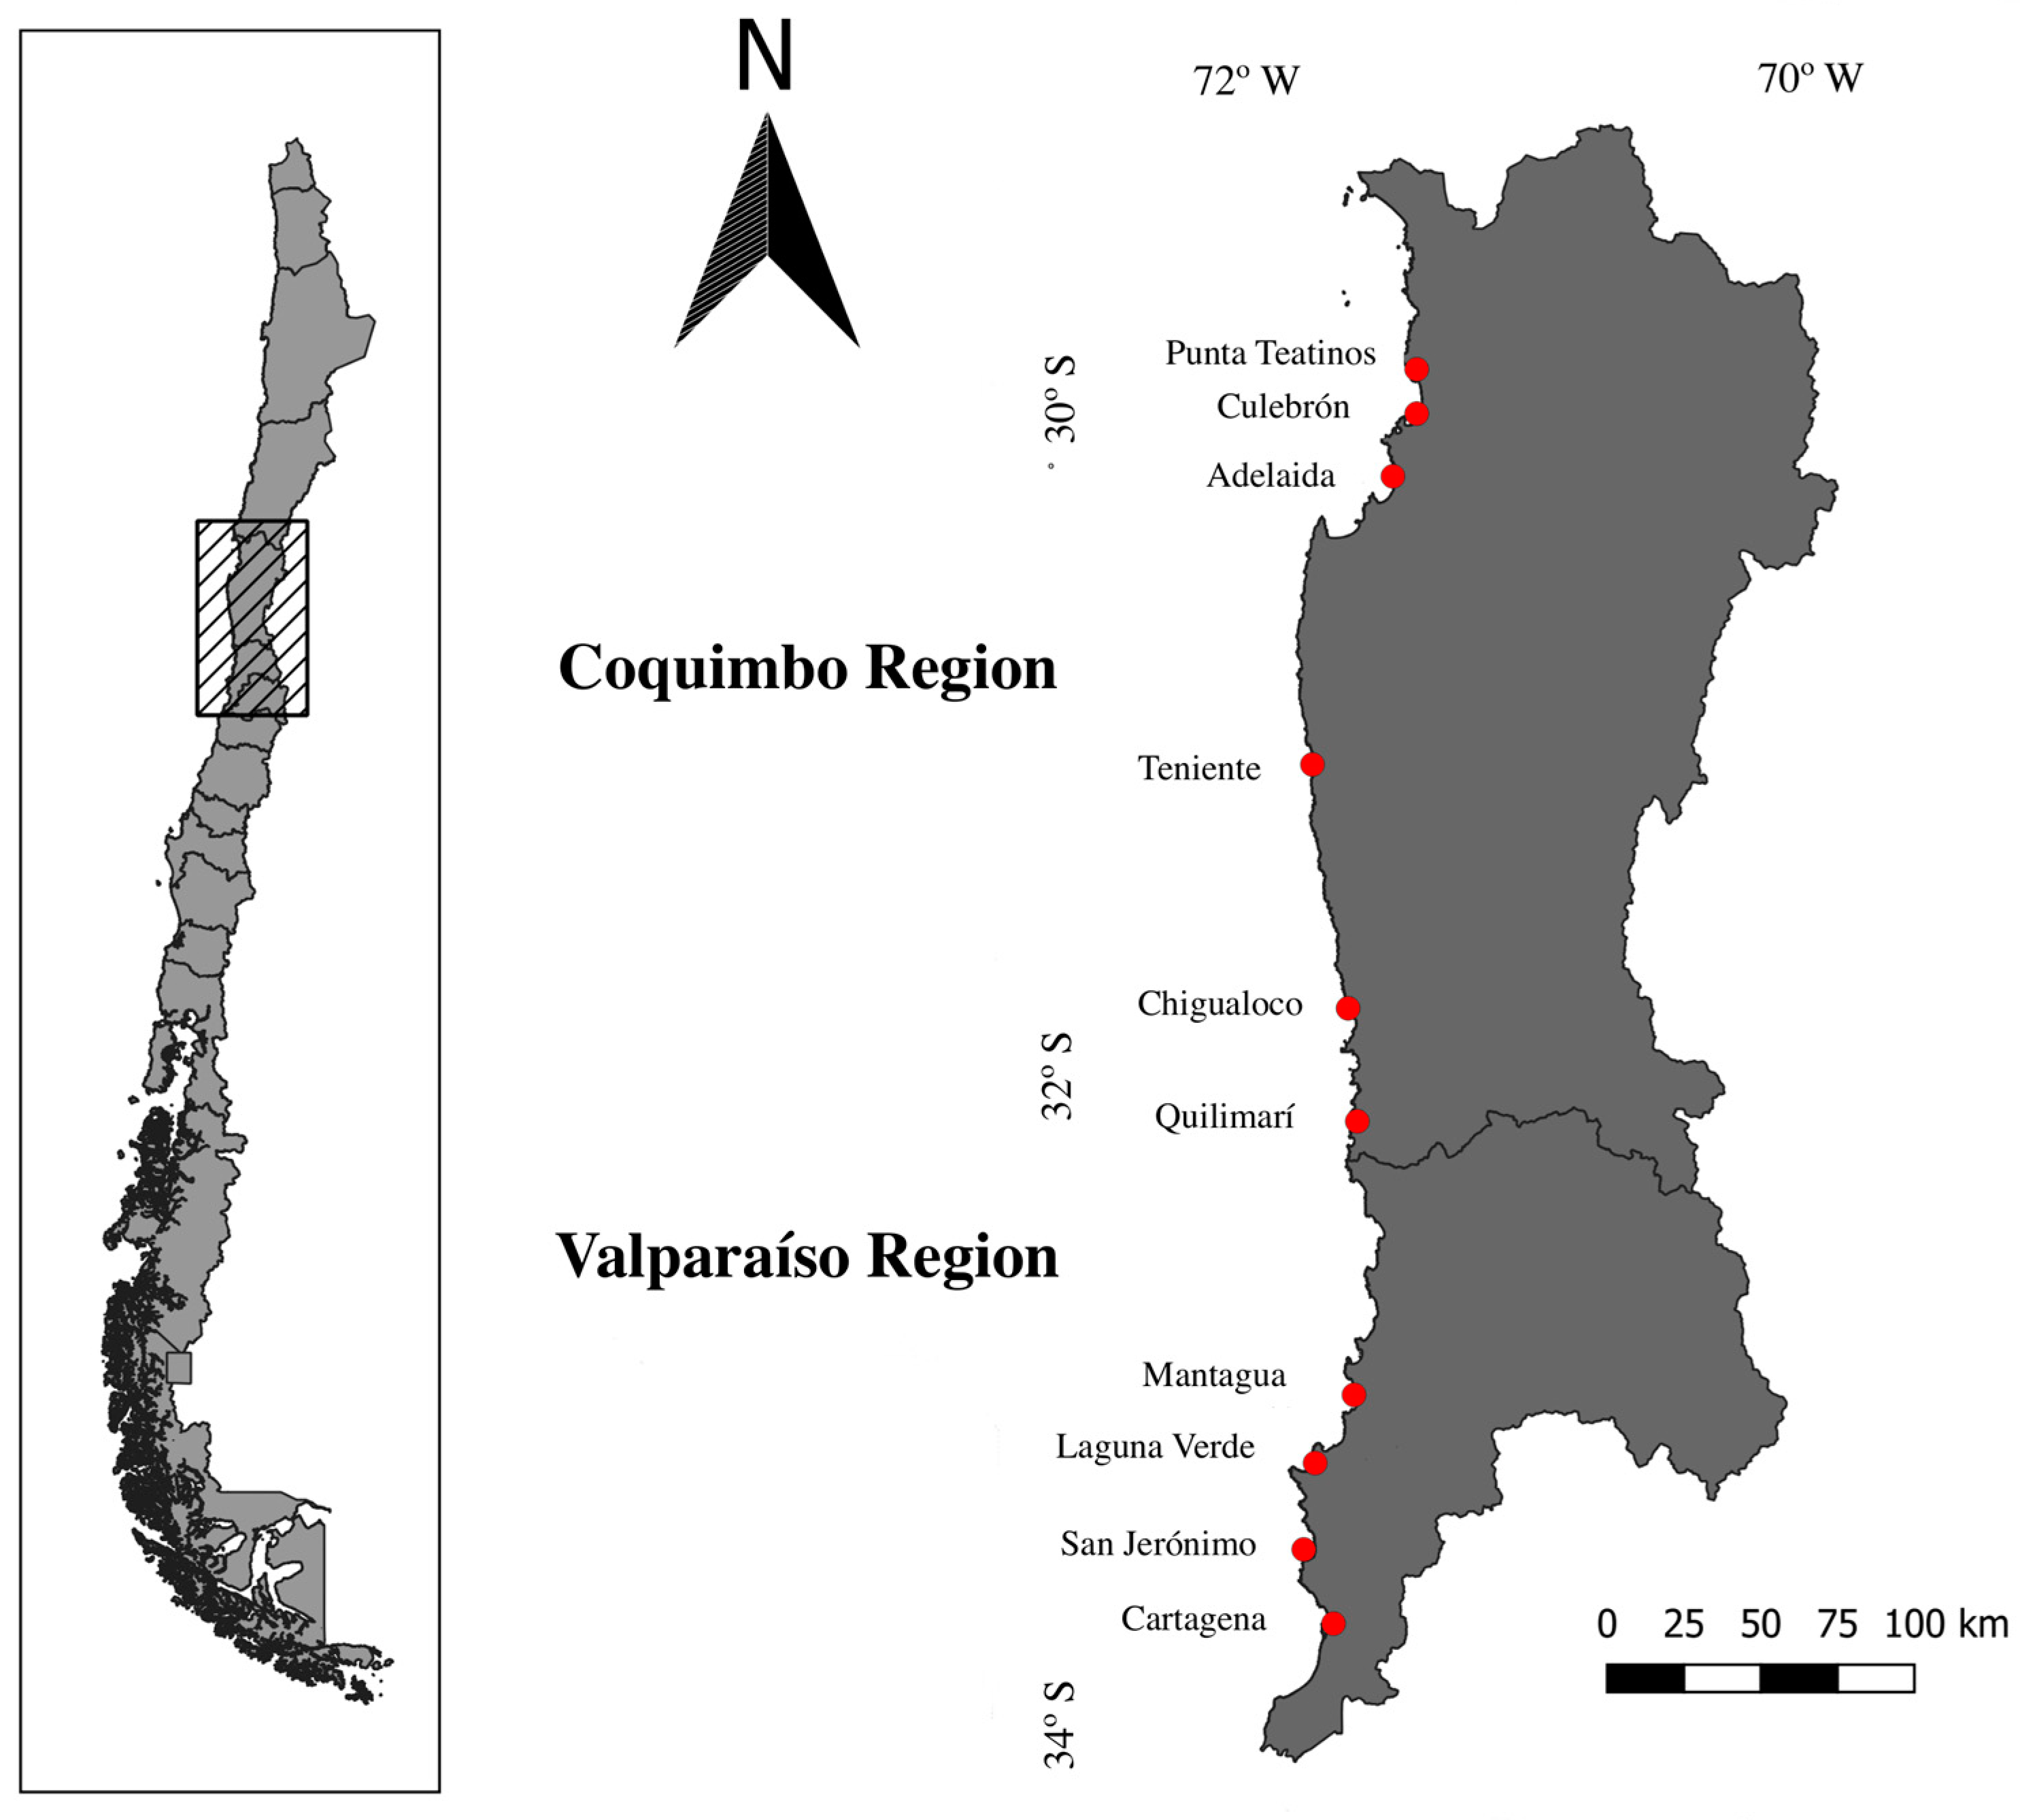
2.1. Study Sites

The selected wetlands lie between 29°49′ S and 33°45′ S, along the Chilean coast (Figure 1). This area corresponds to the arid and semi-arid Mediterranean climate of Chile.
All wetlands showed sand barriers that influence the connections to the sea and exhibited semidiurnal tides but with variations in frequency and range (see [25] for details). Of the ten wetlands, five (from Punta Teatinos to Chigualoco) are distributed within the arid Mediterranean climate, and five (from Quilimarí to Cartagena) are in the semi-arid Mediterranean climate. The studied wetlands have variable sizes ranging from 4.3 ha to 27.9 (https://humedaleschile.mma.gob.cl/inventario-humadales/catastro/ (accessed 22 September 2022)) and are either urban or rural [26,27].
The main local threats to these wetlands were visitors, pets, vehicles, and rubbish [27].
Samples were collected once in 2019 during the Austral spring, as this season should present the best conditions (e.g., water flow, habitat variability) to detect anthropogenic disturbances in wetlands according to Vadas et al. [16]. Sampling was conducted in three sites within each wetland: one site closer to the sea, one in the middle and one in the upper part (see an example on Figure S1)). These sites were selected to ensure gradients of human usage and habitat variations. Maximum distances between sampling sites ranged from 113 to 1160 m.

2.2. Environmental Data

At each site, we measured water salinity (psu), pH and temperature (°C) with a YSI ProDSS multiparameter, and we collected water samples for further laboratory analyses. Once at the laboratory, the Chlorophyll-a concentration (μlg/L) of each site was determined using methanol extraction with a spectrophotometer (TECAN 200). Nitrite, phosphate and silicate (µM) analyses were conducted on a composite sample of each coastal wetland and determined following EPA [28]; Murphy and Riley [29]; and Strickland and Parson [30].

2.3. Macroinvertebrate Data

Aquatic macroinvertebrate samples were collected using a kick net (250 μm mesh size) by sweeping on all the microhabitats present (e.g., macrophytes, algae, open water) along the littoral shore. A total of twenty sweeps of 1 m were carried out at three points (i.e., replicate) within each site. Because five sites showed salinity values much higher than the others (i.e., salinities > 5 psu), we decided to omit them; thus, we analyzed a total of 25 sample sites instead of 30. After collection, samples were preserved in 70% ethanol until identification. In the laboratory, macroinvertebrates were sorted and identified to the lowest practical taxonomic level (family/genus/species) following available taxonomic keys [31,32,33]. The abundance of each taxon was summed over replicas at each site before analyses. The list of all taxa is presented in Table S1. After identification, individuals were measured following the procedure detailed in Coccia et al. [34]. Individuals were first photographed with a Jenoptik ProgResC5 digital camera coupled with an Olympus SZ61 stereomicroscope, then each individual was measured to the nearest 0.1 mm using the digital image analysis software Image J (ver. 1.5). Body lengths included the distance from the head front to the last abdominal segment for Insecta; shell height for Gasteropoda; and total length for Anellida. Measurements were taken of all collected individuals in a sampled site if abundance was ≤ than 25 individuals or on 25 random individuals for abundant taxa (>25 individuals).
Dry mass was estimated using the published length–mass regressions used in Coccia et al. [34].

2.4. Classifying Wetlands Sites According to Their Human Disturbance

To classify the exposure of each studied site to human disturbance, we used the Integrated Disturbance Index (IDI) following Coccia et al. [34] This index integrates disturbance at catchment level (CDI) and disturbance at local level through an index that measure the conservation status of wetlands (ECELS).
The CDI was calculated by summing the three main human land cover types: agriculture, tree plantation and urban, after weighting them according to their potential impacts on the aquatic environment [14,35]. Land cover types were extrapolated from a 1km diameter buffer centered on each wetland.
The ECELS index is based on 5 components: littoral morphology, human activity, water characteristics, emergent vegetation and hydrophytic vegetation [36]. The index can range from 0 to 100, divided into 5 categories: bad (<30), poor (30–49), moderate (50–69), good (70–89) and high (≥90). Since the values of CDI increase at high disturbance, while the ECELS indices decreased (or vice versa), we inverted the ECELS values before calculating the Integrated Disturbance Index (IDI), following Ligeiro et al. [35].
Then, after calculating the mean and standard deviation of the IDI index, we defined as least disturbed those sites below the mean minus one SD and as most disturbed those sites above the mean plus one SD. Moderately disturbed sites were those in between the two categories defined above. Lastly, a principal component analyses (PCA) was used to identify which environmental variables were associated with each category of human disturbance. For this analysis, we used all the environmental variables with correlation values <0.8 (i.e., dissolved oxygen, pH, depth, chlorophyll-a, concentration, phosphate, nitrate and silicate).

2.5. Candidate Metrics

We considered 70 candidate metrics (Table S2). Among these, 67 have been widely used to detect anthropogenic impacts in aquatic systems [13,14,15], while the remaining three metrics based on body size (size diversity, geometric mean body size and the slope of the size spectra) have not yet used in biomonitoring, despite the fact that they can provide information on ecosystems’ health and alterations [37,38].
These metrics represented community structure (11 metrics), community composition (36 metrics), tolerance to pollution (8 metrics) and functional traits, including body size-related metrics (3) and trophic structure (12). The list of the candidate metrics is presented in Table S1. Pollution tolerance scores were assigned to each taxon following Figueroa et al. [39]; trophic structure was assigned according to Merrit & Cummins [40], Fierro et al. [41] and Solis et al. [42] and included five functional feeding groups (FFGs): detritivores, predators, scrapers, collectors and gatherers (Table S1). Size diversity and geometric mean were calculated using individual length measurements following Quintana et al. [43,44]. Size diversity is similar to the Shannon diversity index but adapted for continuous variables such as body size.
We also modeled the biomass size spectrum of the entire community for each sampled zone, following a binning technique, as described in Coccia et al. [34], using the scripts available by Edwards et al. [45]. In practice, individuals’ body masses were first grouped in log2 classes and then normalized by dividing each class by its width. The size spectrum slope was obtained after regressing the log10 normalized biomass against the log10 midpoint of each bin.

2.6. Metric Selection

To select which metric best discriminated between the least and most disturbed sites, first we excluded metrics containing too many zeroes in the dataset [46] (i.e., those with 0 values in more than one-third of the sites). Then we tested the capacity of each metric to differentiate the least disturbed sites from the most disturbed sites, visually with box-and-whisker plots or statistically with non-parametric Mann–Whitney U tests (p < 0.05). Lastly, we examined redundancy between the selected metrics using Spearman correlation analyses. Pairs of metrics with r > 0.8 were considered redundant; therefore, final core metric was selected based on its degree of correlation with environmental variables. The selected metrics were finally tested for correlation with latitude to detect any possible geographic influence and with salinity, as it is a natural stressor of these habitats (i.e., IDI did not correlate with salinity r = −0.26; p = 0.21).
All analyses were performed with R version 3.15.1 including functions in the vegan and HMISC packages.

3. Results

3.1. Disturbance Classification

The IDI index assigned 4 sites out of the 25 as least disturbed (IDI < 0.76), 15 sites as moderately disturbed (IDI 0.79–1.49) and 6 sites as most disturbed (IDI > 1.59). See Table S3 for details on land-use percentages, ECELS and IDI indices of the 25 sampling sites. The PCA ordination clearly depicted the separation between the most and the least disturbed sites (Figure 2). The most disturbed sites were associated with higher concentrations of phosphate, silicate and chlorophyll-a in water and were located on the negative side of the PC axis 1, which accounted for 29.4% of environmental variance (Figure 2). The least disturbed sites were associated with higher oxygen and temperature, and most of them were located on the positive side of the PCA axis 2 (Figure 2), which accounted for 21.9% of the variation.
The two axes of the PCA explained together 51.4% of the total variation in all environmental data (Figure 2; Table 1).

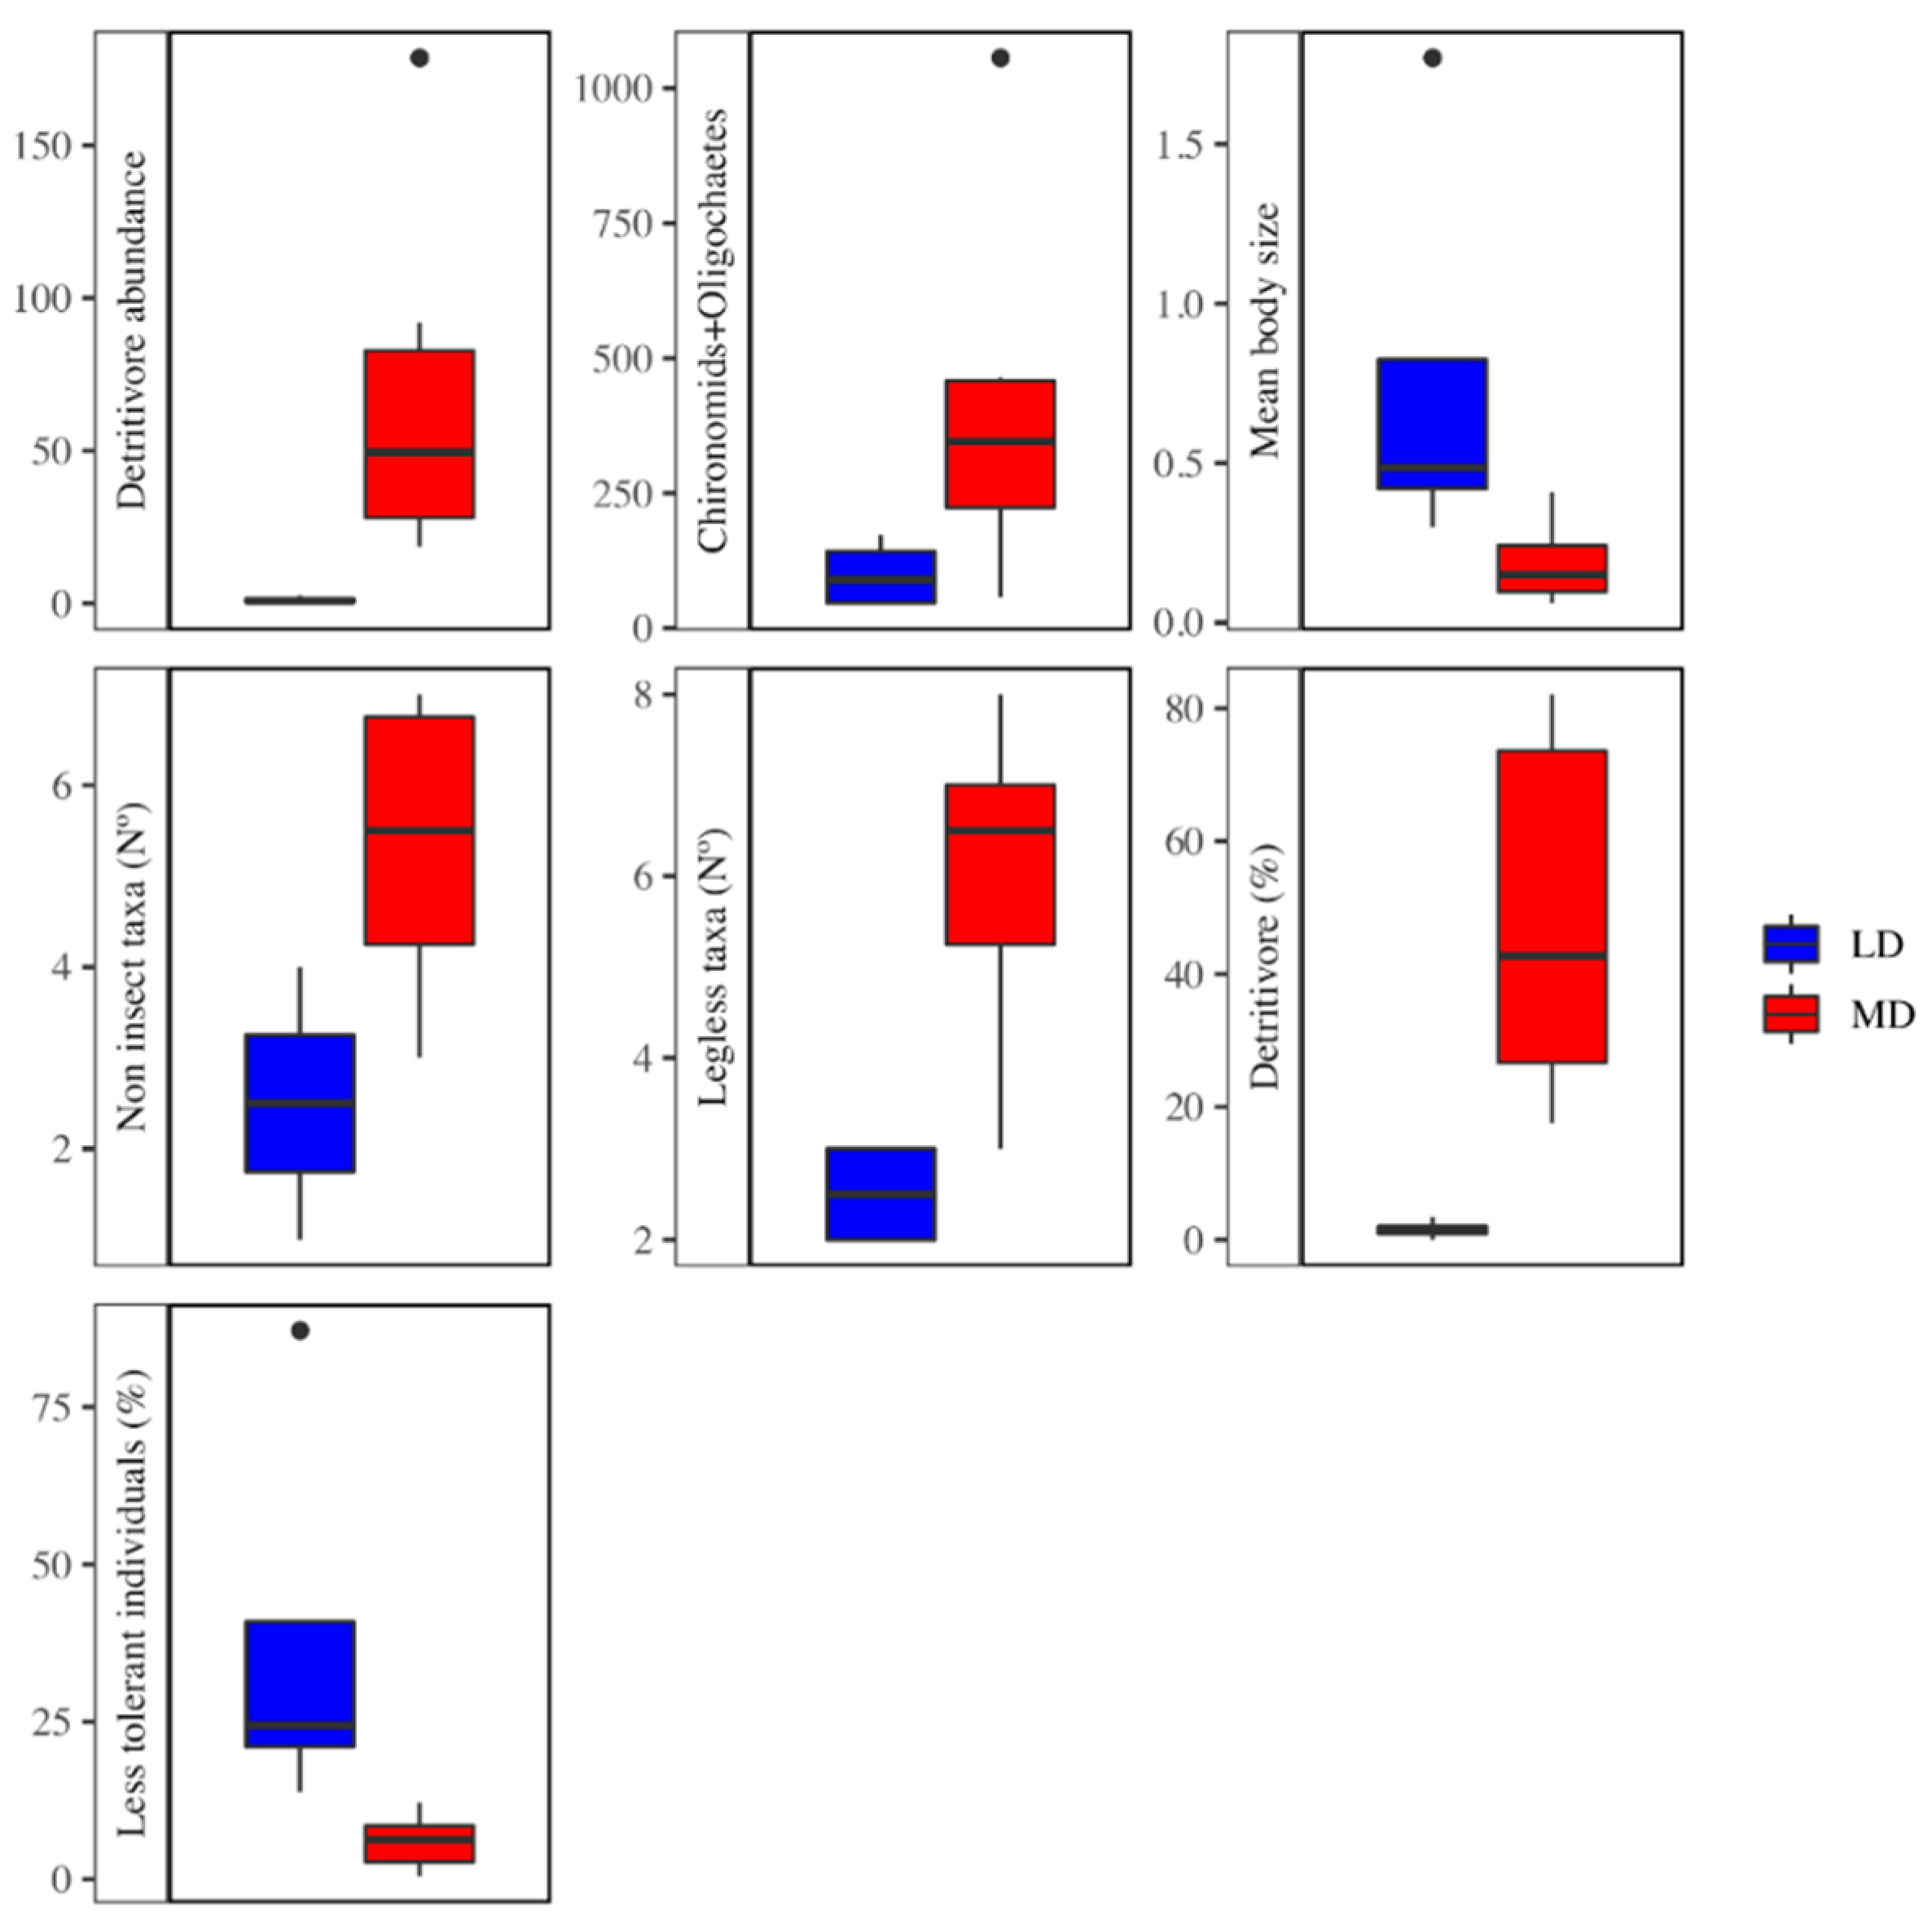
3.2. Metric Selection

A total of 4 metrics among the 70 candidates were finally selected for biomonitoring. Eight metrics were excluded because they showed many zero values. Among the remaining 62 metrics, only 7 were efficient at discriminating between least and most disturbed sites after Mann–Whitney U tests (p < 0.05) and box-and-whisker plots (see Table S2; Figure 3). However, six of these metrics showed high correlation values (r > 0.8) with each other (Table S5). Therefore, if metrics represent similar aspects of the macroinvertebrate community (e.g., % of detritivores and abundance of detritivores; number of legless taxa and number of non-insect taxa), we selected those with the highest correlation to some environmental variables. These were the number of legless taxa, detritivore abundance, abundance of chironomidae plus oligochaeta and the geometric mean of body size (Table S6). These four metrics were not strongly correlated between themselves (coefficient r < 0.8) nor to latitude (r < 0.3). However, the number of legless taxa and chironomids + oligochaetes showed correlation with salinity and were thus excluded (Table S6). Among the remaining two metrics, the abundance of detritivores was positively correlated with phosphate (r = 0.82; p < 0.005) and the geometric mean body size was positively correlated with water temperature (r = 0.77; p < 0.01).

4. Discussion

In this study, we combined traditional macroinvertebrate metrics with new size-based metrics to identify those useful to biomonitoring coastal wetlands in the Chilean Mediterranean ecoregion, and that can also be considered for the development of a future multimetric index that will evaluate the health of these systems. Aquatic macroinvertebrates have been used in the biomonitoring of many aquatic systems, because they have clear responses to human disturbance [10,47]. However, to our knowledge, this is the first attempt to test macroinvertebrate metrics able to detect the anthropogenic impacts on Chilean coastal wetlands.
Among all the metrics evaluated, only two of them (detritivore abundance (traditional metric) and the mean body size (new metric)) were selected. These metrics reflected aspects of the macroinvertebrate community related to structure and functions that effectively discriminated most disturbed sites from least disturbed sites. This result is in line with other studies showing that traditional metrics alone are not sufficient to detect human disturbance in aquatic systems and that alternative metrics should be considered [48,49].
Detritivores have been frequently used (mostly as percentage) in biomonitoring and for the development of MMI in other aquatic systems, including coastal wetlands, where they also showed time consistency [50,51]. Here, we confirm the utility for coastal wetlands in Chile, but we recommend using them as abundances rather than percentages. Instead, the geometric mean of body size, i.e., the mean size of all organisms present at each site, has not yet been used in biomonitoring, specifically for MMI development. This metric has been successful at detecting human alterations in terrestrial invertebrates i.e. mean size reduction at community level has been observed with nutrient enrichment [52]. Thus, we strongly recommend it, as it seems better than conventional biomonitoring metrics to evaluate the ecological condition of these aquatic ecosystems.
Our results showed that the most disturbed sites, according to the IDI index, with predominantly urban land uses, had a greater association with phosphate and silicate concentration in water and chlorophyll-a content (Figure 2). The most disturbed sites also seem to be the most eutrophic [53]. This probably reflects the great alterations due to increasing agriculture and urbanization suffered by Mediterranean wetlands ecosystems in Mediterranean Chile [54]. These activities usually increase inputs of nutrients such as phosphate, nitrate and silicate (which emanate from fertilizers, organic manure and wastes) into coastal wetlands by surface runoff and ground water drainage [55,56]. Excessive nutrient loading can increase phytoplankton growth and promote eutrophication, which, by altering macroinvertebrate taxonomic composition (i.e., passing from pollution-intolerant to tolerant species), can have dramatic consequences on the stability and functioning of these ecosystems. Indeed the most disturbed sites had also higher abundances of detritivores as they were positively correlated with phosphates.
It is well-known that phosphate enrichment can change the trophic composition of macroinvertebrates, increasing detritivore abundances (e.g., polychaetes) [57,58,59,60]). This can reflect alterations in resource quality and microhabitat due to enrichment [61]. In this study, deposit-feeding detritus consumers, usually known as detritivores, mostly included the anellids Oligochaeta and Polychaeta (mostly Capitellidae and Spionidae). Both taxa are opportunistic feeders, well-adapted to degraded aquatic habitats, such as estuaries and lagoons [62,63], due to organic pollution or eutrophication [61,64,65].
Mean body size decreased with increasing disturbance, as macroinvertebrates assemblages become smaller at the most disturbed sites. Small size species are expected in naturally unstable systems, such as coastal wetlands where small size allows more appropriate response to disturbances (e.g. due to short life cycle, fast development), conferring ecosystem resistance/resilience to environmental change [66]. Our results indicate that in our system anthropogenic activities (i.e. agriculture and urbanization) impose additional stresses on their inhabitants that benefit smaller sized organisms, as already observed in other studies on aquatic habitats [67,68].
Interestingly, we found a positive correlation between body size and temperature. The link between body size and temperature was not unexpected, but typically smaller body sizes are associated with warmer conditions (i.e., the third universal response to warming sensu Gardner et al. [69]. Converse size clines can be possible in regions with strong seasonal variability, such as the Mediterranean climate, if samples were taken at the end of the season [70]. However, our study was conducted in the middle of spring, which suggests that temperature effects reflected differences in the timing of the sampling.
We recognize some limitations of our study that must be considered. For example, the small number of sample sites prevented us from considering the effects of natural variability, which has been recommended in other studies [50]. In addition, other human and natural stressors should be considered (e.g., cattle grazing, alien species, mining, droughts, water extraction, earthquake uplift) given their effects on wetlands biodiversity. Moreover, since synergistic and antagonistic interactions between stressors can affect coastal wetlands invertebrates [34], the combined effects of these should also be considered. Lastly, we were not able to capture natural seasonal variation in biological composition, since we sampled only once, and while it should be useful, assessing weather sampling in seasons with lower diversity (e.g., autumn or winter [71]) would bring different results. Since biomonitoring suggests including metrics that are independent of space and time [72], we recommend implementing these aspects in further studies.

5. Conclusions

Mediterranean coastal wetlands continue to suffer multiple pressures of human origin (e.g., land conversion, deforestation, water extraction) and they will be further impacted by climate change [73]. Assessing the ecological conditions of coastal wetlands in the Mediterranean zone is essential to predict their ability to resist/recover from multiple stressors and to identify actions able to ensure their functioning. In this regard, macroinvertebrate-based biomonitoring of aquatic ecosystems has been widely used worldwide, being considered one of the most effective methods [50]. Nonetheless, it has not yet been implemented in Chilean coastal wetlands. Therefore, the purpose of this study has been to identify metrics that could serve for biomonitoring and as a basis for the development of future indices.
We demonstrated that one traditional metric (detritivore abundance) and one new metric (geometric body size) were highly responsive to some types of anthropogenic stressors. So, these metrics can be used in the biomonitoring of coastal wetlands in the Mediterranean region of Chile and elsewhere, and to develop biomonitoring metrics such as MMI that can help protect them. Nonetheless, we recommend sampling more sites in time and space, also including wetlands affected by other types of stressors, to reduce potential biases and improve the accuracy of the biomonitoring of these aquatic ecosystems.

Supplementary Materials

The following supporting information can be downloaded at: https://www.mdpi.com/article/10.3390/w14213449/s1, Figure S1: Example of the sampled sites within a wetland, Table: S1: List of the collected taxa in the 25 sites, Table S2: List of candidate metrics and their response to impairment, Table S3: Percentage of the main land-use coverage within 1 km buffer around each wetland, Table S4: Physico-chemical parameters of the 25 sampled sites, Table S5: Spearman correlation matrix between the core metrics, Table S6: Spearman correlation matrix between the core metrics and the physico-chemical variables.

Author Contributions

Conceptualization, C.C. and P.F.; Data curation, C.C., C.V. and P.F.; Formal analysis, C.C. and P.F.; Funding acquisition, C.C.; Investigation, C.C.; Methodology, C.C. and P.F.; Writing—original draft, C.C.; Writing—review and editing, C.C., C.V. and P.F. All authors have read and agreed to the published version of the manuscript.

Funding

This research was supported by the Project Fondecyt Nº 11180668 funded by ANID-Chile (Agencia Nacional de Investigación y Desarrollo) and by a postdoctoral contract from Junta de Andalucía (DOC_00215).

Data Availability Statement

Not applicable.

Acknowledgments

We thank Julio Salcedo for providing field instruments and two anonymous referees for their useful comments.

Conflicts of Interest

The authors declare no conflict of interest.

References

  1. Camacho, V.V.; Ruiz-Luna, A.; Berlanga-Robles, A.C. Effects of land use changes on ecosystem services value provided by coastal wetlands: Recent and future landscape scenarios. J. Coast. Zone Manag. 2016, 19, 418. [Google Scholar]
  2. Lee, S.Y.; Dunn, R.J.K.; Young, R.A.; Connolly, R.M.; Dale, P.E.R.; Dehayr, R.; Lemckert, C.J.; McKinnon, S.; Powell, B.; Teasdale, P.R.; et al. Impact of urbanization on coastal wetland structure and function. Austral Ecol. 2006, 31, 149–163. [Google Scholar] [CrossRef]
  3. Pardo, M.T.; Esteve, M.A.; Giménez, A.; Martínez-Fernández, J.; Carreño, M.F.; Serrano, J.; Miñano, J. Assessment of hydrological alterations on wandering beetle assemblages (coleoptera: Carabidae and Tenebrionidae) in coastal wetlands of arid Mediterranean systems. J. Arid Environ. 2008, 72, 1803–1810. [Google Scholar] [CrossRef]
  4. Carreño, M.F.; Esteve, M.A.; Martinez, J.; Palazón, J.A.; Pardo, M.T. Habitat changes in coastal wetlands associated to hydrological changes in the watershed. Estuar. Coast. Shelf Sci. 2008, 77, 475–483. [Google Scholar] [CrossRef]
  5. Novoa, V.; Rojas, O.; Ahumada-Rudolph, R.; Sáez, K.; Fierro, P.; Rojas, C. Coastal wetlands: Ecosystems affected by urbanization? Water 2020, 12, 698. [Google Scholar] [CrossRef] [Green Version]
  6. Davidson, N.C. How much wetland has the world lost? Long-term and recent trends in global wetland area. Mar. Freshwater Res. 2014, 65, 934–941. [Google Scholar] [CrossRef] [Green Version]
  7. Li, Y.; Zhang, X.; Zhao, X.; Ma, S.; Cao, H.; Cao, J. Assessing spatial vulnerability from rapid urbanization to inform coastal urban regional planning. Ocean Coast. Manag. 2016, 123, 53–65. [Google Scholar] [CrossRef]
  8. Borja, A.; Bricker, S.B.; Dauer, D.M.; Demetriades, N.T.; Ferreira, J.G.; Forbes, A.T.; Hutchings, P.; Xiaoping, J.; Kenchington, R.; Marques, J.C.; et al. Overview of integrative tools and methods in assessing ecological integrity in estuarine and coastal systems worldwide. Mar. Pollt. Bull. 2008, 56, 1519–1537. [Google Scholar] [CrossRef]
  9. Birk, S.; Bonne, W.; Borja, A.; Brucet, S.; Courrat, A.; Poikane, S.; Solimini, A.; van de Bund, W.; Zampoukas, N.; Hering, D. Three hundred ways to assess Europe’s surface waters: An almost complete overview of biological methods to implement the Water Framework Directive. Ecol. Indic. 2012, 18, 31–41. [Google Scholar] [CrossRef]
  10. Rosenberg, D.M.; Resh, V.H. Introduction to freshwater biomonitoring and benthic macroinvertebrates. In Freshwater Biomonitoring and Benthic Macroinvertebrates; Rosenberg, D.M., Resh, V.H., Eds.; Chapman and Hall: New York, NY, USA, 1993; pp. 1–9. [Google Scholar]
  11. Barbour, M.T.; Gerritsen, J.; Griffith, G.E.; Frydenborg, R.; McCarron, E.; White, J.S.; Bastian, M.L. A framework for biological criteria for Florida streams using benthic macroinvertebrates. J. N. Am. Benth. Soc. 1996, 15, 185–211. [Google Scholar] [CrossRef]
  12. Menetrey, N.; Oertli, B.; Lachavanne, J.B. The CIEPT: A macroinvertebrate-based multimetric index for assessing the ecological quality of Swiss lowland ponds. Ecol. Indic. 2011, 11, 590–600. [Google Scholar] [CrossRef]
  13. Mereta, S.T.; Boets, P.; De Meester, L.; Goethals, P.L. Development of a multimetric index based on benthic macroinvertebrates for the assessment of natural wetlands in Southwest Ethiopia. Ecol. Indic. 2013, 29, 510–521. [Google Scholar] [CrossRef]
  14. Fierro, P.; Arismendi, I.; Hughes, R.M.; Valdovinos, C.; Jara-Flores, A. A benthic macroinvertebrate multimetric index for Chilean Mediterranean streams. Ecol. Indic. 2018, 91, 13–23. [Google Scholar] [CrossRef]
  15. Sapounidis, A.S.; Koutrakis, E.T. Development of a fish-based multimetric index for the assessment of Lagoons’ ecological quality in northern Greece. Water 2021, 13, 3008. [Google Scholar] [CrossRef]
  16. Vadas, R.L., Jr.; Hughes, R.M.; Bae, Y.J.; Baek, M.J.; Gonzáles, O.C.B.; Callisto, M.; de Carvalho, D.R.; Chen, K.; Ferreira, M.; Fierro, P.; et al. Assemblage-based biomonitoring of freshwater ecosystem health via multimetric indices: A critical review and suggestions for improving their applicability. Water Biol. Sec. 2022, 100054. [Google Scholar] [CrossRef]
  17. Karr, J.R.; Chu, E.W. Restoring Life in Running Waters; Island Press: Washington, DC, USA, 1999. [Google Scholar]
  18. Borja, A.; Barbone, E.; Basset, A.; Borgersen, G.; Brkljacic, M.; Elliott, M.; garmendia, J.M.; Marques, J.C.; Mazik, K.; Muxika, I.; et al. Response of single benthic metrics and multi-metric methods to anthropogenic pressure gradients, in five distinct European coastal and transitional ecosystems. Mar. Pollt. Bull. 2011, 62, 499–513. [Google Scholar] [CrossRef]
  19. Vásquez, D.; Sandoval, N.; Fierro, P.; Valdovinos, C. Morphological impacts of the Chilean megathrust earthquake Mw 8.8 on coastal wetlands of high conservation value. Estuar. Coast. Shelf Sci. 2020, 245, 106922. [Google Scholar] [CrossRef]
  20. Marín, A.; Gelcich, S.; Castilla, J.C. Ecosystem services and abrupt transformations in a coastal wetland social-ecological system: Tubul-Raqui after the 2010 earthquake in Chile. Ecol. Soc. 2014, 19, 22. [Google Scholar] [CrossRef]
  21. Rojas, O.; Mardones, M.; Martínez, C.; Flores, L.; Sáez, K.; Araneda, A. Flooding in central Chile: Implications of tides and sea level increase in the 21st century. Sustainability 2018, 10, 4335. [Google Scholar] [CrossRef] [Green Version]
  22. Bertrán, C.; Fierro, P.; Encalada, E.; Peña-Cortés, F.; Tapia, J.; Hauenstein, E.; Vargas-Chacoff, L. Macrobenthos of the coastal Budi lagoon, southern Chile: Changes associated with seasonal environment variation. Braz. J. Oceanogr. 2016, 64, 239–248. [Google Scholar] [CrossRef]
  23. Arriagada, L.; Rojas, O.; Arumí, J.L.; Munizaga, J.; Rojas, C.; Farias, L.; Vega, C. A new method to evaluate the vulnerability of watersheds facing several stressors: A case study in Mediterranean Chile. Sci. Total Environ. 2019, 651, 1517–1533. [Google Scholar] [CrossRef] [PubMed]
  24. Rangel-Buitrago, N.; Contreras-Lopez, M.; Martinez, C.; Williams, A. Can coastal scenery be managed? The Valparaíso region, Chile as a case study. Ocean Coast. Manag. 2018, 163, 383–400. [Google Scholar] [CrossRef]
  25. Fariña, J.M.; He, Q.; Silliman, B.R.; Bertness, M.D. Biogeography of salt marsh plant zonation on the Pacific coast of South America. J. Biogeogr. 2018, 45, 238–247. [Google Scholar] [CrossRef]
  26. Contreras López, M.; Figueroa Sterquel, R.; Salcedo Castro, J.; Vergara Cortés, H.; Zuleta, C.; Bravo, V.; Piñones, C.; Cortés Molina, F. Vulnerabilidad de Humedales y Dunas Litorales en Chile Central. In Vulnerabilidad de las Zonas Costeras de Latinoamérica al Cambio Climático; Botello, A., Villanueva, S., Gutiérrez, J., Rojas, J.L., Eds.; Editorial Universidad Juárez Autónoma de Tabasco (UJAT), Universidad Nacional Autónoma de México (UNAM), Universidad Autónoma de Campeche (UAC): Campeche, Mexico, 2017; pp. 227–246. [Google Scholar]
  27. Zuleta-Ramos, C.; Contreras-López, M. Humedales Costero de Coquimbo: Bio-Diversidad, Vulnerabilidades & Conservación; Universidad de La Serena & Ministerio del Medio Ambiente: La Serena, Chile, 2019. [Google Scholar]
  28. EPA. Methods for Chemical Analysis of Water and Wastes; EPA-600/4-79-020; US Environmental Protection Agency: Washington, DC, USA; Office of Research and Development: Washington, DC, USA; Environmental Monitoring and Support Laboratory: Cincinnati, OH, USA, 1983; Method 353.2.
  29. Murphy, J.; Riley, J.P. A modified single solution method for the determination of phosphate in natural waters. Anal. Chim. Acta 1962, 27, 31–36. [Google Scholar] [CrossRef]
  30. Strickland, J.D.H.; Parsons, T.R. Determination of Reactive Silicate. In A Practical Handbook of Seawater Analysis, 2nd ed.; Fisheries Research Board of Canada: Ottawa, Canada, 1972; Volume 167, pp. 65–70. [Google Scholar]
  31. Domínguez, E.; Fernández, H.R. Macroinvertebrados Bentónicos Sudamericanos. Sistemática y Biología; Fundación Miguel Lillo: Tucumán, Argentina, 2009; Volume 656. [Google Scholar]
  32. Rogers, D.C.; Thorp, J.H. Thorp and Covich’s Freshwater Invertebrates (Fourth Edition) Keys to Palaearctic Fauna, 4th ed.; Academic Press: New York, NY, USA, 2019. [Google Scholar]
  33. Heckman, C.W. Encyclopedia of South American Aquatic Insects: Hemiptera-Heteroptera; Illustrated Keys to Known Families, Genera, and Species in South America; Springer: Washington, DC, USA, 2011; pp. 1–679. [Google Scholar]
  34. Coccia, C.; Contreras-López, M.; Farina, J.M.; Green, A.J. Comparison of taxonomic and size-based approaches to determine the effects of environment and disturbance on invertebrate communities in coastal Chile. Ecol. Indic. 2022, 143, 109356. [Google Scholar] [CrossRef]
  35. Ligeiro, R.; Hughes, R.M.; Kaufmann, P.R.; Macedo, D.R.; Firmiano, K.R.; Ferreira, W.R.; Oliveira, D.; Melo, A.S.; Callisto, M. Defining quantitative stream disturbance gradients and the additive role of habitat variation to explain macroinvertebrate taxa richness. Ecol. Indic. 2013, 25, 45–57. [Google Scholar] [CrossRef] [Green Version]
  36. Sala, J.; Gascón, S.; Boix, D.; Gesti, J.; Quintana, X.D. Proposal of a rapid methodology to assess the conservation status of Mediterranean wetlands and its application in Catalunya (NE Iberian Peninsula). Arch. Sci. 2004, 57, 141–152. [Google Scholar]
  37. Gascón, S.; Boix, D.; Sala, J.; Quintana, X.D. Patterns in size and species diversity of benthic macroinvertebrates in Mediterranean salt marshes. Mar. Ecol. Progr. Ser. 2009, 391, 21–32. [Google Scholar] [CrossRef]
  38. Petchey, O.L.; Belgrano, A. Body-size distributions and size-spectra: Universal indicators of ecological status? Biol. Lett. 2010, 6, 434–437. [Google Scholar] [CrossRef] [Green Version]
  39. Figueroa, R.; Palma, A.; Ruiz, V.; Niell, X. Comparative analysis of biotic indexes used to evaluate water quality in a Mediterranean river of Chile: Chillan River, VIII Region. Rev. Chil. Hist. Nat. 2007, 80, 225–242. [Google Scholar]
  40. Merrit, R.W.; Cummins, K.W. Trophic relations of macroinvertebrates. In Methods in Stream Ecology; Hauer, R.F., Lamberti, G.A., Eds.; Academic Press: San Diego, DC, USA, 1996; pp. 453–473. [Google Scholar]
  41. Fierro, P.; Bertrán, C.; Mercado, M.; Peña-Cortés, F.; Tapia, J.; Hauenstein, E.; Caputo, L.; Vargas-Chacoff, L. Landscape composition as a determinant of diversity and functional feeding groups of aquatic macroinvertebrates in southern rivers of the Araucanía, Chile. Latin American, J. Aquat. Res. 2015, 43, 186–200. [Google Scholar] [CrossRef]
  42. Solis, M.; Arias, M.; Fanelli, S.; Bonetto, C.; Mugni, H. Agrochemicals’ effects on functional feeding groups of macroinvertebrates in Pampas streams. Ecol. Indic. 2019, 101, 373–379. [Google Scholar] [CrossRef]
  43. Quintana, X.D.; Sandra, B.; Dani, B.; López-Flores, R.; Stéphanie, G.; Badosa, A.; Jordi, S.; Moreno-Amich, R.; Egozcue, J.J. A nonparametric method for the measurement of size diversity with emphasis on data standardization. Limnol. Oceanogr. Methods 2008, 6, 75–86. [Google Scholar] [CrossRef]
  44. Quintana, X.D.; Egozcue, J.J.; Martínez-Abella, O.; López-Flores, R.; Gascón, S.; Brucet, S.; Boix, D. Update: A non-parametric method for the measurement of size diversity, with emphasis on data standardization. The measurement of the size evenness. Limnol. Oceanogr. Methods 2016, 14, 408–413. [Google Scholar] [CrossRef] [Green Version]
  45. Edwards, A.M.; Robinson, J.P.W.; Plank, M.J.; Baum, J.K.; Blanchard, J.L. Testing and recommending methods for fitting size spectra to data. Methods Ecol. Evol. 2017, 8, 57–67. [Google Scholar] [CrossRef] [Green Version]
  46. Oliveira, R.B.S.; Castro, C.M.; Baptista, D.F. Desenvolvimento de índices multimétricos para utilização em programas de monitoramento biológico da integridade de escossistemas aquáticos. Oecol. Bras. 2008, 12, 487–505. [Google Scholar] [CrossRef] [Green Version]
  47. Arias, M.J.; Vaschetto, P.A.; Marchese, M.; Regaldo, L.; Gagneten, A.M. Benthic macroinvertebrates and zooplankton communities as ecological indicators in urban wetland of Argentina. Sustainability 2022, 14, 4045. [Google Scholar] [CrossRef]
  48. Soria, M.; Gutiérrez-Cánovas, C.; Bonada, N.; Acosta, R.; Rodríguez-Lozano, P.; Fortuño, P.; Burgazzi, G.; Vinyoles, D.; Gallart, F.; Latron, J.; et al. Natural disturbances can produce misleading bioassessment results: Identifying metrics to detect anthropogenic impacts in intermittent rivers. J. Appl. Ecol. 2020, 57, 283–295. [Google Scholar] [CrossRef]
  49. Šidagytė-Copilas, E.; Arbačiauskas, K. A multimetric macroinvertebrate index for the assessment of the ecological status of Lithuanian rivers. Limnologica 2022, 97, 126010. [Google Scholar] [CrossRef]
  50. Ruaro, R.; Gubiani, E.A.; Hughes, R.M.; Mormul, R.P. Global trends and challenges in multimetric indices of biological condition. Ecol. Indic. 2020, 110, 105862. [Google Scholar] [CrossRef]
  51. Kovalenko, K.E.; Brady, V.J.; Ciborowski, J.J.; Host, G.E.; Johnson, L.B. Macroinvertebrate and Fish Community Metrics: Confounding Effects and Consistency over Time. Wetlands 2020, 40, 1107–1116. [Google Scholar] [CrossRef]
  52. Coccia, C.; Fariña, J.M. Responses of plant-arthropod communities to nutrient enrichment in hyper-arid and semi-arid zones. Estuar. Coast. Shelf Sci. 2022, 272, 107884. [Google Scholar] [CrossRef]
  53. Simboura, N.; Panayotidis, P.; Papathanassiou, E. A synthesis of the biological quality elements for the implementation of the European Water Framework Directive in the Mediterranean ecoregion: The case of Saronikos Gulf. Ecol. Indic. 2005, 5, 253–266. [Google Scholar] [CrossRef]
  54. Bunster, T.; Gironás, J.; Rojas, C.; Bonilla, C. Impacts of Urbanization and Land Use Change over Water Resources. In Water Resources of Chile; Springer: Cham, Switzerland, 2021; pp. 365–387. [Google Scholar]
  55. Carey, J.C.; Fulweiler, R.W. Watershed land use alters riverine silica cycling. Biogeochemistry 2013, 113, 525–544. [Google Scholar] [CrossRef]
  56. Alavaisha, E.; Lyon, S.W.; Lindborg, R. Assessment of water quality across irrigation schemes: A case study of wetland agriculture impacts in Kilombero Valley, Tanzania. Water 2019, 11, 671. [Google Scholar] [CrossRef] [Green Version]
  57. Pearson, T.H.; Rosenberg, R. Macrobenthic succession in relation to organic enrichment and pollution of the marine environment. Oceanogr. Mar. Biol. 1978, 16, 229–311. [Google Scholar]
  58. Marques, J.C.; Nielsen, S.N.; Pardal, M.A.; Jørgensen, S.E. Impact of eutrophication and river management within a framework of ecosystem theories. Ecol. Modell. 2003, 166, 147–168. [Google Scholar] [CrossRef] [Green Version]
  59. Cardoso, P.G.; Pardal, M.A.; Lillebø, A.I.; Ferreira, S.M.; Raffaelli, D.; Marques, J.C. Dynamic changes in seagrass assemblages under eutrophication and implications for recovery. J. Exp. Mar. Biol. Ecol. 2004, 302, 233–248. [Google Scholar] [CrossRef] [Green Version]
  60. Mangadze, T.; Wasserman, R.J.; Froneman, P.W.; Dalu, T. Macroinvertebrate functional feeding group alterations in response to habitat degradation of headwater Austral streams. Sci. Total Environ. 2019, 695, 133910. [Google Scholar] [CrossRef]
  61. Verdonschot, P.F. Beyond masses and blooms: The indicative value of oligochaetes. Hydrobiologia 2006, 564, 127–142. [Google Scholar] [CrossRef]
  62. Asha, C.V.; Retina, I.C.; Suson, P.S.; Bijoy Nandan, S. Ecosystem analisis of the degrading Vembanad wetland ecosystem, the largest Ramsar site on the South West Coast of India – Mesaures for its sustainable management. Reg. Stud. Mar. Sci. 2016, 8, 408–421. [Google Scholar]
  63. Onyena, A.P.; Nkwoji, J.A.; Chukwu, L.O. Evaluation of hydrochemistry and benthic macroinvertebrate in Chanomi Creek, Niger Delta Nigeria. Reg. Stu. Mar. Sci. 2021, 46, 101907. [Google Scholar] [CrossRef]
  64. Surugiu, V. The use of polychaetes as indicators of eutrophication and organic enrichment of coastal waters: A study case–Romanian Black Sea coast. Analele Ştiinţifice ale Universităţii “Al. I. Cuza” Iaşi, s. Biol. Animal. 2005, 51, 55–62. [Google Scholar]
  65. Wildsmith, M.D.; Rose, T.H.; Potter, I.C.; Warwick, R.M.; Clarke, K.R. Benthic macroinvertebrates as indicators of environmental deterioration in a large microtidal estuary. Mar. Pollut. Bull. 2011, 62, 525–538. [Google Scholar] [CrossRef] [PubMed] [Green Version]
  66. Townsend, C.R.; Hildrew, A.G. Species traits in relation to a habitat templet for river systems. Freshw. Biol. 1994, 31, 265–275. [Google Scholar] [CrossRef]
  67. Benzina, I.; Bachir, A.S.; Santoul, F.; Céréghino, R. Macroinvertebrate functional trait responses to environmental gradients and anthropogenic disturbance in arid-land streams of North Africa. J. Arid Environ. 2021, 195, 104626. [Google Scholar] [CrossRef]
  68. Liu, Z.; Li, Z.; Castro, D.M.; Tan, X.; Jiang, X.; Meng, X.; Ge, Y.; Xie, Z. Effects of different types of land-use on taxonomic and functional diversity of benthic macroinvertebrates in a subtropical river network. Environ. Sci. Pollut. Res. 2021, 28, 44339–44353. [Google Scholar] [CrossRef]
  69. Gardner, J.L.; Peters, A.; Kearney, M.R.; Joseph, L.; Heinsohn, R. Declining body size: A third universal response to warming? Trends Ecol. Evol. 2011, 26, 285–291. [Google Scholar] [CrossRef]
  70. Verberk, W.C.; Atkinson, D.; Hoefnagel, K.N.; Hirst, A.G.; Horne, C.R.; Siepel, H. Shrinking body sizes in response to warming: Explanations for the temperature–size rule with special emphasis on the role of oxygen. Biol. Rev. 2021, 96, 247–268. [Google Scholar] [CrossRef]
  71. Figueroa, R.; Suarez, M.L.; Andreu, A.; Ruiz, V.H.; Vidal-Abarca, M.R. Wetlands ecological characterization of central Chile semi-dry area. Gayana 2009, 73, 76–94. [Google Scholar]
  72. Chen, K.; Hughes, R.M.; Xu, S.; Zhang, J.; Cai, D.; Wang, B. Evaluating performance of macroinvertebrate-based adjusted and unadjusted multi-metric indices (MMI) using multi-season and multi-year samples. Ecol. Indic. 2014, 36, 142–151. [Google Scholar] [CrossRef]
  73. Martínez-Megías, C.; Rico, A. Biodiversity impacts by multiple anthropogenic stressors in Mediterranean coastal wetlands. Sci. Total Environ. 2021, 818, 151712. [Google Scholar] [CrossRef] [PubMed]
Figure 1. Map showing the distribution of the 10 study wetlands.
Water 14 03449 g001
Figure 2. Biplot of the principal component analyses (PCA), representing the association between physico-chemical variables and sampling sites. Blue = least disturbed sites; gray= intermediated sites; and red = most disturbed sites, according to the IDI index.
Water 14 03449 g002
Figure 3. Box-and-whisker plots of the seven metrics that passed the Mann–Whitney U tests between least (LD) and most disturbed (MD) sites. Horizontal lines within the boxes represent the median; boxes represent the first (25%) and third (75%) interquartile ranges; and range bars are the minimum and maximum values. Black points show extreme values.
Water 14 03449 g003
Table 1. Mean values and range (in parenthesis) of the environmental variables in the least disturbed, intermediate disturbed and most disturbed sites, classified according to the IDI index. In the case of pH, the values represent the median. N = number of sites within each IDI category.
Environmental VariablesLeast Disturbed
N = 4
Intermediate
N = 15
Most Disturbed
N = 6
Temperature (°C)18.5
(15.2–23.6)
18.4
(12.0–22.8)
15.7
(12.2–17.6)
Dissolved oxygen (mg/L)10.6
(9.3–11.3)
10.0
(5.3–17.1)
6.1
(2.2–10.0)
pH10.1
(7.9–11.4)
8.9
(7.5–11.6)
8.1
(7.7–9.1)
Chlorophyll-a (µg/L)4.1
(0.7–6.7)
6.5
(1.5–16.0)
12.2
(1.3–29.6)
Depth (cm)31.5
(20.0–45.4)
38.6
(22.4–67.0)
34.5
(16.2–53.8)
Phosphates (µM)1.5
(0.7–2.6)
1.2
(0.3–2.6)
3.2
(2.8–3.6)
Silicates (µM)158.8
(103.1–200.4)
116.7
(75.5–200.4)
190.5
(173.0–208.0)
Nitrates (µM)3.3
(1.9–6.5)
16.9
(0.2–77.7)
5.4
(0.1–10.7)
Publisher’s Note: MDPI stays neutral with regard to jurisdictional claims in published maps and institutional affiliations.

