1. Introduction
Together with the Water Framework Directive (WFD, 2008/105/EC) [
1], the Environmental Quality Standards Directive (EQS, 2000/60/EC) [
2] defines the good chemical status to be achieved by all EU Member States and gives the legal basis for monitoring the priority substances in sediment and biota. Good chemical status is defined in compliance with all the quality standards established for chemical substances in the European context. The Directive also provides a mechanism for renewing these standards and establishing new ones through a prioritisation mechanism for hazardous chemicals. This will ensure at least a minimum chemical quality everywhere in the Union, particularly in relation to very toxic substances [
2].
The Guidance Document No: 25 for guidance on chemical monitoring of sediment and biota, EU 2010, gives a joint implementation strategy for the WFD [
2]. This document addresses different requirements for compliance checking and temporal trend monitoring for biota and sediment considering the requirements of the EQS Directive. The recommendations in the guidance consider current scientific knowledge and should allow the harmonised implementation of sediment and biota monitoring across Europe. For most of the substances on the list of priority substances included in the Directive, the establishment of Environmental Quality Standards (EQS) at the community level has been limited to concentrations in the water column.
The recommendations address surveillance and operational and investigative monitoring and should be applied to the current list of 33 priority substances and 8 certain other pollutants included in the Directive as well as to specific river basin pollutants which tend to accumulate in sediment or biota. Based on the rule of thumb mentioned, a distinction has been made between monitoring substances:
Preferred (P)—monitoring is preferred in this matrix.
Optional (O)—monitoring can be performed in this matrix and other compartments/matrices; the choice will also be made based on the degree of contamination of a particular matrix.
Not recommended (N)—monitoring in this matrix is not recommended unless there is evidence of the possibility of accumulation of the compound in this matrix.
In some cases, sediment and biota are preferred matrices, and the choice should be made based on local contamination and the EQS derived. However, these criteria are not mandatory, and Member States can choose the appropriate matrix based on their knowledge, provided they keep in mind the indications of Directive 2008/105/EC. Chemicals used for the chemical status assessment were grouped for the WFD into four groups (heavy metals, pesticides, industrial pollutants, and other pollutants) by the Commission. Lists of the chemicals within the different pollutant groups are given in
Table 1 [
2].
With the present study, the goals are as follows:
Provide the state of sediment contamination in four major rivers in Croatian heartlands.
Compare the concentrations and correlation of major contaminants in the sediment.
Discuss possible sources of the discovered contamination of the riverbed sediments.
Emphasise the importance of regular sediment monitoring and management in rivers.
3. Results
Samples with the highest SSCs collected during peak flow events were chosen. Eighteen samples were included in the analysis to obtain their chemical composition, as shown in
Table 2.
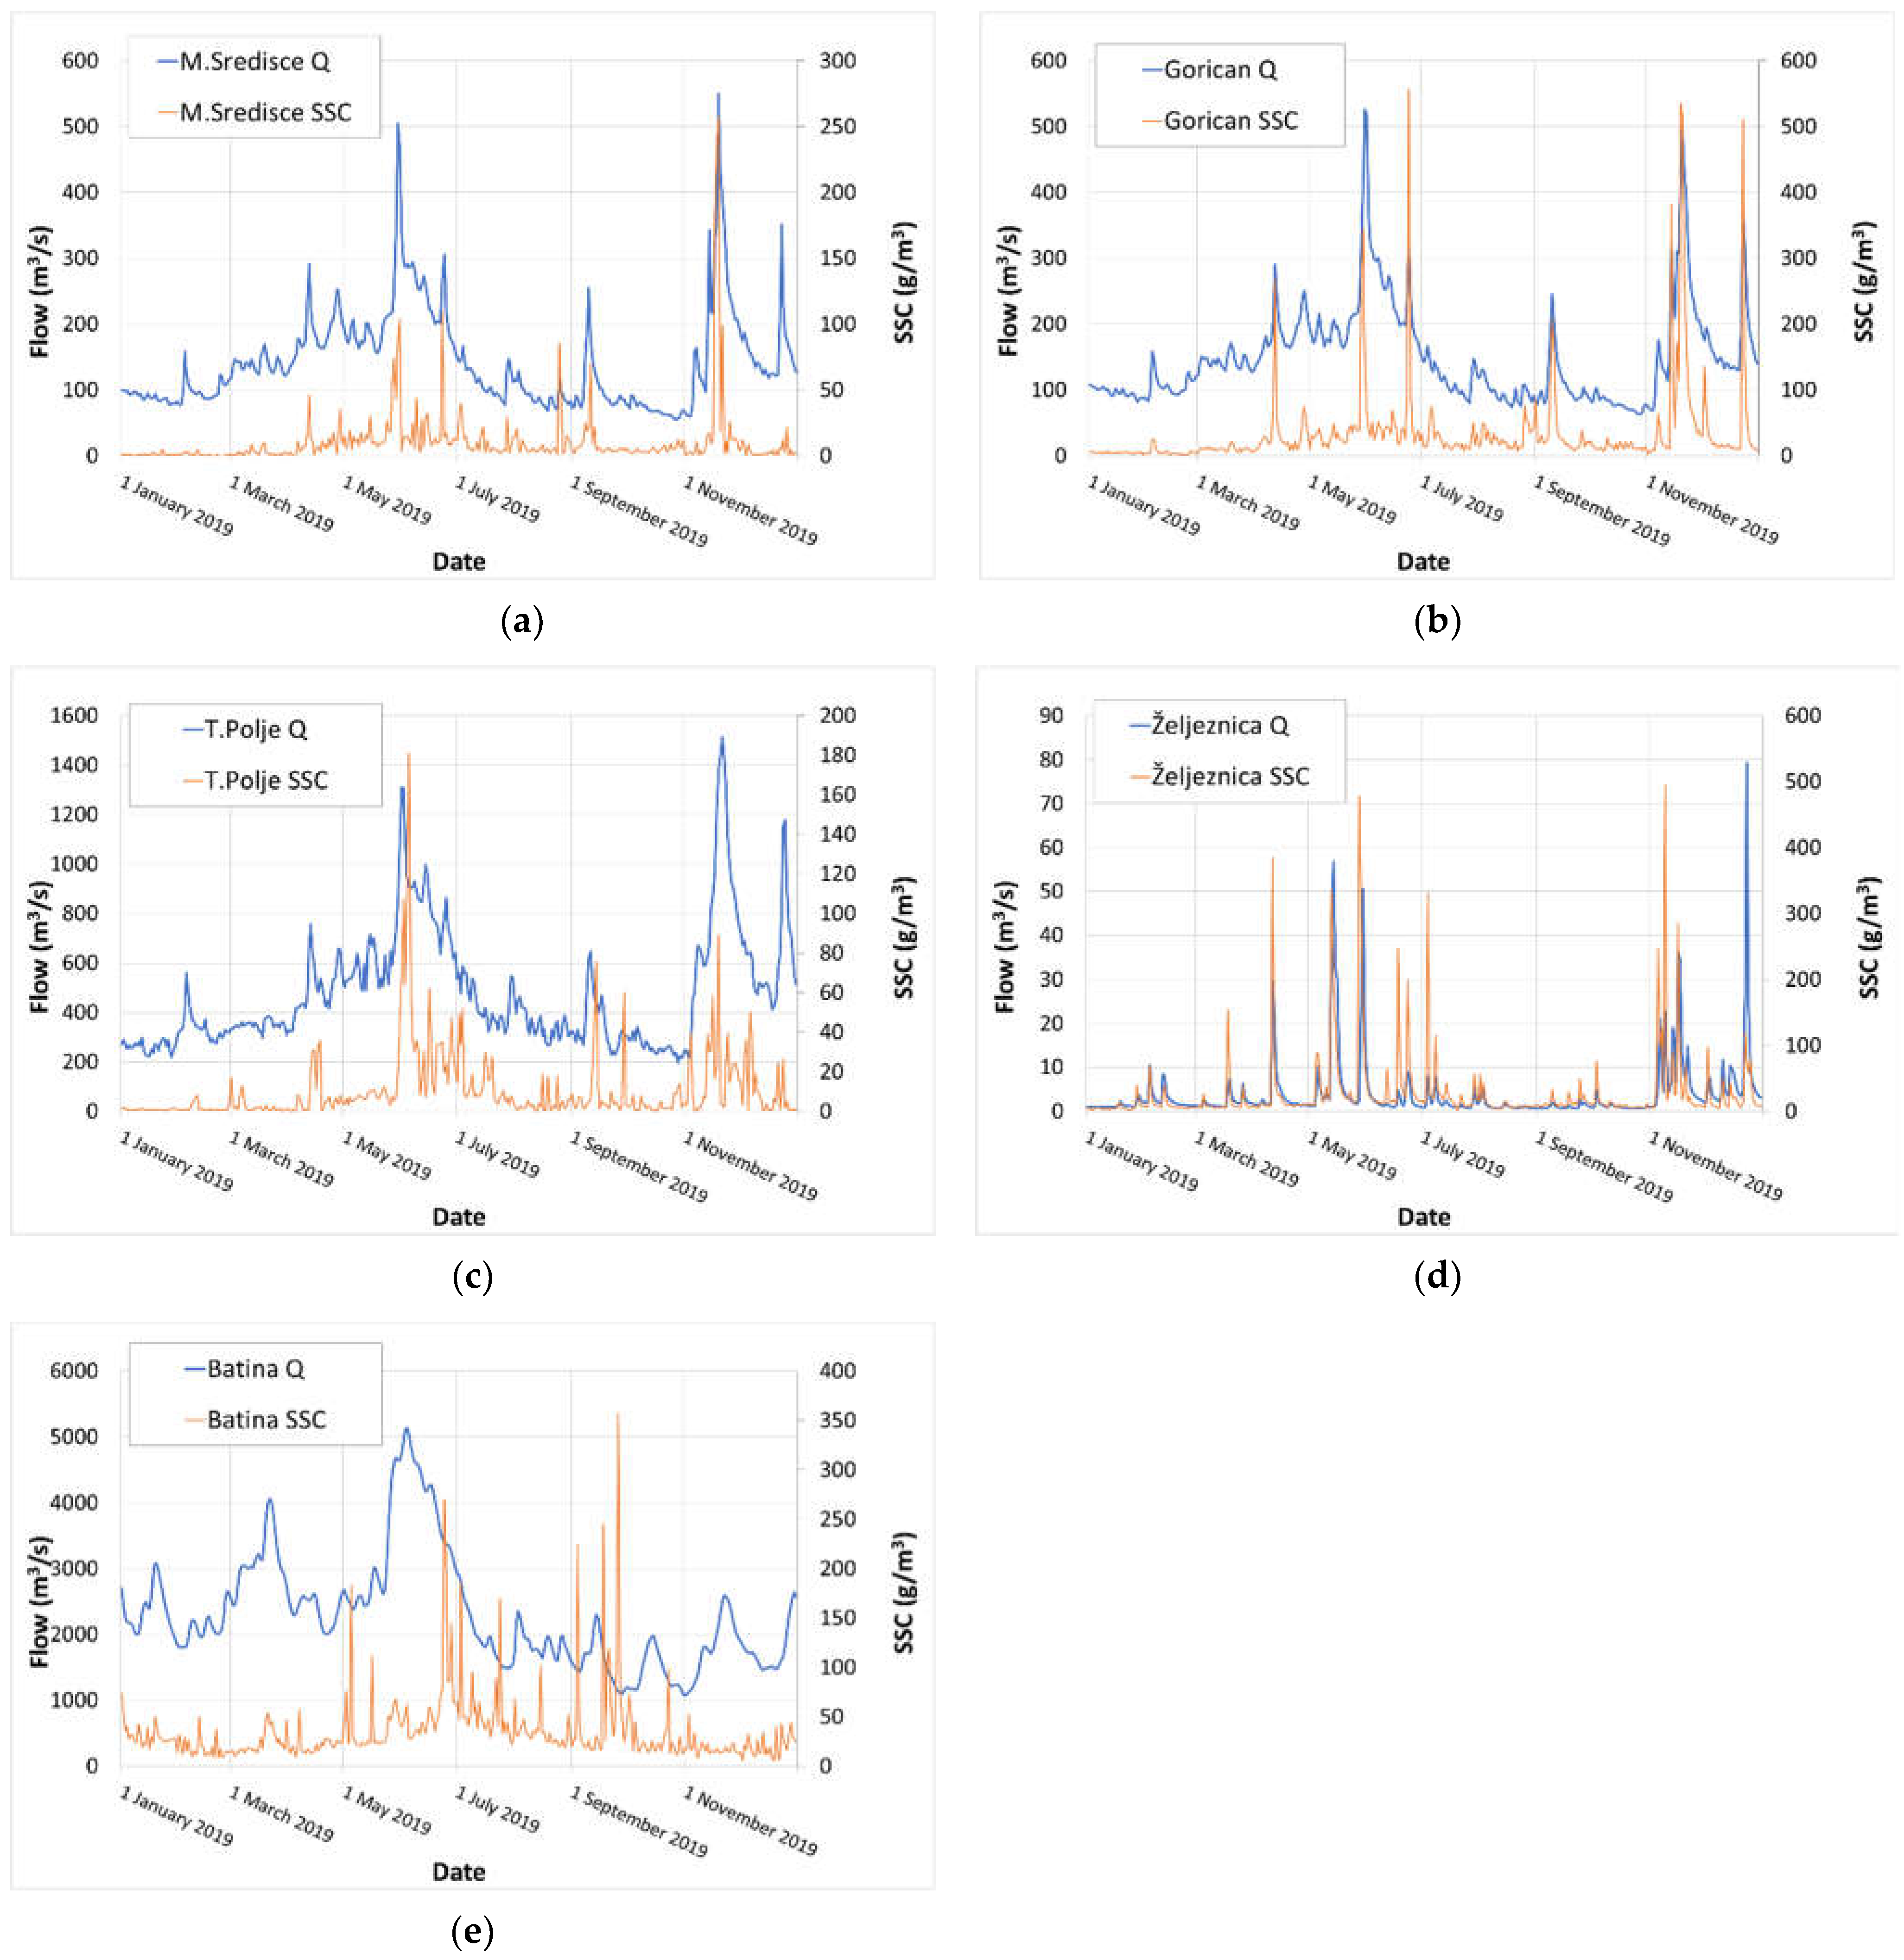
The original intention of this research was to analyse SS samples during the same events; however, given the nature of individual watercourses and the hydrological conditions on the basins, this was not possible because the maximum concentrations of the SS in the water did not always coincide with the same event (
Figure 2). As shown in
Table 2, in the case of the Mura River, samples affected during the same hydrological event were analysed, where the most significant transmission of SS was in the period of 17–20 November, as shown in
Figure 2a,b. Although this water wave with the highest annual flow was also recorded on the Drava, the concentrations of the SS were more elevated in June, according to
Figure 2c. Therefore, samples of suspended sediment during the water wave on the Drava River in June were selected for analysis. In the case of the Danube, the samples with the highest concentrations of SS appeared in June and September 2019, as shown in
Figure 2e. Samples from the small tributary Bednja River were taken in May, June, and September 2019, represented in
Figure 2d.
3.1. Sample Analysis
The Laboratory for Environmental Geochemistry at the Faculty of Geotechnical Engineering, University of Zagreb, analysed adequate samples with suspended matter. Filters with satisfactory suspended matter (SM) were acquired from the Croatian Hydrological and Meteorological Service and were selected for further handling. Then, aqua regia, a mixture of hydrochloric and nitric acids in a ratio of 3:1, 20 mL each, was added to an individual sample. The samples in the glasses were sealed with parafilm, placed in a Grant JB Academy JBA5 water bath, put in a fume cupboard, and heated at 50 °C for 6 h with occasional stirring. A reagent blank was prepared in the same way. The samples decomposed in this way were filtered through a Munktell blue ribbon filter of 90 mm and funnels for rapid filtration into labelled volumetric flasks of 100 mL. The remaining sediment in the glasses and on the filter paper was washed with ultrapure water (type 1), with which the volumetric flasks with the filtrate were filled up to the mark after the end of the filtration. Ultrapure or deionised water was obtained by a Millipore Direct-Q 3 UV system and had a conductivity of 0.05 µS/cm. Thus, disintegrated and prepared samples were analysed on a PerkinElmer Atomic Absorption Spectrometer Analyst 800. The elements analysed were Cu, Au, Zn, Cr, Mn, Fe, K, Na, Mg, Ca, Pb, Cd, Ni, As, Co, Se, Al, and Hg. Three techniques were used for the analysis: the elements Cu, Au, Zn, Cr, Mn, Fe, K, Na, Mg, and Ca were analysed by the flame technique (FAAS); the elements Pb, Cd, Ni, As, Co, Se, and Al were analysed by the graphite furnace technique (GFAAS); and Hg was analysed by the hydride technique (FIAS). Compressed air was used as the oxidant and acetylene 2.6 as the carrier gas for the flame technique. In the graphite furnace technique, argon 5.0 gas was used, which was also used for the hydride technique. Appropriate HCL or EDL lamps were used as radiation sources of a known wavelength for individual elements.
Standard solutions of known concentrations required for calibration were made from certified reference standard Inorganic Ventures or PerkinElmer Pure reagent solutions with a concentration of 1000 µg/mL, diluted to the required concentration with ultrapure water. These standard solutions were used to create calibration curves for which unknown sample concentrations were determined. During the calibration, the value of the reagent blank was also considered. PerkinElmer Pure matrix modifier solutions of 10,000 mg/L Pd (Pd (NO3)2 in 15% HNO3), 10% NH4H2PO4, and 10,000 mg/L Mg (Mg (NO3)2) were used for graphite furnace analyses. A nitric acid solution of 0.2% obtained from Merck ultrapure nitric acid 60% was also used for washing the autosampler. In the hydride technique analysis, a 0.2% NaBH4 solution obtained from Merck sodium borohydride p.a. was used as well as a 3% HCl solution obtained from Merck ultrapure hydrochloric acid 60%. Values derived by an atomic absorption spectrometer expressed in mg/L regarding the weight of an individual sample were converted into mg/kg of dry matter.
3.2. Results
Eighteen SM samples from different locations were obtained using an atomic absorption spectrometer, and eighteen values of elements expressed in mg/L with respect to the weight of each sample were converted to mg/kg. The analysed metals were Cu, Au, Zn, Cr, Mg, Fe, K, Na, Mn, Ca, Pb, Cd, Ni, Co, Al, and Hg, and the metalloids were As and Se.
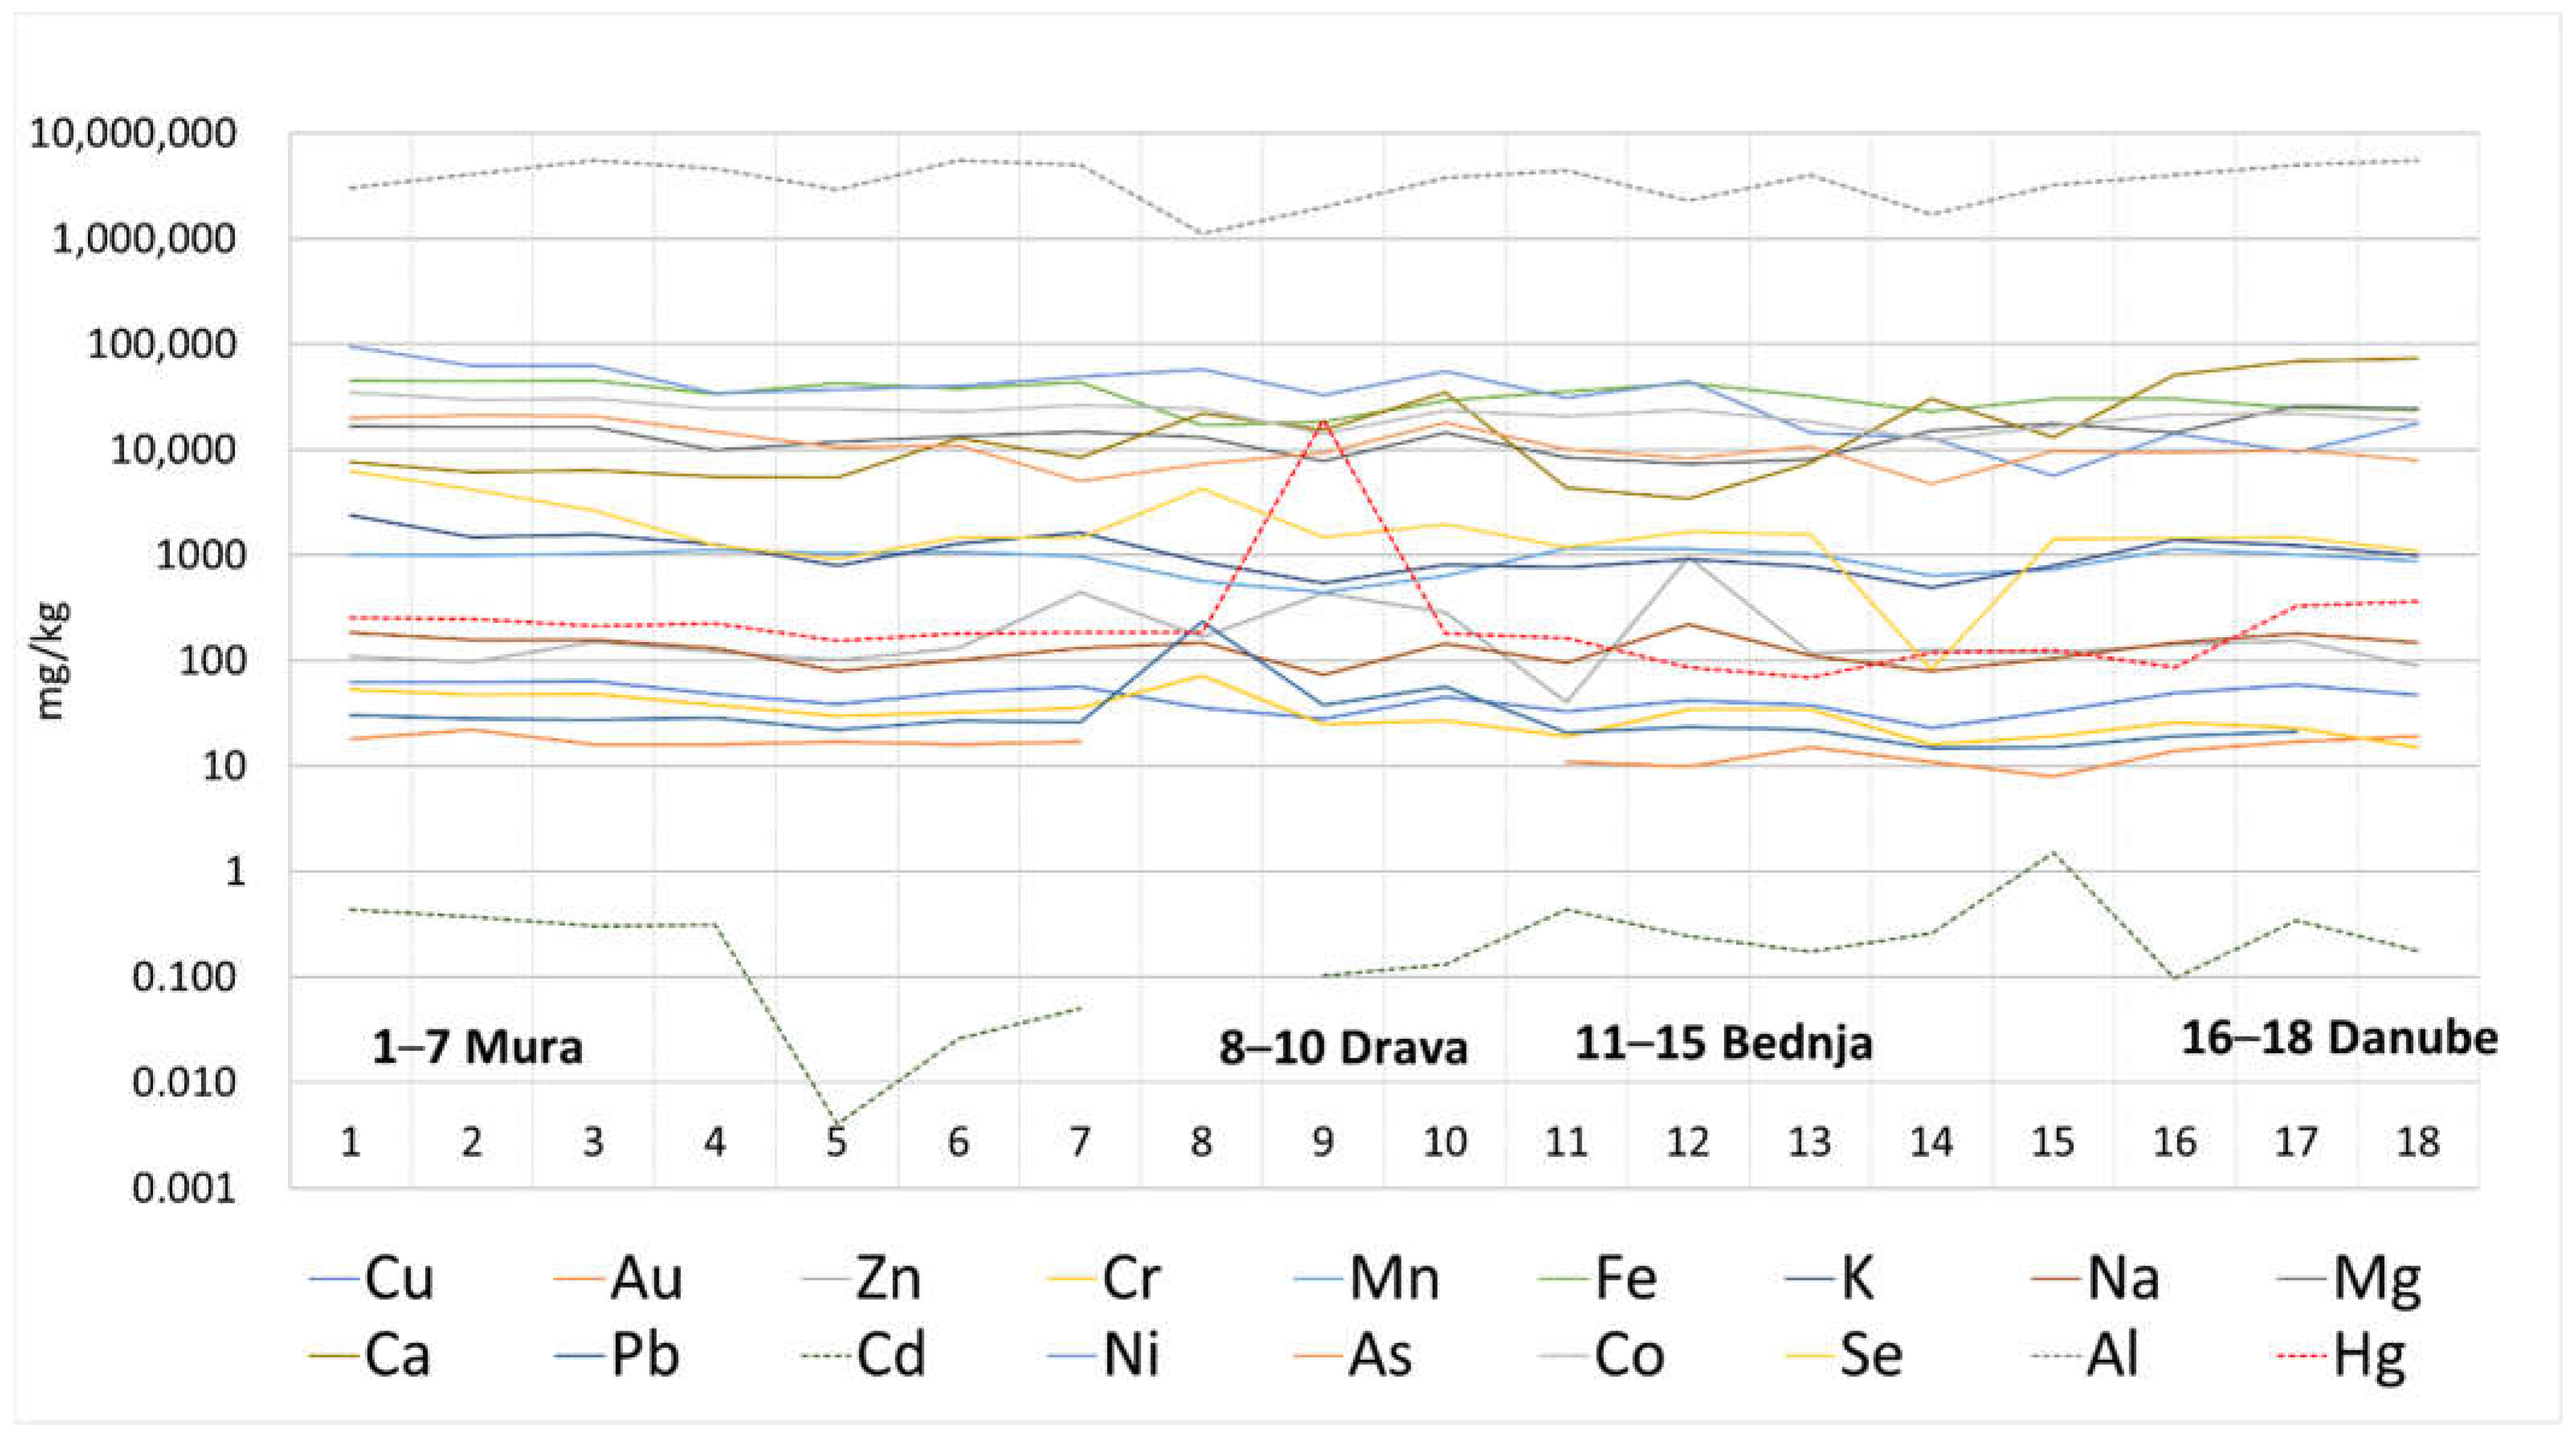
The graphical presentation in
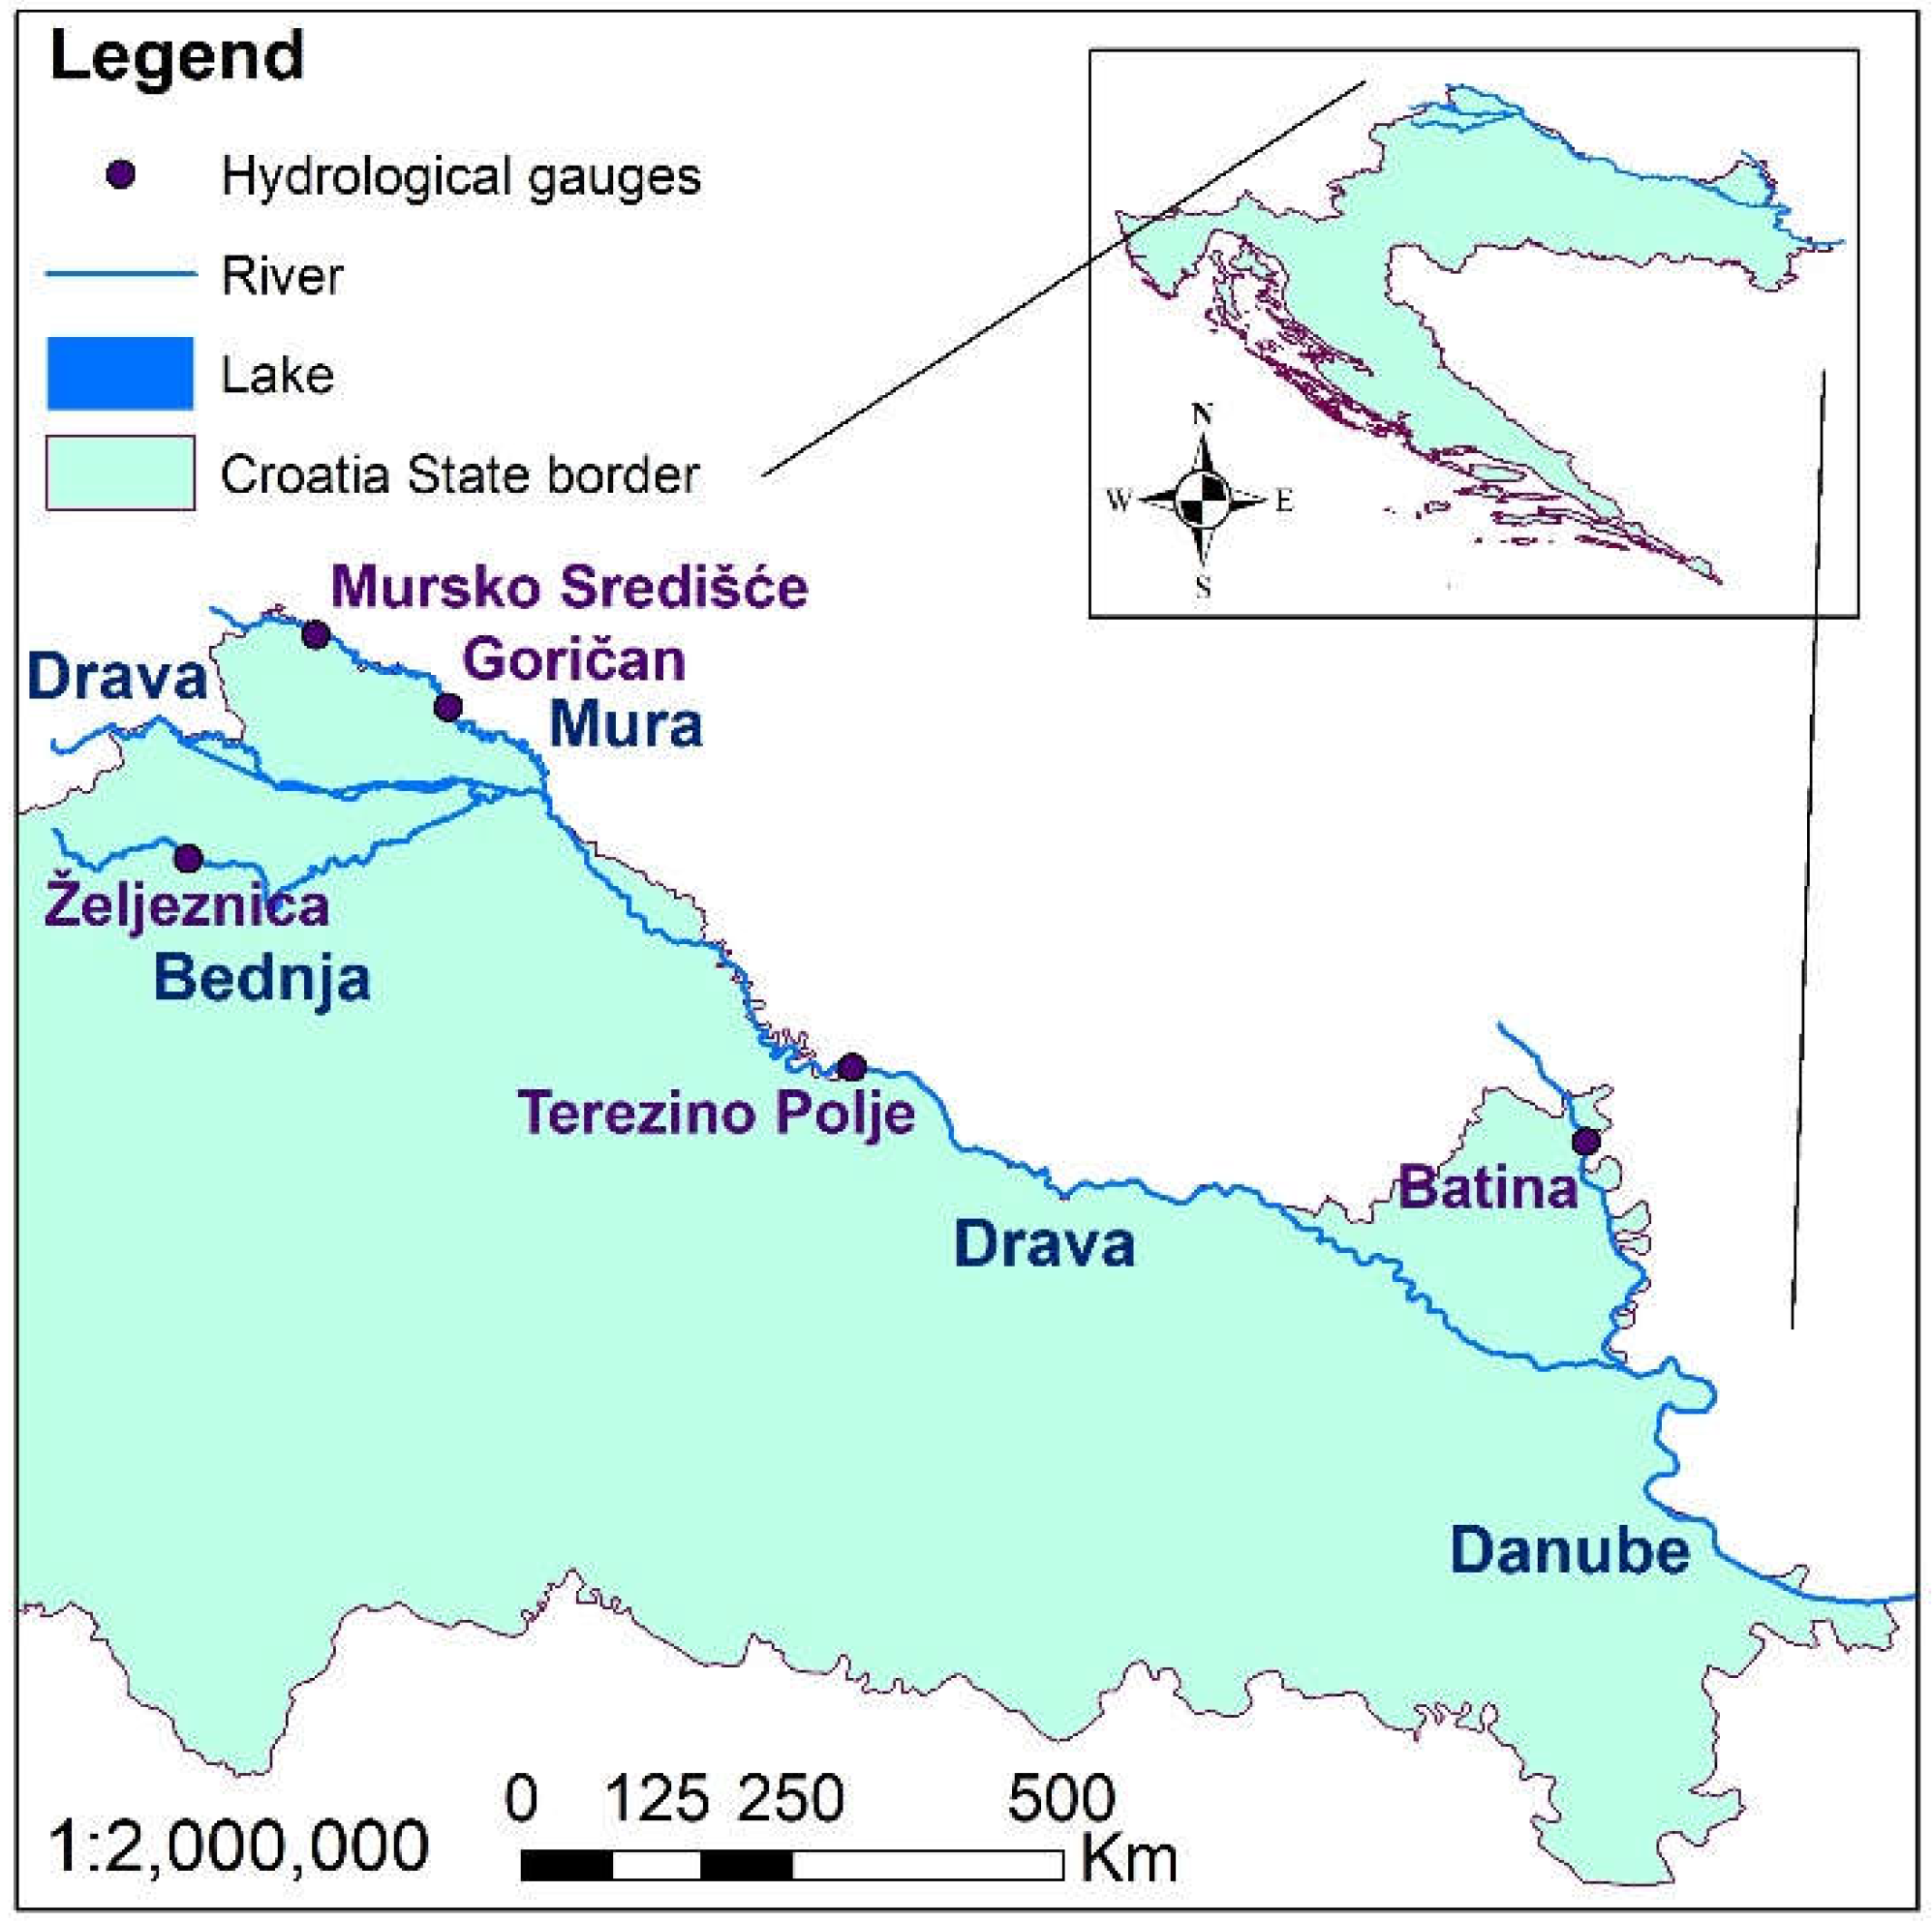
Figure 3 shows the concentration values in the analysed suspended dry matter. As shown on the map (
Figure 1) and the list of locations (
Table 2), the first seven values belong to the Mura River (three from cross-border HS Mursko Sredisce and four from cross-border HS Goričan). The next three are from the Drava River, cross-border HS Terezino Polje, and five samples are from the small Drava tributary, the Bednja River. Finally, at least three samples are from the Danube River, at HS Batina, close to the Republic of Croatia (HR) and the Republic of Hungary (HU) state border. The average concentrations of the elements are shown in
Figure 3.
4. Discussion
Due to mutual relations, for this research, it was necessary to refer to previous studies of heavy metals (Hg, Pb, Zn, Cu, etc.) (
Figure 4) and metalloids (As) in the shallow soil layer (topsoil). In the river alluvium, due to occasional flooding, the surface of the terrain is covered with suspended river sediment [
21,
22]. The Drava and Mura Rivers drain the mountain massifs of the Alps, which contain mineralisation and mineral deposits of Pb and Zn. Exploitation of the mentioned heavy metals in Austria and near Mežice in Slovenia can cause an anthropogenic anomaly in the topsoil of the Drava and Mura River alluvium. The content of As, Cd, Cu, and Hg in the soils of the Drava River valley is higher than the calculated baseline values (
Figure 4 and
Figure 5), while Pb and Zn contents are anomalous. As, Pb, and Zn have higher concentrations than permitted for ecological food production as prescribed by Croatian regulations. An elevated Hg concentration was established in the urban area of the city of Varaždin, primarily because of traffic and fossil fuel combustion. The performed study has also shown that the mentioned metals’ content decreases with the soil’s depth to concentration values recorded before mining activity [
21,
23]. The Bednja River catchment also partly belongs to the Pb–Zn ore mineralisation area of Mt. Ivanščica, located in the Middle Triassic carbonate rocks near the town of Ivanec, Hrvatsko Zagorje [
24]. Additionally, there is a long-standing tradition of gold panning in the Mura and Drava alluvium area. Tiny grains of gold originated from mining activities of gold and silver ore deposits in the Austrian Alps province of Carinthia [
25].
The main mineralogical composition of the Drava River alluvium is quartz, feldspar, plagioclase, carbonate (calcite) and dolomite of carbonate rock grains (limestone and dolomite), kaolinite, chlorites, magnetite, rutile, zircon, etc. [
25,
26].
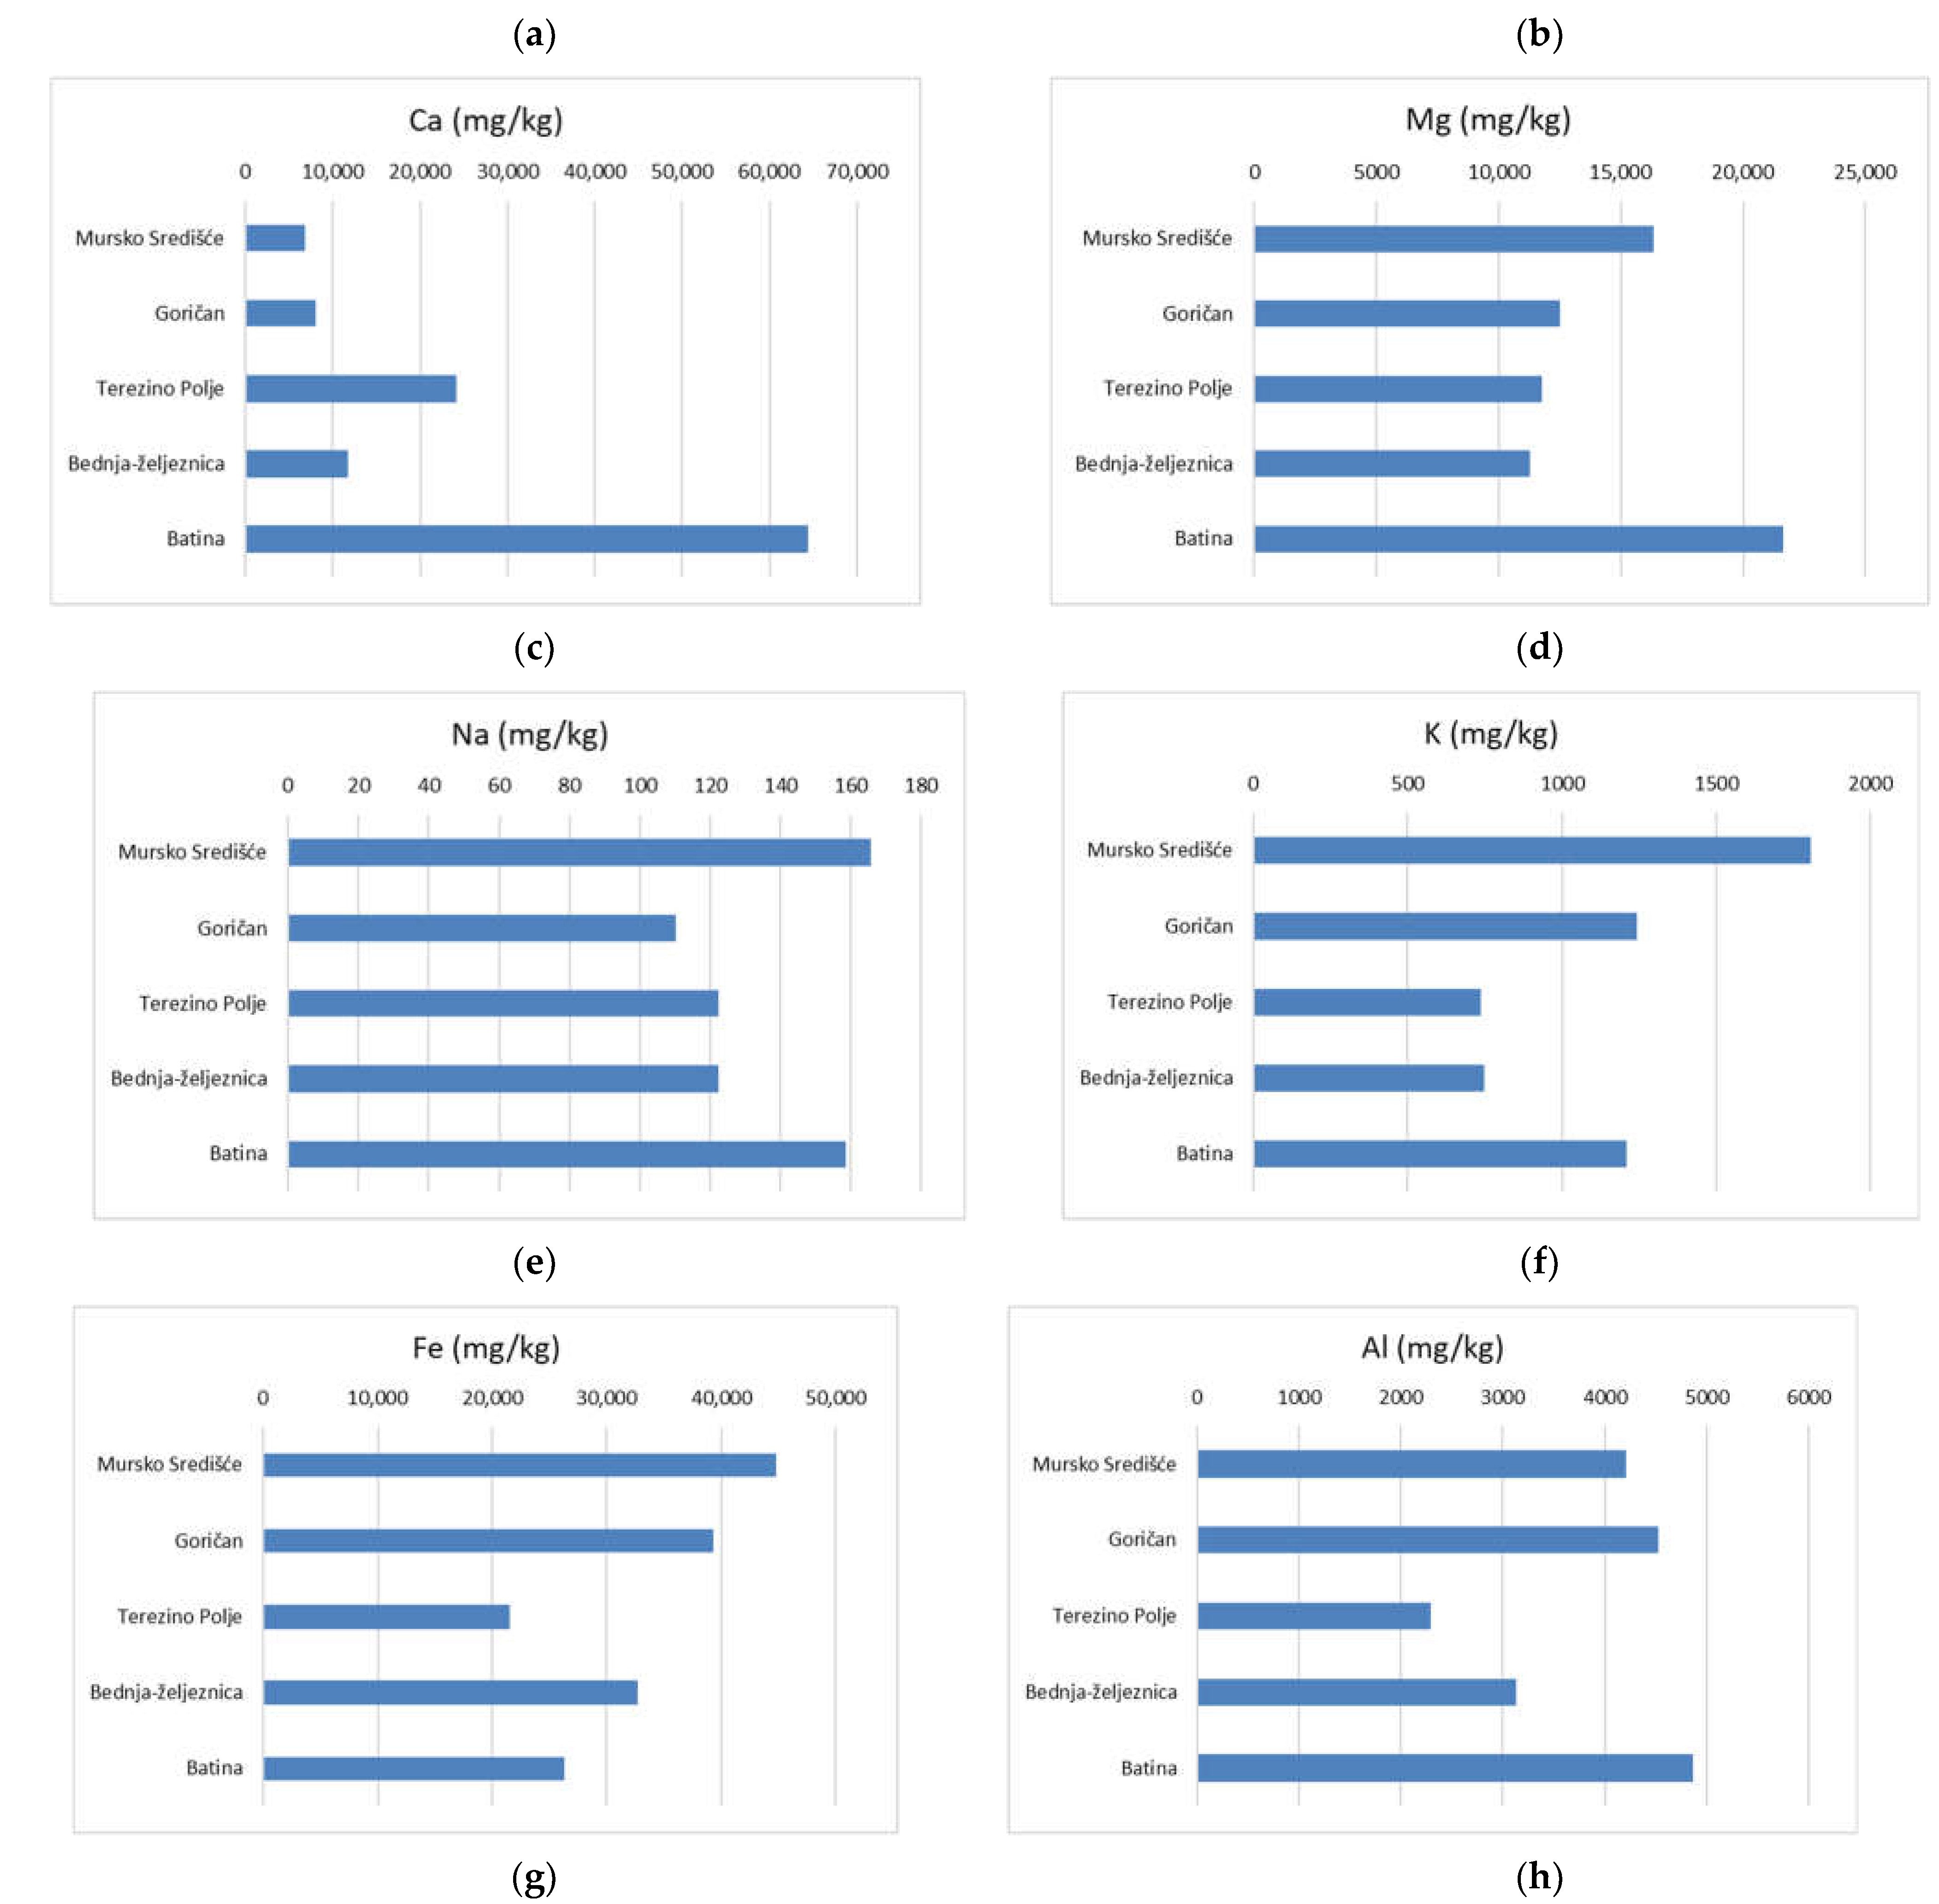
The concentrations of Ca, Mg, Na, K, Fe, and Al (
Figure 4 and
Figure 5) in the suspended sediments (
Figure 3 and
Figure 4) are mainly the consequence of weathering of the Mura, Drava, and Bednja Rivers’ deposits rich in carbonate components (Ca and Mg). In contrast, the highest values in the SS of the Danube River near Batina village reflect an increased concentration of ferromagnesium minerals in clastites of alluvium deposits in the recharge area.
In addition, the higher Na and K contents reflect the enrichment of minerals having a high concentration of sodium (plagioclase) and potassium micaceous minerals, probably muscovite, according to the values present in soils of flooding plains [
22]. The concentrations of Fe and Al in SS are comparable with their content in the topsoil of the Mura, Drava, and Bednja Rivers’ flood plains. The average highest concentration of Al measured in SS from the Danube River could result from the prevailing content of fine-grained clay fraction in the SS [
22].
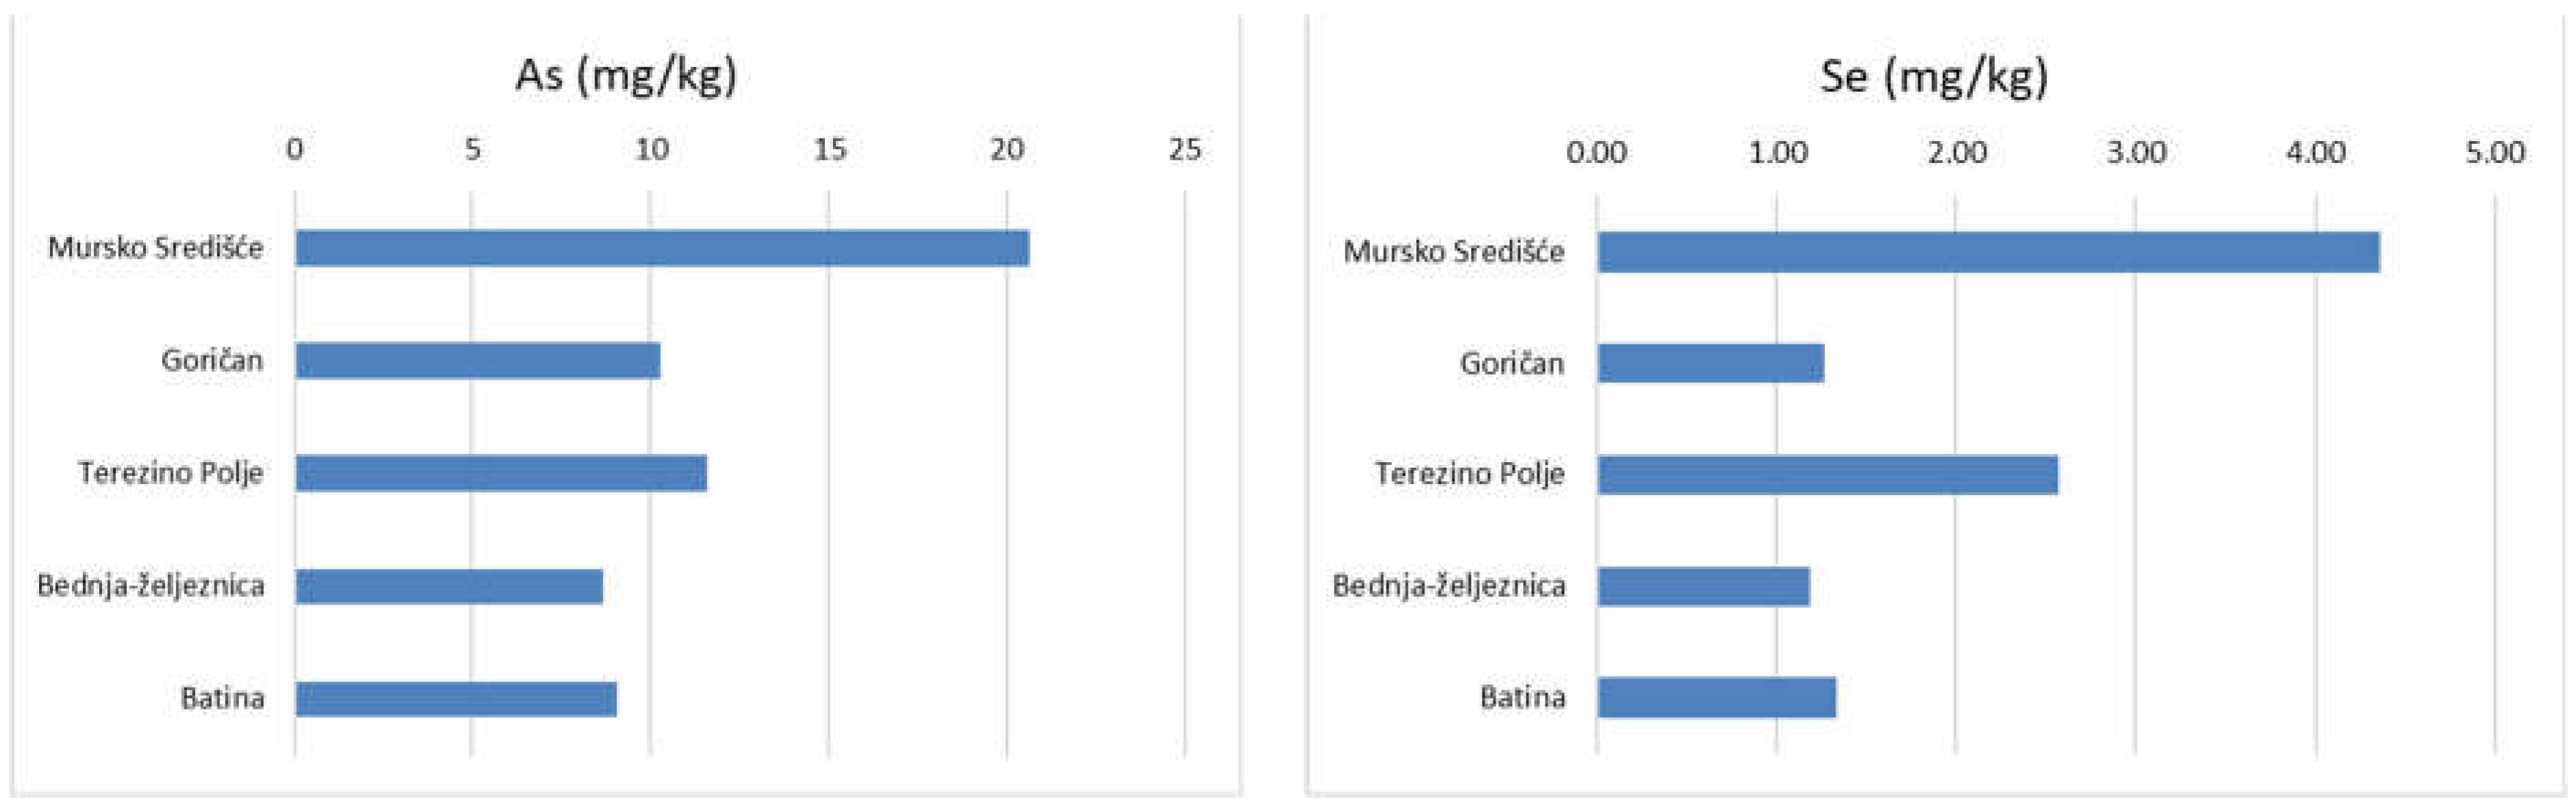
The average As and Se contents in the SS (
Figure 4) followed the same distribution and could be of geogenic and anthropogenic origin (As) somewhere elevated, as the concentrations could indicate the past use of some pesticides/insecticides, but the obtained values are in the range of concentrations found in the topsoil layer of flood plains of rivers.
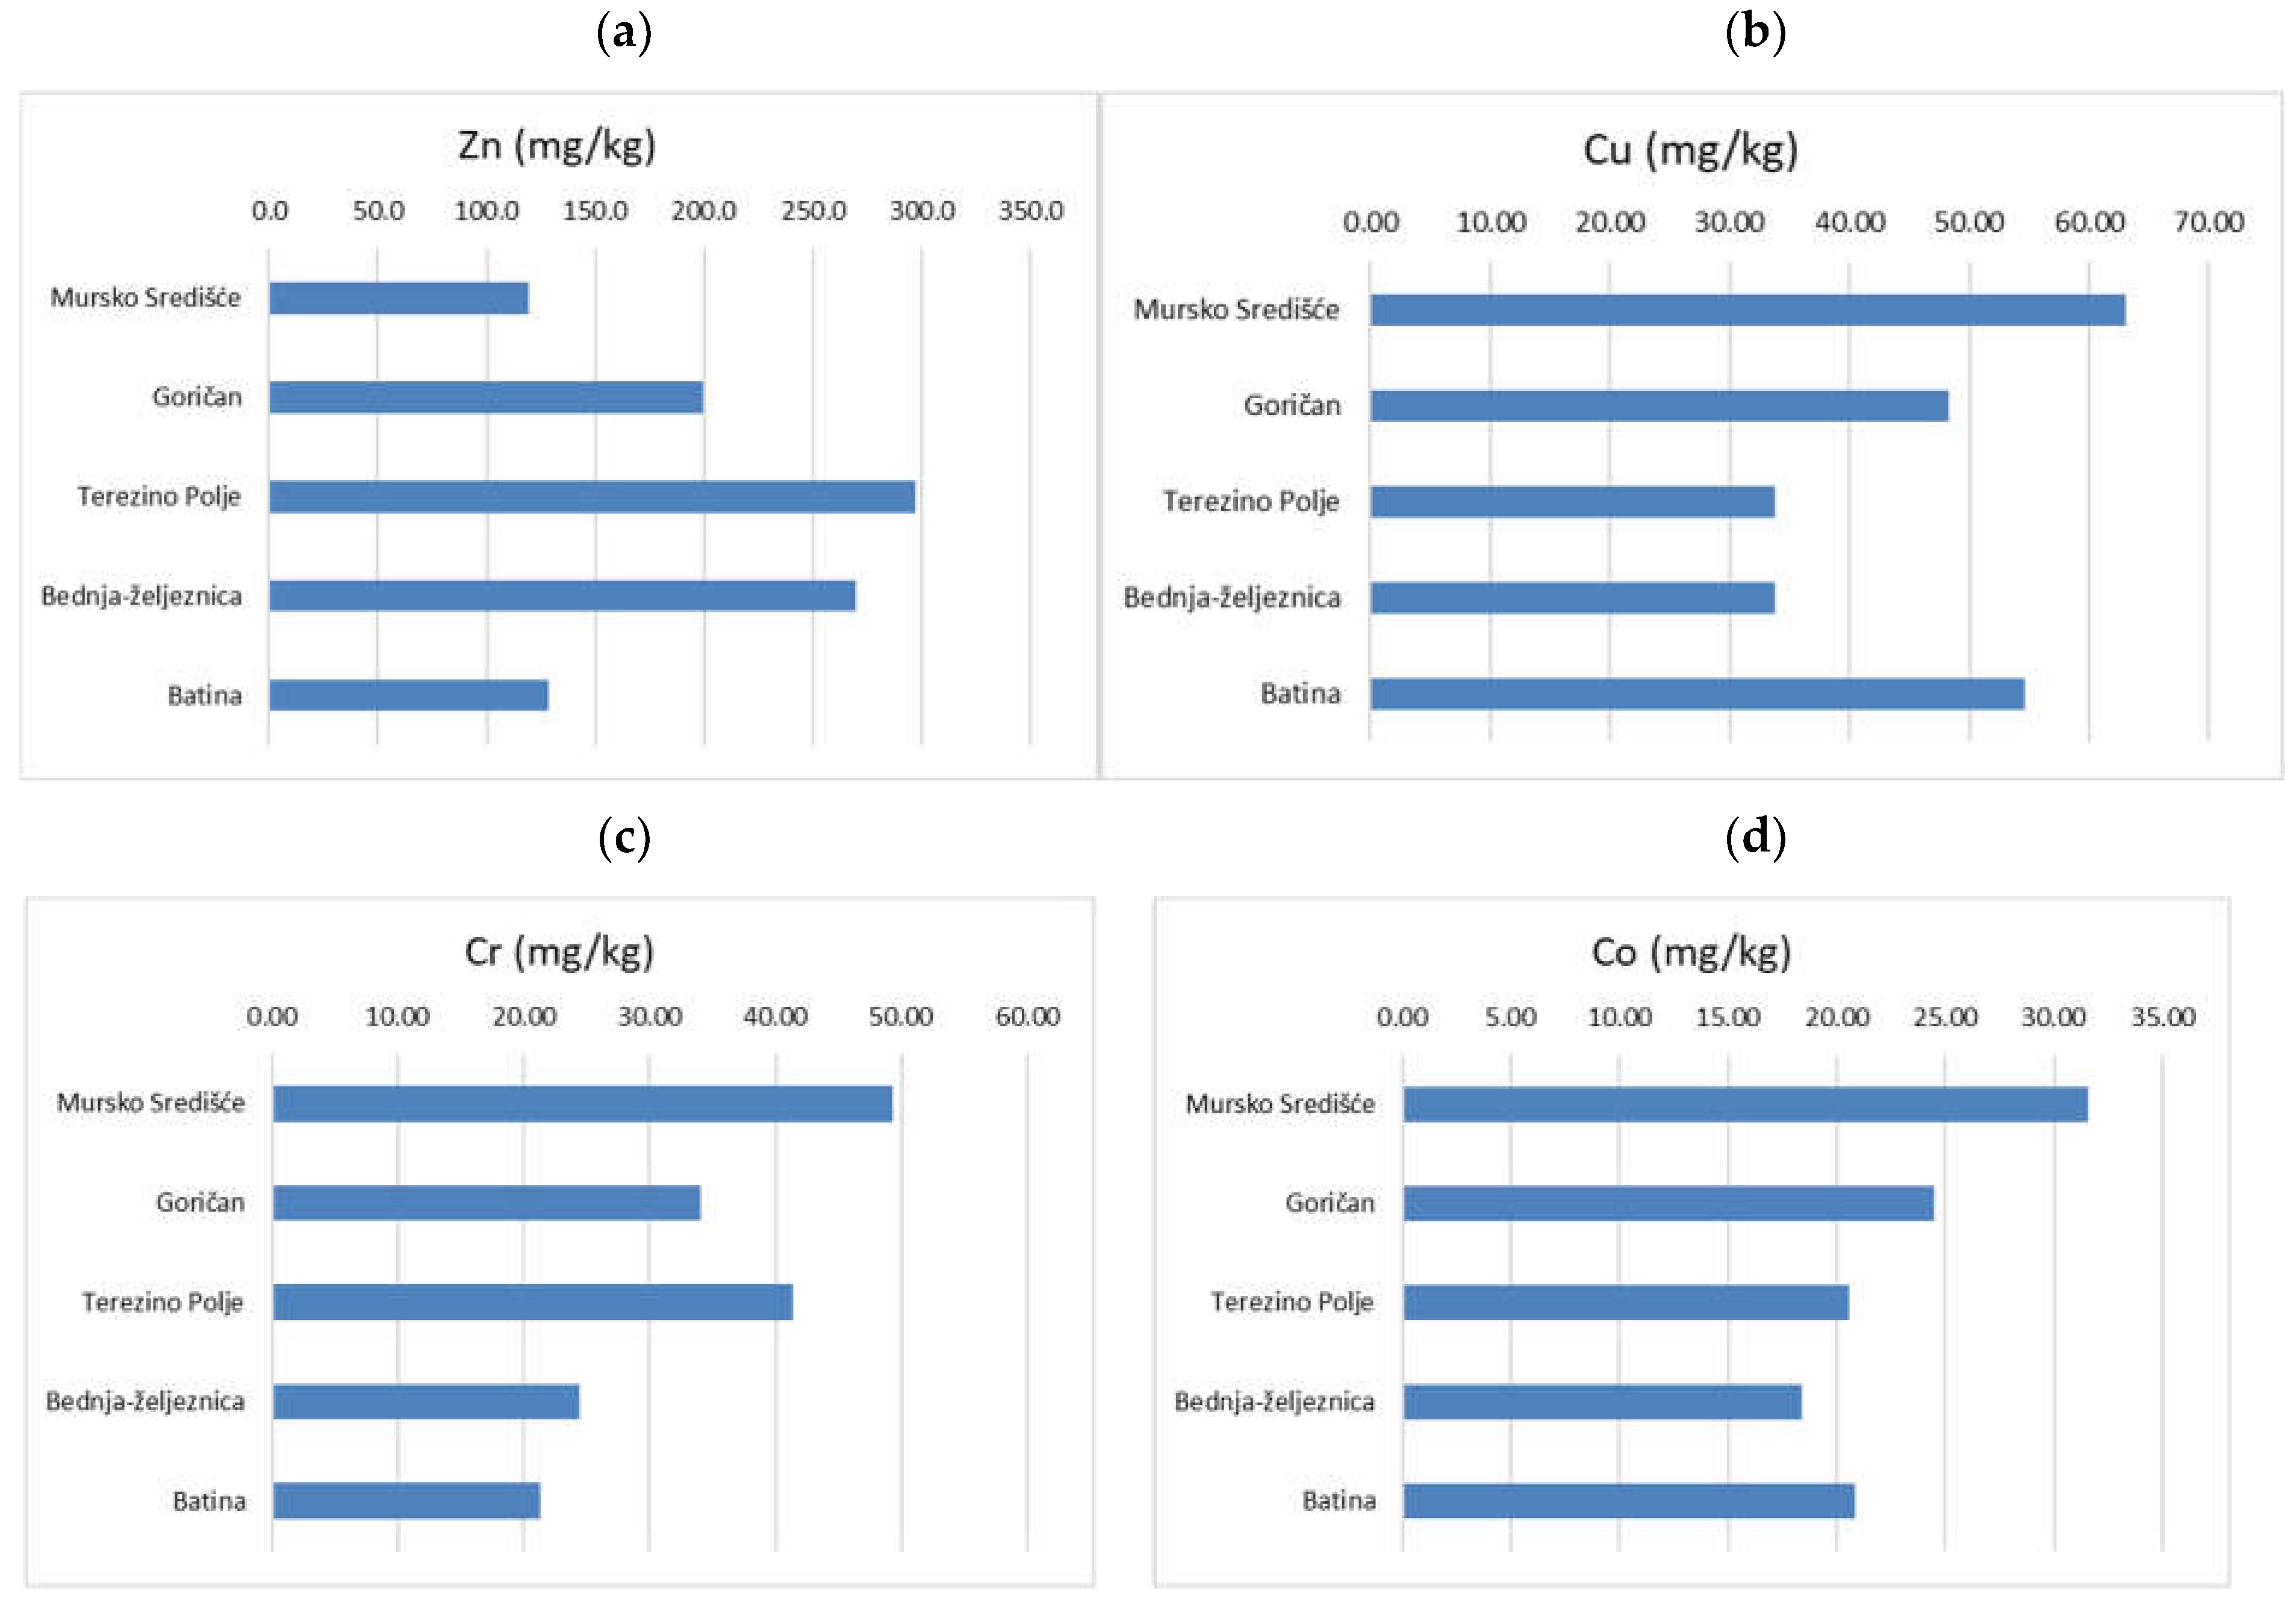
The concentrations of Co, Cr, Ni, and Cu in SS (
Figure 4 and
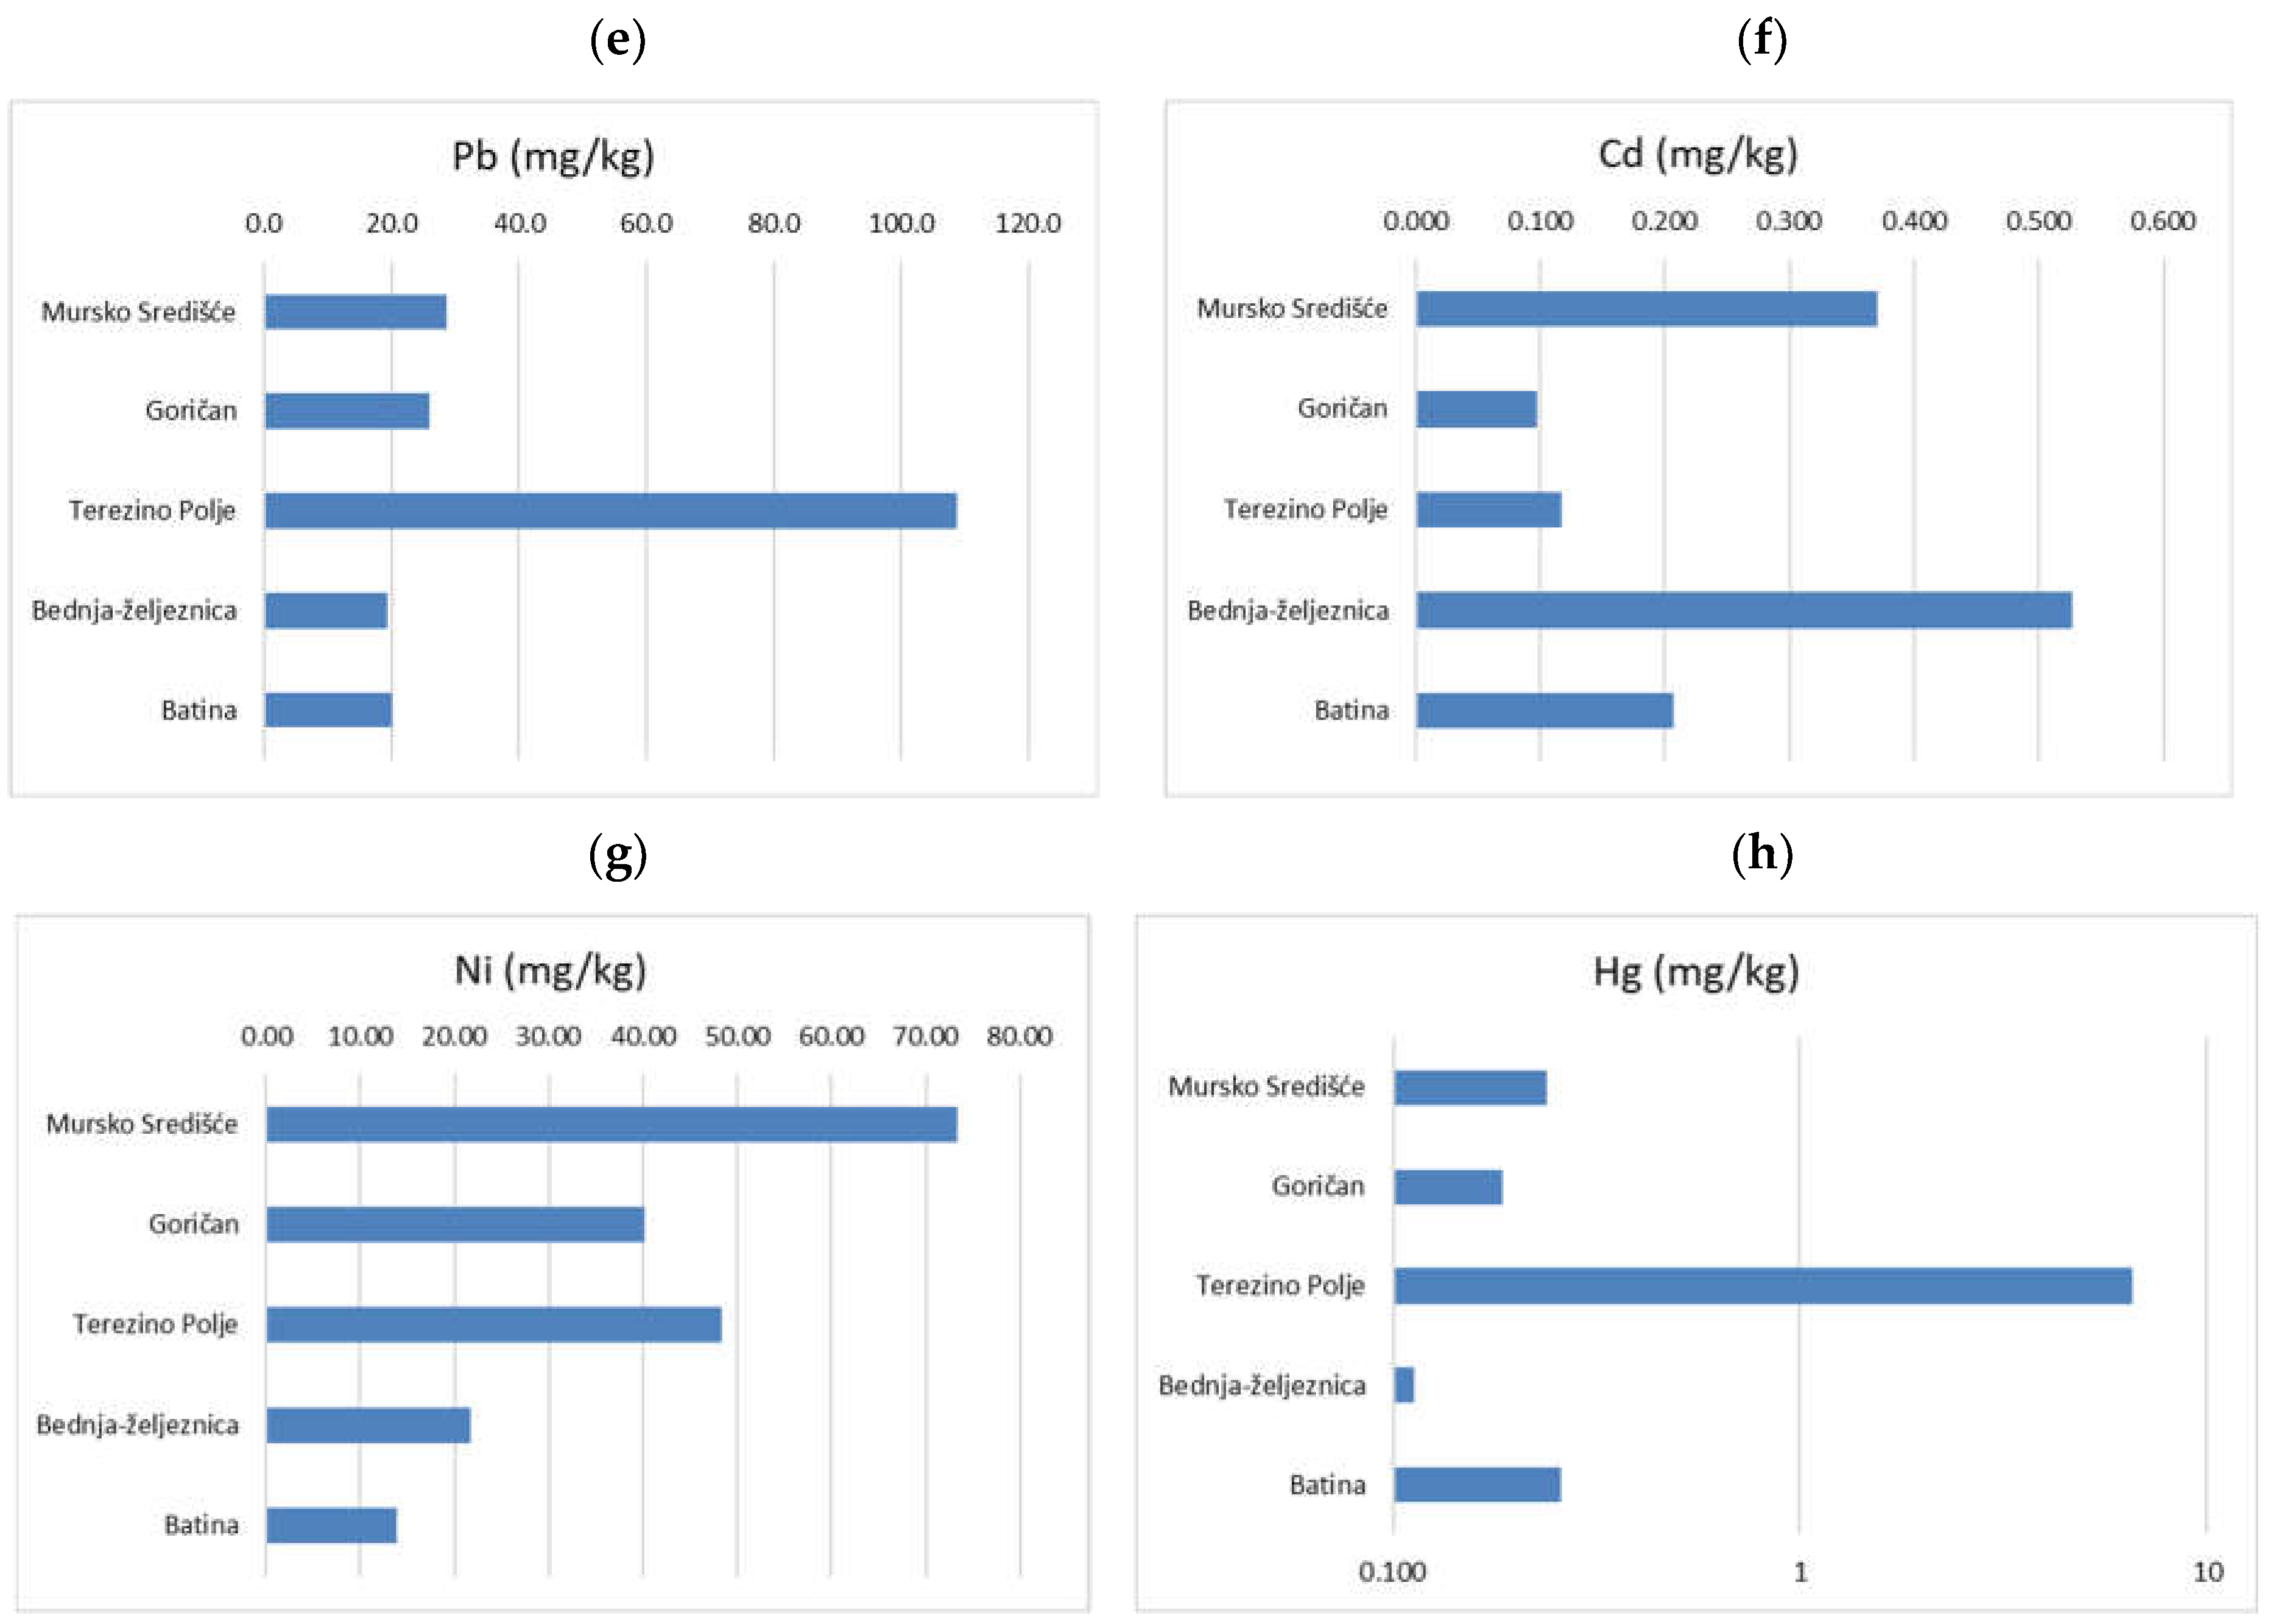
Figure 5) are linked with the heavy metal fraction, but only the Cu concentration increased because of possible anthropogenic input from different sources (phosphate fertilisers, application of cuprum blue in vineyards, and industry). The SS sample analysis results showed an extremely high mercury concentration in sample No. 9, as seen in
Figure 3. This sample of water and suspended sediment was taken on 3.6.2019 at HS Drava-Terezino Polje during the maximum water wave between 2 and 3 June (
Table 2,
Figure 2c). The region of the Mura, Drava, and Danube alluvium has the highest values of Pb in topsoil in Croatia, which relates to lead deposit mining upstream in Slovenia and Austria (Mežice and Bleiburg) over the last two centuries. The flood plain of the Danube River is also enriched with Pb, but is mainly due to anthropogenic impact from different sources somewhere in the Republic of Hungary. The mentioned metals’ concentration ranges are similar to the ranges obtained in the topsoil of rivers of alluvium flood pains.
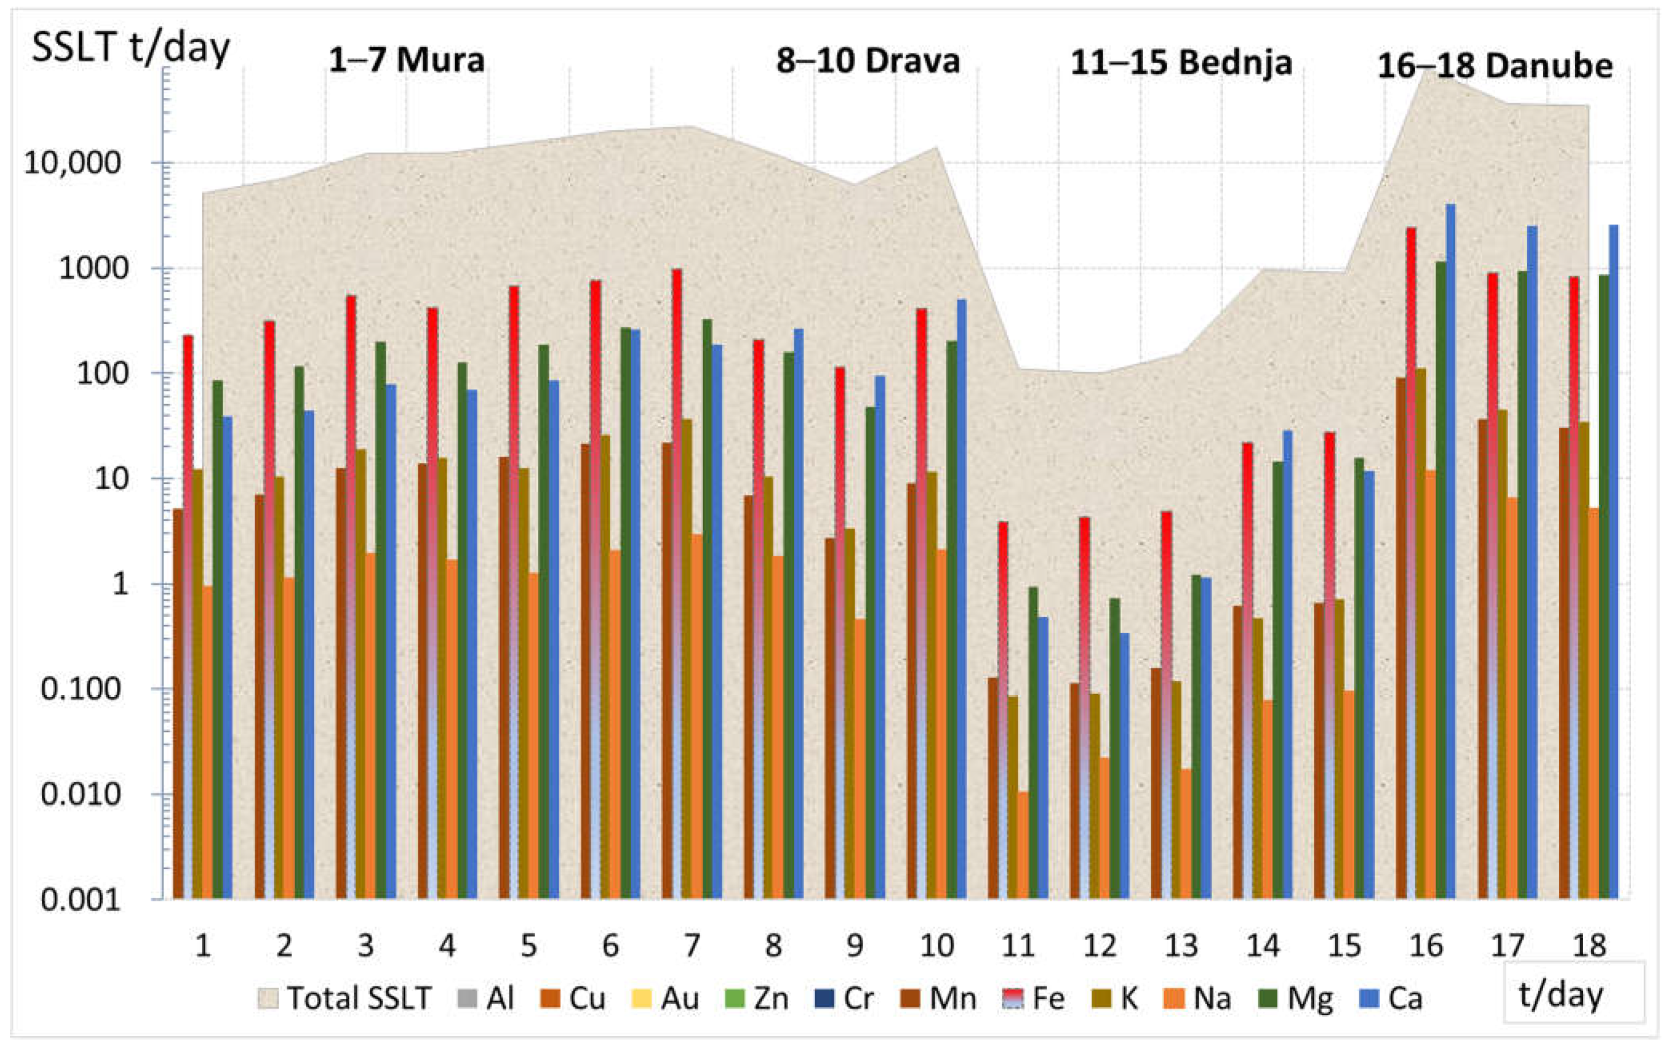
The primary purpose of this investigation was to calculate the daily values of a particular chemical element in the suspended sediment load transport (SSLT). The total amount of each element is based on the results of its concentration obtained by the analysis of the filters (
Figure 3) and the total daily suspended sediment load transport (SSLT) (
Table 1). The daily amounts of metal (Cu, Au, Zn, Cr, Mn, Fe, K, Na, Mn, Ca, and Al) in tonnes are shown in
Table 3 and
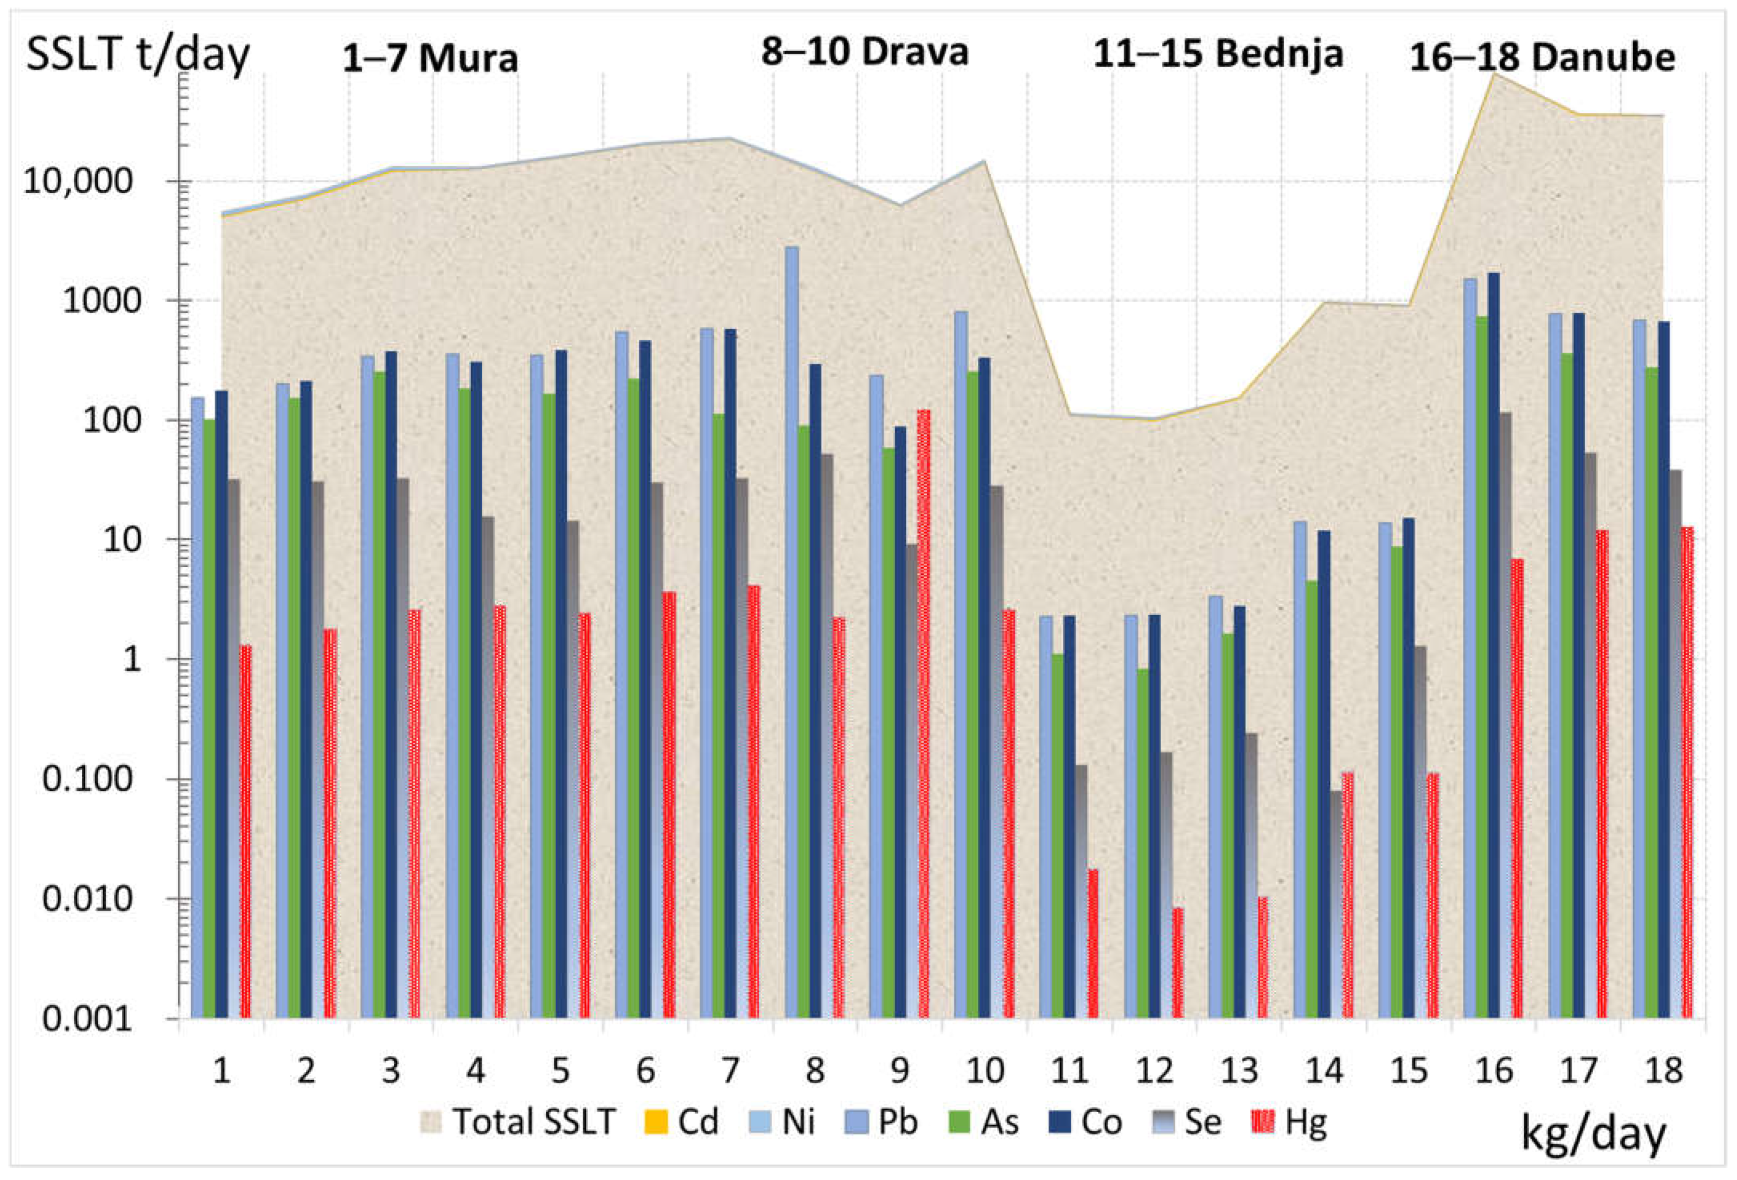
Figure 6. In addition, the daily amounts of heavy metals and metalloids (Pb, Cd, Ni, As, Co, Se, and Hg) transferred downstream in kg/day are shown in
Table 4 and
Figure 7.
Table 4 and the graphic in
Figure 7 highlight the extreme daily value of mercury of 119 kg in Terezino Polje on 3 May 2019. Due to the high flow of the Danube River and the significant daily amounts of SSLT at HS Batina, the concentration of mercury increased during the peak flow in June and ranged between 11.78 and 12.74 kg per day. Unlike other cross-border rivers, in the Bednja tributary in the profile of HS Željeznica (samples No. 11–15), the values of mercury concentration were minimal and ranged from 0.009 to 0.114 kg per day.
However, given their toxicity, large amounts of dangerous heavy metals such as lead, nickel, and cobalt and the metalloid arsenic are of particular concern. From
Table 4 and
Figure 7, it can be seen that a considerable amount of lead (Pb) is transported in suspended sediment in the Mura River (HS Goričan), Drava River (HS Terezino Polje), and Danube River. The highest value of 2801.32 kg/day was measured at HS Drava-Terezino Polje during peak discharge Q = 1306 m
3/s, followed by 1513.44 kg/day at HS Dunav-Batina, on the recession site of the highest peak flow hydrograph (
Figure 2e). At HS Batina, large quantities of aluminium (182–318 t), calcium (2507–4021 t), and other elements such as iron (Fe), manganese (Mn), and magnesium (Mg) were carried through the Danube River.
4.1. Correlation Analysis
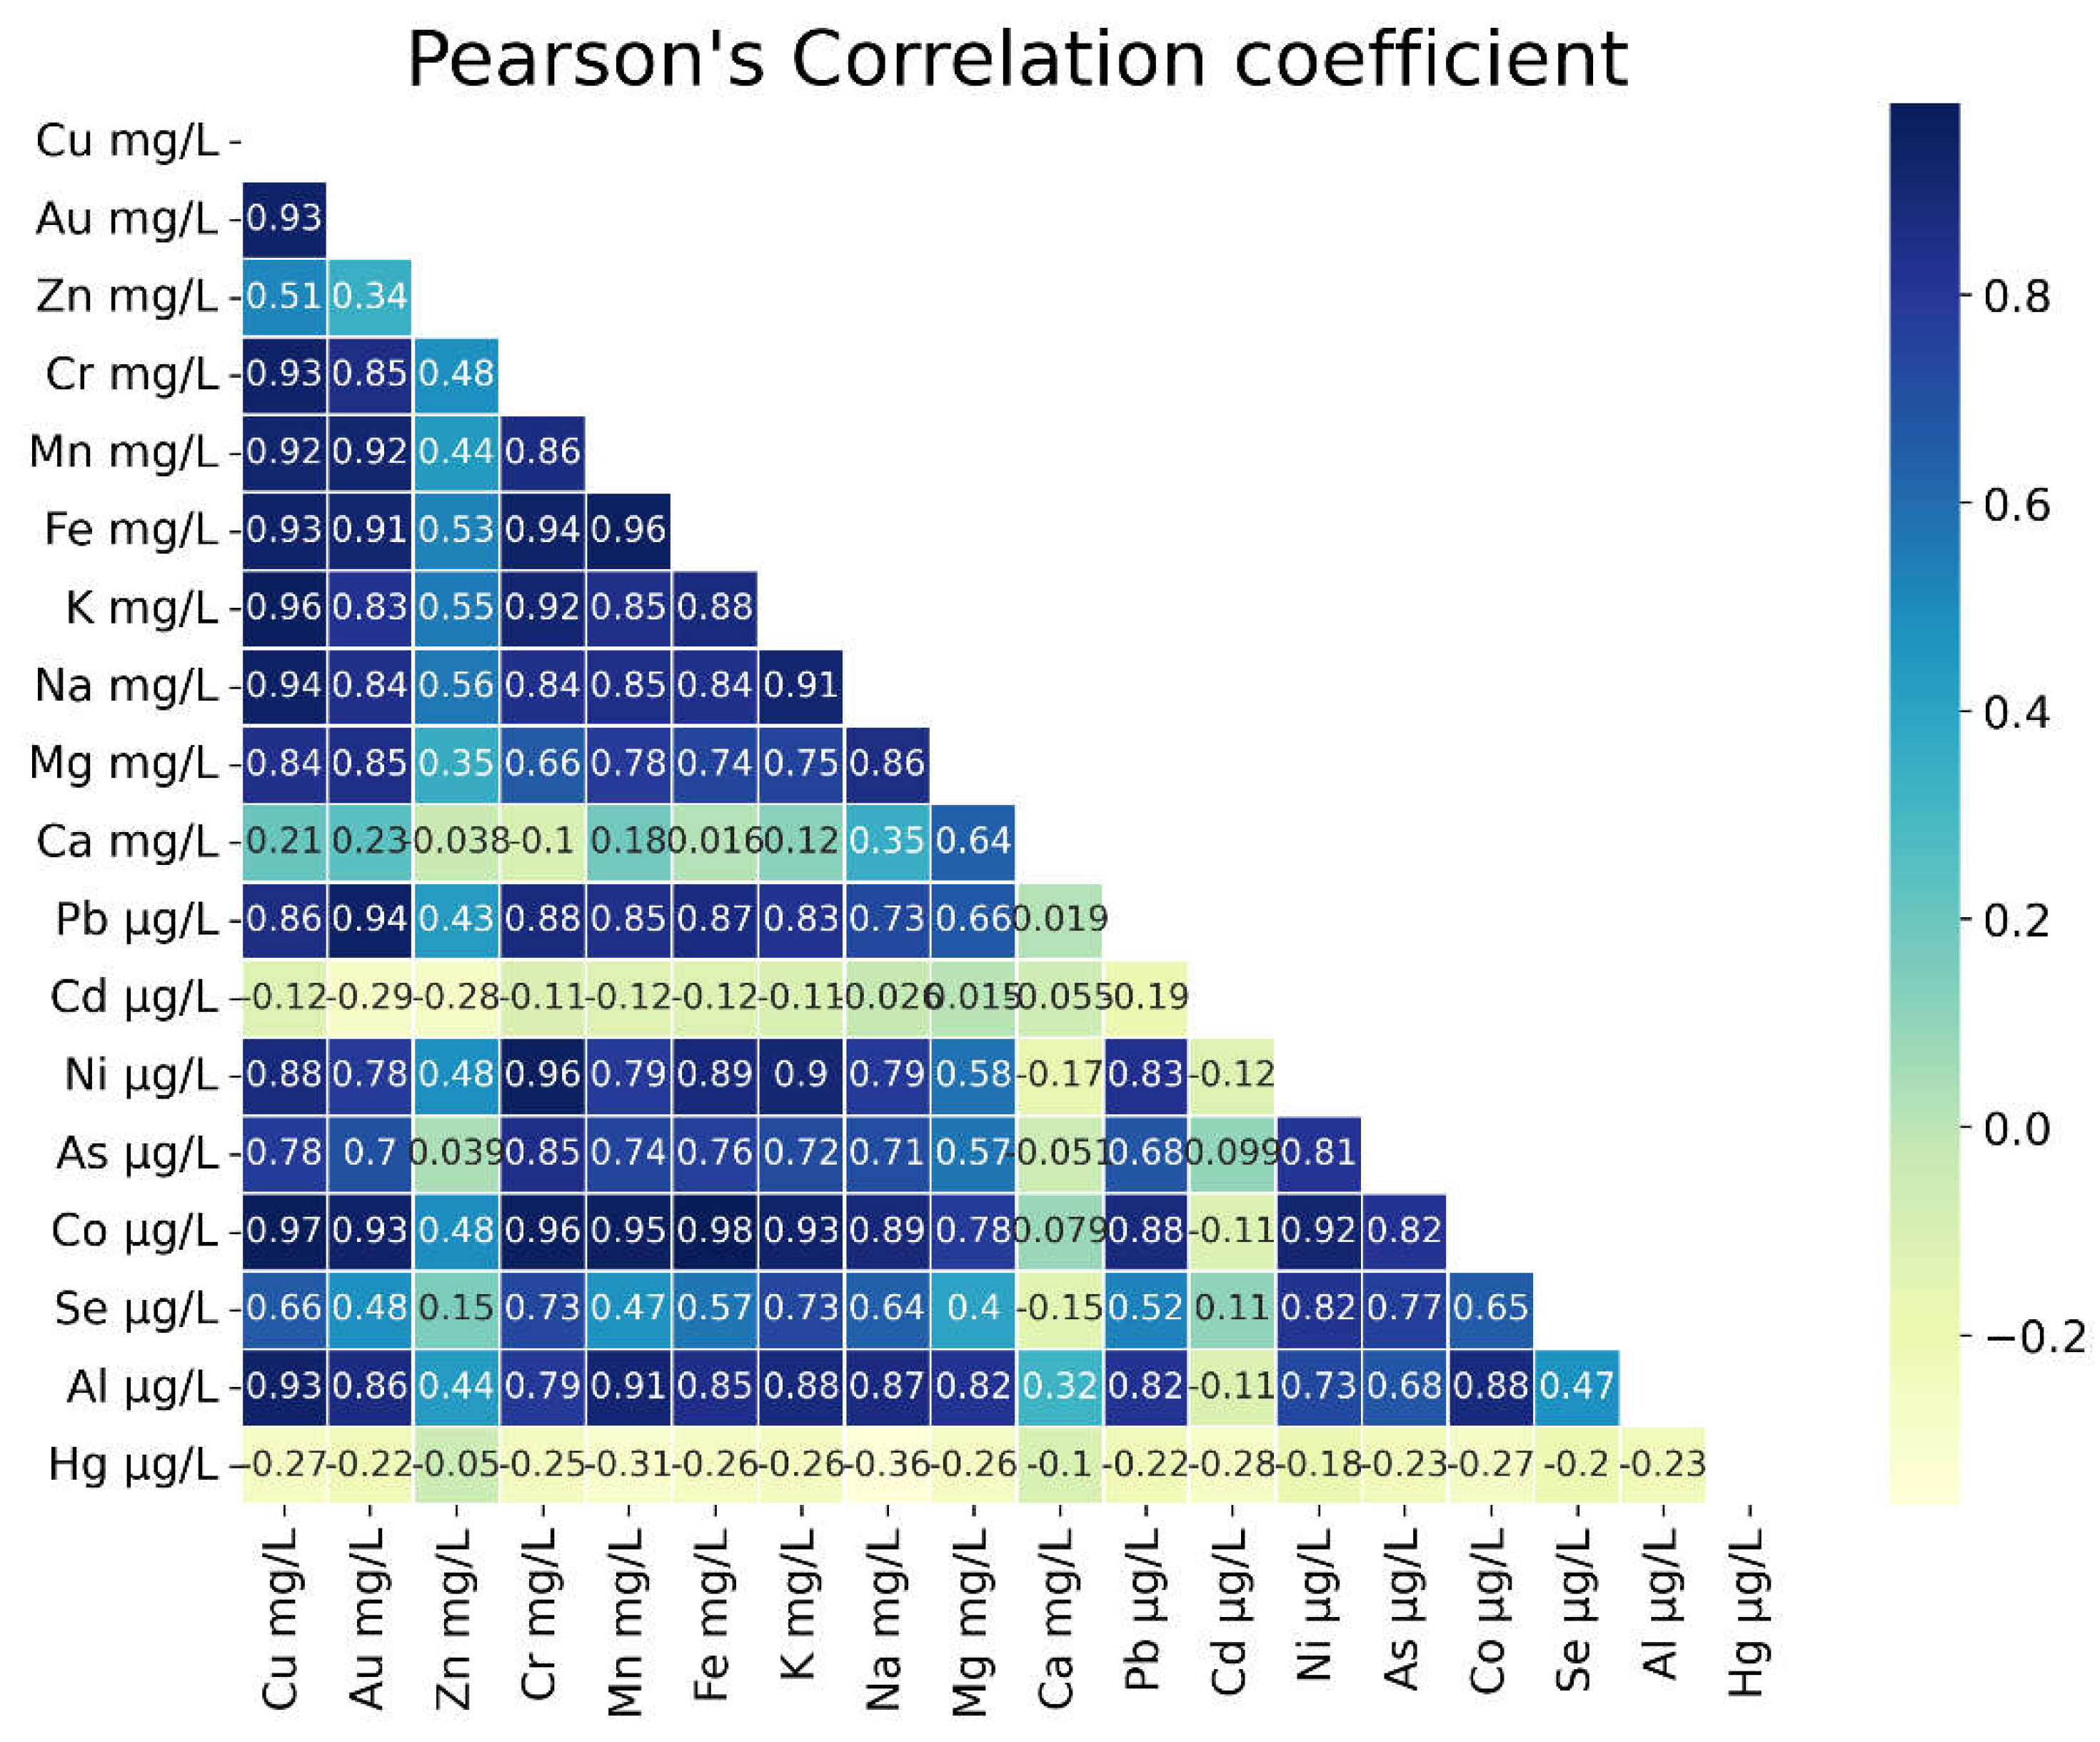
A correlation analysis was conducted by calculating the Pearson correlation coefficient (
Figure 8) for each metal contaminant in the suspended matter. For this purpose, a simple Python 3 script was written based on the popular Pandas, Matplotlib, and Seaborn libraries. This analysis aimed to identify the patterns of behaviour between contaminants.
Pearson’s correlation coefficient measures how strong the linear relationship between two random variables is; in other words, it is the ratio between the covariance and the products of the standard deviations (Equation (3)).
The coefficient value varies between −1 and +1, where a value of +1 indicates a perfect degree of association between two observed variables, 0 shows no correlation, and −1 means a negative relationship. A positive correlation indicates that with an increase in pollutant A, the concentration of pollutant B also increases. Meanwhile, a negative correlation indicates that when pollutant A’s concentration increases, the concentration of pollutant B decreases.
According to the Pearson correlation coefficients (
Figure 6a), most of the metal contaminants found in the suspended matter correlated rather well, except mercury (Hg), cadmium (Cd), calcium (Ca), and zinc (Zn). Mercury (Hg) was the only element showing only a negative correlation with other metals, and cadmium (Cd) also followed such a trend. However, some of the correlations with cadmium (Cd) were positive—for example, with arsenic (As) and selenium (Se). Calcium (Ca) had an even degree of positive and negative correlations, while zinc (Zn) had mostly lower positive values of correlation, only showing a negative correlation with cadmium (Cd), mercury (Hg), and calcium (Ca). Most of the other elements showed relatively high values of correlation, with only selenium (Se) standing out, where some above average correlation values were observed and lower negative correlations with calcium (Ca) and mercury (Hg).
4.2. Source of Pollution
The fine-grained fraction (silt and clay) is transported by rivers in suspension, where saturation depends mainly on the rock and soil erosion compliance and water velocity. The saturation of suspended sediments varies with changes in current velocity. Upstream areas are typically regions characterised by high-velocity water flows and, consequently, high erosion. Thus, the composition of a river’s suspended sediment depends mostly on the lithology and its mineralogical composition. Downstream in lowland rivers with slower flow rates, the composition of suspended sediment is generally influenced less by the parent material and more by anthropogenic input.
The value of the geochemical background is necessary to assess the current state of pollution in sediment. The baseline value refers to the concentration of an HS in a drainage basin, and the concentrations of HSs in an unpolluted basin should be equal or close to the background values [
26].
Contaminants can reach surface waters via point and diffuse sources, airborne deposition, and potentially in the form of inadvertent spills. Many of these contaminants are on the priority substances list of the WFD (2000/60/EC [
2,
3]). In addition, there are emerging concerns about river basin-specific pollutants and other potentially relevant contaminants that must be addressed. All measured elements mainly belong to the same mineralisation sources as the alluvial flooding terraces of the Drava, Mura, and Danube Rivers. Other inputs can be a consequence of agricultural activity (mineral fertilisers and pesticides), the combustion of fossil fuels, waste deposits, wastewater from industrial facilities, urban settlements, etc.
According to the obtained results of the correlation analysis, most elements, including heavy metals and metalloids, had a strong positive correlation between themselves, implying common sources, mainly situated in upstream countries far away from the monitoring locations. The concentration ranges are very similar to ranges in the topsoil of flooding river terraces. The mercury concentration in all samples of SS was very low, but one of them, from HS Terezino Polje, showed only one very high value, which could result from some pollution. Such high results can partly be obtained as a result of correlation. Another reason may be the very complex behaviour of mercury in the water environment compared with other analysed elements that transport mercury throughout the water, such as in suspended sediments, inorganic or organic complexes, or incorporated within the tissue of biota, etc., which is very efficient in all forms and phases. The negative correlation of selenium with calcium and the low correlation with cadmium and zinc indicate its transport mainly as a part of the organic fraction. At this study phase, the obtained results are insufficient for a more detailed interpretation.
5. Conclusions
Where human activities interfere with sediment quantity or quality, sediment management at the river basin becomes necessary. Earlier documents have already defined [
1,
2] that all the elements of analysis must be set out in a plan for the river basin—a so-called River Basin Management Plan (RBMP). The goal is to produce a detailed account of how the objectives set for the river basin (ecological status, quantitative status, chemical status, and protected area objectives) are to be reached within the timescale required. The plan will include all the results of the above analysis: the river basin’s characteristics, a review of the impact of human activity on the status of water in the basin, an estimation of the effect of existing legislation and the remaining “gap” to meeting these objectives, and a set of measures designed to fill the gap [
15].
Therefore, the topic of sediment has been included in the work program of ECOSTAT for 2022–2024 [
27]. In 2022, a technical document titled “Integrated sediment management—Guidelines and good practices in the context of the Water Framework” was developed [
27]. This technical document has been developed through a collaborative framework (the Common Implementation Strategy (CIS)) involving the Member States, EFTA countries, and other stakeholders including the European Commission. The document was developed in the year before the finalisation of the draft RBMPs for the third cycle, and Member States are expected to consider the extent to which the recommendations in this document can be included in the context of this cycle and in subsequent steps.
This valuable document will help to include an integrated sediment management plan in the RBMPs. Applying “integrated sediment management planning” requires a preliminary analysis of the sediment dynamics in the river basin. It is generally recommended to start by setting objectives at the catchment scale and then derive them at more local scales. Identifying measures at the local scale without assessing both the cause of the problem and the effects of the measures at the larger scale risks being counterproductive, as the measures may not bring the expected benefits. It is also recommended, where relevant, to address both sediment quantity and contamination aspects, as these may be closely linked.
Therefore, the scoping phase of sediment quality should include the following components:
An assessment and classification of contaminated sediment.
An inventory of the relevant amounts and sediment contamination in the areas of investigation.
An assessment of remobilisation risk due to floods, wind, and anthropogenic impacts (dredging, redeposition, navigation, etc.).
The presented study provides the following few conclusions.
The analysed SS samples were taken from several hydrological stations on major Croatian rivers: the Mura River, Drava River, and Danube River. Due to their length and geopolitical significance, these rivers have a cross-border character and international basins. Therefore, SS quality monitoring is even more critical according to the WFD. In addition, for comparison purposes, one smaller tributary of the Drava River, namely the Bednja River, whose basin extends through a less populated area without industry, was included in the SS chemical status analysis.
At the analysed locations, large amounts of dangerous heavy metals such as lead, nickel, and cobalt and the metalloid arsenic were of particular concern.
Table 4 and
Figure 7 show that a considerable amount of lead (Pb) was transported in suspended sediment in the Mura River (HS Goričan), Drava River (HS Terezino Polje), and Danube River. The highest value of 2801.32 kg/day was measured at HS Drava-Terezino Polje during peak discharge Q = 1306 m
3/s, followed by 1513.44 kg/day at HS Dunav-Batina, on the recession site of the highest peak flow hydrograph (
Figure 2e).
At HS Batina, large quantities of aluminium (182–318 t), calcium (2507–4021 t), and other elements such as iron (Fe), manganese (Mn), and magnesium (Mg) were found to be carried through the Danube River.
- 2.
Comparison of the concentrations and correlation of major contaminants in the sediment
According to the results of the correlation analysis, most elements, including heavy metals and metalloids, had a strong positive correlation between themselves, implying common sources, mainly situated in upstream countries far away from the monitoring locations. The concentration ranges were very similar to ranges in the topsoil of flooding river terraces. The mercury concentration in all SS samples was very low, but one of them, from HS Terezino Polje, showed one very high value, which could have resulted from some pollution. Such high results can partly be influenced as a result of correlation. Another reason may be the very complex behaviour of mercury in the water environment compared with other analysed elements that transport mercury throughout the water, such as in suspended sediments, inorganic or organic complexes, or incorporated within the tissue of biota, etc., which is very efficient in all forms and phases. The negative correlation of selenium with calcium and the low correlation with cadmium and zinc indicate its transport mainly as part of the organic fraction. At this study phase, the obtained results are insufficient to provide a more detailed interpretation.
- 3.
A discussion about possible sources of the discovered contamination in the river sediments
Human activities in the river basin affect natural processes and may create imbalances due to a deficit or surplus of sediments, which can compromise the integrity of aquatic systems and the multiplicity of ecosystem services provided by them. In addition, discharge of pollutants in the environment can lead to sediment contamination, which may represent a threat for decades. Furthermore, flood events as well as human interventions can remobilise deposited sediment and by that result in downstream and cross-border transport of sediment-associated contamination.
This study mainly observed large amounts of mercury and lead in Croatian cross-border big rivers. Mercury is highly toxic for humans, plants, and animals. Mercury poisoning in people can provoke mutagenic, carcinogenic, and teratogenic effects; damage to the immune system, blood vessels, and central nervous system; deformation of DNK; reduced reproduction, and interference with child growth and development. The uses of mercury are varied: in measuring techniques, in dental and medical equipment, in the production of insecticides and fungicides, in gold mines, and in the production of caustic soda and chlorine. It comes into the environment (water in particular) from chemical industry waste, precipitation onto water and soil, and through waste mud, industrial and household wastes, and pesticides based on mercury [
19]. Lead is a heavy metal and one of the most infamous environmental pollutants. It is used widely in producing batteries and electrodes, paints, glass, ceramic alloys, and tires as a shield against radiation. However, unfortunately, lead is very toxic and causes neurological damage, kidney and liver diseases, increased blood pressure, anaemia, cancer, and reproduction problems [
19].
The HSs in sediments may represent a risk to the environment, and consequently, they should be monitored. Monitoring HSs includes sampling, chemical analyses, and producing risk assessments of the sediments. Whatever the water body, sediments should be sampled at sites representative of the water body or cluster of water bodies. This requires understanding the hydrological and geomorphological characteristics and pollution sources. For example, high direct pollutant inputs into waters and diffuse pollutants washed from the watershed negatively impact the sediment quality in the Danube RB. Older polluted sediments in lower sediment layers are partly remobilised by floods, navigation, or dredging and thus enter the flowing water and impact downstream river sections.
- 4.
Emphasis on the importance of regular monitoring and management of the river sediments
Successful sediment management requires an appropriate governance framework and the support of relevant stakeholders. Therefore, a joint effort from ministries, public authorities, protected area administrations, universities, local communes, and NGOs is needed to save valuable sites and achieve harmonised, sustainable regional development [
27].
Covering a substantial section of the European Green Belt, the Mura, Drava, and Danube (MDD) Rivers form a dynamic and interconnected lifeline in Central Europe. In 2021, the MDD area became the world’s first five-country UNESCO Biosphere Reserve as a model region for connecting nature conservation and sustainable development. In response, the joint vision for the “Mura-Drava-Danube” area is to use the Transboundary Biosphere Reserve (TBR) concept to maintain a living river ecosystem for biodiversity and ecosystem services and to promote nature-friendly economic development for the local communities of this rural region [
20].
Based on several individual samples, it is impossible to conclusively determine the origin of the high concentration of mercury and other heavy metals at the analysed locations. Since heavy metals are highly toxic, a continuous monitoring program with a specific spatial and temporal resolution is required to monitor this phenomenon adequately. According to the Environmental Quality Standards Directive recommendations (2008/105/EC), this research could be the starting point for defining a preliminary sampling program, which can be useful in providing relevant information for designing the final sampling program. The conclusion is that additional investigations regarding the quantification of sediment balance and sediment quality are needed to identify the critical hotspots of contamination, achieve better sediment management for the Danube on a basin-wide scale, and propose appropriate measures for improving the situation [
27].


