Abstract
Water demand per capita will rise in the Arab world as a result of climate change and population expansion. One of the most important aims in coping with population increase around the world is to conserve water supplies. As a result, the Kingdom of Saudi Arabia (KSA) constructed the Al Wajeed Water Treatment System to meet the demands of its southern population. This research aims to assess the drinking water quality produced from the Al Wajeed Water Treatment System. Monthly water samples were collected (January 2018 to January 2021) from the Al Wajeed Water Treatment Framework (4 sites), extending to governorates, Bishah`s distribution system (5 sites), and Tathleeth`s distribution system (7 sites). Water quality criteria, such as physical-, chemical-, and microbiological-parameters, revealed that the majority of water samples collected from the Al Wajeed Water Framework and its environs are of a good quality and matched the national and International standards. Few sites showed water quality criteria such as turbidity, fluoride, and total coliform, which did not comply with national and global standards. The obtained results explained the importance of monitoring and follow-up programs for drinking water criteria. In addition, they can help the authorities and stakeholders in the sustainable development.
1. Introduction
Water is the main source of life for all creatures. The basics of human rights are safe drinking water and sanitation, because they are essential to maintain dignity and well livelihoods of all individuals. In 2015, 2.1 billion people worldwide could not have safe, readily obtainable water at home, while 4.5 billion failed to get safely managed sanitation. There is a huge gap between and within countries, as well as between the richest and poorest [1].
Human rights confirm the right of everyone to have sufficient, safe, palatable water [2,3,4,5]. The development of any nation relies mainly on the availability of safe and pure water. Contaminated water can affect economic and social life by causing water-borne diseases such as typhoid fever, dysentery, hepatitis A, vibrio illness, poliomyelitis, and E. coli diseases; this leads to increasing the cost of medical treatment [6,7]. It is critical to manage drinking water sources in order to identify potential hazards and reduce or eliminate the risk of contamination.
Groundwater is widely recognized as the world’s primary source of drinking water, with 2.5 billion people relying solely on it to meet their water needs [5,8,9]. As a result, managing and monitoring groundwater, as well as its quantity and quality, is critical. Furthermore, treating contaminated groundwater is difficult and expensive. Based on its physical, chemical, and biological properties, a contaminant released into the environment may migrate through an aquifer and into groundwater. Microbial contaminants include pathogens such as viruses, bacteria, parasites, microscopic protozoa, and worms [10,11].
For roughly half of the world’s population, groundwater is the primary source of potable water supply. The quality of groundwater used for domestic and irrigation purposes can vary greatly. Land-use and land-cover changes such as deforestation, agricultural expansion, urbanization, and other human activities have a direct impact on the condition of water resources [12,13]. Furthermore, other quality parameters, particularly nitrate and phosphate, must be measured because agricultural development and subsequent use of chemical fertilizers increase the emission of these pollutants. As a result, future research on various groundwater resource quality metrics should consider not only historical patterns but also potential changes [14,15].
The Middle East is currently experiencing a water crisis, and the United Nations (UN) has designated Kingdom of Saudi Arabia (KSA) and the other Gulf Cooperation Council (GCC) countries as water-scarce nations [16]. While 97% of Saudis have access to safe drinking water, the country is one of the world’s most water-scarce. The absolute water scarcity level is 500 cubic meters per capita per year. The KSA has only 89.5 cubic meters per capita per year. Despite the high levels of water access in the Kingdom, severe over consumption and lack of reliable sources of renewable water have made this issue a top priority. KSA constitutes the majority of the Arabian Peninsula and is one of the largest arid countries without permanent rivers or lakes [16]. Water supply and sanitation in KSA is characterized by challenges and achievements. One of the main challenges is water scarcity. In order to overcome water scarcity, substantial investments have been undertaken in seawater desalination, water distribution, sewerage and wastewater treatment. Today, about 50% of drinking water comes from desalination, 40% from the mining of non-renewable groundwater, and only 10% from surface water in the mountainous southwest of the country [17].
The study sought to evaluate the quality of groundwater in southern KSA and compare water quality with the standards of the Saudi Arabian Standards Organization (SASO) standards (Bottled and Unbottled Drinking Water; Standard No. 409; SASO: Riyadh, KSA, 2009) to ensure they are in accordance with GCC (2014) [18] and WHO (2011) [19] guidelines. The results of this study support the KSA strategy for water resources management and can serve as a starting point for other initiatives that are anticipated to be launched in the KSA and other countries globally.
2. Materials and Methods
2.1. Al Wajeed Drinking Water Treatment System
Al Wajeed is a geological system located in the southern region of KSA. It was discovered in 1966 in the Wadi Al Dawaser governorate. It consists of sandstones inlaid with layers of clay, as it is directly located on a composite stone base. It is heading west of Wadi Al Dawaser, which is directly located on a composite stone base. The treatment plant produces fresh water with salt concentration of 520 ppm. Since its discovery, many wells have been drilling with 100–1100 m. in depth producing about 25,000,000 m3 of fresh water. The water configuration that aims to transport water from Al-Rubaa Al-Khali to Bishah and Tathleeth governorates was launched on 7 January 2018 by OVELOIA WATER- Solutions & Technologies under the supervision of the Ministry of Environment, Water and Agriculture, its production capacity was 61,500 m3/day. Al Wajeed water framework configuration (Figure 1) consists of the following components:
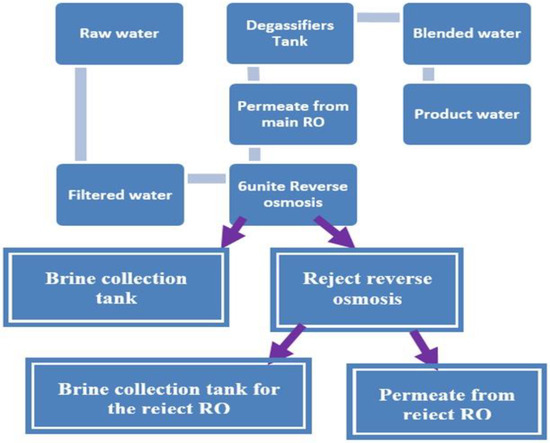
Figure 1.
Schematic illustration of Al Wajeed Water Treatment Framework.
2.1.1. The Wells Area
The field consists of 28 tube-wells, 1000 m. apart from each other in all directions, with 200 mm. in diameter and 250 m. in depth. The average discharge per well is 110 m3/h, pumped with submerged 92 kW, 200 m. pumps installed at a depth of 200 m. All the wells can be operated at the same time when needed.
2.1.2. Raw Water Tanks
Raw water is pumped to two concrete tanks with a total capacity of 100,000 m3. Chlorine gas is fed into the raw water with an initial dose of 5 ppm as a disinfectant and for oxidizing iron oxides into precipitated oxides that can be trapped inside sand filters.
2.1.3. Raw Water Pumping Station
The raw water pumping station consists of 4 pumps (3 in service + 1 reserve), with a discharge of 970 m3/h. each.
2.1.4. Primary Treatment with Chemicals (Addition of Coagulant Materials)
- Ferric chloride with a concentration of 5 ppm, is injected at the entrance of the raw water tanks, as coagulant materials to collect suspended particles.
- Sodium meta bisulfite is added as 0.1 mg/L to the water, to remove the residual chlorine before entering the membranes, as chlorine is the oxidizing agent for the membrane material.
- Then acid and an anti-scaling agent are added to prevent the scaling of salts inside the membranes.
2.1.5. Sand Filters
Raw water is pumped to sand filters to get rid of turbidity, impurities, and odors by pumping the water through the filter layers of gravel, graded sand and activated carbon. There are 10 sand filters, with a discharge of 291 m3/h. each.
2.1.6. Reverse Osmosis Unit
The unit consists of:
- Cartridge filters 5 µm to remove suspended particles.
- 6 reverse osmosis units which produce 400 m3/h of treated water for each unit (so, reject water reached to 70 m3/h from each unit). Therefore, the maximum possible amount of treated water produced by the plant is 2535 m3/day.
- Final treatment with chemicals: in this process, chemicals are added to the treated water to improve the quality of the water to ensure compliance with the Gulf water standards.
- Addition of sodium carbonate to elevate the pH value up to 7.5–8.5.
2.1.7. Chlorine Addition
Post chlorination with 2 ppm chlorine gas, to water disinfection inside the storage tanks and inside the distribution system. Calcium salt added to keep ionic balance of water, to ensure that water is safe to drink.
2.1.8. Treated Water Tanks
The treated water reaches to two concrete treated water tanks with the total capacity of 100,000 m3, where it is stored until pumped to the distribution system.
2.1.9. Pumping Station
Four pumps (3 in-service + 1 reserve) are to draw the treated water from the tanks and pump it into the distribution system. The power of each pump is 720 kW with a discharge of 710 m3/h and a total head of 245 m.
2.1.10. Booster Pumping Stations
Three booster pumping stations, PSA, PSB, and PSC, are located at three different locations to transmit the treated water through the pipe lines of the distribution system. Each of the booster pumping stations consists of a covered 10,000 m3 concrete tank and six 720 kW pumps (5 in-service in PSA and PSB, and 2-in-service in PSC + 1 reserve), discharging 710 m3/h. each, at a head of 245 m. Each station is equipped with three electric generators of 2.5 MVA each.
2.1.11. Reservoir of Ashayab Tathleeth Station
The treated water is received at the reservoir and station of Ashayab Tathleeth through a 65.23 km. long line that is branched to feed the ground reservoir. A control valve is equipped on the branched line to feed the reservoir with a maximum of 500 m3/h. of water for transmission line safety.
2.1.12. Bishah Reservoir
The treated water arrives from the pumping booster station PSC to Bishah 50,000 m3 reservoir, which is a covered concrete tank divided in two halves, where the reservoir stores the water and distributes it through two 150 mm. branched pipelines to feed some of the facilities located in Bishah and Ashayab. Treated water is fed by gravity through K9-type ductile lines of diameters varying from 300 to 700 mm, with different lengths depending on the location of transmission.
2.2. Sampling
Water samples were collected on a monthly basis (January 2018 to January 2021) from the distribution network of the Al Wajeed Water Treatment Framework (sample sites of 6002PS, 600Stage line, 8002PS and 2nd Stage Line) and extending to Bishah (sample sites of King Fahd Station, Wadi Hergab, Bishah-Net Tank, South Bihah Tank and Bishah Running 400 km) and Tathleeth (sample sites of Elsharf Tank, Elmaared Tank, Ashyab King Fahd Dam, Bis-02, Bis-01, 800Stage Line and 800End-Line) governorates. Samples were collected in 1L sterile plastic bottles and transferred to the Lab for analysis according to APHA. Standard Methods for the Examination of Water and Wastewater [20].
2.3. Analytical Measurements
Water temperature was measured on the site using mercury thermometer, and pH was measured using digital pH meter (Model Metrohm, pH Lab 827, Zofingen, Switzerland). All measurements of water quality criteria (turbidity, total dissolved solids, total alkalinity, total hardness, calcium, magnesium hardness, chloride, sulphate, fluoride, ammonia, nitrite, nitrate, iron and manganese) were conducted according to [20].
Also, water samples were digested according to the method described in [20]. Trace elements (Al, Cr, As, Se, Zn, Cd, Ba, Pb, Be, B, Co, Mo, Cu, V, Li and Ni) were measured by Atomic absorption spectrophotometric method. To prevent contamination, all tools associated with trace metal sampling and analyses were thoroughly acid cleaned before use. Glassware and Teflon vessels were treated in a solution 10% v/v nitric acid for 24 hrs. and then washed with distilled and deionized water [20].
To emphasize the microbiological quality of water, samples, including total Coliforms and E. coli, were measured by most probable number (MPN) method (APHA 2017).
All the chemicals as well as the standard solutions needed to measure heavy metals were purchased from Sigma Aldrich Merck group, USA.
2.4. Radioactive Materials Measurements
Water samples from the main 28 wells were collected for radioactive atoms measurements. All measurements were performed in the Laboratory of the Ministry of Environment, Water and Agriculture, KSA. The activity concentrations of 226Ra, 228Ra, Ur234 and Ur238 in the water wells’ samples were measured using Liquid scintillation counting. The water samples were collected in 1-L polyethylene container. Acidification to pH 2, by adding HCl or HNO3, was performed to prevent microorganism growth [20,21].
2.5. Statistical Data Analysis
To determine the significant variation in the overall water quality assessment traits explained by date and sampling sites, we applied a Two-way ANOVA analysis of variance using IBM SPSS Statistics version 21.0 [22]. All statistical visualizations were performed by GraphPad Prism 8.3.0 (GraphPad, San Diego, CA, USA). Meanwhile, the statistical analyses were conducted using correlation analysis GGally package in R 4.1.1 [23] and ggplot2 package for the boxplot figures. The obtained correlation charts display the distribution of each variable; the bivariate scatter plots (bottom of the diagonal); and the correlation values and significance level stars (top of diagonal) [24].
3. Results and Discussion
3.1. Geology and Hydrology of Al Wajeed (Saudi Arabia) Wells Area
Al Wajeed (Wadi Al Dawaser governorate) is a geological system in Saudi Arabia’s southern region. Saudi Arabia is underlain by tightly folded, regionally metamorphosed volcaniclastic and epiclastic rocks, as well as many late Proterozoic mafic-to-felsic plutons. It is known as a ′Arabian Shield-Nubian Shield′ and it is only partially exposed in the area because the sedimentary rock dips gently to the east. Palaeozoic sandstones, including the Cambrian-Ordovician Al Wajeed sandstone, are found as sedimentary cover overlying Proterozoic rocks on the southeastern range [25]. Volcanic activity during the Precambrian period resulted in the formation of volcaniclastics and subordinate flow rocks that are complex and inter-layered with volcanically delivered and epiclastic sedimentary rocks. The area contains Tertiary and Quaternary rocks formed by basalt flows and gabbro dikes and are associated with the Red Sea rifting. The basalt is part of a large area of volcanic flow rocks and volcanic cones, whereas the gabbro dikes intruded into tension fractures [26,27]. Natural groundwater systems are made up of aquifers from both the oldest and youngest geologic ages. Precambrian crystalline rocks are the oldest and recent alluvium deposits and eolian sands are the youngest. The productive aquifer is found beneath the Precambrian basement in sedimentary strata and porous volcanic rocks [28]. Primary and secondary aquifers are distinguished by their hydrologic properties and areal extent. Primary aquifers have higher permeability and yields than secondary aquifers, and primary aquifers have more water storage [29,30]. The layer is made up primarily of sandstone, limestone, and dolomites, which have a large area and a higher storage capacity. Sandstone is interspersed with less permeable strata that act as confining beds in the sedimentary section [31]. The primary sandstone aquifers are widespread in the southeastern region and have excellent water-bearing properties locally. Water-bearing Mesozoic sandstone and limestone beds, such as Wajid and the Minjur/Dhruma aquifer in the southeastern Aseer and Najran province, are aquifers with high potential yield. Secondary aquifers store less water and produce less [29]. These aquifers are found throughout the region and serve as minor water sources. Some aquifers are hydraulically connected to the underlying primary aquifers and have high yield potential. The majority of groundwater is stored in primary deep aquifers and provides a reliable supply in Saudi Arabia’s central and northern provinces. This deep-seated groundwater reserve is estimated to be 1919 BCM. The amount of water stored in these deep aquifers in Saudi Arabia’s Saq, Tabuk, and Wajid is enormous.
3.2. Wells Data of Al Wajeed Water Treatment Plant in Wadi Al Dawaser Governorate
Figure 2 shows the map of wells that feed the Al Wajeed Water Treatment Plant in the Wadi Al Dawaser governorate-Al-Rubaa Al-Khali, KSA. Data of Al Wajeed wells revealed that the well types are lined with concrete or tubular, while the wells diameter ranges from 12–16 inch to 5 m. In addition, wells depth and static water level are ranged from 18 to 29.5 m and from 2 to 8.7 m, respectively. Well production ranges from 60 to 500 m3/h. The pumps of Al Wajeed Water Treatment Plant are of type turbin and submersible with capacity ranges from 30 to 100 horse, depth ranges from 15.5 to 27 m and tube diameter (6–10 inch).
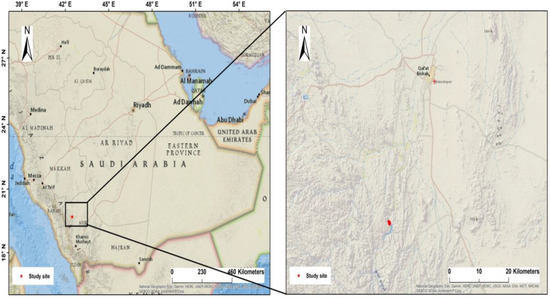
Figure 2.
Map of wells feed Al Wajeed Water Treatment Plant (Wadi Al Dawaser governorate- Al-Rubaa Al-Khali).
The World Health Organization recommended the measurement of heavy metals as well as radioactive materials in addition to the physical and chemical properties to regard as the suitability of well water for human uses [19]. Where the site-specific tendency could be a reflection of groundwater susceptibility that is depending on the interaction of ecological and anthropogenic factors at different locations. This notion is supported by studies that show varied levels of groundwater contamination sensitivity based on a variety of parameters such as precipitation infiltration, protective cover depletion, and complicated land use activities [32,33,34]. In addition to that and because aquifer water quality changes are imperceptible, aquifer monitoring and assessment are critical [32]. In addition, organ toxicity is commonly a result of metal exposures, relying on the dosage and time of contact [34,35]. Whereas, as previously stated, the consuming rate may be a determinant factor in the degree of dangers in consumer populations [36,37].
Figure 3 shows the Boxplot of heavy metals concentrations (maximum, minimum and mean value) in water samples collected from Al Wajeed water wells. Since some heavy metals do not have direct health effects but have unpleasant taste or color, the study results demonstrate that the heavy metals’ measurements in water samples meet the recommended acceptable limits established by [18,19]. Kumar et al. [38] stated that the trace metals (As, Cr, Cd, Mn, Cu, Fe, and Zn) are naturally present in the environment in trace amounts. Small amounts of these metals may be necessary for nutrition, but high concentrations of these metals can be toxic due to industrial waste effluents, weathering of rocks, and atmospheric deposition, among other things.
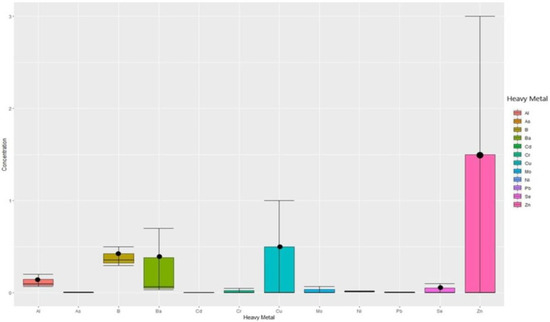
Figure 3.
Boxplot of heavy metals concentration of samples collected from Al Wajeed water wells. Means (●) are average of collected random samples for each parameter. Min. = Minimum (⊥); Max. = Maximum (⏉).
Furthermore, by studying radioactivity of the water wells which feed Al Wajeed water system, results showed that samples did not exhibit uranium and radium content above limits suggested by WHO [19] for radium and uranium concentration in waters (Table 1).

Table 1.
Radioactive atoms′ levels in the 28 wells water of Al Wajeed System.
234 U and 238 U detected in the drinking water samples in Greece ranges from 0.91 to 17.27 mBql−1 and from 2.13 to 22.01 mBql−1, respectively [39]. There was a correspondence between the 234 U activity concentration values and those of 238 U. This observation is related to leaching of uranium isotopes with a high rate to the underground water flowing through the faults and fissures between the grains of reservoir rocks. Consumption of ground waters for human activities would result in increased radiation doses and their utilization for irrigation purposes would not imply an extreme radiation exposure to population, in cases of high uranium concentration [40,41,42].
3.3. Physicochemical Criteria
According to the human rights framework, water required for various human uses must be safe and free of microorganisms, radiological hazards and chemicals that cause a threat to a person’s health [2]. In addition, excessive withdrawal of well water and changes in land use can affect groundwater quality and quantity with particularly rapid changes taking place worldwide from forestry to agricultural land use, as well as industrialization, urbanization, and landfill [43].
Water quality monitoring and evaluation are critical for ensuring the efficient operation of Water Treatment Plants (WTPs) and promoting health and contributing to a more sustainable urban water cycle [44]. Twenty quality parameters are applied to samples collected from the pumping station before being pumped to the distribution network, as well as from the Tathleeth and Bishah networks.
The quality standards for drinking water have been specified by the WHO and GCC national norms [18,19]. The behavior of major ions (Ca, Mg, Na, K, HCO3, SO4, Cl) and important physico-chemical parameters such as pH, electrical conductivity (EC), total dissolved solids (TDS), and total hardness (TH) and the suitability of groundwater in the study area are discussed. In-detail results revealed that aesthetic parameters (pH, color, turbidity, and TDS) of all samples are almost in the permissible level of [18,19] (Table 2, Table 3 and Table 4).
Table 2.
Water quality assessment traits for the main distribution pumping station branches.
Table 3.
Water quality assessment traits for Bishah distribution network extension.
Table 4.
Water quality assessment traits for Tathleeth distribution network extension.
The results of water quality assessment traits obtained from the Two-Ways ANOVA with interaction statistical analysis between sampling sites (the main distribution pumping station branches, Bishah, and Tathleeth) and sampling collection dates (2018–2019, 2019–2020, and 2020–2021), considering the level of significance at p < 0.05 indicated that no significant effects were detected for neither sampling collection dates as a main effect nor for the interaction between sampling sites and dates. In contrary to that, Ober et al. [45] stated that in winter, tap water supplied in Ukraine scores best for taste, odor, color, and turbidity compared to other periods. In autumn, tap water supplied in Poland scores best for color and turbidity, while in spring, the same water scores best for taste and odor and for hardness in both countries. Summer stands out negatively for all tap water parameters from both Poland and Ukraine (especially for pressure and continuity of supply, which are highest in autumn). In addition, Ji et al. [46] reported that the water quality in the dry of Hancheng City in 2018 season is better than that in the wet season.
This may be due to the variation in temperature where the Saudi Arabian climate is generally desert, and it is very hot in summer in all of the country. In addition, Zhang et al. [47] found that the combined effects of seasonal changes and stagnation on tap water quality are not well understood.
On the other hand, significant effects were detected for the sampling sites (locations) as a main effect for some studies traits (Table 5); however, the most obtained values are still within the permissible ranges [18,19], except for both turbidity (p = 0.022) and fluoride (p = 0.058) concentrations.
Table 5.
Water quality assessment traits for the main effect (sampling sites; [I] the main distribution pumping station branches, [II] Bishah, and [III] Tathleeth) from the results of Two-Ways ANOVA with interaction statistical analysis between sampling sites and sampling collection dates.
These results indicated the presence of a pollution source as confirms by turbidity level in Wadi Hergab and fluoride level for King Fahd station Bishah (Table 3), which might lead to change in at least one of the physic-chemical criteria from one site to another or the effect of the extension of the distribution network, and/or may be the lack of washing programs for the network. That might confirm, at least in part, the importance of monitoring program that implemented to protect the drinking water network.
In addition, correlation matrix between those aesthetic parameters and water criteria of ammonia, nitrite and nitrate revealed good correlation in different sampling sites (Figure 4).
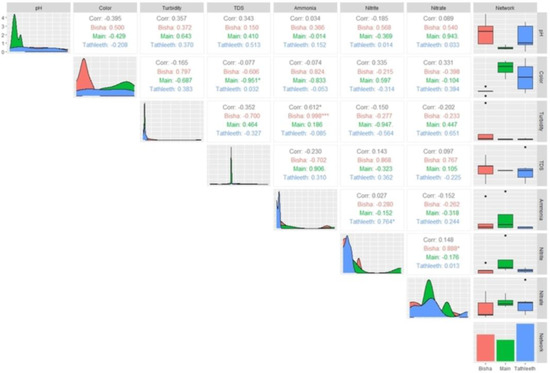
Figure 4.
Correlation matrix between the target monitored parameters (pH, color, turbidity, TDS, ammonia, nitrite and nitrate) and different sampling sites (main pumping station, Bishah network and Tathleeth network). * p ≤ 0.05; *** p ≤ 0.001.
Furthermore, in this framework, pH measurements showed that the water tends to be as natural and slightly alkaline where it was in the range of 6.6–8.5 in all water samples (Table 2, Table 3 and Table 4).
A research study suggests that there is no direct effect of the pH of drinking water on human health, but it has some indirect impacts on public health by causing changes in other water quality metrics such as metal solubility and pathogen viability. Whereas, turbidity revealed some fluctuation in its reading values within different site branches. But these values are still in the permissible level of global standards (within the range 0.4–2.7 NTU) except for water samples of Bishah (4.0 for site II; Table 5), specifically in Wadi Hergab, that the value is out of the standard level since it revealed a reading of 15.3 NTU (Table 3). These findings might indicate, at least in part, that there was a source of pollution affect the turbidity criteria in this site. Figure 4 revealed high significant correlation (p ≤ 0.996) between ammonia and turbidity in Bisha sites. The level of turbidity in drinking water is significant for aesthetic reasons as well as treatment plant performance, as excessive turbidity can shield harmful germs from disinfectant actions, making water filtration more difficult and expensive [48,49,50].
Moreover, color readings display a pronounced fluctuation between different sites of different network extension (3.0–10.5 Co-Pt unit) but still complied with the standards (Table 2, Table 3 and Table 4). In addition, these readings showed no significant correlation with other parameters (Figure 4).
According to a previous study, the presence of bicarbonate indicates the kind of rock in the area, implying that rock weathering and leaching are the key mechanisms affecting groundwater chemistry [51,52]. Moreover, Zafar et al. [51] found that carbonate and silicate weathering in the presence of soil carbon dioxide (gas) could explain the elevated levels of bicarbonate ions found throughout the study area. The Box and Whisker plot revealed that ion levels were highest during the pre-monsoon season, with no significant seasonal variations observed.
Alkalinity, in the form of CaCO3, is not considered pollution. It is a total measure of the substances in water that have acid neutralizing ability. The bicarbonate alkalinities of Al Wajeed water samples revealed a pronounced fluctuation between different sites, and it was in the range of 50–178 mg/L CaCO3. Moreover, it revealed a good correlation with indicator of pollution (NH3, NO2 and NO3) [53].
Salt content of water samples (Total dissolved solids, total hardness, chloride, and sulphate) are within the standards level to human and household uses. The obtained results demonstrated the range of TDS, total hardness, chloride, and sulphate were 140–951 mg/L, 76–417, 15–203 and 22–197 mg/L, respectively, which indicated that the water samples classified as hard water (Table 2, Table 3 and Table 4).
Soft (0–75 mg/L CaCO3), moderately hard (75–150 mg/L CaCO3), hard (150–300 mg/L CaCO3), and very hard water (>300 mg/L CaCO3) were determined by Khan et al. (2013). Although water hardness has unknown negative consequences on the environment, it does cause issues for daily human use [52,54].
Chloride and sulphate presented a statistically significant correlation (Figure 5) with calcium, magnesium, ammonia, nitrite, and nitrate traits (p ≤ 0.979, 0.970 and 0.988, respectively). Chloride determinations can be used to detect the intrusion of different water composition or to trace and measure the rates and volumes of water mass movements.
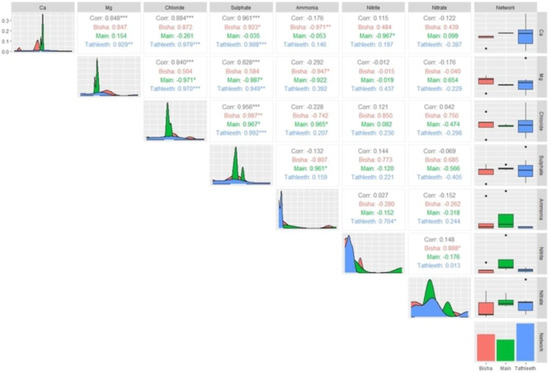
Figure 5.
Correlation matrix between the target monitored parameters (calcium, magnesium chloride, sulphate, ammonia, nitrite, and nitrate) and different sampling sites (main pumping station, Bishah network and Tathleeth network). * p ≤ 0.05; ** p ≤ 0.01; *** p ≤ 0.001.
Pollution indicator parameters (ammonia, nitrite, and nitrate) measurements, on the other hand, showed that all readings were within permissible levels (Table 2, Table 3 and Table 4). Additionally, ammonia showed good correlation with iron concentration (Figure 6) in different sampling sites.
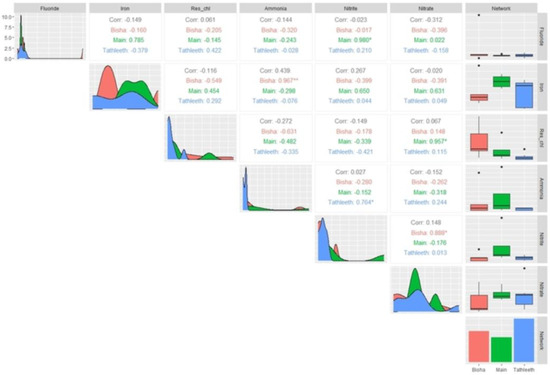
Figure 6.
Correlation matrix between the target monitored parameters (fluoride, iron, Res. chlorine, ammonia, nitrite, and nitrate) and different sampling sites (main pumping station, Bishah network and Tathleeth network). * p ≤ 0.05; ** p ≤ 0.01.
While pollution with nitrate linked to leakage from manufacturing and municipal effluents, the main sources are treated distillery and fertilizers used for crop irrigation [55]. Furthermore, the greater NH4+ value in several groundwater samples is primarily attributable to natural decomposition [53].
Fluoride and iron levels in water have a negative impact on human health and have an indicator of how water is used? The WHO [19] recommends that both elements have acceptable concentrations of 1.5 and 0.3 mg/L, respectively, that do not influence human activities. According to WHO and GCC [18,19], almost all samples collected from Al Wajeed drinking water framework and its network extension have fluoride and iron contents that were within permitted limits with the exception of samples taken from King Fahd Station Bishah, which have fluoride concentrations that above the allowed limit (Table 3).
A study on fluoride occurrence and distribution was carried out in a Loess area of China to determine the geochemical and anthropogenic factors that influence F–concentration in groundwater [54]. The optimal drinking water concentration of fluoride for dental health is generally between 0.5 and 1.5 mg/L and depend upon the volume of drinking water consumed as well as intake and exposure from other sources [49].
3.4. Microbiological Quality
It is normal for bacteria to be present in the environment. Total coliform and E. coli contamination-related diseases suggest that human and/or animal feces may be present in the water source [56]. From this point of view, results of the majority of Al Wajeed water samples tested negative for total coliform. However, only one site samples tested positive total coliform (site of 800 end line- Tathleeth Distribution system) which indicates the probability of leakage from a source of pollution. Furthermore, E. coli show negative result in all samples collected from AlWajid Drinking water samples and its branches, which indicated the effectiveness of chlorine dose used as a disinfectant. Coliform bacteria were found in drinking water sources, possibly as a result of septic tank leakage or discharge, as well as lack of disposal facilities for sewage and solid wastes which were the greatest dangers to water resources.
Total Coliform and Fecal Coliform are indicators for pathogenic organisms. According to USEPA [57], every water sample that has coliform must be analyzed for either fecal coliforms or E. coli. Many authors have reported waterborne disease outbreaks in water meeting the coliform regulations [58]. So total coliforms of water samples are beyond the permissible limit and were not suitable for drinking purpose without pretreatment. This contamination can occurr from the poor sanitation and leakage around the tube-wells where the contaminants can enter through the leakage and can mix up with water lifting pathway [59].
Chlorine and its derivatives, such as chloramine or chlorine oxide, are the most frequent strong oxidants employed in disinfection. Chlorine is effective against cyst-forming bacteria and protozoa e.g., Giardia lamblia [60]. The water samples in this study were disinfected with chlorine as a chemical disinfectant, and residual chlorine readings indicated the presence of residual chlorine in the distribution network (Table 2, Table 3 and Table 4), as recommended by WHO [19]. Correlation matrix of residual chlorine and water criteria showed negative correlation (Figure 6) in different sampling sites. All obtained results are in accordance with and supported by the strategy of KSA for water resources management to assure safe and sustainable water with quality for drinking to all citizens at southern region [61,62]. This study might help for developing different scenarios for the future KSA strategy by focusing on drinking water conservation principles and water for land use.
4. Conclusions
Improving water resource management and providing everyone with access to safe and affordable drinking water and sanitation is critical for eradicating poverty, building peaceful and prosperous societies, and ensuring long-term development. As a result, the KSA established the Al Wajeed Water Treatment Plant to meet the needs of the southern region’s population. The majority of the samples met national and International standards. Turbidity showed some fluctuation in its readings within different site branches but remained within the permissible level of global standards (it varies in the range 0.4–2.7 NTU) with the exception of Wadi Hergab water samples, which were above the standard level (~15.3 NTU). This result emphasizes the need to follow up the water quality to find the source of pollution. In addition, the majority of Al Wajeed water samples were found to be free of total coliform. However, only one site sample tested positive for total coliform (800End line-Tathleeth Distribution system), indicating that the chlorine dose was insufficient in some locations, which highlighted the importance of monitoring program that implemented to protect the drinking water network.
So, the research article suggests that Al Wajeed Water Treatment Framework and its branches should be regularly observed to make sure that their quality and hygienic practices are in line with local, national, and International requirements. Moreover, further studied are required to suggest different scenarios for future KSA strategy implications regarding other concepts such as water conservation and land use.
Author Contributions
Conceptualization, B.-K.Z., S.M.A., H.M.S. and G.H.A.; methodology, G.H.A. and A.M.E.; software, G.H.A. and S.H.E.; validation, G.H.A., A.M.S., T.A.A. and H.M.S.; formal analysis, G.H.A.; investigation, G.H.A., A.M.E. and S.H.E.; resources, S.M.A. and A.M.E.; data curation, G.H.A.; writing—original draft preparation, G.H.A.; writing—review and editing, G.H.A. and H.M.S.; visualization, S.M.A., H.M.S. and G.H.A.; supervision, B.-K.Z. and H.M.S.; project administration, S.M.A. and H.M.S.; funding acquisition, S.M.A. All authors have read and agreed to the published version of the manuscript.
Funding
This research was funded by Deputyship for Research and Innovation, Ministry of Education in KSA grant number UB-08-1442.
Informed Consent Statement
Not applicable.
Data Availability Statement
The datasets used and analyzed during the current study are available from the corresponding author upon reasonable request.
Acknowledgments
The authors extend their appreciation to the Deputyship for Research and Innovation, Ministry of Education in KSA for funding this research work through the project number (UB-08-1442).
Conflicts of Interest
The authors declare no conflict of interest.
References
- CARE. Leaving No One Behind. In The United Nations World Water Development Report; UNESCO—United Nations Educational, Scientific and Cultural Organization: Paris, France, 2019. [Google Scholar]
- UN. Substantive issues arising in the implementation of the International covenant on economic, social and cultural rights. General Comment No. 15, The right to water (arts. 11 and 12 of the International Covenant on Economic, Social and Cultural Rights). United Nations Digit. Libirary 2002, 11, 29. [Google Scholar]
- Hall, R.P.; Van Koppen, B.; Van, H.E. The human right to water: The importance of domestic and productive water rights. Sci. Eng. Ethics 2014, 20, 849–868. [Google Scholar] [CrossRef] [PubMed]
- Lande, L. Eliminating Discrimination and Inequalities in Access to Water and Sanitation; UN-Water, 2015; Available online: https://www.unwater.org/sites/default/files/app/uploads/2018/08/UN-Water_Policy_Brief_Anti-Discrimination_pdf (accessed on 25 September 2022).
- Grönwall, J.; Danert, K. Regarding groundwater and drinking water access through a human rights lens: Self-Supply as a norm. Water 2020, 12, 419. [Google Scholar] [CrossRef]
- Rossi, E.M.; Gerhard, M.I.; Zanella, M.S.; Bogo, M.; Scapin, D.; Oro, D. Assessment of microbiological quality of water wells in rural properties of the city of West of Santa Catarina, Brazil. Resour. Environ. 2012, 24, 164–168. [Google Scholar] [CrossRef]
- Mohsin, M.; Safdar, S.; Asghar, F.; Jamal, F. Assessment of drinking water quality and its impact on residents health in Bahawalpur city. Int. J. Humanit. Soc. Sci. 2013, 3, 114–128. [Google Scholar]
- Zektser, I.; Everett, L. Groundwaters of the World and Their Use; UNESCO Publishing: Paris, France, 2004. [Google Scholar]
- Amore, L. The United Nations World Water Development Report–N 4–Groundwater and Global Change: Trends, Opportunities and Challenges; UNESCO—United Nations Educational, Scientific and Cultural Organization: Paris, France, 2012; Volume 1. [Google Scholar]
- Sadeghi, A.; Galalizadeh, S.; Zehtabian, G.; Khosravi, H. Assessing the change of groundwater quality compared with land-use change and precipitation rate (Zrebar Lake’s Basin). Appl. Water Sci. 2021, 11, 170. [Google Scholar] [CrossRef]
- Sharma, S.; Bhattacharya, A. Drinking water contamination and treatment techniques. Appl. Water Sci. 2017, 7, 1043–1067. [Google Scholar] [CrossRef]
- Sarath Prasanth, S.V.; Magesh, N.S.; Jitheshlal, K.V.; Chandrasekar, N.; Gangadhar, K. Evaluation of groundwater quality and its suitability for drinking and agricultural use in the coastal stretch of Alappuzha District, Kerala, India. Appl. Water Sci. 2012, 2, 165–175. [Google Scholar] [CrossRef]
- Sadeghi, A.; Khaledi, J.; Nyman, P. Rainfall variability and land-use change in arid basins with traditional agricultural practices; insight from ground water monitoring in Northwestern Iran. J. Earth Sci. Clim. Chang. 2018, 9, 498:2. [Google Scholar] [CrossRef]
- Reyes, V.P.; Ventura, M.A.; Amarillo, P.B. Ecotoxicological assessment of water and sediment in areas of Taal Lake with heavy aquaculture practices using Allium cepa and Daphnia magna assay. Philipp. J. Sci. 2022, 151, 969–974. [Google Scholar] [CrossRef]
- Rajaei, F.; Dahmardeh, B.R.; Ahmadisharaf, E.; Galalizadeh, S.; Dudic, B.; Spalevic, V.; Novicevic, R. Application of Integrated Watershed Management Measures to Minimize the Land Use Change Impacts. Water 2021, 13, 2039. [Google Scholar] [CrossRef]
- DeNicola, E.; Aburizaiza, O.S.; Siddique, A.; Khwaja, H.; Carpenter, D.O. Climate change and water scarcity: The case of Saudi Arabia. Ann. Glob. Health 2015, 81, 342–353. [Google Scholar] [CrossRef] [PubMed]
- WHO/UNICEF. Joint Monitoring Program (JMP) Annual report 2007. Available online: https://www.unwater.org/publications/un-water-annual-report-2007 (accessed on 25 September 2022).
- No. 149/2000; GCC, Gulf Cooperation Council, Gulf Standardization Organization (GSO). Unbottled Drinking Water. GSO: Riyadh, Saudi Arabia, 2014.
- WHO. Guidelines for Drinking-Water Quality; World Health Organization: Geneva, Switzerland, 2011; Volume 216, pp. 303–304. [Google Scholar]
- APHA. Standard Methods for the Examination of Water and Wastewater, 23rd ed.; APHA, AWWA, WEF, Publication Office: Washington, DC, USA, 2017. [Google Scholar]
- Missimer, T.M.; Teaf, C.; Maliva, R.G.; Thomson, D.A.; Covert, D.; Hegy, M. Natural radiation in the rocks, soils, and groundwater of Southern Florida with a discussion on potential health impacts. Int. J. Environ. Res. Public Health 2019, 16, 1793. [Google Scholar] [CrossRef] [PubMed]
- SAS. Statistical Analysis System (SAS) User’s Guide: Statistics; SAS Institute Inc.: Cary, NC, USA, 2004. [Google Scholar]
- R Development Core Team. R: A Language and Environment for Statistical Computing; R Foundation for Statistical Computing: Vienna, Austria, 2014. [Google Scholar]
- Wickham, H. “Package ggplot2.” Create Elegant Data Visualisations Using the Grammar of Graphics; Version 2.1; Springer International Publishing: Berlin/Heidelberg, Germany, 2016; pp. 1–189. [Google Scholar]
- Mallick, J.; Singh, C.K.; AlMesfer, M.K.; Singh, V.P.; Alsubih, M. Groundwater Quality Studies in the Kingdom of Saudi Arabia: Prevalent Research and Management Dimensions. Water 2021, 13, 1266. [Google Scholar] [CrossRef]
- Rehman, F.; Cheema, T. Effects of sewage waste disposal on the groundwater quality and agricultural potential of a flood plain near Jeddah, Saudi Arabia. Arab. J. Geosci. 2016, 9, 307. [Google Scholar] [CrossRef]
- Saleem, H.M.; Subyani, A.M.; Elfeki, A. Environmental Impacts on Groundwater of Wadi Bani Malik Jeddah Saudi Arabia. Int. J. Sci. Eng. Res. 2017, 8, 1658–1662. Available online: https://www.ijser.org/onlineResearchPaperViewer.aspx?Environmental-Impacts-on-Groundwater-of-Wadi-Bani-Malik-Jeddah-Saudi-Arabia.pdf (accessed on 8 April 2021).
- Water Atlas of Saudi Arabia (1984 Edition)|Open Library. Available online: https://openlibrary.org/works/OL10946619W/Water_atlas_of_Saudi_Arabia (accessed on 6 March 2021).
- Lloyd, J.W.; Pim, R.H. The hydrogeology and groundwater resources development of the Cambro-Ordovician sandstone aquifer in Saudi Arabia and Jordan. J. Hydrol. 1990, 121, 1–20. [Google Scholar] [CrossRef]
- Alsharhan, A.S.; Rizk, Z.A.; Nairn, A.E.M.; Bakhit, D.W.; Alhajari, S. Hydrogeology of an Arid Region: The Arabian Gulf and Adjoining Areas; Elsevier: Amsterdam, The Netherlands, 2001. [Google Scholar]
- Powers, R.W.; Ramirez, L.F.; Redmond, C.D.; Elberg, E.L. Geology of the Arabian Peninsula Sedimentary Geology of Saudi Arabia; United States Geological Survey: Reston, VA, USA, 1966.
- Loaiza, J.G.; Bustos-Terrones, Y.; Bustos-Terrones, V.; Monjardín-Armenta, S.A.; Quevedo-Castro, A.; Estrada-Vazquez, R.; Rangel-Peraza, J.G. Evaluation of the Hydrochemical and Water Quality Characteristics of an Aquifer Located in an Urbanized Area. Appl. Sci. 2022, 12, 6879. [Google Scholar]
- Guo, Y.; Zhai, Y.; Wu, Q.; Teng, Y.; Jiang, G.; Wang, J.; Liu, S. Proposed APLIE method for ground water vulnerability assessment in karst-phreatic aquifer, Shandong Province, China: A case study. Environ. Earth Sci. 2016, 75, 112. [Google Scholar]
- Odey, M.O.; Ibor, O.R.; Andem, A.B.; Ettah, I.; Chukwuka, A.V. Drinking water quality and risk implications for community health: A case study of shallow water wells and boreholes in three major communities in Northern Cross-River, Southern Nigeria. Hum. Ecol. Risk Assess. Int. J. 2018, 24, 427–444. [Google Scholar] [CrossRef]
- Valko, M.; Morris, H.; Cronin, M.T. Metals, toxicity and oxidative stress. Curr. Med. Chem. 2005, 12, 1161–1208. [Google Scholar] [CrossRef] [PubMed]
- Omar, W.A.; Khalid, H.; Zaghloul, A.A.; Abo-Hegab, A.S. Risk assessment and toxic effects of metal pollution in two cultured and wild fish species from highly degraded aquatic habitats. Arch. Environ. Contam. Toxicol. 2013, 65, 753–764. [Google Scholar] [CrossRef] [PubMed]
- Jerome, F.C.; Hassan, A.; Omoniyi-Esan, G.O.; Odujoko, O.O.; Chukwuka, A.V. Metal uptake, oxidativestress and histopathological alterations in gills and hepatopancreas of Callinectesamnicola exposed to industrial effluent. Ecotoxicol. Environ. Saf. 2017, 139, 179–193. [Google Scholar] [CrossRef] [PubMed]
- Kumar, S.; Kumar, M.; Chandola, V.K.; Kumar, V.; Saini, R.K.; Pant, N.; Kumari, N.; Srivastava, A.; Singh, S.; Singh, R.; et al. Groundwater Quality Issues and Challenges for Drinking and Irrigation Uses in Central Ganga Basin Dominated with Rice-Wheat Cropping System. Water 2021, 13, 2344. [Google Scholar] [CrossRef]
- Kehagia, K.; Koukouliou, V.; Bratakos, S.; Seferlis, S.; Tzoumerkas, F.; Potiriadis, C. Radioactivity monitoring in drinking water of Attika, Greece. Desalination 2007, 213, 98–110. [Google Scholar] [CrossRef]
- Kozlowska, B.; Walencik, A.; Dorda, J.; Przylibski, T.A. Uranium, radium and 40K isotopes in bottled mineral waters from Outer Carpathians, Poland. Radiat. Meas. 2007, 42, 1380–1386. [Google Scholar] [CrossRef]
- Kallithrakas-Kontos, N.G.; Xarchoulakos, D.C.; Boultadaki, P.; Potiriadis, C.; Kehagia, K. Selective membrane complexation and uranium isotopes analysis in tap water and seawater samples. Anal. Chem. 2018, 90, 4611–4615. [Google Scholar] [CrossRef]
- Asadi, E.; Isazadeh, M.; Samadianfard, S.; Ramli, M.F.; Mosavi, A.; Nabipour, N.; Shamshirband, S.; Hajnal, E.; Chau, K.W. Groundwater quality assessment for sustainable drinking and irrigation. Sustainability 2020, 12, 177. [Google Scholar] [CrossRef]
- Hashim, M.; Nor, S.S.M.; Nayan, N.; Mahat, H.; Saleh, Y.; See, K.L.; Norkhaidi, S.B. Analysis of Well Water Quality in the District of Pasir Puteh, Kelantan, Malaysia. Earth Environ. Sci. 2019, 286, 012021. [Google Scholar] [CrossRef]
- Chaves, R.S.; Salvador, D.; Paulo Nogueira, P.; Santos, M.M.; Aprisco, P.; Célia Neto, C.; Cardoso, V.; Benoliel, M.J.; Rodrigues, J.E.; Carneiro, R.N. Assessment of Water Quality Parameters and their Seasonal Behavior in a Portuguese Water Supply System: A 6-year Monitoring Study. Environ. Manag. 2022, 69, 111–127. [Google Scholar] [CrossRef]
- Ober, J.; Karwot, J.; Rusakov, S. TapWater Quality and Habits of Its Use: A Comparative Analysis in Poland and Ukraine. Energies 2022, 15, 981. [Google Scholar] [CrossRef]
- Ji, Y.; Wu, J.; Wang, Y.; Elumalia, V.; Subramani, T. Seasonal Variation of Drinking Water Quality and Human Health Risk Assessment in Hancheng City of Guanzhong Plain, China. Expo. Health 2020, 12, 469–485. [Google Scholar] [CrossRef]
- Zhang, H.; Xu, L.; Huang, T.; Yan, M.; Liu, K.; Miao, Y.; He, H.; Li, S.; Sekar, R. Combined effects of seasonality and stagnation on tap water quality: Changes in chemical parameters, metabolic activity and co-existence in bacterial community. J. Hazard. Mater. 2021, 403, 124018. [Google Scholar] [CrossRef]
- Zabed, H.; Suely, A.; Faruq, G.; Sahu, J.N. Water quality assessment of an unusual ritual well in Bangladesh and impact of mass bathing on this quality. Sci. Total Environ. 2014, 472, 363–369. [Google Scholar] [CrossRef] [PubMed]
- Fadaei, A.; Sadeghi, M. Evaluation and assessment of drinking water quality in Shahrekord, Iran. Res. Environ. 2014, 4, 168–172. [Google Scholar]
- Ibrahim, M.N. Assessing Groundwater Quality for Drinking Purpose inJordan: Application of Water Quality Index. J. Ecolog. Engine 2019, 20, 101–111. [Google Scholar] [CrossRef]
- Zafar, M.M.; Sulaiman, M.A.; Prabhakar, R.; Kumari, A. Evaluation of the suitability of groundwater for irrigational purposes using irrigation water quality indices and geographical information systems (GIS) at Patna (Bihar), India. Int. J. Energy Water Resour. 2022, 1–14. [Google Scholar] [CrossRef]
- Agwu, A.; Avoaja, A.G.; Kalu, A.U. The assessment of drinking water sources in Aba Metropolis, Abia State, Nigeria. Resour. Environ. 2013, 3, 72–76. [Google Scholar]
- Mohamed, A.K.; Dan, L.; Kai, S.; Eldaw, E.; Abualela, S. Evaluating the suitability of groundwater for drinking pur-poses in the North Chengdu Plain, China. E3S Web Conf. 2019, 81, 01006. [Google Scholar] [CrossRef]
- Khan, S.; Shahnaz, M.; Jehan, N.; Rehman, S.; Tahir Shah, M.; Din, I. Drinking water quality and human health risk in Charsadda district, Pakistan. J. Clean. Produc. 2013, 60, 93–101. [Google Scholar] [CrossRef]
- Singh, B.; Chauhan, J.S.; Mohan, A. A construction of water quality index considering physicochemical properties for drinking purposes in a rural settlement: A case study of Gajraula region, Ganga River Basin (North India). Water Sci. Technol. Water Supp. J. 2012, 126, 818–828. [Google Scholar] [CrossRef]
- Al-Zarah, A.I. Evaluation of household drinking water quality in Al-Ahsa city, Saudi Arabia. Rese. J. Environ. Sci. 2014, 8, 62–77. [Google Scholar] [CrossRef][Green Version]
- U.S.EPA. Fecal Indicator Organism Behavior in Ambient Waters and Alternative Indicators for Tropical Regions; U.S. Environmental Protection Agency, Office of Science and Technology: Washington, DC, USA, 2009.
- Gofti, L.; Zmirou, D.; Murandi, F.S.; Hartemann, P.; Poleton, J.L. Waterborne microbiological risk assessment: A state of the art and perspectives. Rev. Epidemiol. Sante Publique. 1999, 47, 61–73. [Google Scholar] [PubMed]
- Emmanuel, E.; Pierre, M.G.; Perrodin, Y. Groundwater contamination by microbiological and chemical substances released from hospital wastewater and health risk assessment for drinking water consumers. Environ. Intern. J. 2009, 35, 718–726. [Google Scholar] [CrossRef]
- Gala, G.H. Chlorine in water disinfection. Pure Appl. Chem. 1996, 68, 1731–1735. [Google Scholar]
- Badr, E.-S.A.; Al-Naeem, A.A. Assessment of Drinking Water Purification Plant Efficiency in Al-Hassa, Eastern Region of Saudi Arabia. Sustainability 2021, 13, 6122. [Google Scholar] [CrossRef]
- Fazel, H.K.; Abdo, S.M.; Elthagafi, A.M.; Eldosari, S.H.; Baoku, Z.; Safaa, H.M. View of Saudi Arabia strategy for water resources management at Bishah, Aseer Southern Region Water Assessment. Sustainability 2022, 14, 4198. [Google Scholar] [CrossRef]


Publisher’s Note: MDPI stays neutral with regard to jurisdictional claims in published maps and institutional affiliations. |
© 2022 by the authors. Licensee MDPI, Basel, Switzerland. This article is an open access article distributed under the terms and conditions of the Creative Commons Attribution (CC BY) license (https://creativecommons.org/licenses/by/4.0/).