Article

Spatial and Temporal Distribution of Total Phosphorus in Sediments of Shuangtai Estuary Wetland during the Period of Reed Growth

1
College of Water Conservancy, Shenyang Agriculture University, Shenyang 110866, China
2
Department of Environmental Science, Policy, and Geography, University of South Florida, Tampa, FL 33703, USA
*
Author to whom correspondence should be addressed.
Water 2022, 14(23), 3804; https://doi.org/10.3390/w14233804
Submission received: 10 October 2022 / Revised: 18 November 2022 / Accepted: 19 November 2022 / Published: 22 November 2022

Abstract

:
Phosphorus is an essential macronutrient that plays a crucial role in the regulation of the biological productivity and biogeochemical cycling of other biogenic elements. As a large tidal wetland dominated by reeds in Liaoning province, China, the Shuangtai estuary wetland is a unique ecosystem class. To better understand the spatial and temporal distributions of total phosphorus (TP) in the sediments of the Shuangtai estuary wetland during the period of reed growth, eight sampling sites were established within the wetland, approximately 11 to 24 km from Liaohe River. These sites were sampled once a month at multiple sediment depth intervals between April and October in 2018 and 2019, periods of time that corresponded with the reed growth period. An alkali fusion method was used to determine TP in the sediment samples. The results show that sediment TP content of wetland sediments ranged from 0.001 to 0.781 mg/kg, and decreases from southwest to northeast with the increase in sediment depth. The TP content reaches the maximum corresponding to the fastest growth stage of the reeds (June and July), while the minimum occurs in October (i.e., the maturity stage of reeds). The variation law of TP in cross-sectional sediment in the wetland is that the deeper the sediments are, the lower the content; its maximum content occurs in surface soil. The TP content of each site tends to be stable with increasing depth and has a regularly dynamic seasonal variation with the growth of reeds.

1. Introduction

Wetlands play an irreplaceable role in regulating the global climate, maintaining the global hydrological cycle, protecting ecosystem diversity, and safeguarding human welfare [1]. Wetlands form an important barrier against the transport of contaminants between water and land and are of great significance in maintaining ecological balance and protecting environmental resources [2]. Phosphorus is an essential nutrient that is often considered to be the limiting factor in primary productivity in wetlands. The authors in [3,4] indicated significant differences in the distribution of the same nutrients in wetland soils under different spatial and hydrological conditions that have a direct influence on the import and export of phosphorus in wetlands, and indirect impact via the biogeochemical cycling influences on the forms of phosphorus and exchanges between phosphorus and soil organisms.
There are substantial variations in the temporal and spatial distributions of total phosphorus (TP) content and accumulation in wetland sediments influenced by environmental or geological conditions [5]. The environment has a great influence on TP content. Research on the Lake Okeechobee watershed discovered that the average TP content in surface sediment is 71.14 mg/kg, with content ranging from 3.09 to 997.40 mg/kg and decreasing from east to west. TP content is very low in the southwest because vast forests are in that area and there is little human activity. The source for the higher values is linked to agriculture, including citrus farms, in that high TP content may be related to artificial fertilization [6]. Fossil material can contain considerable amounts of phosphorus [7].
Geological conditions also have a significant impact on TP content. An example of the large variation in TP content can be seen across France. Because of the different categories of mud and sand, TP contents in three different regions in France are also different. TP contents are similar in the Bay of Seine (6–22 μmol/g) and in the Gironde (4–25 μmol/g), but they are higher in the Loire estuary (17–44 μmol/g). Andrieux-Loyer et al. (2001) [8], and Jia Yuhua et al. (2014) [9] analyzed the distribution and spatial variations in total phosphorus using classical and geostatistical methods in loess areas. The TP content in the surface sediments of their research area was 0.44 mg/kg and significantly higher than the three subsurface depths. The same methods were used to measure the less sandy land in the southeastern margin of Horqin, and analyzed the impact of farming on the spatial variability of TP in sandy soil. The results suggested that TP content in both the surface and subsurface soil of arable land reclaimed from grassland eight years earlier significantly increased (p < 0.05) compared with that in uncultivated grassland. The contents in both layers of soil increased by 7.64% (257.1 kg/km2), and there was a significant difference in the spatial structure and pattern of TP in arable land compared with that in grassland [10].
Apart from decomposing litter, a main source of phosphorous in the soil is fecal depositions [11]. The soil profiles generally showed higher contents of phosphorus in the upper soils (0–30 cm), with the highest contents in the top soils, exhibiting probable surface built up from litter and root activity due to plant biological cycles [12]. Dead plant roots and root exudates can increase soil phosphorus levels in the rhizosphere [13]. Marl soils are less capable of storing TP than organic soils are that are rich in detrital material derived from local vegetation [14]. The net nutrient uptake of plants varies with plant growth. On the basis of the nutrient balance in an entire year, 46.0% of total nitrogen (TN) and 26.8% of TP are taken in by aboveground biomass when influent TN and TP loadings are 61.39 and 7.39 g/(m2·a). Plant uptake is an important pathway for nutrient removal in constructed wetlands for treating eutrophic water [15]. When considering biological purification by harvesting plants, the rate of purification is the highest by harvesting S. alterniflora aboveground biomass, especially with disposing of phosphorus in wetlands [16]. In wetlands, the different biomass and absorption levels of TP in plant organs accompany the differences in plant growth condition changes during different growth stages [17].
This study area is located in the southern Liaohe River delta of Liaoning province, China, Shuangtai estuary wetland, which is the second largest reed wetland in Asia. In particular, the reed-bed system is considered to be efficient, and economically and environmentally attractive, and sustainable. In the last several years, extensive studies at University College Dublin, Ireland have been undertaken to develop novel approaches for the purpose of enhancing pollutant removal in reed-bed treatment systems. These include the “tidal flow” operation strategy and dewatered alum sludge cake (DASC)-based reed bed system. These innovative approaches have demonstrated the improved ability of reed-bed systems to enhance oxygen transfer, and a high immobilization capacity for P removal from wastewater [18]. Therefore, this study measured the variation characteristics of TP distribution on the basis of sampling during the growth period of reeds.
Research in this field in China and abroad mainly focuses on the vertical distribution, storage, and migration of total phosphorusm and the relationship of phosphorus in various binding states, and the relationship between total phosphorus eutrophication, such as Huang Cheng et al. (2017) [19], and Bartoszek L. et al. (2009). In this study, the TP of wetland sediments in the Shuangtai estuary wetland was measured periodically. On the basis of the study of nutrient profile distribution changes in wetland sediments, transverse distribution changes and time changes were studied in order to comprehensively analyze the TP cycle change rule of wetland sediments. The idea of the study is relatively new and it complements other studies well.
The primary objectives of this study are (1) the vertical distribution of TP content in sediments, (2) the horizontal distribution of TP content in sediments, and (3) the variation of TP content in sediments at the different growth stages of reeds. The goal is to understand the influence of wetland vegetation on the distribution of TP in soils. The knowledge may help provide better protection in this large tidal wetland dominated by reeds wetland.

2. Materials and Methods

2.1. Study Area

The Shuangtai estuary wetland is located in the southern part of the Liaohe Delta, Liaoning Province, along the northern continental coastline of China (Figure 1). The total area is 3150 km2 and it consists of a complex ecosystem of coastal wetlands and inland delta wetlands. The Shuangtai estuary wetland is a sedimentary plain downstream of the Liaohe River, Hun River, Taizi River, Raoyang River, and Daling River [20]. The estuary has a large area of freshwater and salt marshes, sandy beaches, and tidal mudflats. Rivers systems include the Shuangtai River, Daliao River, Raoyang River, and Daling River which flow into the sea through this area and have increased surface runoff.
The Liaohe River basin has a dendritic structure and it is wide from east to west and narrow from north to south. There are nearly half of the mountains in the Liaohe River basin, and the rest are hills, plains, and dunes. The climate is characterized by temperate continental monsoons with a large annual temperature difference and distinct four seasons. In terms of water quality, the Liaohe water quality in Pan Jin in 2019 could meet the Class III water standard, and it was verified that there was a certain rule in the change of various pollutant concentrations, and the total phosphorus content showed a very weak correlation or no correlation with the discharge.
The vegetation in the protected area is affected by soil structure, water, salt content, and tide, and can be divided into four major categories: the coastal salted grassland of Suaeda, the Agrocybe halophyte meadow, reed marsh, and aquatic vegetation. Among them, the reed marsh is the vegetation type with the widest distribution and the largest area in the vegetation composition of the area [20]. Wetland Phragmites reeds with many reed pond bogs are in natural form and have an elevation ranging from sea level to 4 m with a surface slope of 0.02% [20]. The soil-forming material in this area mainly flows into the river carrying a large amount of sediment, and the soil is mainly marsh soil and saline soil tidal flat soil. Due to the long-term accumulation of water, the soil has poor air permeability and slow nutrient decomposition. The high amount affects the substitution and absorption of soil nutrients by plant roots, resulting in a large accumulation of soil nutrients. The wetland sediments are mainly derived from mud delivered by the river and include saline marsh soil sand tidal flats. As evidenced by year-round ponding, the sediments have low permeability which has contributed to a slow rate of decomposition in the organic matter [21]. While decomposition is slowed, salinity influences nutrient uptake and exchange. The study covered an area extending from N 40°51.988′/E 121°36.685′ to N 41°11.943′/E 121°39.160′.

2.2. Sample Collection

This study was based on the National Natural Science Foundation (31200329), in order to ensure the accuracy of the study, this paper made full use of GPS technology to accurately locate the sampling points, and selected more representative points under the guidance of local reed field staff. The sampling points were evenly distributed in each functional area (experimental zone, buffer zone, core zone). In this study, two sampling points were set in the experimental zone and buffer zone from the north of the wetland to the mouth of the estuary, and four sampling points were set in the core zone with equal intervals, totaling eight sampling points (among which S1 and S2 belonged to the experimental zone, S3 and S4 belonged to the buffer zone, and S5, S6, S7, and S8 belonged to the core zone). The sample site coordinates are shown in Table 1. The total distance is 47.8 km and the spacing between each site is approximately 6km. Sites were located approximately 11~24 km from the edge of the river. The main reason is that the wetland, as the last barrier to the estuary of the Liao River, is inevitably affected by tidal action. Investigation results revealed that saltwater intrusion had a significant effect on the nutrient structure and probably alleviated a phosphorus-limiting situation in the estuary ecosystem. All these changes were induced to some degree by tidal currents and their associated sediment-agitation process and had a profound effect on the estuary ecosystem [22]. Sampling was timed to coincide with the following stages of the reed growth cycle: germination, nutrition, reproduction, and maturation. To accomplish this, samples were collected once a month at a fixed time, totaling twenty months from April to October in 2018 and 2019. A soil auger (Xingtai Agricultural Mechanization Institute of Hebei Province; TY-1000 undisturbed soil sample; China)was used to collect samples at 0–10, 10–20, 20–30, 30–40, and 40–50 cm intervals. Indeed, 800 sediment samples were collected in total. Samples were immediately placed in zip lock bags and kept cool before being transported to the laboratory for TP analysis.

2.3. TP Measurement

Samples were put in the dark room without any treatments until they were completely dry. Samples were then crushed and homogenized, after the removal of impurities such as dead roots and rubbles which could not pass the griddle. Samples were processed with a soil pulverizer, and then 200 g of the sample was removed and ground in an agate mortar with a glass rod. After being ground, the samples were sieved through 100 meshes (0.152 mm). TP content was determined in the sieved samples via alkali fusion---TP-Mo-Sb colorimetry (GB7852-87) with AR reagents and ultra-pure water. This measurement method of TP can be traced back to the study of sediment TP by Zhao Xiaoguang et al. (2015) and Cao Lei (2014). The analysis incorporated the Chinese national standard soil reference materials (GSS-1, GSS-4) for quality control.

2.4. Analytical Methods

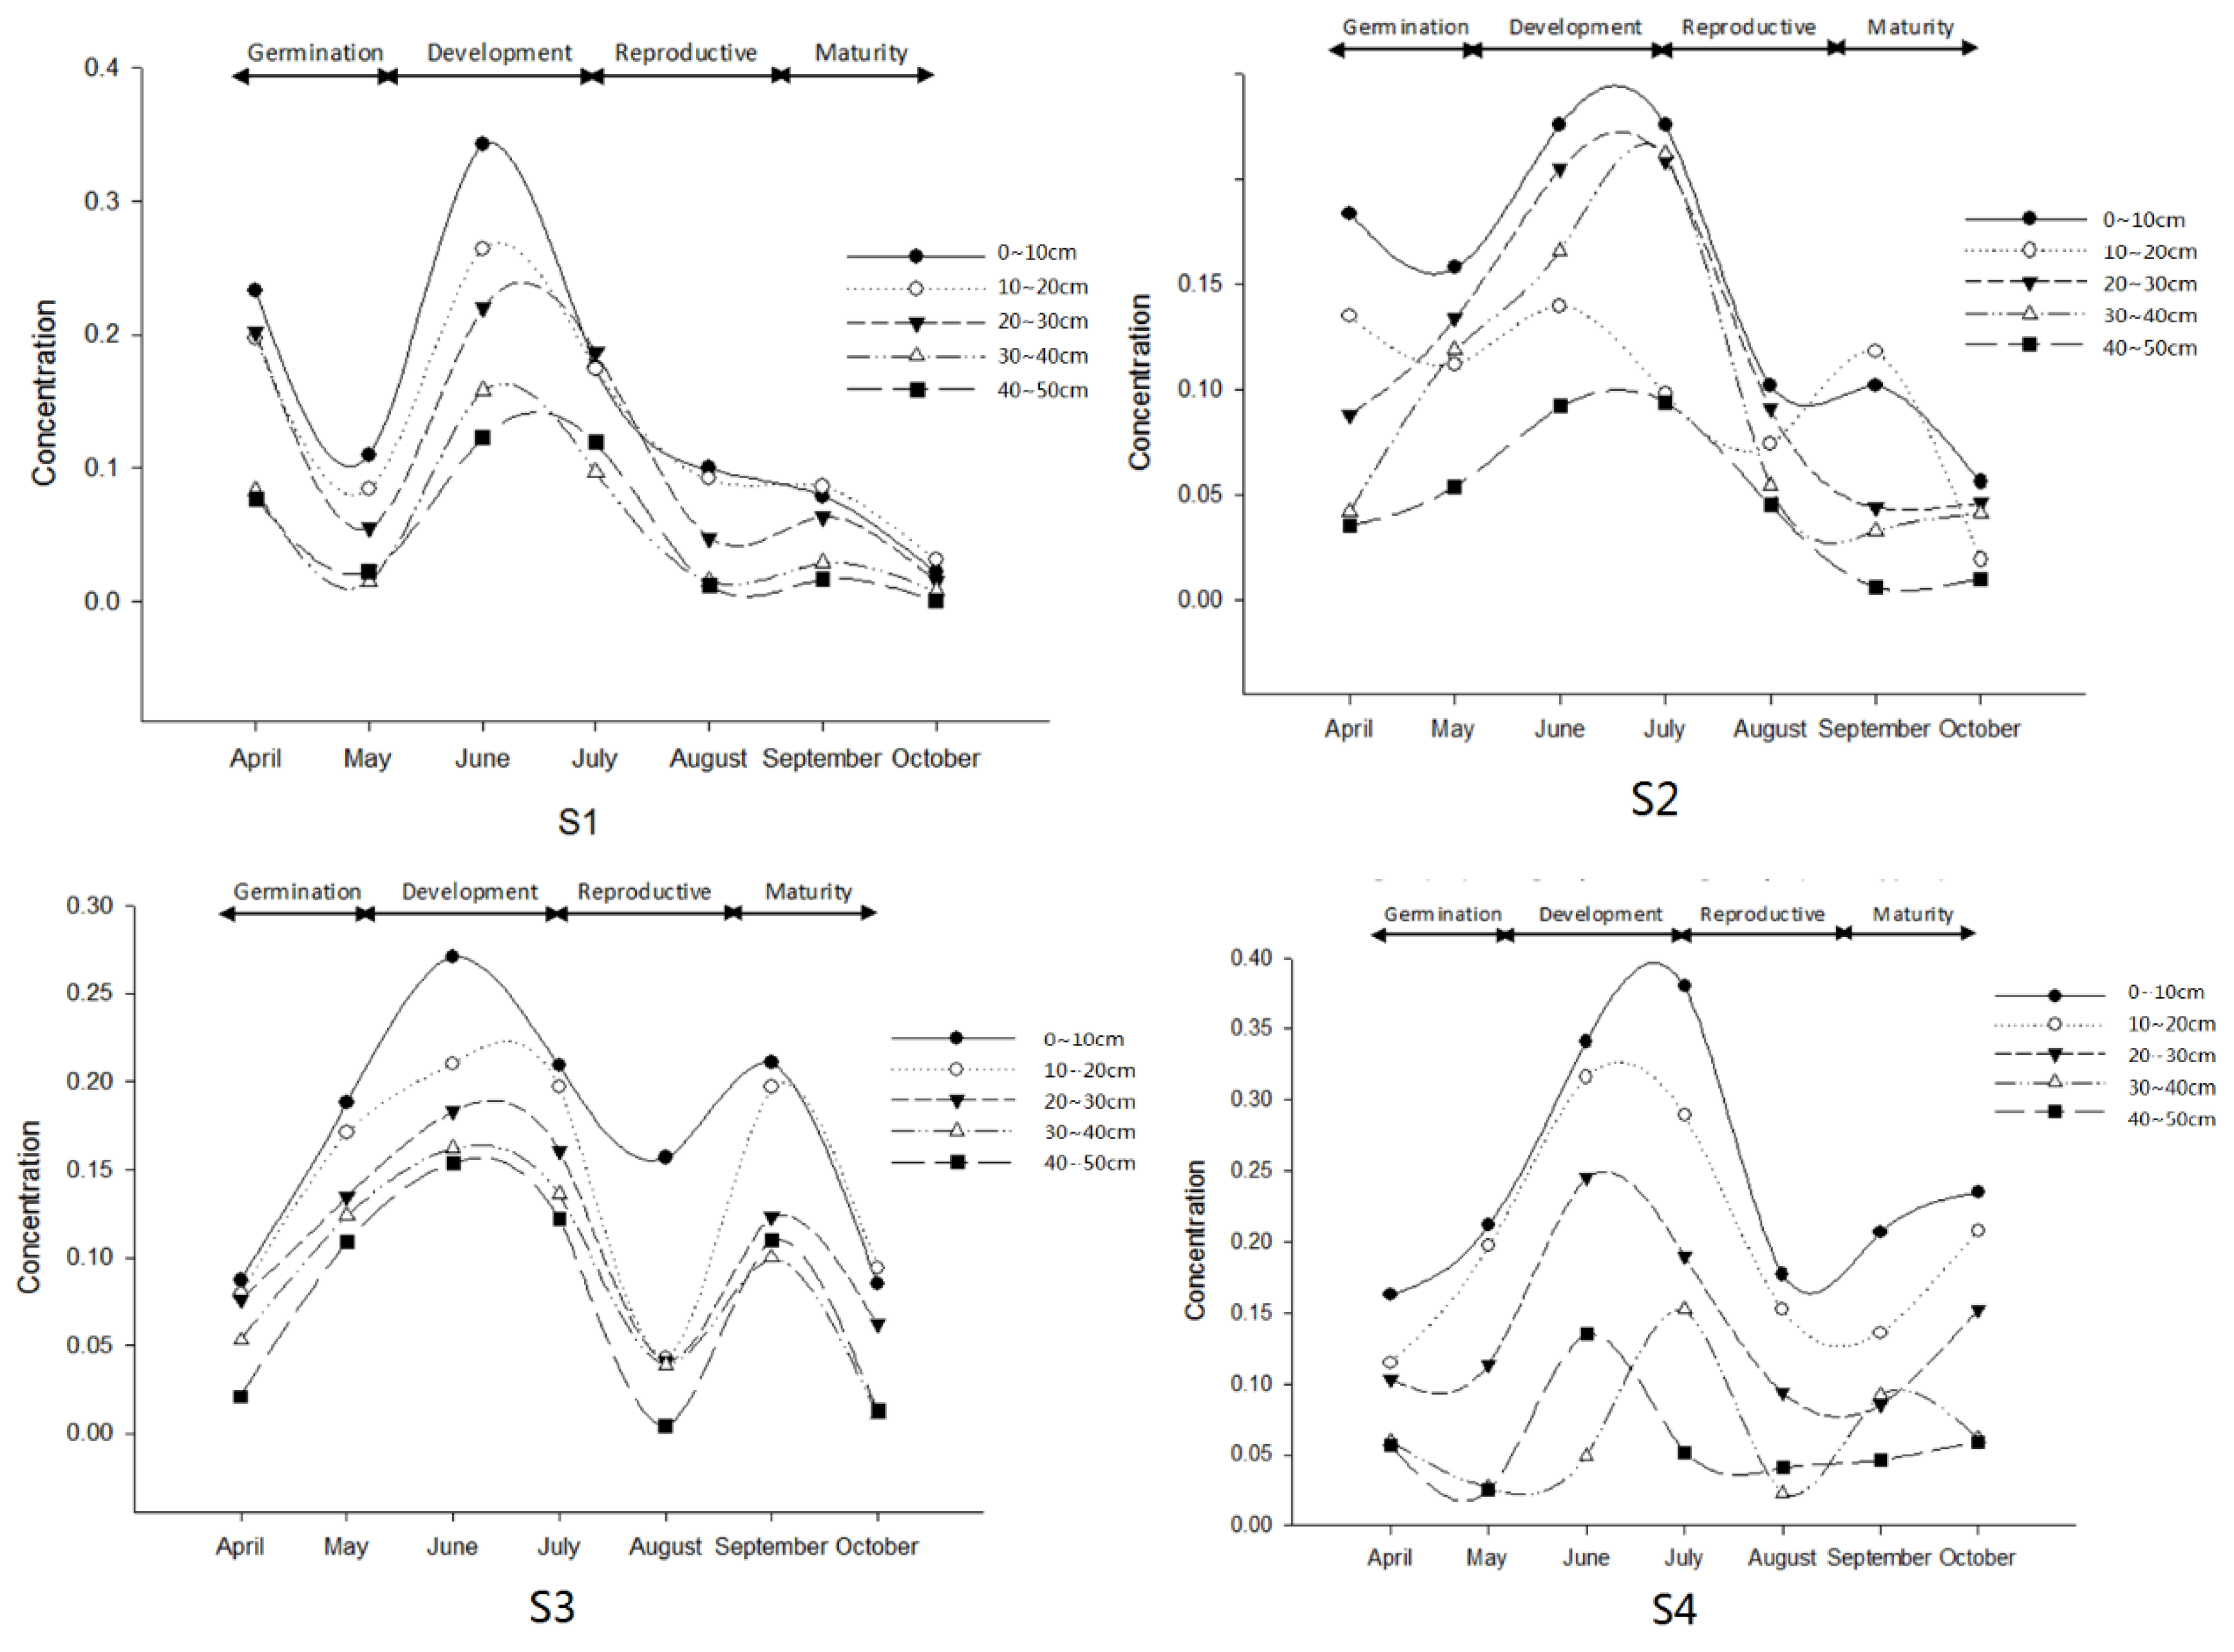
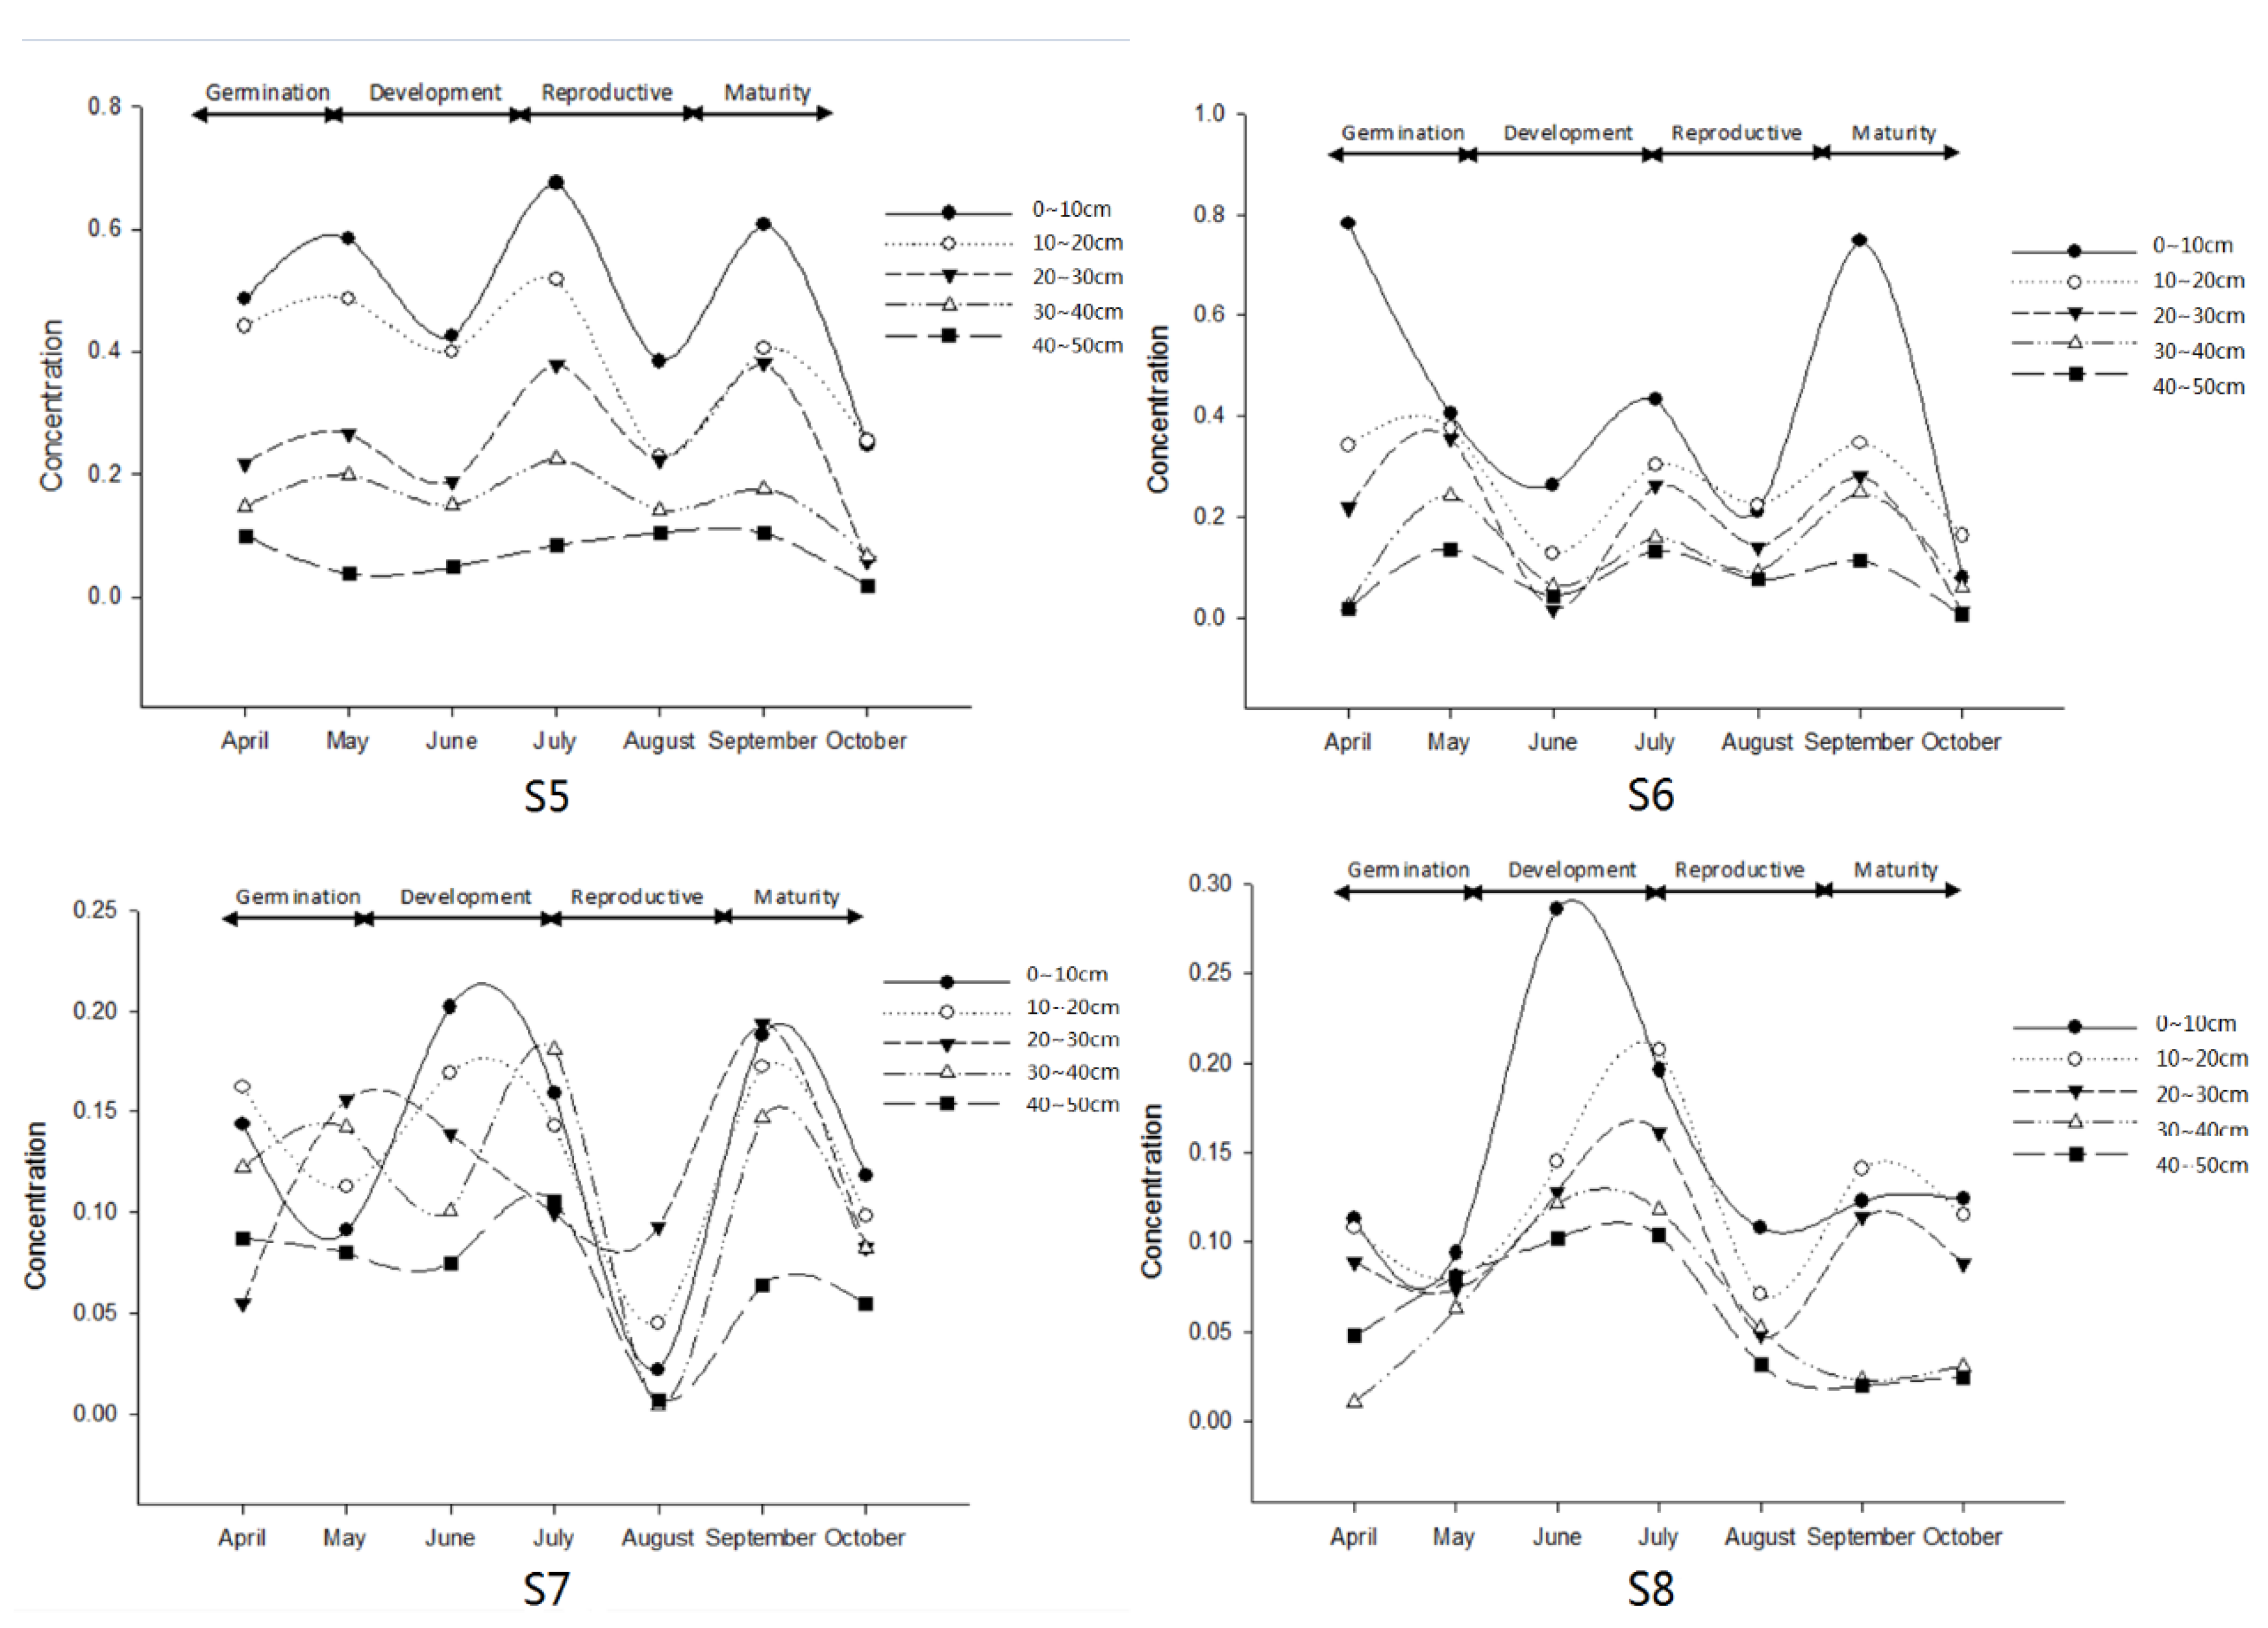
In this paper, eight sampling points in the Shuangtai Estuary Wetland were collected at different depths and at different times. The data of the sediment samples were analyzed by SPSS (20.0), including ANOVA and Multiple comparisons. The drawing software used was SigmaPlot 12.0. By comparing the TP content, the variation law of TP content in the sediment with time and space was obtained (Figure 2).

3. Results and Discussion

3.1. Vertical Distribution of TP Content in Sediments

Figure 2 shows the vertical distribution of TP content in sediments during the reed growth period. The TP content at 0~10 cm layer is higher than the other layers from S1 to S8, and the lowest TP content is at 40~50 cm layer. According to Table 2., since the probability is very significant (p < 0.01, TP content is affected by different depths in sediments and shows extreme relevance. As is shown, 0–10, 10–20, 20–30, 30–40, and 40–50 cm are all significantly different when α = 0.05 level in Table 3. This is consistent with previous studies (Huang Cheng et al. 2017 and Hou, Dekun et al. 2014) and [19,23] concluded that the total phosphorus content in sediments decreased gradually with the increase of sediment depth.
The TP content reaches the maximum at the 0 to 10 cm layer. Additionally, it presented a cyclical pattern in both the 0–10 cm and the 10–20 cm layers. In the 20–30 cm layer, the change of TP content is very complex. TP content is relatively low and stable in the 30–40 cm and 40–50 cm layers. Another investigation discovered a high similarity in the spatial distribution of soil TP at the depths of 10 to 20 cm and 20 to 30 cm with a significant positive correlation between TP content and its variance in topsoil [24]. The variation law of TP in cross-sectional sediment in the wetland is that the deeper the sediments, the lower the content. This is attributed to the deposition [25]. The maximum level of content occurs in surface soil, because the upper part of the sediment is affected by the runoff inputs, litter decomposition, wetland sedimentation, and gradual migration of pollution in topsoil, while the deeper part is not greatly affected. That also verifies the conclusions drawn by Yang Xueming (1988) [26] on the TP content of cross-sectional soil in different slopes.

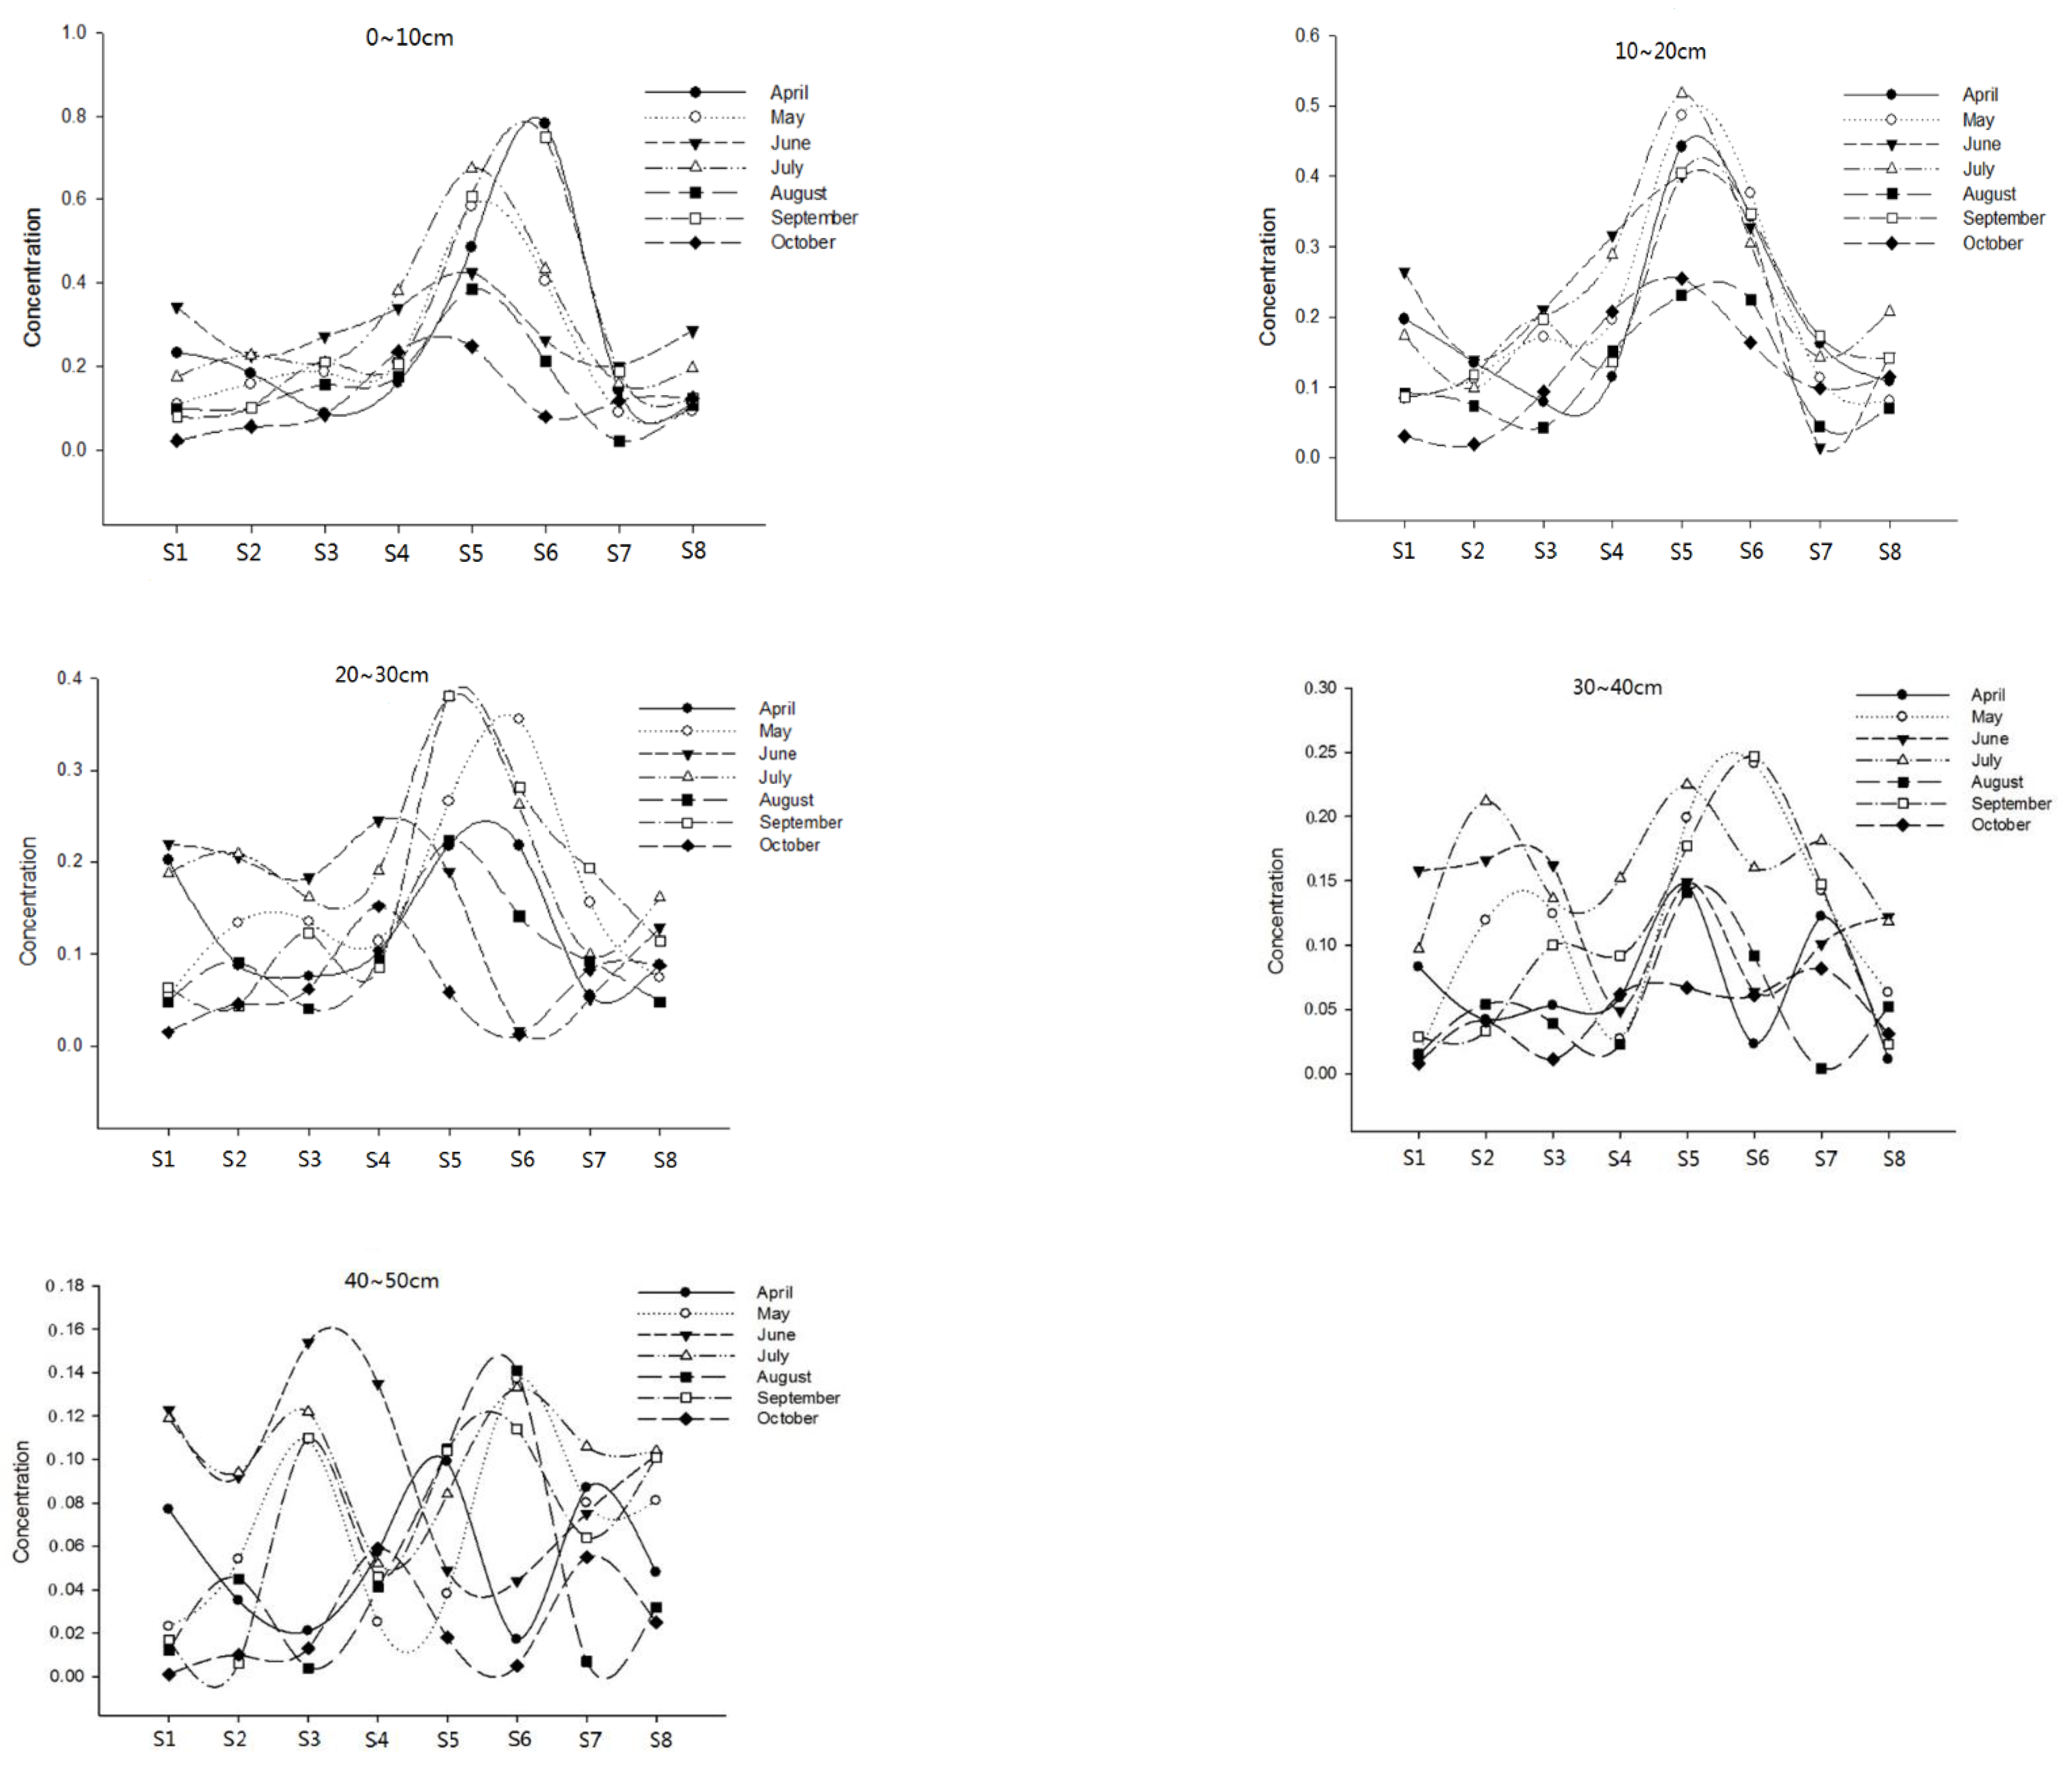
3.2. Horizontal Distribution of TP Content in Sediments

Figure 3 shows the horizontal distribution of TP content in 0~50 cm sediments of different months at every site. In the 0–10 cm, 10–20 cm, and 20–30 cm layers, the highest content is observed at sites S5 and S6, and the lowest is at S7. However, in the 30–40 cm and 40–50 cm layers, the highest and lowest sites are not statistically different among the samples. However, the overall content is lower than the other three levels. According to Table 2, since the probability is very significant (p < 0.01), TP content is affected by different sites, and significant relevance could be discovered. The variance should result from the nutrient inputs surrounding the sampling sites. As is shown in Table 4, S5 and S6 sites are significantly different from the other sites at the α = 0.05 level. However, there is no statistical difference among the other sites. This result can be compared with the spatial distribution pattern of total phosphorus in soil made by Zhu Jie et al. (2021) [27], and it is consistent with the research results that the spatial distribution of total phosphorus concentration in soil in the whole study area is similar between different soil layers and has significant correlation, which supports this conclusion.
It can be seen from Figure 3 that the TP content of all the sites except sites S5 and S6 has less volatility in different depth layers. The TP content in sediments of sites S5 and S6 is higher than the content of other sites. That means there could be other pollution sources near sites S5 and S6. The biggest difference is spotted between peaks and troughs in the surface layer. Although there are changes in the waveforms in each layer, the overall trend is the difference of layer peak and through gradually becoming smaller with the change of depth. That shows that the TP content of each site in the Shuangtai Estuary wetland gradually tends to be stable with the deepening of the depth because the deeper the layer is, the fewer influences it could receive. This is further verified by the TP content of the longitudinal variation of the law. It also verifies the vertical distribution of the TP content as described above.

3.3. Time Variation of TP Content in Sediments

Figure 2 and Figure 3 illustrate the time variation of TP content in sediments during the reed growth cycle. The highest TP content occurs in July and the lowest in October, which means that the TP content in sediment reaches the highest levels during the growth and reproduction phase and the lowest during the maturity phase. The reasons for this result include the great primary productivity of wetlands in summer could contribute to more nutrients with N, P, and organic matter, which were input into both sites [25]. According to Table 2, when the probability is very significant (p < 0.01), TP content in sediments is affected by the change of months and there was significant relevance. The data suggested that phosphorus probably migrated from paddy soil to wetland sediment through soil erosions and runoffs during rainy seasons, resulting in P accumulation in wetland sediment (Gao et al. 2012 and Smith et al. 2015) [28]. The results also show that TP content appears significantly different from each other in July, August, and October, and the difference in the other months is not significant at the level where α = 0.05 as Table 5 shows.
The TP content in sediments has a regularly dynamic seasonal variation with the growth of reeds. During the dormancy period (December to April), TP content is relatively high. In the germination period (April to May), the content decreases gradually because much phosphorus may have been absorbed by the reeds. From May to July (development period), TP content increases, and it reaches the maximum in July. From August, TP content in sediments begins to decrease and starts to rebound in October. In summary, the variation trend of TP content at various stages of reed growth is as follows: TP content shows a decreasing trend during the germination stage; whereas, in the nutrition growing stage, the content has a trend of initial increasing and then subsequent decreasing; in the reproduction stage, the content initially increases and then decreases; in the maturation stage, the content goes into a trend of slight increase, reaching the maximum in June and the minimum in September.
The results from Table 4 and Figure 2 show that the reeds can absorb very little TP in the early stage of the reed development (April May and June). However, they start to fertilize in the upstream region, when a large number of organic elements slip into the estuary wetlands with the runoff flowing in July with the content of TP in sediments reaching the highest level. As the reeds grow rapidly in August, the reeds absorb more TP through their roots from sediments than before, and the TP content decline from July to August. The TP content accumulates in the sediments until September, because the draining in the estuary wetlands is stopped at the beginning of September, there is a significant reduction of surface water and a lot of fodders are given to the seafood by humans. From Figure 2 and Table 3 the results can be concluded that the reeds become mature in October, when the water is much less than before and the work of nurturing seafood stops. As there are no influences of water upstream, feeding, and other factors, so the content of TP in October stands at the lowest level. Fish bones, the well-known soil fertilizer, have been proposed as a cheap source of natural calcium phosphate [29]. The main reason for TP change is the change in organic matter content, such as the use of chemical fertilizer. Fish and vertebrate fossils have been found in sandstones that are considered to be sources of sediment to the Bodél Depression. So TP content in sediment is 40–970 mg/kg in Saharan Bodélé [30]. An additional study shows that there is a higher TP content in the sediments on both sides of major rivers of Chaohu Lake Basin in the regions around cities and regional higher TP content due to fertilizer input.

4. Conclusions

In 2020–2021, we collected the sediment samples at these eight sampling points in the Shuangtai Estuary Wetland again and used the same methods to measure and analyze the TP content in the sediments. The results are in line with the conclusions of this paper.
The results obtained two years later were consistent with the previous conclusions, which just verified the influence of reed growth period on TP distribution, and the obvious difference in S5 and S6TP content before was due to the surrounding pollution sources, which also verified its correctness and tracks the distribution characteristics of TP in time better which is of great significance for this study.
The TP content in the sediments is 0.001 mg/kg to 0.781 mg/kg, similar to that in sediments of other estuarine wetlands in China. From a vertical perspective, the content gradually decreases with the increase in sediment depth, that is, the content in surface sediments is higher than that in other layers. From a horizontal perspective, TP content is more severely disturbed by humans, and effective measures should be taken to prevent wetland eutrophication. From the perspective of space, the contents in the first four sampling points are lower than that in the last four ones, that is, TP content gradually increases from northeast to southwest.
TP content in the sediment is affected by the growth cycle of reeds or other plants. Along with the reed growth cycle, TP content in sediments of the Shuangtai estuary wetland are higher in June and July than that in other months and reaches the minimum in October during the reed maturation stage.
The analysis indicates that reeds not only play a role in the spatial and temporal distribution of TP in wetlands but also have a function of significance in improving the TP distribution. In addition, the variation of TP content is related to tidal action, geological environment, and human factors such as fertilizer use, which may be further studied in the future.

Author Contributions

Conceptualization, X.L. and Q.L.; methodology, X.L.; software, Y.D.; validation, X.L., Q.L. and Y.D.; formal analysis, J.M.S.; investigation, X.L.; resources, X.L.; data curation, Q.L.; writing—original draft preparation, X.L. and Q.L.; writing—review and editing, X.L., Q.L. and Y.D.; visualization, X.L.; supervision, T.W.; project administration, X.L. All authors have read and agreed to the published version of the manuscript.

Funding

1. National Natural Science Foundation of China, 31200392; 2. Cultivation Plan for Youth Agricultural Science and Technology Innovative Talents of Liaoning Province in China, 2015048; 3. The Subject of Economic and Social Development of Liaoning Province in China, 2020lslktyb-079.

Data Availability Statement

Data are available on request from the authors. The data that support the findings of this study are available from the corresponding author, [Tieliang Wang], upon reasonable request.

Conflicts of Interest

There are no conflict of interest.

References

  1. Hu, S.J.; Niu, Z.G.; Chen, Y.F.; Li, L.F.; Zhang, H.Y. Global wetlands: Potential distribution, wetland loss, and status. Sci. Total Environ. 2017, 586, 319–327. [Google Scholar] [CrossRef] [PubMed]
  2. Costanza, R.; d’Arge, R.; De Groot, R.; Farber, S.; Grasso, M.; Hannon, B.; Limburg, K.; Naeem, S.; O’neill, R.V.; Paruelo, J.; et al. The value of the world’s ecosystem services and natural capital. Nature 1997, 387, 253–260. [Google Scholar] [CrossRef]
  3. Ramm, K.; Scheps, V. Phosphorus balance of a polytrophic shallow lake with the consideration of phosphorus release. Hydrobiologia 1997, 342–343, 43–53. [Google Scholar] [CrossRef]
  4. Xiao, R.; Bai, J.; Gao, H.; Deng, W.; Cui, B. Seasonal variations of total phosphorus in marsh soils from open and closed wetlands. Acta Prataculturae Sin. 2010, 19, 88–93. [Google Scholar]
  5. Hill, C.R.; Robinson, J.S. Phosphorus flux from wetland ditch sediments. Sci. Total Environ. 2012, 437, 315–322. [Google Scholar] [CrossRef] [PubMed]
  6. Fluck, R.C.; Fonyo, C.; Flaig, E. Land use based phosphorus balances for Lake Okeechobee, Florida, drainage basins. Appl. Eng. Agric. 1992, 8, 813–820. [Google Scholar] [CrossRef]
  7. Pasteris, A.; Gambi, N.; Guerrini, S.; Bandini, V.; Buscaroli, A.; Dinelli, E.; Fabbri, E. Linking responses at different levels of biological organization: The effect on biomarkers and life cycle traits in the earthworm Eisenia and rei exposed to copper-spiked soils. Comp. Biochem. Physiol. Part A Mol. Integr. Physiol. 2008, 151, S50–S51. [Google Scholar] [CrossRef]
  8. Andrieux-Loyer, F.; Aminot, A. Phosphorus forms related to sediment grain size and geochemical characteristics in French coastal areas. Estuar. Coast. Shelf Sci. 2001, 52, 617–629. [Google Scholar] [CrossRef] [Green Version]
  9. Jia, Y. Micro-Scale Spatial Variability of Soil Total Phosphorus in Abandoned Farmland on the Northern Loess Plateau. Chin. J. Soil Sci. 2014, 45, 116–122. [Google Scholar]
  10. Chen, M.; Chen, J.; Sun, F. Agricultural phosphorus flow and its environmental impacts in China. Sci. Total Environ. 2008, 405, 140–152. [Google Scholar] [CrossRef]
  11. Baron, V.S.; Dick, A.C.; Mapfumo, E.; Malhi, S.S.; Naeth, M.A.; Chanasyk, D.S. Grazing impacts on soil N and phosphorous under parkland pastures. J. Range Manag. 2001, 54, 704–710. [Google Scholar] [CrossRef]
  12. Jobbágy, E.G.; Jackson, R.B. The distribution of soil nutrients with depth: Global patterns and the imprint of plants. Biogeochemistry 2001, 53, 51–77. [Google Scholar] [CrossRef]
  13. Hinsinger, P. Bio availability of soil in organic Pinthe rhizosphere as affected by root-induced chemical changes: A review. Plant Soil 2001, 237, 173–195. [Google Scholar] [CrossRef]
  14. Scheidt, D.J.; Stober, J.; Jones, R.; Thornton, K. South Florida Ecosystem Assessment: Everglades Water Management, Soil Loss, Eutrophication and Habitat; US Environmental Protection Agency: Washington, DC, USA, 2000; 904-R-00-003. [Google Scholar]
  15. Weihong, J.; Rongbing, F.; Guowei, G. Plant Growth Characteristics and Nutrient Uptake from Eutrophic Water in Constructed Wetlands. Res. Environ. Sci. 2007, 20, 75–80. [Google Scholar]
  16. Min, Q.W.; Lv, S.Y.; Lei, Q.B. Study on uptake, distribution and sequestration of nutrients and heavy metals by salt marsh plants in Chang jiang Estuary. Mar. Environ. Sci. 2007, 26, 14–18. [Google Scholar]
  17. Fu, R.B.; Yang, H.Z.; Gu, G.W.; Zhang, Z. Analysis of substrate microrganisms status in constructed wetlands and their correlation with pollutants removal for wastewater treatment. Res. Environ. Sci. 2005, 18, 44–49. [Google Scholar]
  18. Zhao, Y.Q.; Zhao, X.H.; Babatunde, A.O. Use of dewatered alum sludge as main substrate in treatment reed bed receiving agricultural wastewater: Long-term trial. Bioresour. Technol. 2009, 100, 644–648. [Google Scholar] [CrossRef] [PubMed]
  19. Cheng, H.; Liang, A.; Zhi, Z. Phosphorus distribution and retention in lacustrine wetland sediment cores of Lake Changshou in the Three Gorges Reservoir area. Environ. Earth Sci. Vol. 2017, 76, 425. [Google Scholar] [CrossRef]
  20. Lu, X. Eco-Environmental Water Requirements and the Optimal Allocation of Water Resources of Shuangtai Estuary Wetland in Panjin; Shenyang Agricultural University: Shenyang, China, 2008. [Google Scholar]
  21. Li, L.; Hui, S.; Song, H.; Su, F. Evaluation of the services provided by the Shuangtai estuary wetland in Panjin based on emergy theory. China Environ. Sci. 2013, 33, 1454–1458. [Google Scholar]
  22. Long, A.; Sun, L.; Shi, R.; Zhou, W.; Dang, A. Saltwater Intrusion Induced by a Complete Neap Tide and Its Effect on Nutrients Variation in the Estuary of Pearl River, China. J. Coast. Res. 2013, 29, 1158–1168. [Google Scholar] [CrossRef]
  23. Hou, D.; He, J.; Lü, C.; Dong, S.; Wang, J.; Xie, Z.; Zhang, F. Spatial variations and distributions of phosphorus and nitrogen in bottom sediments from a typical north-temperate lake. China Environ. Earth Sci. 2014, 71, 3063–3079. [Google Scholar] [CrossRef]
  24. Deng, H.G.; Zhang, X.Z. Development and research on phosphorus in sediment. Guangzhou Environ. Sci. 2004, 19, 8–10. [Google Scholar]
  25. Lu, S.; Si, J.; Qi, Y.; Wang, Z.; Wu, X.; Hou, C. Distribution Characteristics of TOC, TN and TP in the Wetland Sediments of Longbao Lake in the San-Jiang Head Waters. Acta Geophys. 2016, 64, 2471–2486. [Google Scholar] [CrossRef] [Green Version]
  26. Yang, X.M. Amount and distribution of soil total phosphorus in different soil profiles along a traverse. J. Jilin Agric. Univ. 1988, 2, 41–49. [Google Scholar]
  27. Zhu, J.; Wu, A.; Zhou, G. Spatial distribution patterns of soil total phosphorus influenced by climatic factors in China’s forest ecosystems. Sci. Rep. 2021, 11, 5357. [Google Scholar] [CrossRef] [PubMed]
  28. Boutinguiza, M.; Pou, J.; Comesaña, R.; Lusquiños, F.; de Carlos, A.; León, B. Biological hydroxyapatite obtained from fish bones. Mater. Sci. Eng. C 2011, 32, 478–486. [Google Scholar] [CrossRef]
  29. Hudson-Edwards, K.A.; Bristow, C.S.; Cibin, G.; Mason, G.; Peacock, C.L. Solid-phase phosphorus speciation in Saharan Bodélé Depression dusts and source sediments. Chem. Geol. 2014, 384, 16–26. [Google Scholar] [CrossRef]
  30. Li, S.F. Spatial Distribution and Influencing Factors of Phosphorus in the Soils, River and Lake Sediments for the Studied Area of Chaohu Basin; Nanjing University: Nanjing, China, 2012. [Google Scholar]
Figure 1. Study area and sampling site.
Water 14 03804 g001
Figure 2. Vertical Distribution of TP content at each site(S1–S8).
Water 14 03804 g002aWater 14 03804 g002b
Figure 3. Horizontal distribution of TP content in different depths.
Water 14 03804 g003
Table 1. Sample site coordinates.
Point PositionOrientation
S1N 41°11.943′E 121°39.160′
S2N 41°10.247′E 121°42.630′
S3N 41°09.392′E 121°45.716′
S4N 41°06.159′E 121°45.734′
S5N 41°01.393′E 121°40.387′
S6N 40°59.255′E 121°40.434′
S7N 40°56.258′E 121°39.717′
S8N 40°51.988′E 121°36.685′
Table 2. ANOVA analysis for each source of TP in sediment.
SourceDF (Degree of Freedom)TypeISSMean SquareF Valuep
depth52.3700.59238.61<0.01
site81.8800.26917.510.01
month71.4060.23415.27<0.01
n10.1940.19412.630.0004
Alpha: 0.05; Error Degrees of Freedom: 541; Error Mean Square: 0.015344.
Table 3. Difference analysis at different depths.
SNK (Student-Newman-Keuls) GroupingMeanN (Number of Samples)Depth
A0.25711210
B0.21111220
C0.16011230
D0.11811240
E0.07411250
Alpha: 0.05; error degrees of freedom: 541; error mean square: 0.015344; different letters represent a significant difference, same letters don’t represent a significant difference.
Table 4. Difference analysis in different sites.
SNK (Student-Newman-Keuls) GroupingMeanN (Number of Samples)Site
A0.288705
B0.232706
C0.145702
C0.143703
C0.127707
C0.127704
C0.126708
C0.122701
Alpha: 0.05; error degrees of freedom: 541; error mean square: 0.015344; different letters represent a significant difference, same letters represent no significant difference.
Table 5. Difference analysis in different months.
SNK (Student-Newman-Keuls) GroupingMeanN (Number of Samples)Month
A0.23752807
B0.19625809
B0.18821805
B0.16853806
B0.16577804
C0.11893808
D0.071908010
Different letters represent a significant difference, same letters represent an insignificant difference.
Publisher’s Note: MDPI stays neutral with regard to jurisdictional claims in published maps and institutional affiliations.