Seasonal Variability of Plankton Production Parameters as the Basis for the Formation of Organic Matter Flow in the Southeastern Part of the Baltic Sea
Abstract
:1. Introduction
2. Materials and Methods
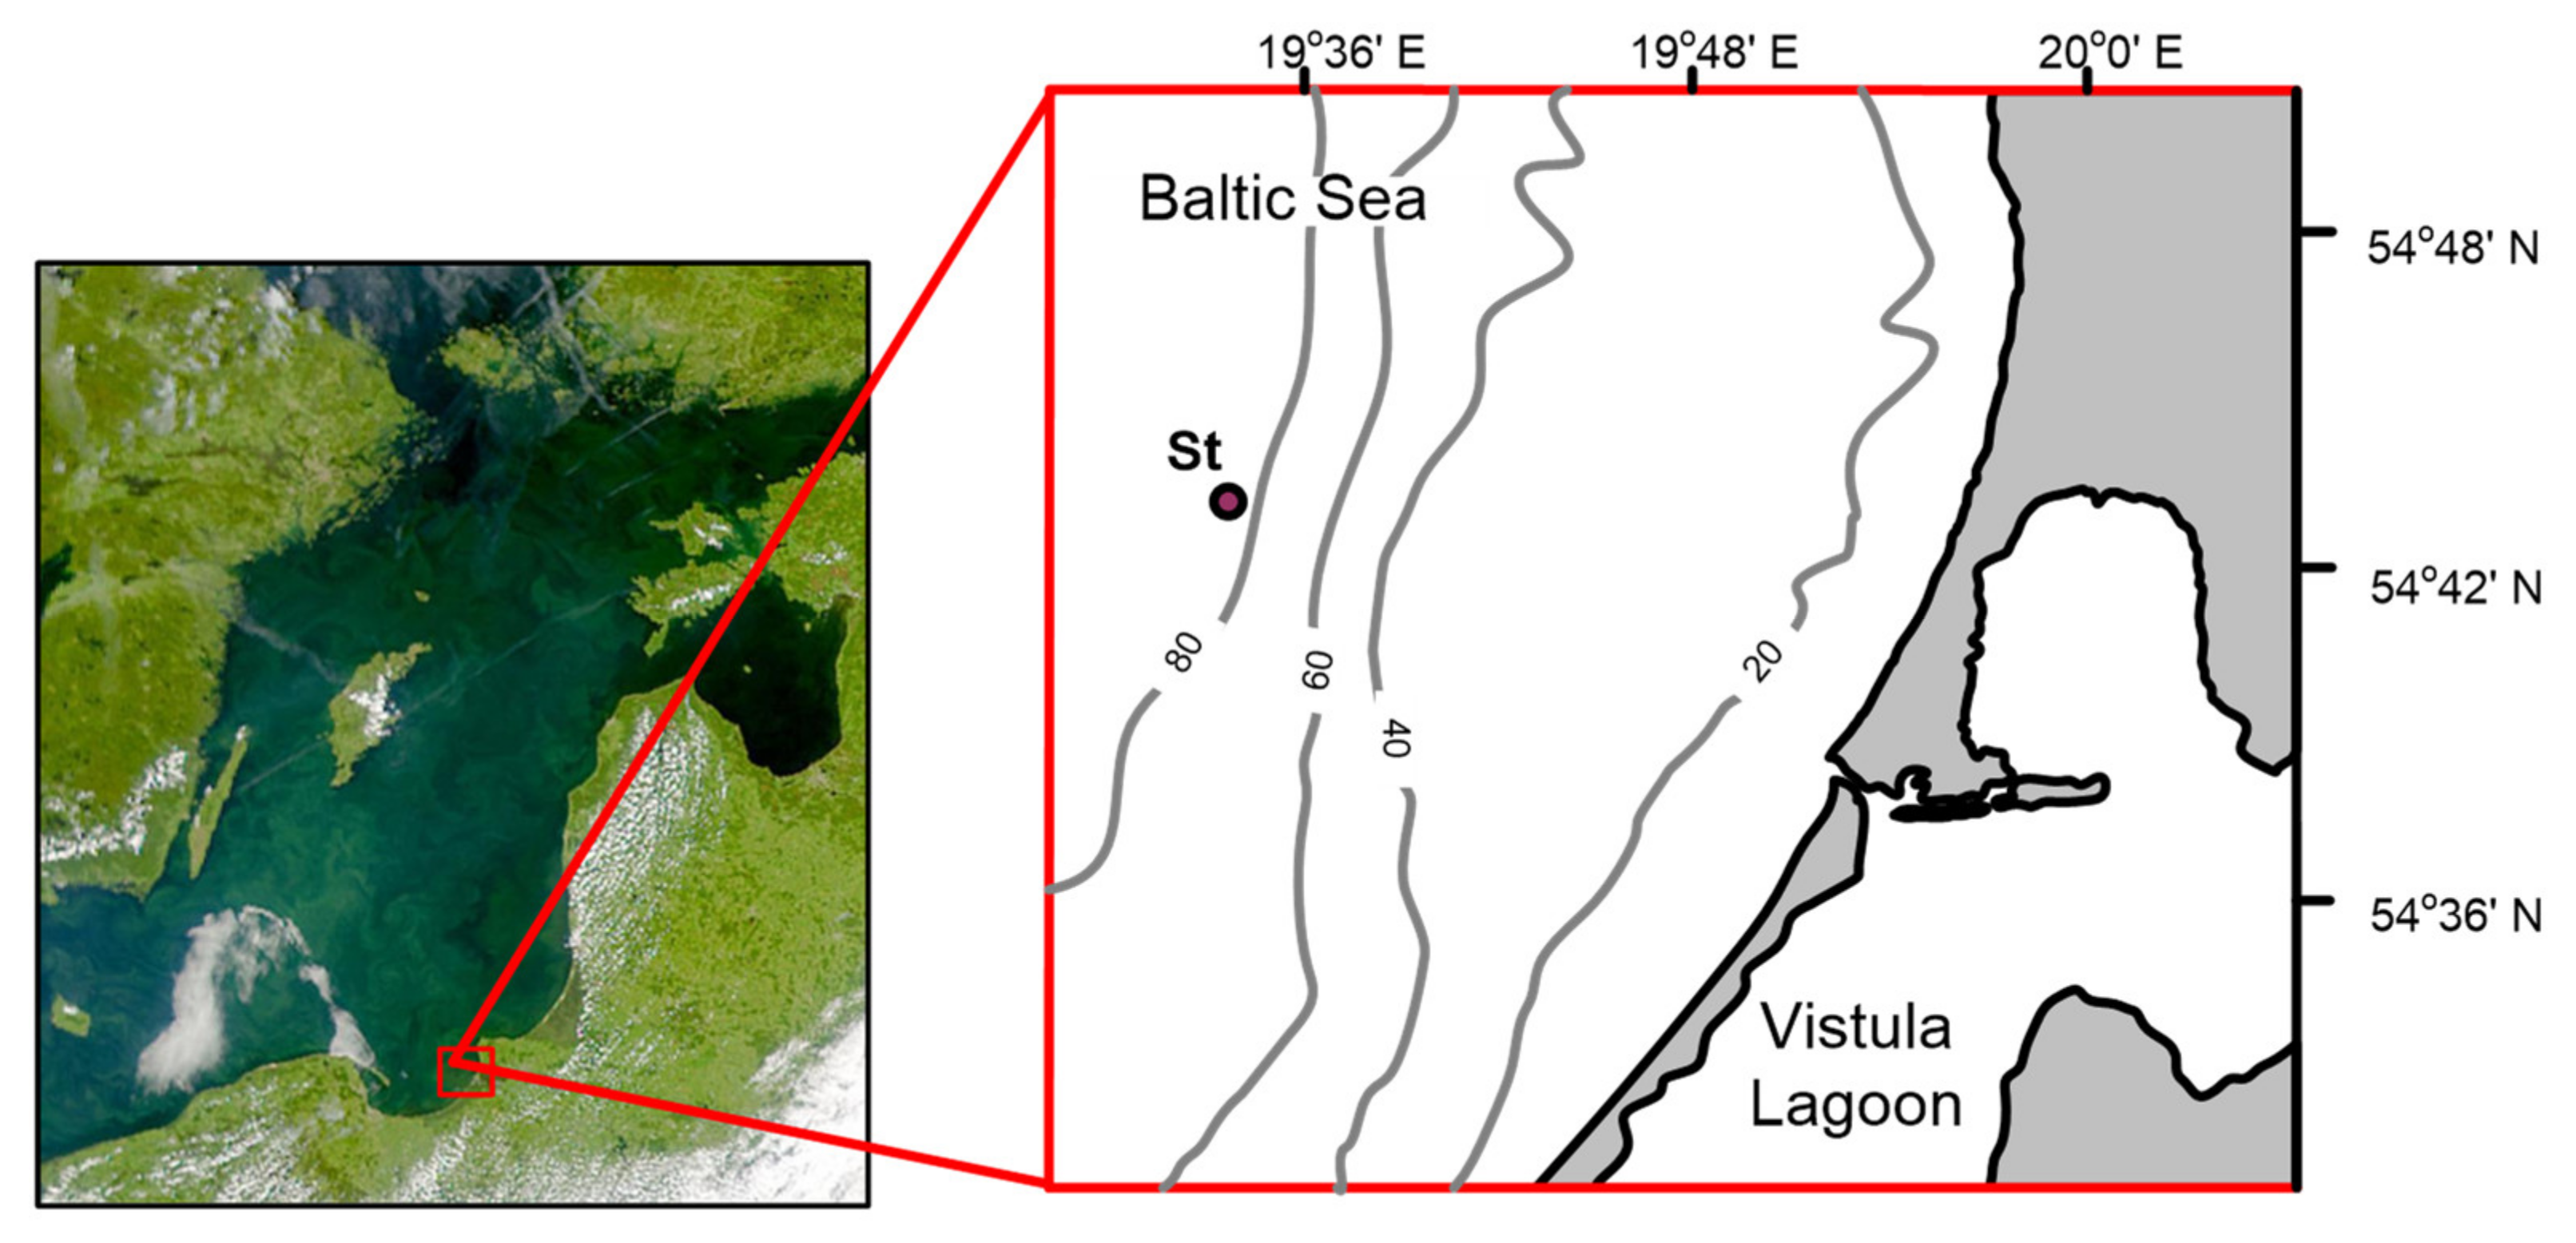
2.1. Research Area and Sampling Procedure
2.2. Measurement of Primary Production, Chlorophyll a and Light
2.3. Measurement of Fluorescence Parameters
2.4. Measurement of Abundance and Biomass of Phytoplankton
2.5. Measurement of Abundance, Biomass and Ration of Zooplankton
2.6. Measurement of Abundance, Biomass and Production of Bacterioplankton
2.7. Statistical Analysis
3. Results
3.1. Research Area Hydrological Peculiarities
3.2. Chlorophyll a and Primary Production
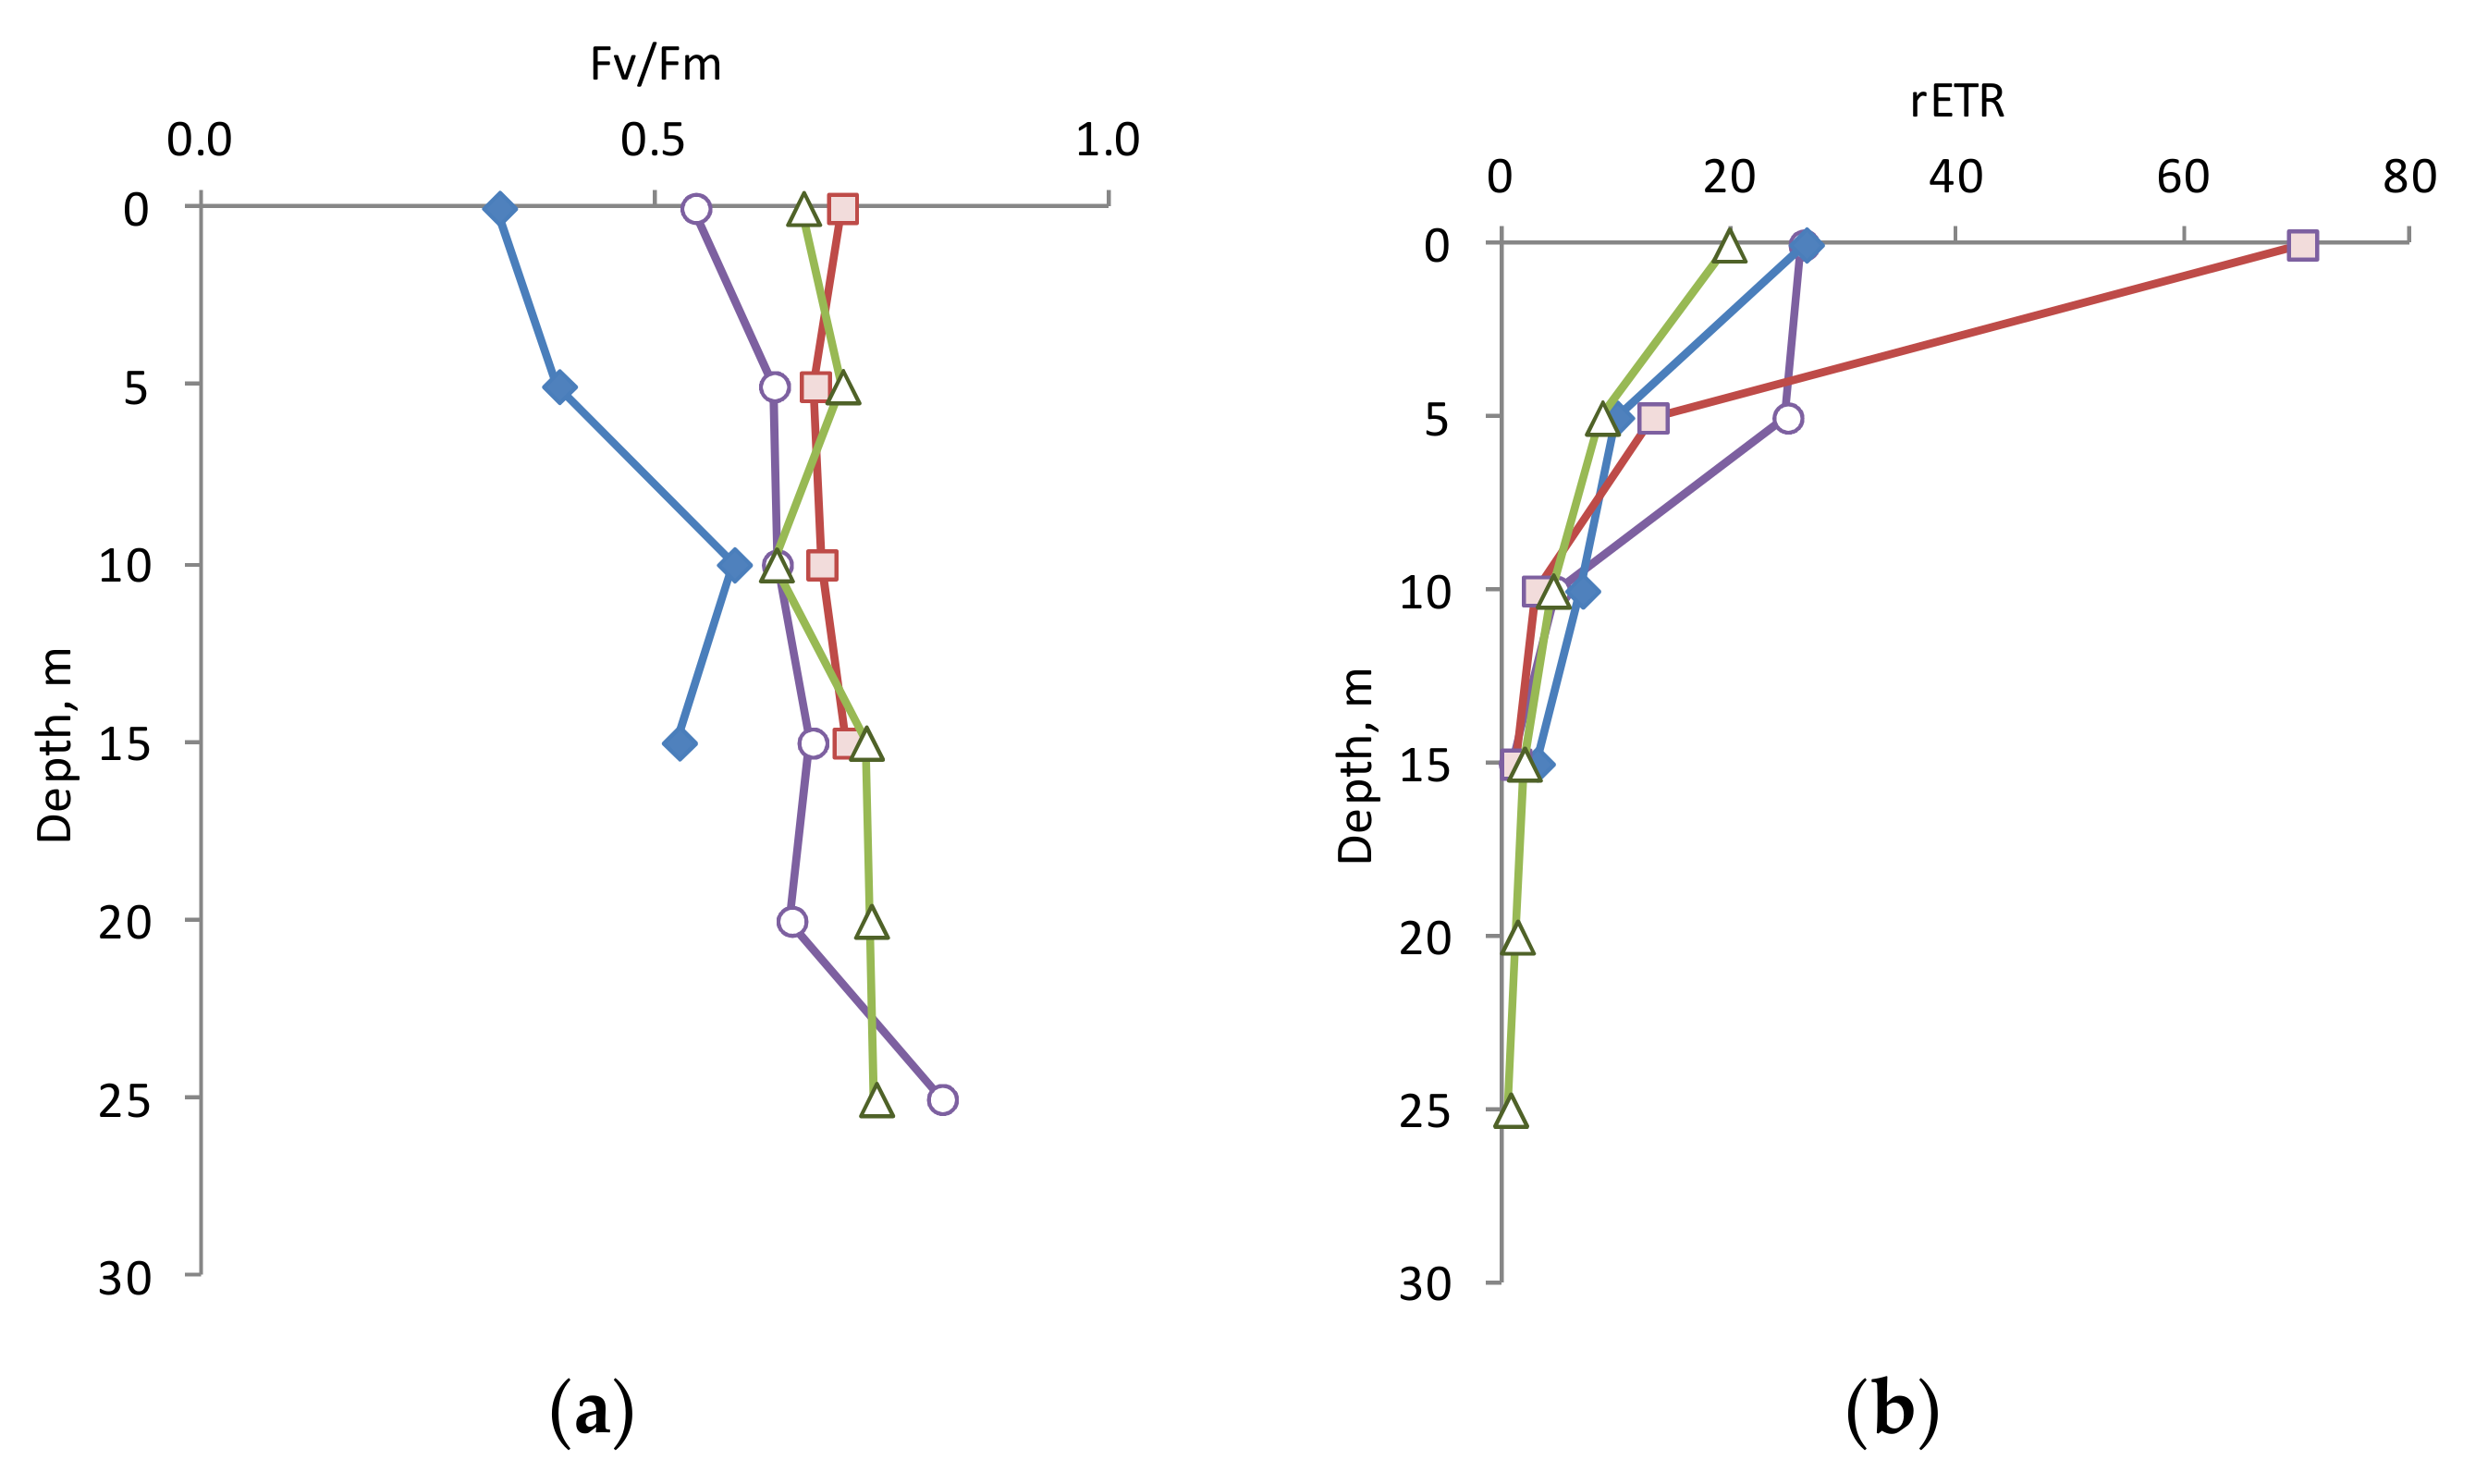
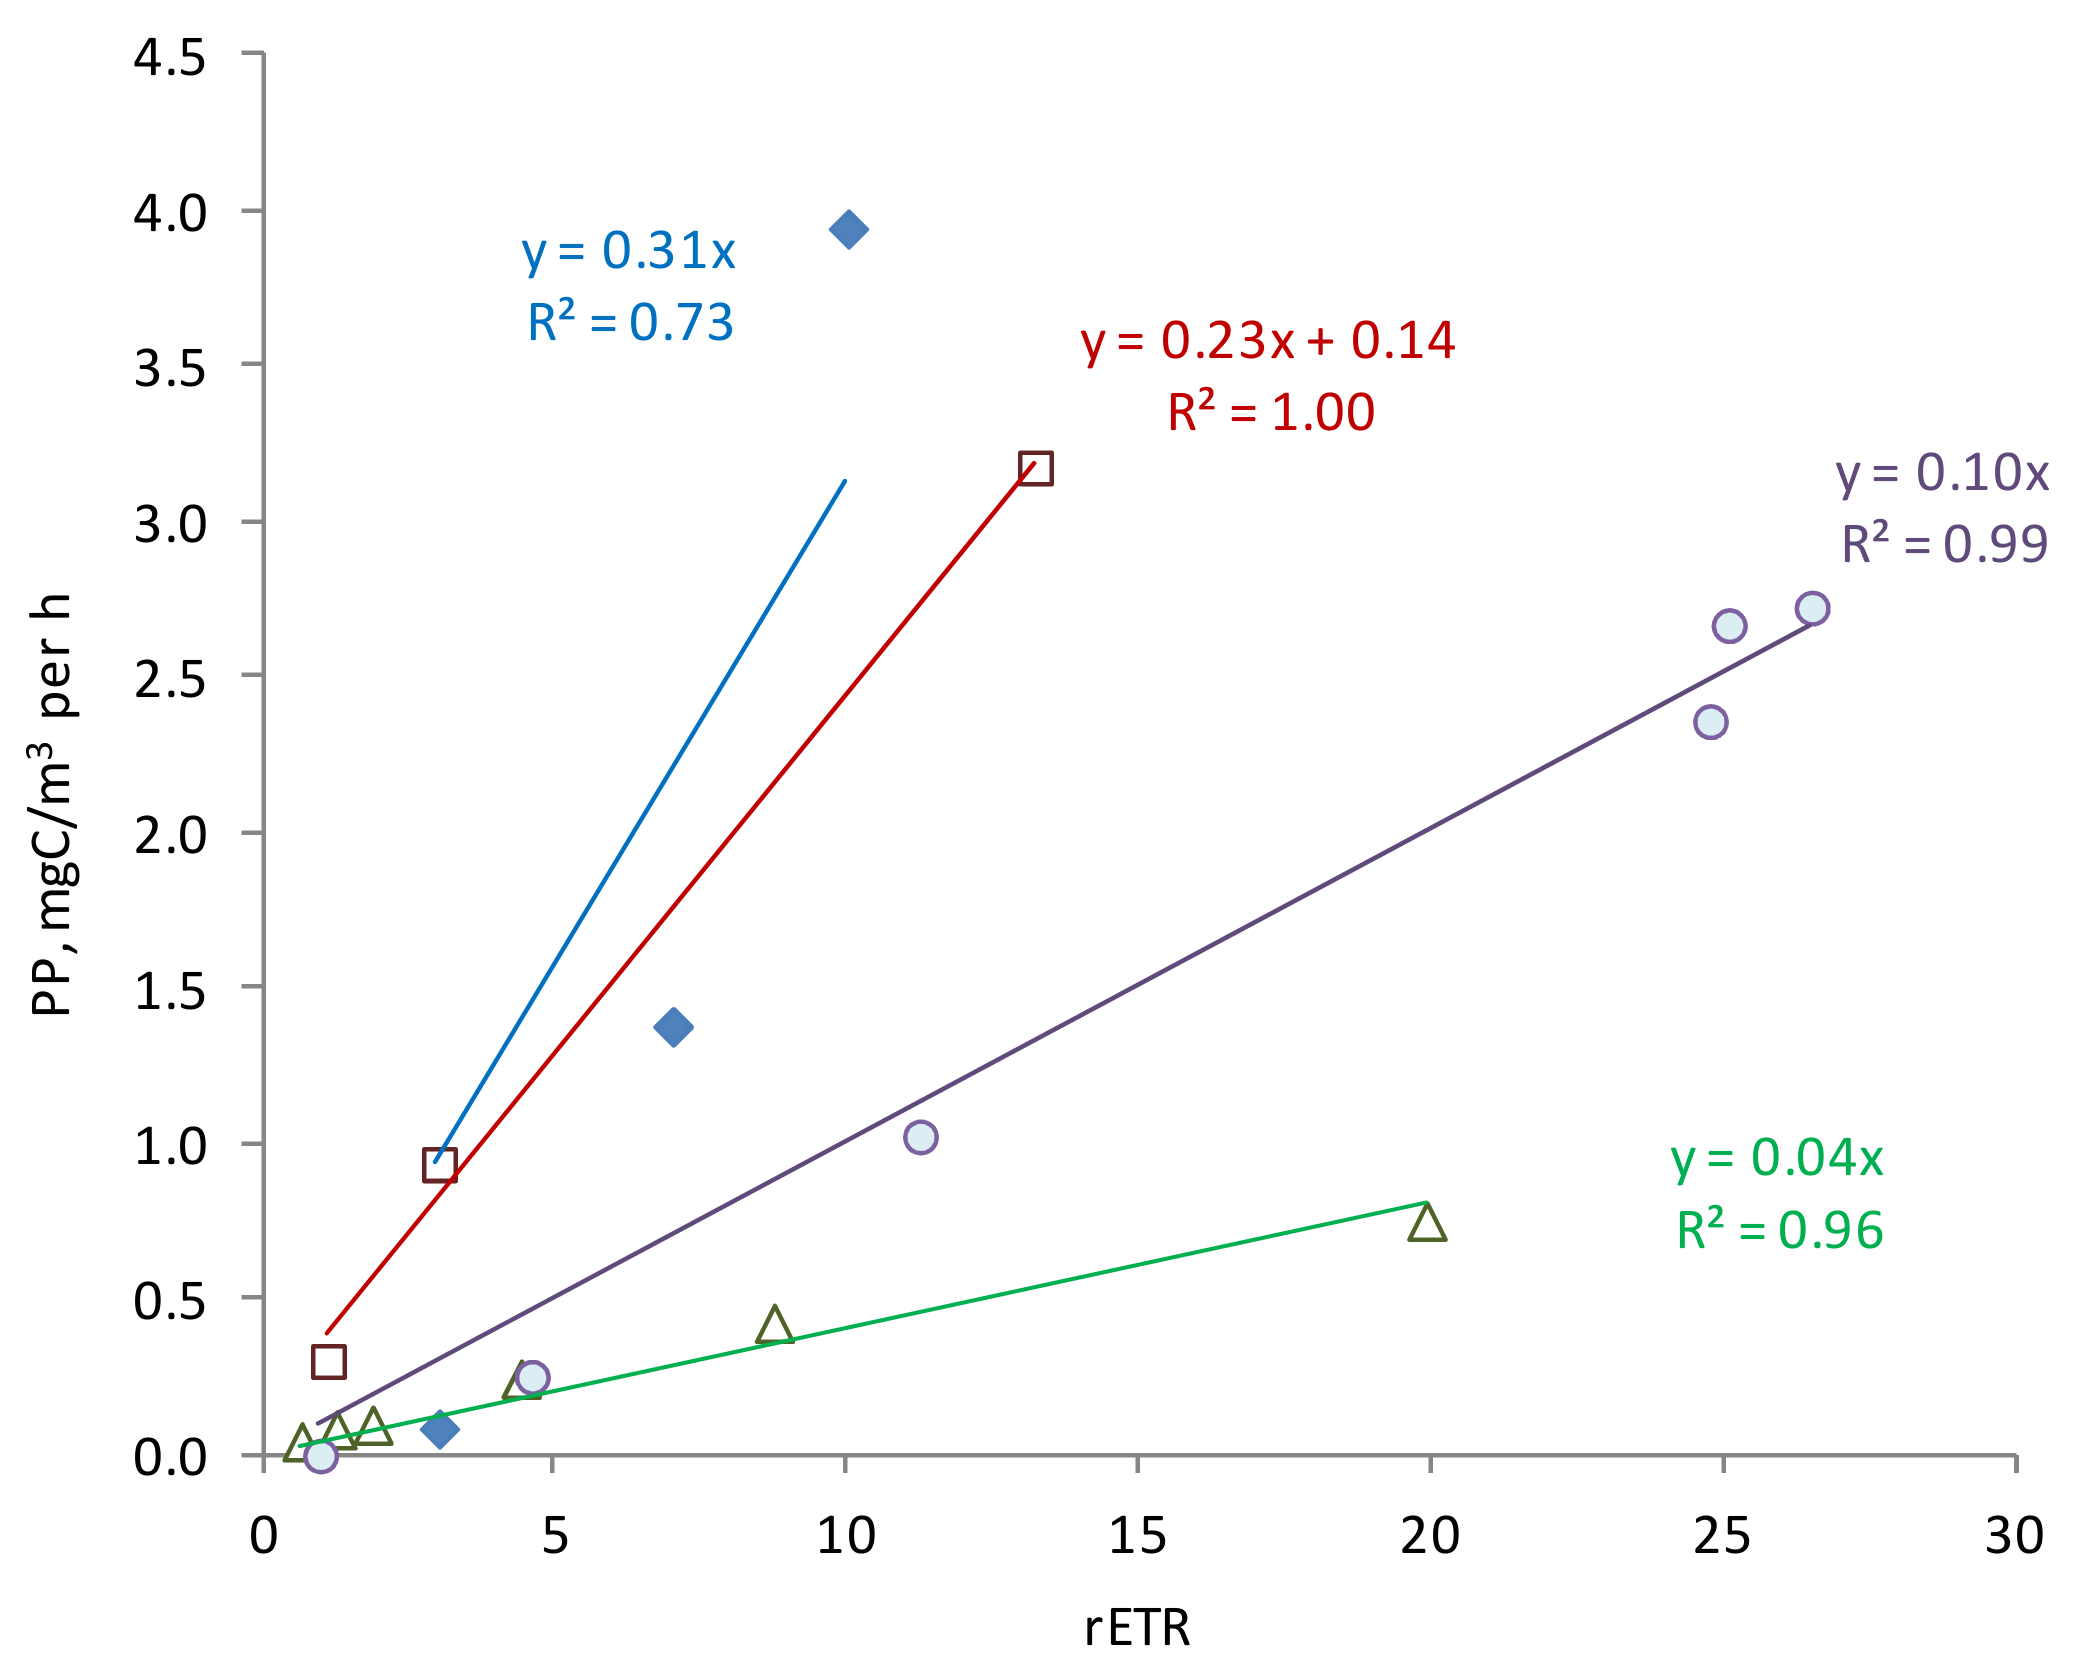
3.3. Photophysiology Parameters
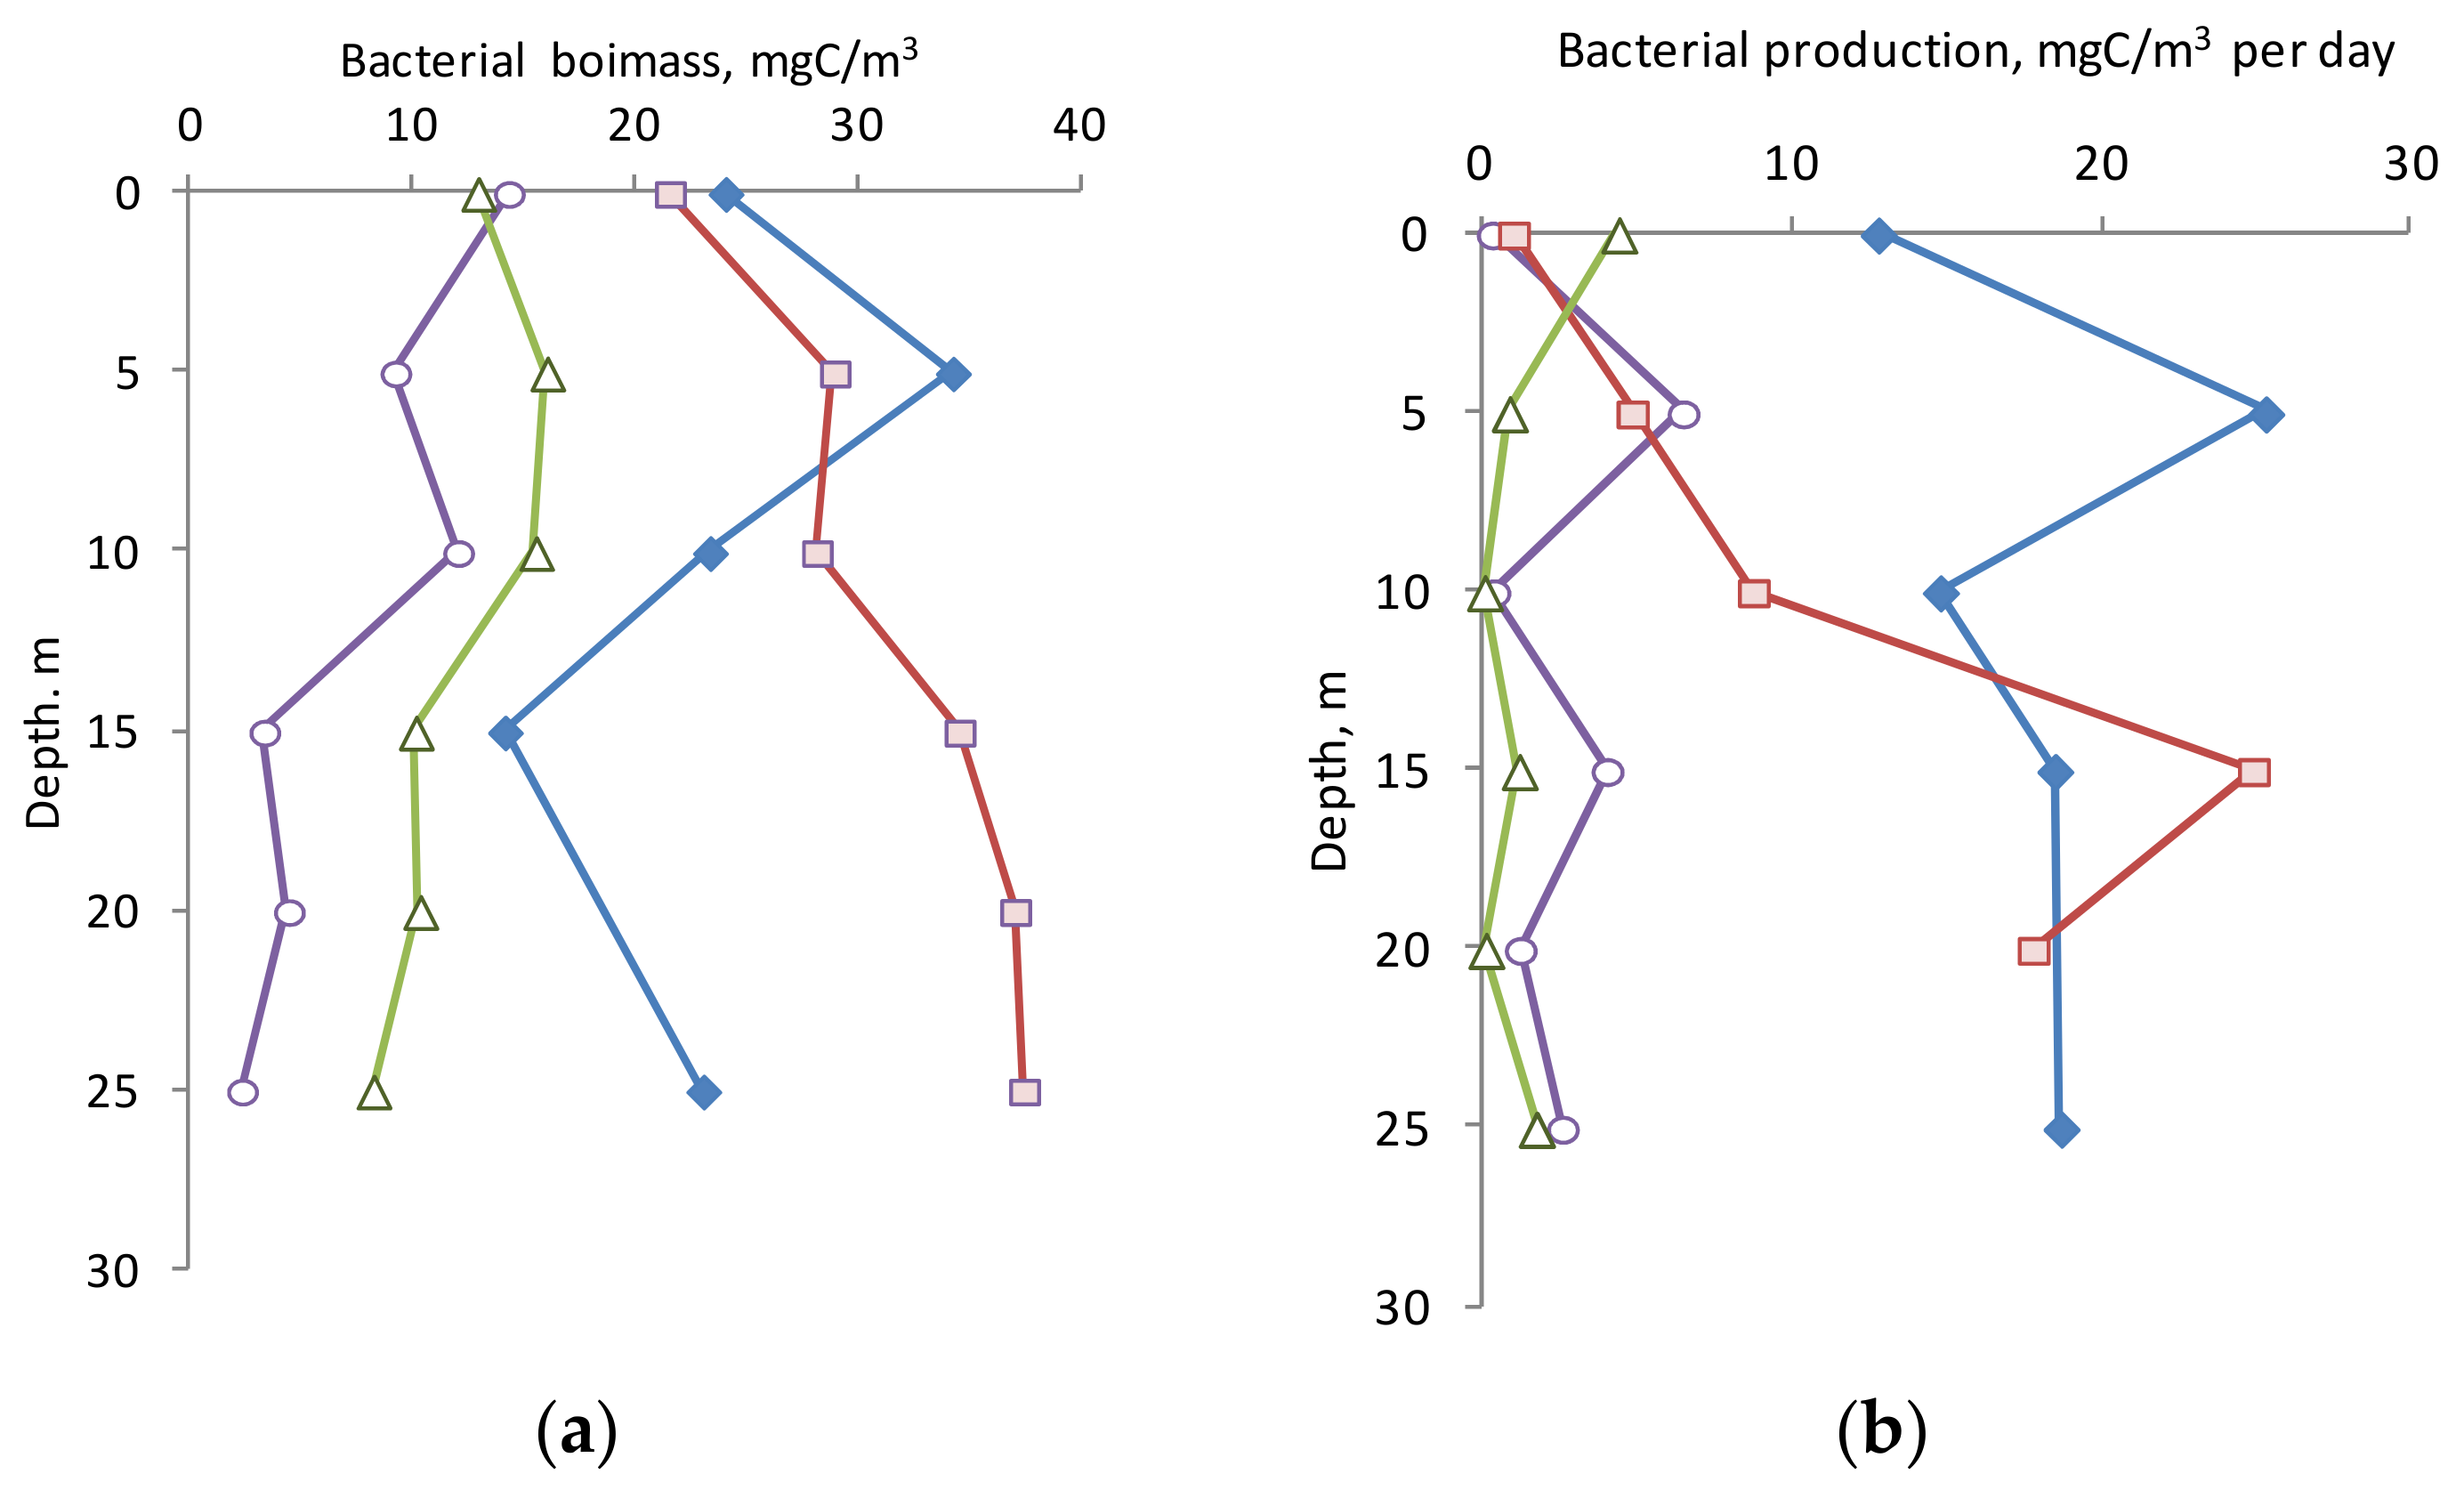
3.4. Biomass and Production of Bacterioplankton
3.5. Biomass of Phytoplankton
3.6. Biomass of Zooplankton
3.7. Depth-Integrated Values
4. Discussion
5. Conclusions
Author Contributions
Funding
Data Availability Statement
Conflicts of Interest
References
- Andersson, A.; Brugel, S.; Paczkowska, J.; Rowe, O.F.; Figueroa, D.; Kratzer, S.; Legrand, C. Influence of allochthonous dissolved organic matter on pelagic basal production in a northerly estuary. Estuar. Coast. Shelf Sci. 2018, 204, 225–235. [Google Scholar] [CrossRef]
- Kudryavtseva, E.; Aleksandrov, S.; Bukanova, T.; Dmitrieva, O.; Rusanov, I. Relationship between seasonal variations of primary production, abiotic factors and phytoplankton composition in the coastal zone of the south-eastern part of the Baltic Sea. Reg. Stud. Mar. Sci. 2019, 32, 100862. [Google Scholar] [CrossRef]
- Kudryavtseva, E.A.; Aleksandrov, S.V. Hydrological and hydrochemical underpinnings of primary production and division of the Russian sector in the Gdansk basin of the Baltic Sea. Oceanology 2019, 59, 49–65. [Google Scholar] [CrossRef]
- Kudryavtseva, E.A.; Aleksandrov, S.V.; Dmitrieva, O.A. Seasonal dynamic of primary production in the coastal zone of the south-eastern Baltic Sea. Oceanographic Res. 2018, 46, 99–115. (In Russian) [Google Scholar] [CrossRef] [Green Version]
- Witek, Z.; Ochocki, S.; Maciejowska, M.; Pastuszak, M.; Nakonieczny, J.; Podgorska, B.; Kownacka, J.M.; Mackiewicz, T.; Wrzesinska-Kwiecien, M. Phytoplankton primary production and its utilization by the pelagic community in the coastal zone of the Gulf of Gdańsk (southern Baltic). Mar. Ecol. Prog. Ser. 1997, 148, 169–186. [Google Scholar] [CrossRef] [Green Version]
- Lavrova, O.Y.; Soloviev, D.M.; Mityagina, M.I.; Strochkova, A.Y.; Bocharova, T.Y. Revealing the influence of various factors on concentration and spatial distribution of suspended matter based on remote sensing data. In Remote Sensing of the Ocean, Sea Ice, Coastal Waters and Large Water Regions; Bostater, C.R., Mertikas, S.P., Neyt, X., Eds.; SPIE: Cardiff, Wales, 2015; Volume 9638, p. 96380D. [Google Scholar]
- Bergen, B.; Naumann, M.; Herlemann, D.P.; Gräwe, U.; Labrenz, M.; Jürgens, K. Impact of a major inflow event on the composition and distribution of bacterioplankton communities in the Baltic Sea. Front. Mar. Sci. 2018, 5, 383. [Google Scholar] [CrossRef] [Green Version]
- Ulyanova, M.O.; Sivkov, V.V.; Bashirova, L.D.; Kapustina, M.V.; Bubnova, E.S.; Danchenkov, A.R.; Ezhova, E.E.; Krechik, V.A.; Eremina, T.R. Oceanological research of the Baltic Sea in the 51st cruise of the PV Akademik Sergey Vavilov (June–July 2021). Oceanology 2022, 62, 578–580. [Google Scholar] [CrossRef]
- Berglund, J.; Müren, U.; Båmstedt, U.; Andersson, A. Efficiency of a phytoplankton and a bacterial-based food web in a pelagic marine system. Limnol. Oceanogr. 2007, 52, 121–131. [Google Scholar] [CrossRef]
- Degerman, R.; Lefebure, R.; Byström, P.; Båmstedt, U.; Larsson, S.; Andersson, A. Food web interactions determine energy transfer efficiency and top consumer responses to inputs of dissolved organic carbon. Hydrobiologia 2018, 805, 131–146. [Google Scholar] [CrossRef] [Green Version]
- Zernova, V.V.; Orlova, Z.P. Features of distribution of phytoplankton in the Baltic sea in early spring of 1990. Oceanology 1996, 36, 698–703. [Google Scholar]
- Zernova, V.V.; Domanov, M.M. Phytoplankton of the open waters of the Baltic and the Gulf of Finland in the summer of 1995 and 1996. Dokl. Biol. Sci. 1999, 365, 715–717. [Google Scholar]
- Zernova, V.V. Seasonal changes in the phytoplankton of the Baltic Sea. In Sedimentation in the Baltic Sea; Nauka: Moscow, Russia, 1981; pp. 42–61. (In Russian) [Google Scholar]
- Zernova, V.V. Autumn Baltic phytoplankton. Oceanology 1997, 37, 215–222. [Google Scholar]
- Gasiunaite, Z.R.; Cardoso, A.C.; Heiskanen, A.S.; Henriksen, P.; Kauppila, P.; Olenina, I.; Pilkaityte, R.; Purina, I.; Razinkovas, A.; Sagert, S.; et al. Seasonality of coastal phytoplankton in the Baltic Sea: Influence of salinity and eutrophication. Estuar. Coast. Shelf Sci. 2005, 65, 239–252. [Google Scholar] [CrossRef]
- Sigman, M.; Hain, M.P.; Haug, G.H. The polar ocean and glacial cycles in atmospheric CO2 concentration. Nature 2010, 466, 47–55. [Google Scholar] [CrossRef] [PubMed]
- Tripathy, S.C.; Pavithran, S.; Sabu, P.; Pillai, H.U.K.; Dessai, D.R.G.; Anilkumar, N. Deep chlorophyll maximum and primary productivity in Indian Ocean sector of the Southern Ocean: Case study in the Subtropical and Polar Front during austral summer 2011. Deep-Sea Res. II 2015, 118, 240–249. [Google Scholar] [CrossRef]
- Kahler, P.; Oschlies, A.; Dietze, H.; Koeve, W. Oxygen, carbon, and nutrients in the oligotrophic eastern subtropical North Atlantic. Biogeosciences 2010, 7, 1143–1156. [Google Scholar] [CrossRef] [Green Version]
- Laws, E.A.; Maiti, K. The relationship between primary production and export production in the ocean: Effects of time lags and temporal variability. Deep-Sea Res. I 2019, 148, 100–107. [Google Scholar] [CrossRef]
- Rixen, T.; Guptha, M.V.S.; Ittekkot, V. Deep ocean fluxes and their link to surface ocean processes and the biological pump. Prog. Oceanogr. 2005, 65, 240–259. [Google Scholar] [CrossRef]
- Steemann-Nielsen, E. The use of radio-active carbon (C14) for measuring organic production in the sea. J. Cons./Cons. Perm. Int. Pour L’exploration 1952, 18, 117–140. [Google Scholar] [CrossRef]
- UNESCO. Protocols for the Joint Global Ocean Flux Study (JGOFS) Core Measurements; IOC Manuals and Guides, No. 29; UNESCO: Paris, France, 1994; Available online: https://epic.awi.de/id/eprint/17559/1/Kna1996a.pdf (accessed on 20 November 2022).
- Holm-Hansen, O.; Riemann, B. Chlorophyll a determination: Improvements in methodology. Oikos 1978, 30, 438–447. [Google Scholar] [CrossRef]
- Schreiber, U.; Bilger, W.; Neubauer, C. Chlorophyll fluorescence as a non intrusive indicator for rapid assessment of in vivo photosynthesis. In Ecophysiology of Photosynthesis; Schulze, E., Caldwell, M., Eds.; Springer: Berlin/Heidelberg, Germany, 1994; pp. 49–70. [Google Scholar] [CrossRef]
- Krause, G.H.; Weis, E. Chlorophyll fluorescence and photosynthesis: The basics. Annu. Rev. Plant Physiol. Plant Mol. Biol. 1991, 42, 313–341. [Google Scholar] [CrossRef]
- Juneau, P.; Harrison, P.J. Comparison by PAM fluorometry of photosynthetic activity of nine marine phytoplankton grown under identical conditions. Photochem. Photobiol. 2005, 81, 649–653. [Google Scholar] [CrossRef] [PubMed]
- Suggett, D.J.; Moore, C.M.; Hickman, A.E.; Geide, R.J. Interpretation of fast repetition rate (FRR) fluorescence: Signatures of phytoplankton community structure versus physiological state. Mar. Ecol. Prog. Ser. 2009, 376, 1–19. [Google Scholar] [CrossRef] [Green Version]
- Lippemeier, S.; Harting, P.; Colijn, F. Direct impact of silicate on the photosynthetic performance of the diatom Thalassiosira weissflogii assessed by on- and offline PAM fluorescence measurements. J. Plankton Res. 1999, 21, 269–283. [Google Scholar] [CrossRef] [Green Version]
- Schreiber, U. Pulse amplitude (PAM) fluorometry and saturation pulse method: An overview. In Chlorophyll a Fluorescence: A Signature of Photosynthesis. Advances in Photosynthesis and Respiration Series; Papageorgiou, G., Govindjee, G., Eds.; Kluwer Academic Publishers: Dordrecht, The Netherlands, 2004; pp. 270–319. [Google Scholar] [CrossRef]
- Genty, B.; Briantais, J.-M.; Baker, N.R. The relationship between the quantum yield of photosynthetic electron transport and quenching of chlorophyll fluorescence. Biochim. Biophys. Acta 1989, 990, 87–92. [Google Scholar] [CrossRef]
- Lavrent’eva, G.M.; Bulyon, V.V. Guidelines for the collection and processing of materials for hydrobiological studies in freshwater reservoirs. In Phytoplankton and Its Products; Zoological Institute: Leningrad, Russia, 1981. (In Russian) [Google Scholar]
- Tikkanen, T. Kasviplanktonopas; Suomen luonnonsujelum Tuki Oy: Helsinki, Finland, 1986; 278p. [Google Scholar]
- Guiry, M.D.; Guiry, G.M. AlgaeBase. World-Wide Electronic Publication; National University of Ireland: Galway, Ireland, 2020; Available online: http://www.algaebase.org (accessed on 10 November 2022).
- Gutelmaher, B.L. Metabolism of plankton as a whole. In Trophometabolic Interactions of Zoo- and Phytoplankton; Nauka: Leningrad, Russia, 1986; 154p. (In Russian) [Google Scholar]
- Hernroth, L. Recommendations on methods for marine biological studies in the Baltic Sea. Mesozooplankton biomass assessment. Baltic Mar. Biol. 1985, 10, 1–32. [Google Scholar]
- ICES. Zooplankton Methodology Manual; Harris, R.P., Wiebe, P.H., Lenz, J., Skjoldal, H.R., Huntley, M., Eds.; Academic Press: San Diego, CA, USA; San Francisco, CA, USA; New York, NY, USA; Boston, MA, USA; London, UK; Sydney, Australia; Tokyo, Japan, 2000; 684p. [Google Scholar]
- Marine Planktonic Copepods. Diversity and Geographic Distribution. Biodiversity of Marine Planktonic Copepods. Available online: http://copepodes.obs-banyuls.fr/en/ (accessed on 15 November 2022).
- Telesh, I.; Skarlato, S.; Kube, S.; Rohde, H.; Schubert, H. Zooplankton of the Baltic Sea: Introduction to the Distant Learning Module; Universität Rostock Rostock: St. Petersburg, Russia, 2015; 124p. [Google Scholar]
- Pertsova, N.M. Average weights and sizes of common species of zooplankton in the White Sea. Oceanology 1967, 7, 309–313. (In Russian) [Google Scholar]
- Chislenko, L.L. Nomograms for Determining the Weight of Aquatic Organisms by Body Size and Shape; Nauka: Leningrad, Russia, 1968. [Google Scholar]
- Fenaux, R. Cycle vital, croissance et production chez Fritillaria pellucida (Appendicularia), dans la baie de Villefranchesur-Mer, France. Mar. Biol. 1976, 34, 229–238. [Google Scholar] [CrossRef]
- Walve, J.; Larsson, U. Carbon, nitrogen and phosphorus stoichiometry of crustacean zooplankton in the Baltic Sea: Implications for nutrient recycling. J. Plankton Res. 1999, 21, 2309–2321. [Google Scholar] [CrossRef]
- Suschenya, L.M. Quantitative Characteristics of Feeding of Crustaceans; Science and Technology Publ.: Minsk, Russia, 1975. (In Russian) [Google Scholar]
- Suschenya, L.M. Respiration Rate of Crustaceans; Naukova Dumka Publ.: Kiev, Russia, 1972; 195p. (In Russian) [Google Scholar]
- Porter, K.G.; Feig, Y.S. The use DAPI for identifying and counting of aquatic microflora. Limnol. Oceanogr. 1980, 25, 943–948. [Google Scholar] [CrossRef]
- Posch, T.; Loferer-Krößbacher, M.; Gao, G.; Alfreider, A.; Pernthaler, J.; Psenner, R. Precision of bacterioplankton biomass determination: A comparison of two fluorescent dyes, and of allometric and linear volume-to carbon conversion factors. Aquat. Microb. Ecol. 2001, 25, 55–63. [Google Scholar] [CrossRef]
- Norland, S. The relationship between biomass and volume of bacteria. In Handbook of Methods in Aquatic Microbial Ecology; Kemp, P.F., Cole, J.J., Sherr, B.F., Sherr, E.B., Eds.; Lewis Publ.: Boca Raton, FL, USA, 1993; pp. 303–308. [Google Scholar]
- Ducklow, H.W.; Hill, S.M. The growth of heterotrophic bacteria in the surface waters of warm core rings. Limnol. Oceanogr. 1985, 30, 239–259. [Google Scholar] [CrossRef]
- Meon, B.; Amon, R.M.W. Heterotrophic bacterial activity and fluxes of dissolved free amino and glucose in the Arctic rivers Ob, Yenisei and the adjacent Kara Sea. Aquat. Microb. Ecol. 2004, 37, 121–135. [Google Scholar] [CrossRef]
- Zernova, V.V. On the vertical distribution of planktonic algae in the Baltic Sea in autumn. Oceanology 1979, 9, 1103–1109. [Google Scholar]
- Piontek, J.; Endres, S.; Le Moigne, F.A.C.; Schartau, M.; Engel, A. Relevance of nutrient-limited phytoplankton production and its bacterial remineralization for carbon and oxygen fluxes in the Baltic Sea. Front. Mar. Sci. 2019, 6, 581. [Google Scholar] [CrossRef] [Green Version]
- Kudryavtseva, E.A.; Savvichev, A.S.; Kanapatskii, T.A.; Pimenov, N.V.; Aleksandrov, S.V. Bacterioplankton of the Gdansk basin, Baltic Sea. Microbiology 2012, 81, 348–359. [Google Scholar] [CrossRef]
- Röttgers, R. Comparison of different variable chlorophyll a fluorescence techniques to determine photosynthetic parameters of natural phytoplankton. Deep-Sea Res. I 2007, 54, 437–451. [Google Scholar] [CrossRef] [Green Version]
- Russo, A.D.P.G.; de Souza, M.S.; Mendes, C.R.B.; Tavano, V.M.; Garcia, C.A.E. Spatial variability of photophysiology and primary production rates of the phytoplankton communities across the western Antarctic Peninsula in late summer 2013. Deep-Sea Res. II 2018, 149, 99–110. [Google Scholar] [CrossRef]
- Mosharov, S.A.; Sergeeva, V.M.; Kremenetskiy, V.V.; Sazhin, A.F.; Stepanova, S.V. Assessment of phytoplankton photosynthetic efficiency based on measurement of fluorescence parameters and radiocarbon uptake in the Kara Sea. Estuar. Coast. Shelf Sci. 2019, 218, 59–69. [Google Scholar] [CrossRef]
- Kromkamp, J.C.; Dijkman, N.A.; Peene, J.; Simis, S.G.H.; Gons, H.J. Estimating phytoplankton primary production in Lake IJsselmeer (The Netherlands) using variable fluorescence (PAM-FRRF) and C uptake techniques. Eur. J. Phycol. 2008, 43, 327–344. [Google Scholar] [CrossRef]
- Suggett, D.J.; MacIntyre, H.L.; Kana, T.M.; Geider, R.J. Comparing electron transport with gas exchange: Parameterising exchange rates between alternative photosynthetic currencies for eukaryotic phytoplankton. Aquat. Microb. Ecol. 2009, 56, 147–162. [Google Scholar] [CrossRef] [Green Version]
- Lawrenz, E.; Silsbe, G.; Capuzzo, E.; Ylöstalo, P.; Forster, R.M.; Simis, S.G.H.; Prášil, O.; Kromkamp, J.C.; Hickman, A.E.; Moore, C.M.; et al. Predicting the electron requirement for carbon fixation in seas and oceans. PLoS ONE 2013, 8, e58137. [Google Scholar] [CrossRef] [PubMed]


| Parameter | April | June | October | November |
|---|---|---|---|---|
| Chl a | 28.5 | 79.5 | 89.9 | 46.7 |
| PhB | 1310 | 1615 | 2589 | 2921 |
| ZB | 339 | 1719 | 243 | 120 |
| BB | 150 | 383 | 425 | 312 |
| PP | 257 | 375 | 633 | 75.4 |
| BP | 45.5 | 279 | 133 | 27.3 |
| TP | 302 | 654 | 766 | 102 |
| PP/TP | 85% | 57% | 82% | 73% |
Publisher’s Note: MDPI stays neutral with regard to jurisdictional claims in published maps and institutional affiliations. |
© 2022 by the authors. Licensee MDPI, Basel, Switzerland. This article is an open access article distributed under the terms and conditions of the Creative Commons Attribution (CC BY) license (https://creativecommons.org/licenses/by/4.0/).
Share and Cite
Mosharov, S.A.; Mosharova, I.V.; Dmitrieva, O.A.; Semenova, A.S.; Ulyanova, M.O. Seasonal Variability of Plankton Production Parameters as the Basis for the Formation of Organic Matter Flow in the Southeastern Part of the Baltic Sea. Water 2022, 14, 4099. https://doi.org/10.3390/w14244099
Mosharov SA, Mosharova IV, Dmitrieva OA, Semenova AS, Ulyanova MO. Seasonal Variability of Plankton Production Parameters as the Basis for the Formation of Organic Matter Flow in the Southeastern Part of the Baltic Sea. Water. 2022; 14(24):4099. https://doi.org/10.3390/w14244099
Chicago/Turabian StyleMosharov, Sergey A., Irina V. Mosharova, Olga A. Dmitrieva, Anna S. Semenova, and Marina O. Ulyanova. 2022. "Seasonal Variability of Plankton Production Parameters as the Basis for the Formation of Organic Matter Flow in the Southeastern Part of the Baltic Sea" Water 14, no. 24: 4099. https://doi.org/10.3390/w14244099
APA StyleMosharov, S. A., Mosharova, I. V., Dmitrieva, O. A., Semenova, A. S., & Ulyanova, M. O. (2022). Seasonal Variability of Plankton Production Parameters as the Basis for the Formation of Organic Matter Flow in the Southeastern Part of the Baltic Sea. Water, 14(24), 4099. https://doi.org/10.3390/w14244099


