1. Introduction
The coronavirus disease is caused by the novel pathogen SARS-CoV2. The outbreak of the disease began in 2019 in Wuhan, China, and by the mid-summer of 2020, human interactions and human contact soon led to its spread globally [
1]. The World Health Organization (WHO) declared the disease a pandemic after it had spread to 114 countries across the world in under three months [
2,
3]. By the mid of January 2022, the virus had infected over 300 million people worldwide [
4]. The COVID-19 pandemic brought out the importance of pure water and hygienic facilities to safeguard the health of humans. The pandemic also drew attention to water insecurities in households around the world [
5,
6].
The COVID-19 pandemic led to substantial changes in professions and lifestyles across the world as countries enforced minimum travel and socialization [
7,
8]. Most governments initiated “stay-at-home” orders necessitating businesses not categorized as “important” to limit socialization. Company staff started working from home instead of in offices. Increased unemployment, changes in transportation patterns, and decreased economic activities led to drastic socioeconomic variations [
9]. These disturbances in patterns of life and work had a crucial impact on where and how water was consumed during the pandemic [
10].
The global community was forced to improve behavioral practices [
11,
12], such as washing hands with soap and water to enhance hygiene [
13]. Sustainable Development Goals (SDGs) 3 and 6 aim to ensure good health, pure water, and proper sanitation. Proper handwashing is addressed in these goals to achieve good health [
14]. In order to prevent the spread of COVID-19, the WHO suggested frequent handwashing with soap and water [
15]. However, effective handwashing requires easy access to water [
16], which is challenging for people in developing countries living in rural districts and areas far from cities [
17,
18]. They face water scarcity due to high demand and limited supply [
19]. Since water supply is crucial, especially amid the pandemic, for people to maintain hygiene [
20], high water demand can lead to inadequate water distribution [
21]. Therefore, it can be very challenging to run a household without access to a clean and adequate water supply [
22].
Access to hygiene infrastructure and clean water decreases the possibility of transmission of COVID-19 by facilitating periodic washing of hands and by decreasing contact with viruses [
23,
24]. However, about 75% of low- and middle-income households do not have proper facilities for handwashing with soap and water [
25], and over half the world’s population lack adequate sanitation [
25]. Studies have recently linked SARS-CoV-2 with the dismal census on household water stress in low-income and middle-income nations, especially in regions with a high population in urban slums [
26,
27,
28,
29,
30].
However, household water insecurity is not confined to developing countries. Highly developed countries such as the United States are also affected by household water insecurity [
6,
31,
32]. The aggregate and general demand peaks of water usage were the focus of research studies and investigations on the effect of COVID-19 on water usage. For example, a notable change was observed in the total demand peak in Germany from 7:10 am (before lockdown) to 9:40 am (over lockdown), changing to weekend patterns [
33]. Lüdtke et al. [
34] reported about a 14% increase in daily water consumption in northern Germany. According to Marshallsay [
35], a 35% increase was observed in the peak daily use in certain areas of the United Kingdom during the lockdown. Investigation data from Brazil revealed that an 11% increase in domestic water usage was observed between 26 days before the lockdown and 26 days during the lockdown [
20]. Similarly, Kim et al. [
36] highlighted a higher usage of domestic hot water during the COVID-19 lockdown. Although this rise in water consumption is attributed to people staying at home, an increase in preventative measures such as handwashing also contributed to the rise of household water consumption [
37]. The increased time people spent at their homes and the consequent changes in behaviors impacted the demand for water in households aggravating ongoing pressure on the network supplying water.
Countries are now faced with the challenge of assuring adequate and clean water supply in the ongoing COVID-19 pandemic [
24]. Behavioral changes that can reduce the impact of the pandemic provide can be a source of information to achieve sustainable water supply and production [
38,
39]. Understanding how measures to control the spread of COVID-19 can affect water usage provides well-grounded facts and data for legislatures to frame policy decisions that can overcome the challenges of water supply in emergencies.
The first case of COVID-19 disease in the Kingdom of Saudi Arabia was reported on 2 March 2020, in the Qatif region, which is in the eastern part of Saudi Arabia. By April 2021, 396,758 confirmed cases were identified, of which 6728 was the number of deaths [
40,
41]. By the end of March 2020, a complete lockdown was imposed to prevent the spread of the virus. Travel between the different regions of the country was restricted to control the spread of the disease as the main mode of transmission was through droplets from those infected by the virus. Besides the elementary measures of travel restriction by the government of Saudi Arabia, including the ban on travel from one city to another, the Ministry of Health also imposed strict laws to limit outdoor activities, suspending schools, banning prayers in mosques, and minimizing social interactions. The same was imposed in 140 countries across the world to avoid the spread of disease [
42,
43].
In developing countries such as Saudi Arabia, there is limited research on predictors of variations in water usage under crises such as the COVID-19 pandemic. Countries in the Middle East are already water-scarce regions (<500 m
3/capita year1) [
44], with Saudi Arabia having a potable groundwater supply of ~30% and a desalinized water supply of ~70%. It is predicted that within 50 years, the groundwater source might be completely depleted. Therefore, there is a great challenge of water provision in Saudi Arabia, and water is rapidly becoming a scarce asset in the nation [
45].
This study addresses two main questions: How does water usage vary under the conditions of the COVID-19 pandemic (before and after March 2020)? What characteristics of household-related water usage have increased or decreased under the circumstances of the COVID-19 pandemic (before and after March 2020)? Thus, the main objective of this study is to evaluate how urban water consumption is affected by the spread-prevention action for COVID-19. Understanding the socioeconomic and demographic predictors of variation in household water usage can be used to inform effectual prediction and design interventions for a fair supply of water during times of crisis, such as the COVID-19 pandemic. Investigating the elements that lead to changes in water use during emergency circumstances is important to formulate and execute appropriate policies and interventions for reducing inequality in water distribution during emergencies.
2. Materials and Methods
2.1. Study Area/Setting
Dammam Metropolitan Area (DMA), comprising three major cities, Dammam, Khobar, and Dhahran, is considered a case study in this research (
Figure 1). Dammam is the capital of Saudi Arabia’s Eastern Province. It is around 400 km from Riyadh on the Arabian Gulf coast. In 2014, DMA had a population of around 1.66 million, the third-highest in Saudi Arabia [
46]. As a global hub for petrochemical refining activities, DMA is a rapidly growing economic center because it influences the global oil market [
47]. From a small fishing town in the 1950s, it grew to about 1050 km
2 by 2017 [
48]. As one of the seven largest cities of the country, it now accommodates around half the country’s population [
49]. Water shortages, high water consumption, and poor management are some of the problems in Saudi cities, and the municipality is making all efforts to expand its industrial base for economic growth [
50]. Water usage is an important aspect of the city owing to the dry and hot climate. MOMRA [
48] highlighted the pressure of water scarcity in Dammam despite sourcing water from desalination plants, which leads to an increase in greenhouse gas emissions.
2.2. Data Collection and Analysis
In this study, two approaches were adopted for data collection to understand the changes in household behavior and water consumption. The first approach involved the administration of questionnaires to residents in the three major cities of DMA. The second approach entailed semi-structured interviews with the officials and policymakers of the water department of DMA. The survey was conducted to investigate the effect of COVID-19 on water usage in DMA households. The questionnaire consisted of four sections: (i) demographic information (residential location, marital status, number of family members, gender, age, nationality), (ii) socioeconomic information (education, employment, household type, income, housing tenure), (iii) water consumption information (working type during the pandemic, change in household water consumption, water bill, type of increase), and (iv) water usage behaviors. Most of the questions in the questionnaire were to be responded on a 5-point Likert scale (strongly agree, agree, neutral, disagree, and strongly disagree), and the remaining included ranking responses, yes/no questions, or neutral options. The questions were in English with Arabic translation included. The questionnaire was pilot tested among the colleagues of the researchers before mailing them to the participants. The feedback from the pilot survey was used to revise and improve the questions.
A cross-sectional survey was applied using QuestionPro (
www.questionpro.com, accessed on 1 February 2021) between February and May 2021. This method was preferred since online surveys are quicker, more economical, and anonymous [
51]. Snowball sampling method was used to distribute the survey link by email, where the participants shared the link with others in the area through email and WhatsApp groups [
52,
53,
54]. The number of participants reached 810 at the end of three months. According to Cochran’s formula, this number was sufficient for a city with 1.17 million residents and a 0.05 significance level [
55]. Participation was voluntary, and the confidentiality of the participants was guaranteed. The snowball sampling method allows studying a society anonymously when the response rate is high [
54]. The online survey helped reach a maximum number of participants since distributing the survey to the public, especially female participants, would have been difficult [
52,
53].
The second approach for collecting data was through interviews conducted with five managers and government officials to investigate key issues in the water policies of DMA during the COVID-19 pandemic. The number of interviewees was limited to five because only senior officials who were knowledgeable about policies and water management issues were chosen. The interviews were conducted via telephone, and the questions were framed in the form of open-ended queries to allow for comprehensive responses. The interview questions were designed to obtain information on the changes in water consumption, the capacity of the water system to meet the increased demand during the lockdown, changes in water policy during the lockdown, and suggestions for revising the water policy.
For data analysis, the statistical package SPSS (version 26) was used to describe the basic features of the data in the study through frequencies and percentages. Pearson’s Chi-squared test (χ
2) was used to find the association between the level of increasing water usage behavior and the demographic variables; T-independent sample test and ANOVA test were used to find the mean differences in increasing water usage behavior based on sociodemographic variables and household water consumption. Finally, multiple regression tests were used to identify the predictors of increasing water usage behavior. The independent variables of this study are the socioeconomic variables (education, work organization, income, housing tenure, and housing type) and the dependent variable is the (water usage behavior). The equation for the model of this study would be presented as below:
where;
Y: Water usage behavior;
X1: Education;
X2: Work organization;
X3: Income;
X4: Housing tenure;
X5: Housing type.
2.3. Bias and Limitation
While the survey procedure sought to ensure that the samples represent the population by distributing the questionnaires among different groups in the society, the nature of the survey (online) might introduce a bias towards the educated members of the populace. An attempt was made to cross the 67.3% college degree attainment of the respondents with the degree attainment in DMA. However, the latest data on college degree attainment (23.6% of the population) were national data compiled in 2016 [
56]. Efforts have been made by the government since 2015 to improve the proportion of university graduates by increasing foreign university scholarships and local universities. Moreover, recent similar studies reported 72.3% [
46] and 84.6% [
57] college degree attainment.
One of the limitations of this study is that the problem was mainly investigated through an online questionnaire survey. This was due to limited access to data on water demand and supply. Most previous studies on the impact of the lockdown on water consumption used data from the relevant water supply organization [
20,
58,
59]. In order to quantify the changes in water consumption, the respondents were asked to indicate if there was an increase in their water bills during the lockdown. In Saudi Arabia, the water supply is solely handled by the National Water Company, and the tariff has been 0.027 USD/m
3 since 2015 [
60]. Therefore, an increase in water bills might indicate an increase in consumption. Moreover, similar studies successfully used online surveys to understand the impact of COVID-19 lockdown on water and energy use [
39,
61].
3. Results
3.1. Descriptive Analysis of Demographic and Socioeconomic Features
Among the 810 respondents, 424 were male (52.3%), and 386 were female (47.7%). Further, 582 (71.9%) were Saudi citizens, while 228 (28.1%) were expatriates. Most participants (350; 43.2%) were from Dammam, while 285 (35.2%) were from Khobar and 175 (21.6%) were from Dhahran. This is not surprising since Dammam has the highest population in DMA, followed by Khobar, while Dhahran is the least populated region (MOMRA, 2019). A majority of the respondents (567; 70%) were from households with 6 to 10 members. About 387 (47.8%) respondents were married, while 200 (24.7%) were single, and 111 (13.7%) were divorced. Among the respondents, 688 (84.9%) were between the ages of 26 and 65. They were part of the working-class group, implying that most of the population living in DMA were potentially a part of the country’s workforce. Participants under the age of 25 years were 72 (8.9%) in number, and those above 65 were 50 (6.2%).
Table 1 presents the socioeconomic background of the participants, indicating respondents’ education level, the type of organizations they worked for, the total family income, and the kind of housing in which they resided. Family sizes ranged from moderate to large. In general, the participants belonged to the working class, with middle to high income, and homeownership. This population profile has the potential to increase their water consumption during the lockdown since most of them would either not be able to go to work or would work from home. The change from a daily water consumption profile to a weekend water consumption profile due to the stay-at-home rule reflects the spike in water consumption during the lockdown [
33].
3.2. Analysis of Household Water Consumption and Water Use Behavior/Patterns
The results of the survey showed that a high percentage (94.9%) of respondents from the total sample (810) worked from home during the lockdown. Likewise, most participants (95.9%) reported an increase in their water consumption during the COVID-19 lockdown. Nearly 86.3% of the respondents reported more than a 50% increase in their water consumption, with the highest percentage of water consumption for kitchen and cooking (82.6%) purposes, followed by hygiene needs (81.7%), watering plants (74%), recreation (swimming pool) (71.5%), and washing vehicles (50.2%). Consequent to the increase in water usage, about 97.2% of the participants affirmed that their water bills were higher during April–May 2020 than April–May 2019 and that the increment in the water bill during April–May 2020 was more than 100 riyals for 75.7% of the respondents. Nevertheless, about 4.1% of the participants reported no change (2.6%) or a decrease (1.5%) in water consumption.
Table 2 and
Figure 2 show the overall water use behavior/patterns. The total mean score of 3.65 out of 5 points with a standard deviation of 0.813 corresponded to a high level as per the 5-point Likert scale [
62], indicating the high level of water consumption during COVID-19 (
Table 2). A breakdown of the results shows that the participants neither considered adopting water-saving measures during the pandemic nor were they willing to adopt it now. The respondents did not reveal much concern regarding the increase in water consumption during the pandemic (
Table 2).
3.3. Association between Demographic Features and Water Use Behavior/Patterns
Pearson’s Chi-squared test (χ
2) is a statistical test applied to sets of categorical data to test the independence of two variables, expressed in a contingency table. Independence implies that the value of the row variable does not change the probabilities of the column variable (and vice versa) or that the row percentages (or column percentages) remain constant from row to row (or column to column) [
63]. Chi-Square results show that there is a statistically significant association between water-use behavior and demographic features (
p < 0.01) (See
Table 3). Visual display of the results can be seen in
Figure 3.
The results reveal that the water-use level of females was significantly higher than that of males; the water use of Saudi citizens was higher than that of expatriates. Dammam respondents used more water than those from Khobar and Dhahran. Respondents who were married participants showed a higher level of water use than those who were not. A family with 6–11 members used more water than those with fewer members. Similarly, young adults between the ages of 36 and 45 showed a propensity to use more water than other age groups. These results provide information for further exploring demographic variables in the interventions to reduce water consumption.
3.4. Differences in Water-Use Behavior Based on Household Water Consumption
From a quick look at the data, it is not possible to determine whether the data samples are independent or dependent, and since there is the need for a statistical difference between the means, a one-way ANOVA test is performed [
64]. ANOVA results show that there is a statistically significant difference in water-use behavior based on household water consumption (
p < 0.01). Post hoc comparison tests show that this significant difference was found to support working from home, increase in water use, more than 50% increase in water use, higher water bills during April–May 2020 than April–May 2019, and water bill increment of more than 100 riyals (See
Table 4 and
Figure 4). Therefore, working from home led to significantly different water-use behavior compared with working in essential services and staying at home without working. The differences between those working from home and those at home but not working could be attributed to the schedules that stay-at-home workers must follow to complete their work. While those who were not working might sleep for longer hours, those working could not. That is, longer working hours lead to higher use of water.
A
t-test is a type of inferential statistics used widely to demonstrate the difference in the mean of the two groups [
65].
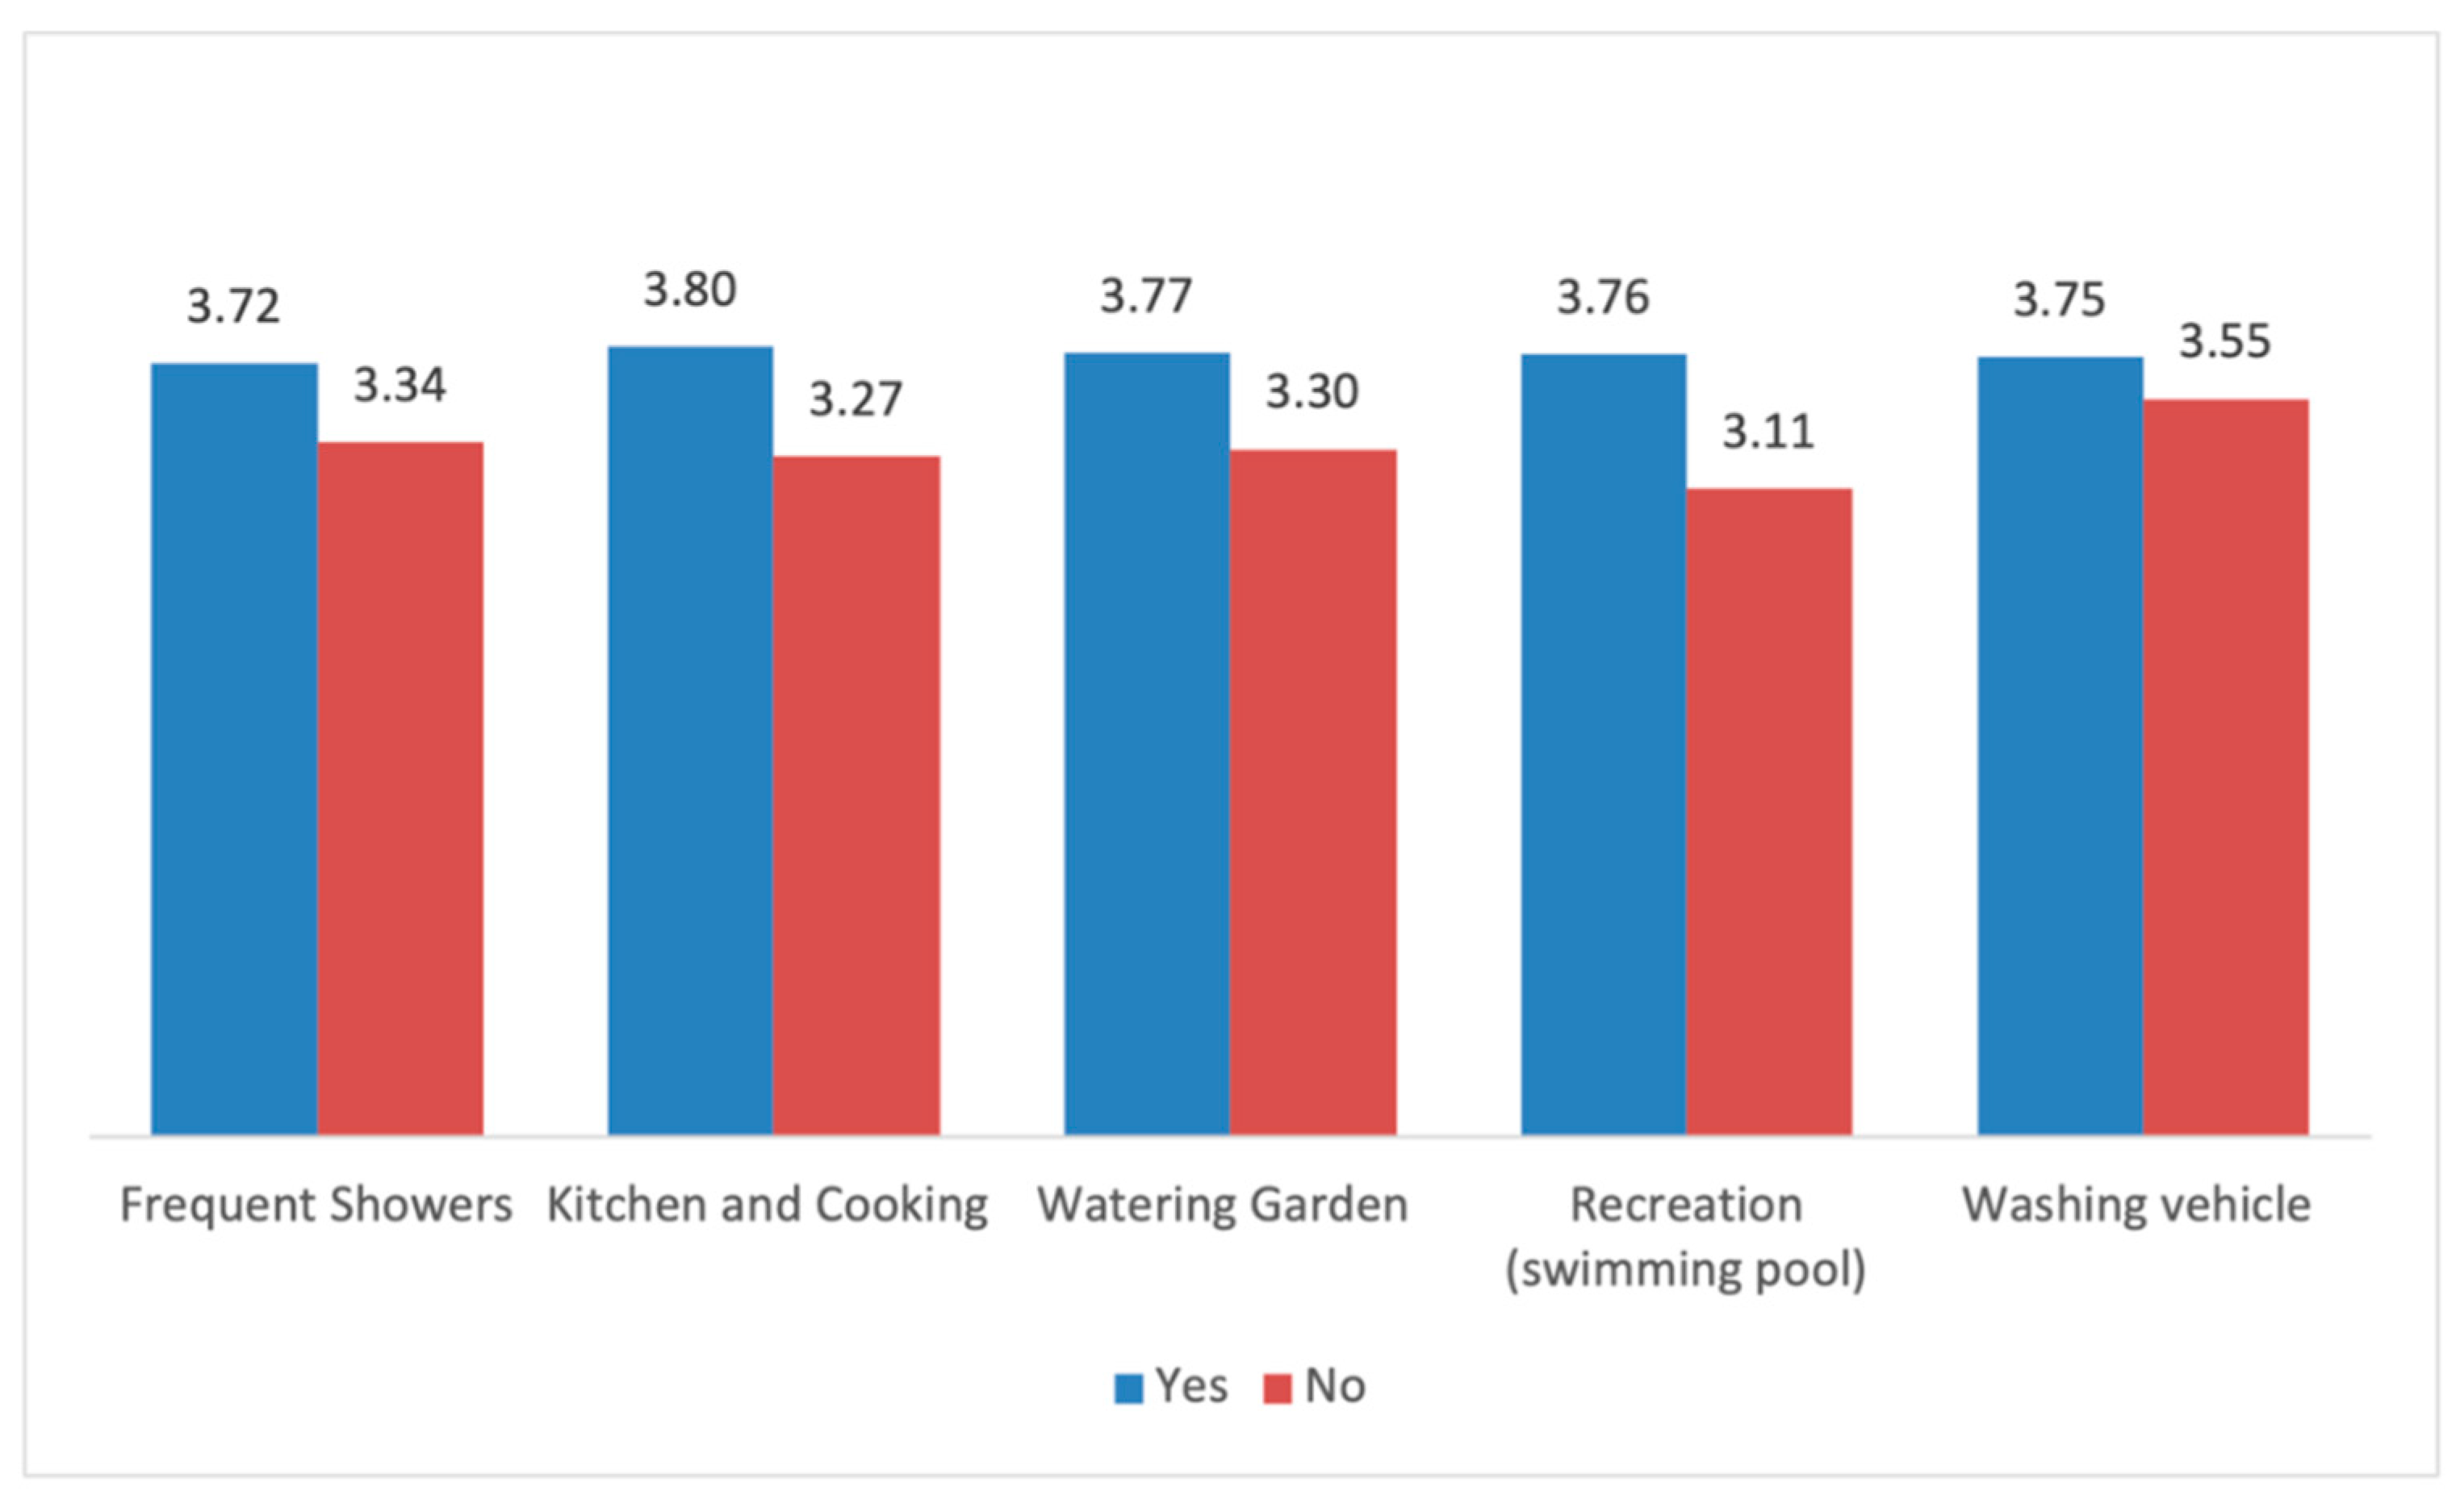
T-test results show that there is a statistically significant difference in water-use behavior based on the increasing consumption; the highest mean score of water wastage was for kitchen and cooking by 3.7986, followed by watering the garden by 3.7699, recreation by 3.7614, washing vehicles by 3.7494, and hygiene and shower by 3.7178 (See
Table 5 and
Figure 5).
3.5. Multiple Regression of Predictors of Increasing Water Usage Behavior
Multiple regression tests were performed to discover the predictors/factors that influence the increase in water-use behavior. The predictor of the dependent variable (DV) is the water use behavior as a continuous variable which out from the overall mean score of the items of water use behavior, which ranged between 1.20 and 5, and the independent variables were education, work organization, income, home type and housing tenure.
A multi-collinearity test was conducted for all regression models. The results revealed that the VIF (the variance inflation factor) for all models was <3 indicating there was no multi-collinearity problem. Further, all models’ residual was normally distributed. Thus, the assumptions for regression analysis were met. The model was well fit (R = 0.413, R Square = 0.170, F = 33.046,
p = 0.000
p < 0.05). The results show the significant effect of education, work organization, total family income, and residence type on water-use behavior (
Table 6).
The results indicate that those with higher level of education have a tendency to use more water (Beta = 0.062,
p = 0.037 *) and the same applies to those whose high family income is high (Beta = 0.282,
p = 0.000 **) and have big houses (villas) (Beta= −0.328,
p = 0.001 **). Those that are unemployed showed a higher propensity to use more water than the employed. Housing tenure did not have a significant effect on water-use behavior (
p > 0.05). Based on the results of multiple regression, the equation for the model would be presented as follow:
where,
Y: Water usage behavior (DV Predicted);
X1: Education;
X2: Work organization;
X3: Income;
X4: Housing tenure;
X5: Housing type.
In the interviews that were conducted, the interviewees highlighted the following points in their responses.
- i.
Water consumption increased during the lockdown;
- ii.
The existing water system needs to be improved to meet emergency demands;
- iii.
Government policies were not revised during the lockdown;
- iv.
Experts suggest changing the water policy and legislation during crises or emergency lockdown situations by a temporary reduction in consumption tariffs or no disconnection of water supply if payment is delayed;
- v.
Some operational faults were also mentioned, such as the reduction in water distributed to customers.
4. Discussion
As per the results and the participant responses, water consumption increased by more than 50% in DMA during the lockdown, with a corresponding increase in utility bills. This buttresses the report by Abu-Bakar et al. [
58] that water consumption increased by 46% in England during the lockdown. In another study, the increase in water consumption in households was between 15 and 20% percent, while commercial water consumption decreased by 30–50% [
59]. In the GCC, Abulibdeh [
66] and Rizvi et al. [
67] reported higher usage of water in the residential sector during the COVID-19 lockdown in Qatar and UAE. The percentage increase found in Qatar was a minimum of 9%, depending on the building, either villa or flat. Further, this study revealed that water-use behavior was influenced by both demographic and economic factors. Factors such as gender, nationality, age, house type, employment, and education affected patterns of water consumption. Balacco et al. [
68] examined the impact of restrictive measures on demand for water during the lockdown by inspecting the instant flow data of five towns in Apulia, Italy, focusing on user habits. The population water-use behavior and awareness, climate, and the price of the water were found to influence the demand for drinking water.
A significant number of respondents in this study mentioned that they were not ready to adopt water-saving methods. People need to adopt new behavioral patterns to minimize water-related bills related to water. Therefore, it is pertinent to raise awareness on how one can conserve water and at the same time be protected from the virus by regular hand washing. This will also have an impact on service delivery. Policymakers can adopt policies that reward “good behaviour” as highlighted by Ashour et al. [
69] and Lusk et al. [
6]. The differential tariff already in place can be reviewed to increase the prices for consumptions that are more than the average. A policy should be enacted to aid the deployment of smart water management technologies as part of the smart city initiatives [
70]. Above all, citizenship enlightenment and engagement are very important in promoting sustainable consumer behavior.
Understanding the new variations in the use of water during, before, and after the COVID-19 pandemic will help in preparing strategies to improve the supply of water. These strategies are important since the interviewees mentioned instances of operational failures that led to reductions in the water supply. Behavioral practices such as attaining higher education and gaining knowledge about conservation were stated to be correlated with good hygiene practices such as handwashing [
71]. Moreover, decision-makers can explore the information on the relationship between the demographic profile and water-use behavior in targeted awareness campaigns and intervention actions.
Apart from the operational failures, the interviewed experts also highlighted the need for system improvement, especially during emergencies. Government interventions in the form of policy changes are essential to reduce the impact of operational failures on the populace. Thus, long- and short-term goals are needed to enhance the supply of water and establish a flexible water system that could reduce the shocks from future emergencies or pandemics. This is crucial in safeguarding the millions living in densely populated cities. With COVID-19 constantly spreading in developing countries where there is no adequate supply of clean water, the population of these areas continues to be highly vulnerable [
72]. It has been well-established that in developing countries, there is a lack of adequate supply of water and provision for handwashing [
73]. Under such conditions, flexible governance and planning responses are needed to achieve proper management against this shock and its consequences [
74].
One of the findings was that working from home is a major factor in increased water consumption during the lockdown. Even the number of respondents reporting washing vehicles is still high despite staying at home. Most people continue to wash their cars since they have already paid for the car to be washed. Moreover, sandstorms in the desert environment can make the car very dirty. People did not travel to work, but they still obtained permission to shop and perform essential tasks. Saudi has a youthful population, and some of them take car washing as recreation. Similarly, recent studies on water demand have clarified the relocation of water usage from public spaces to homes, with high water consumption practices, at the beginning of the COVID-19 pandemic, but this has reduced over time [
75]. Several demand strategies rely on existing sociodemographic and socioeconomic household changes and behaviors self-reported through surveys [
76,
77]. The findings of this study will help draft more accurate interventions and forecasting when enriched with socioeconomic and sociodemographic variables.


