
Improvements and Operational Application of a Zero-Order Quick Assessment Model for Flood Damage: A Case Study in Italy

 , ,
, ,  and
and 
Abstract
:1. Introduction
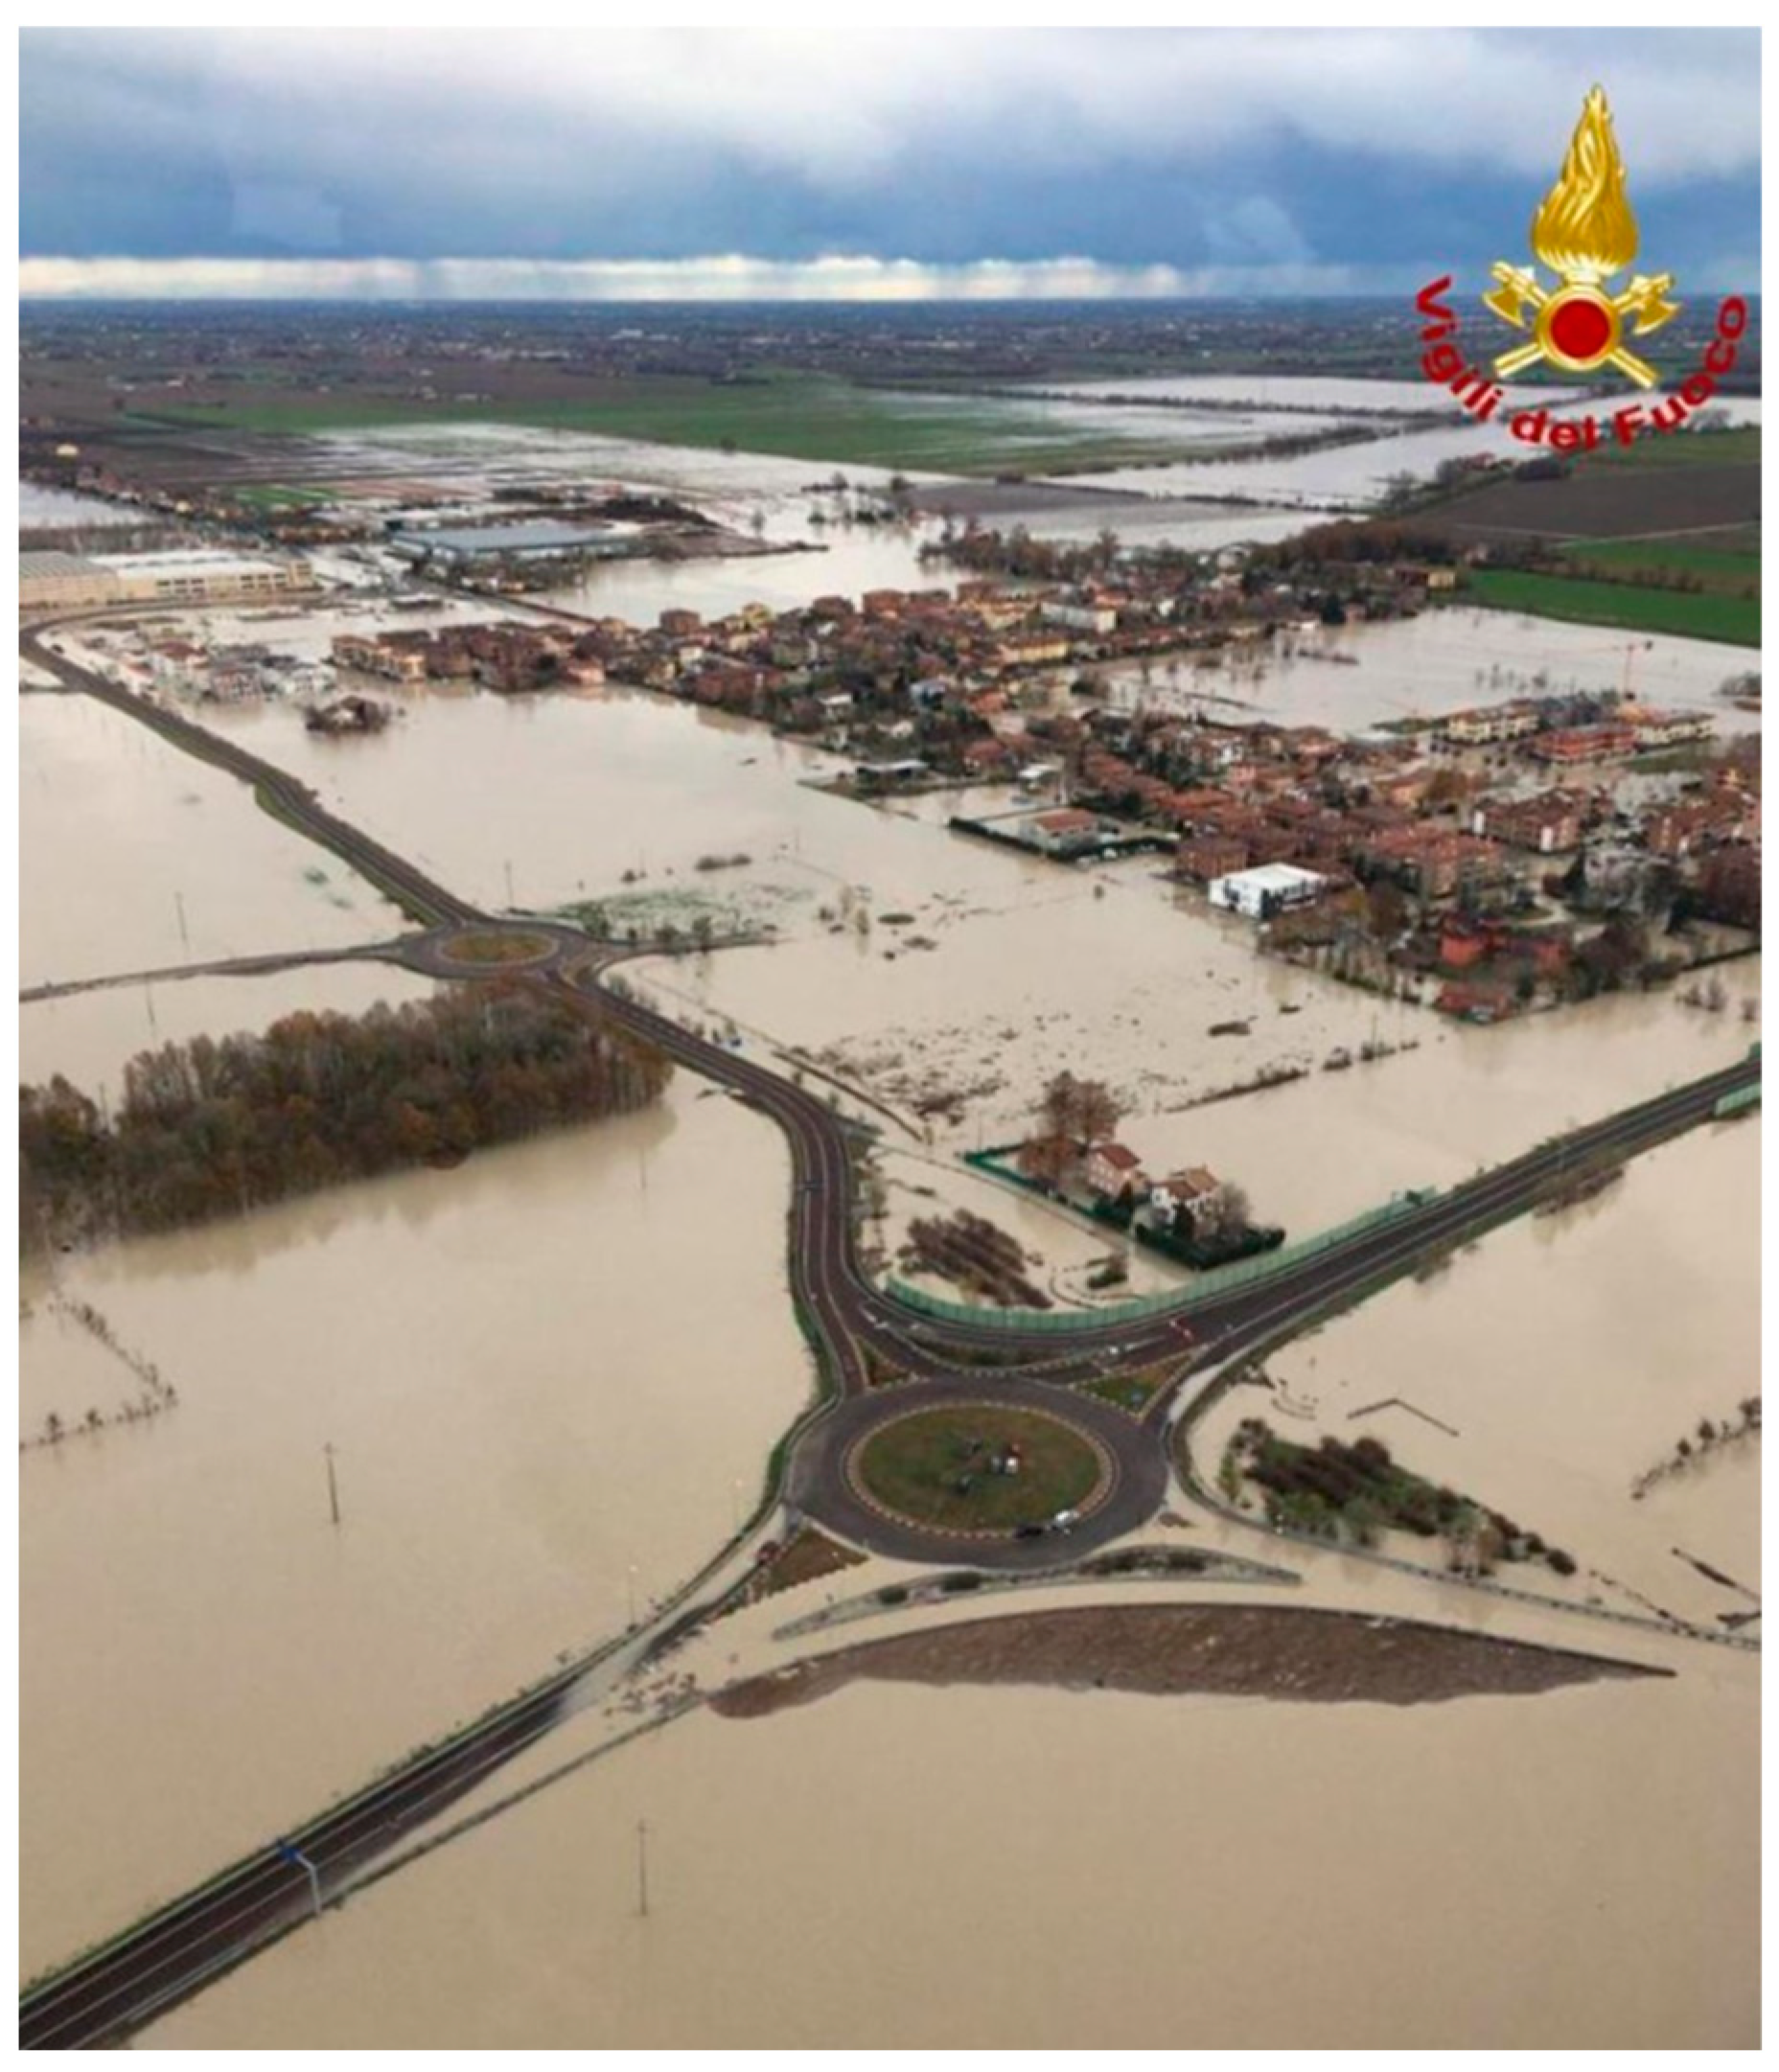
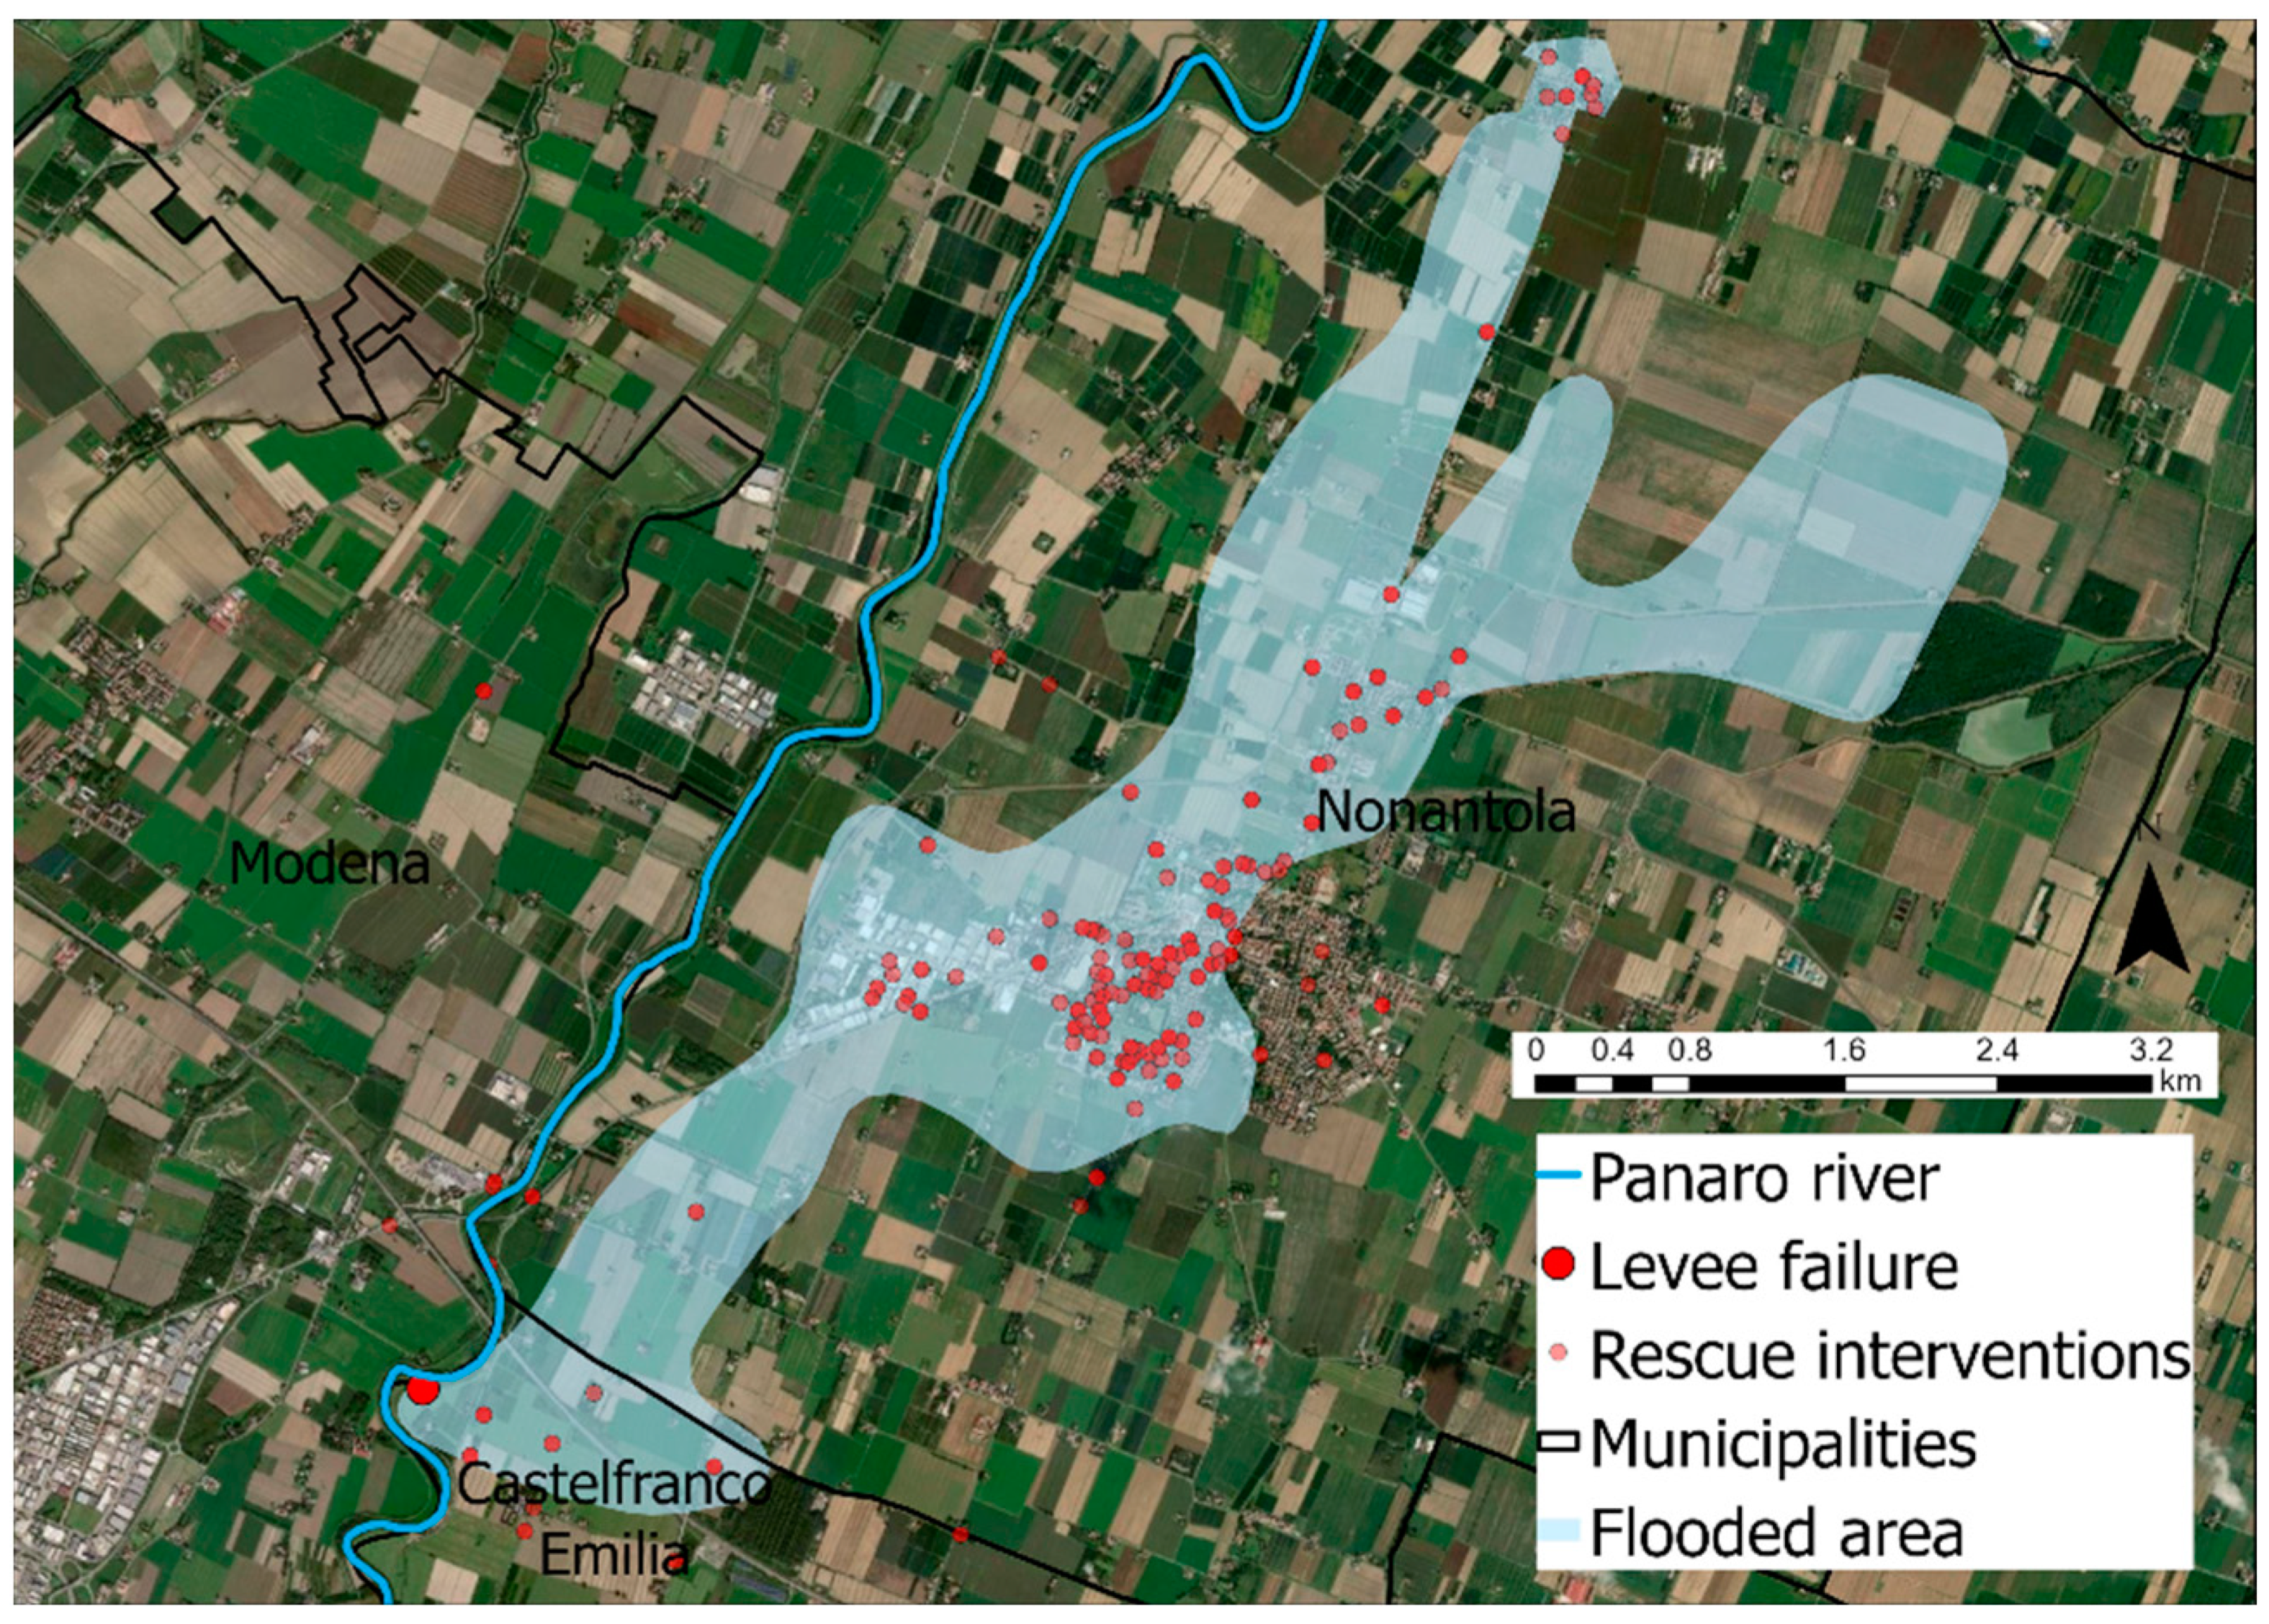
2. Case Study
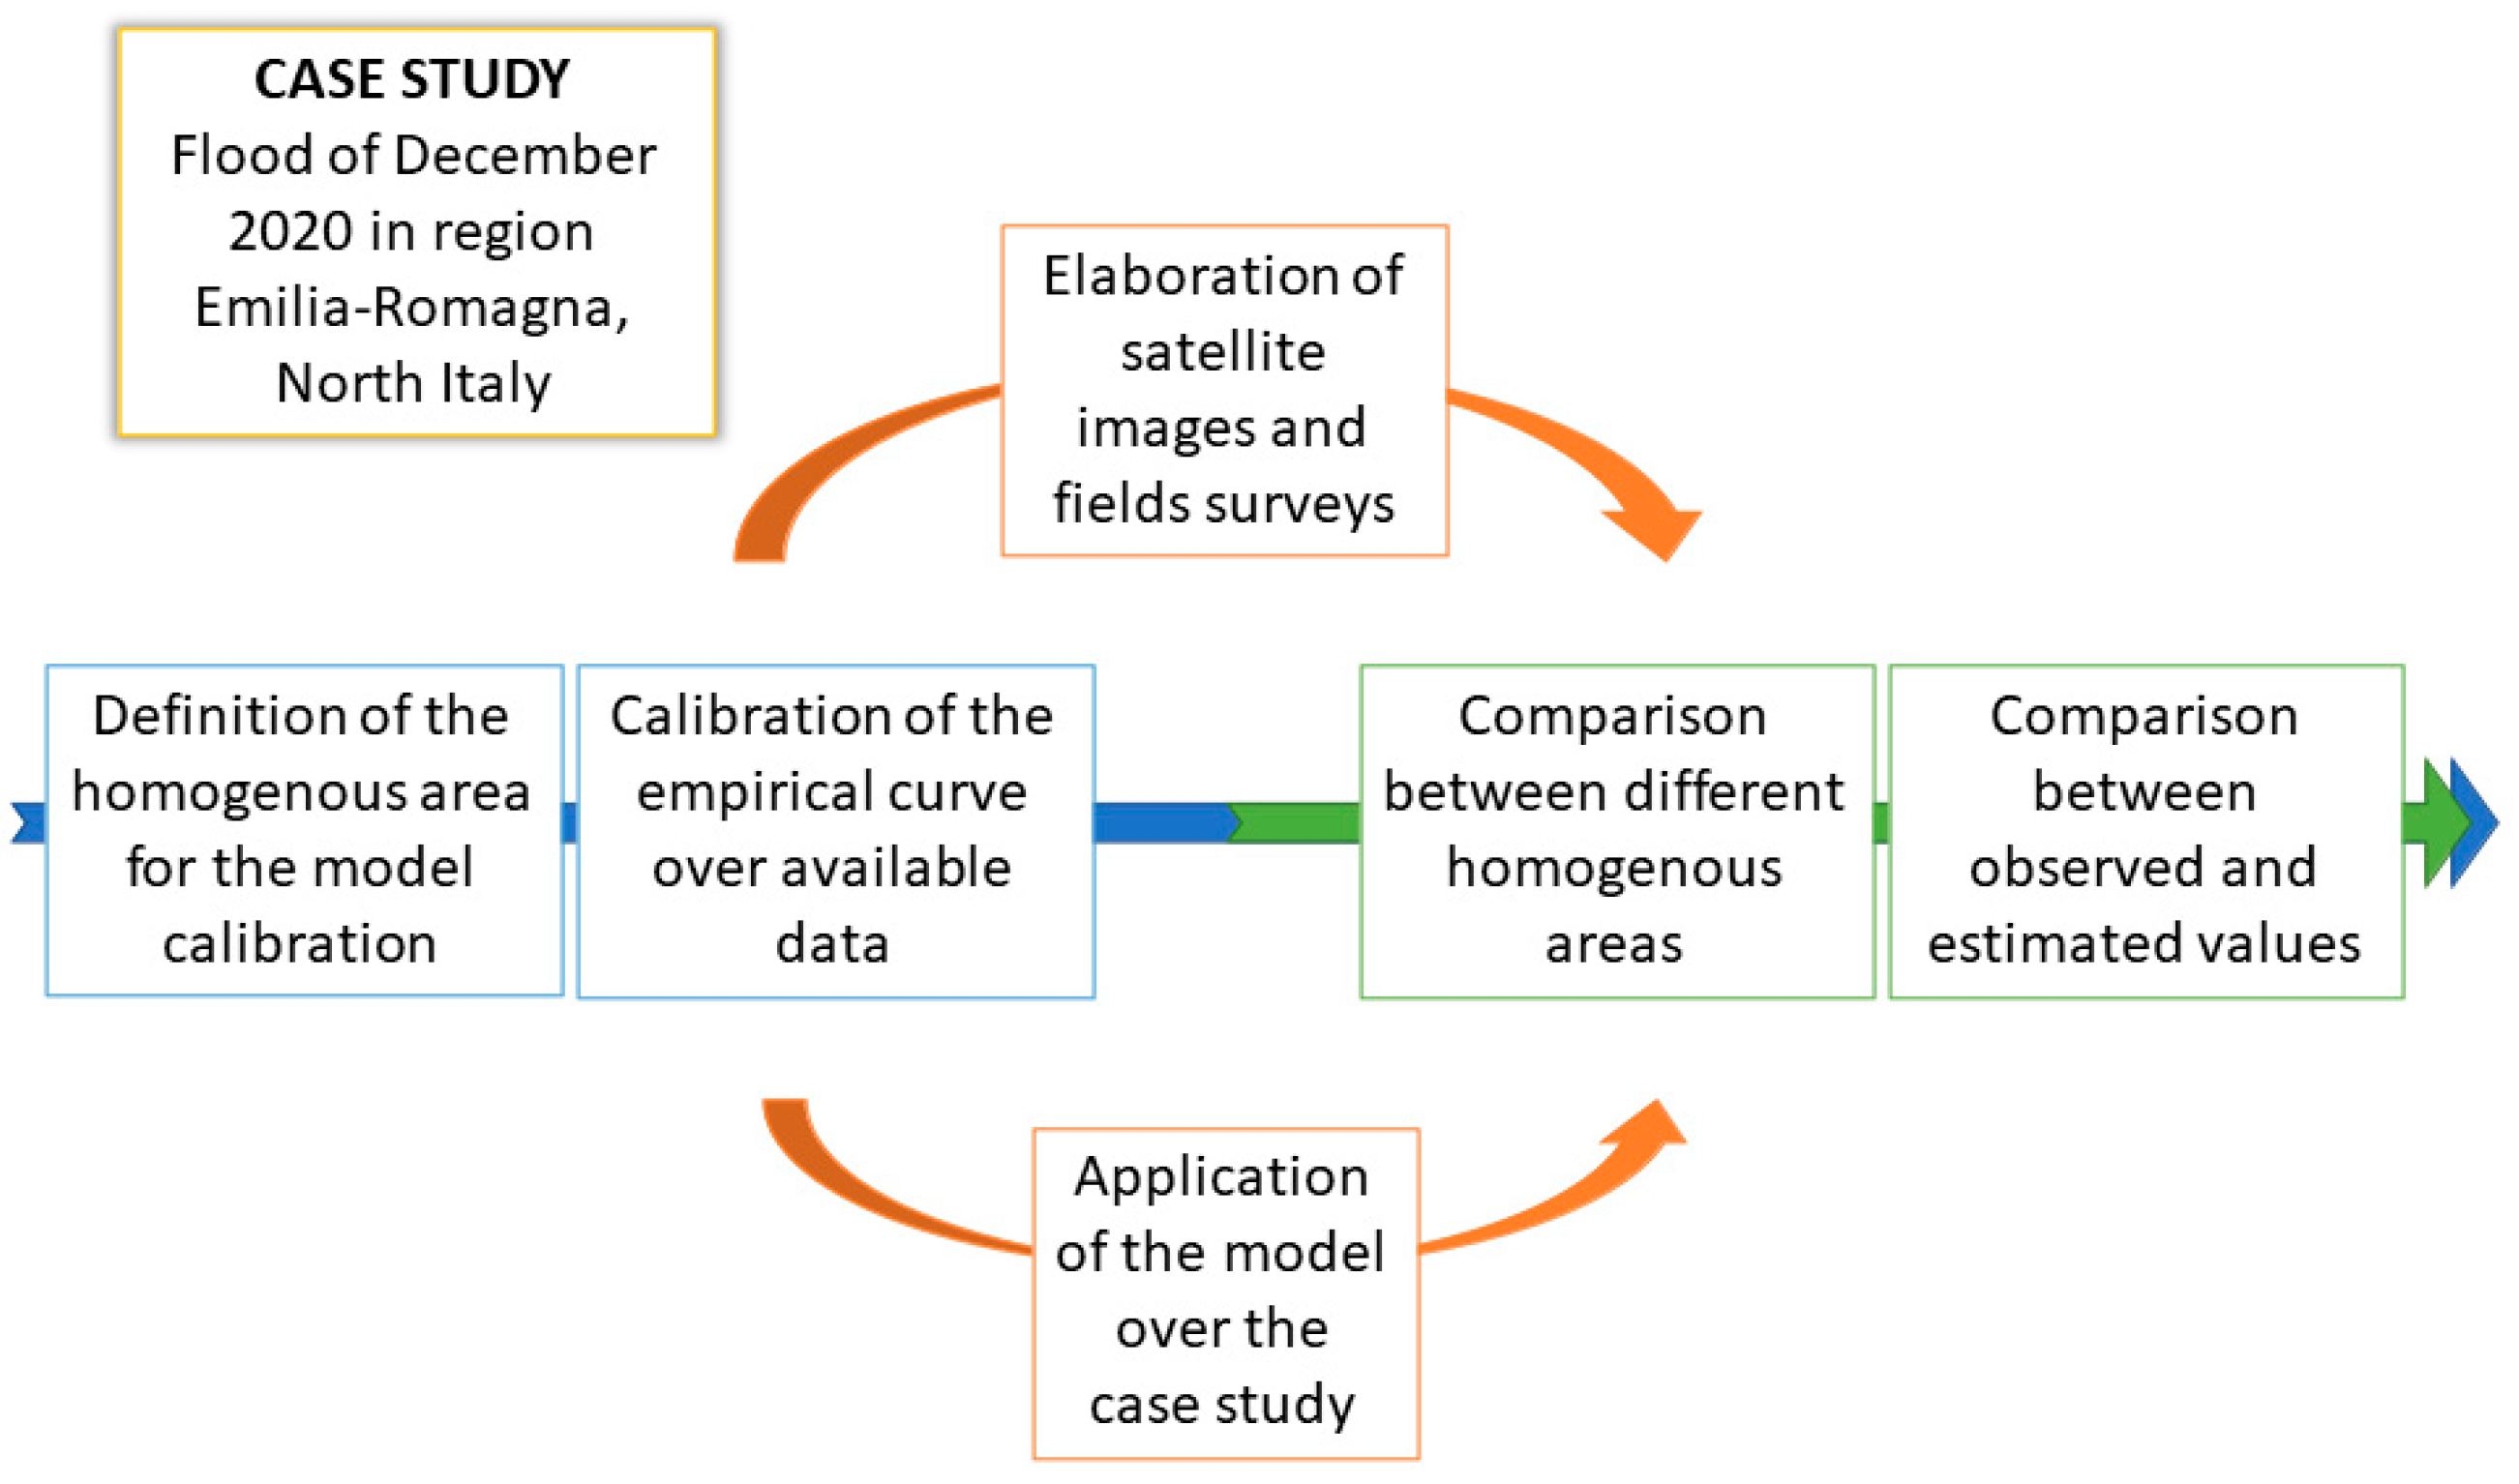
3. Materials and Methods
3.1. Model
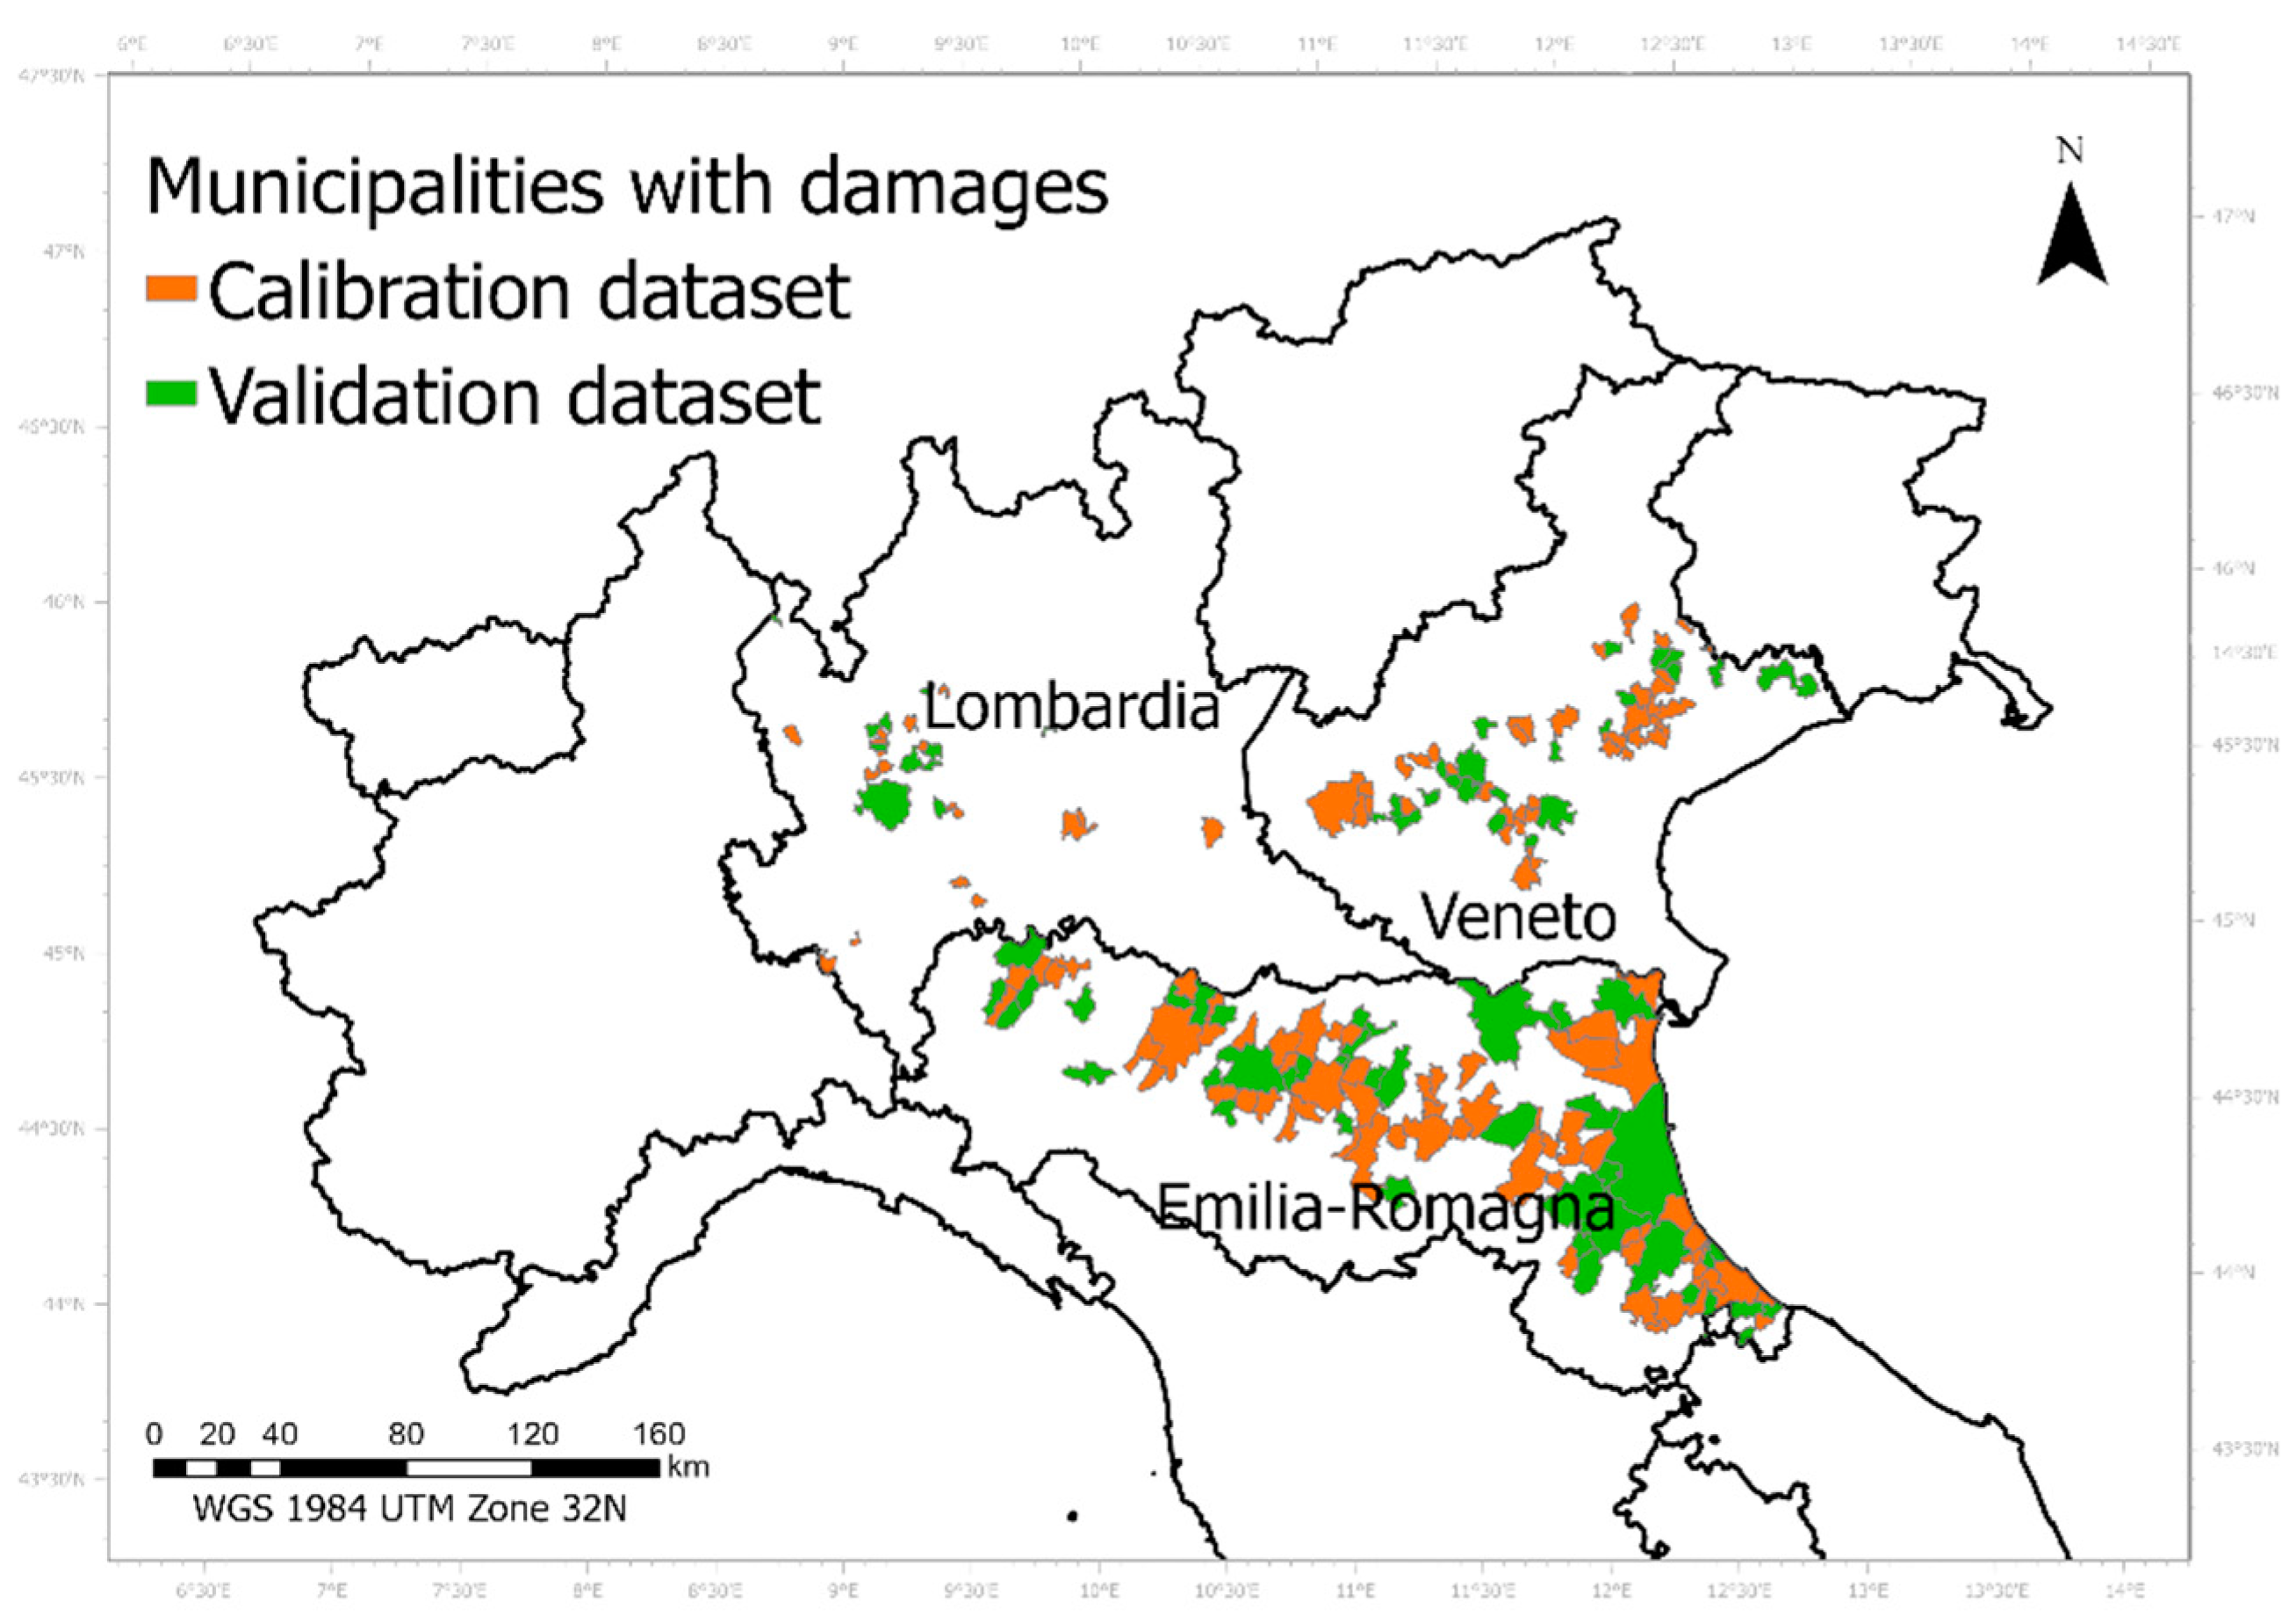
3.2. Calibration Area
3.3. Calibration Data
3.4. Definition of the Residential Flooded Area
4. Results
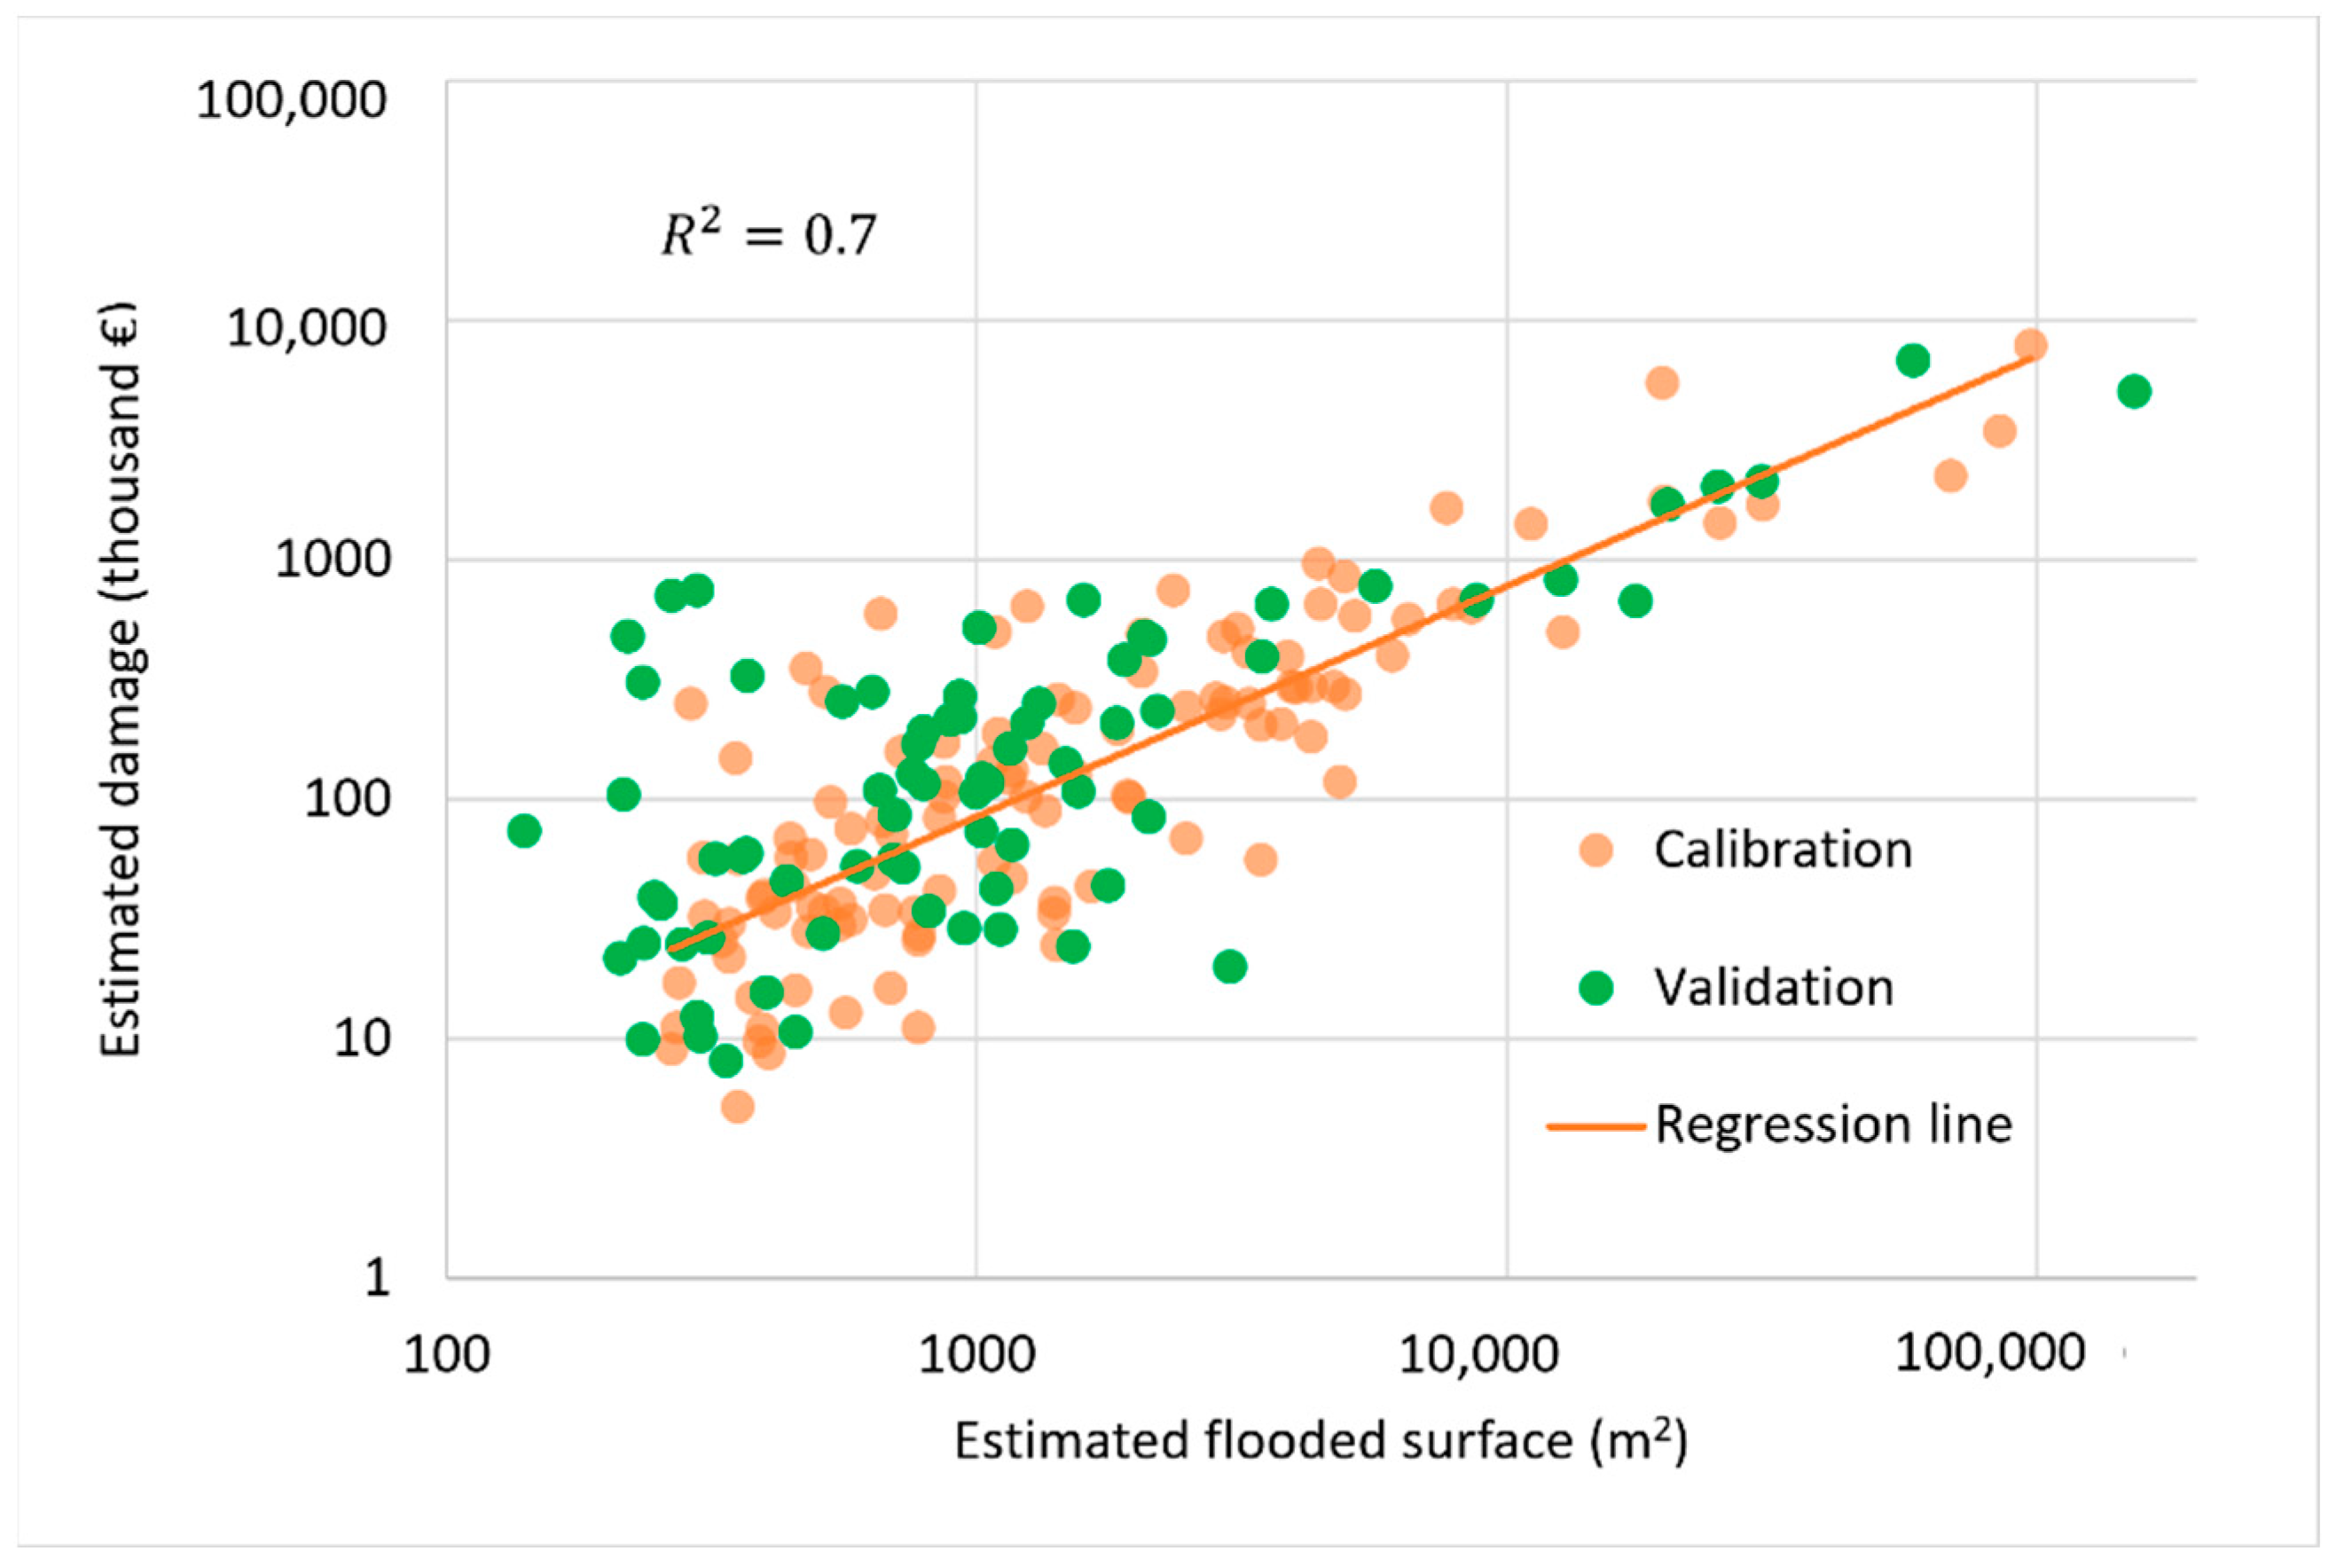
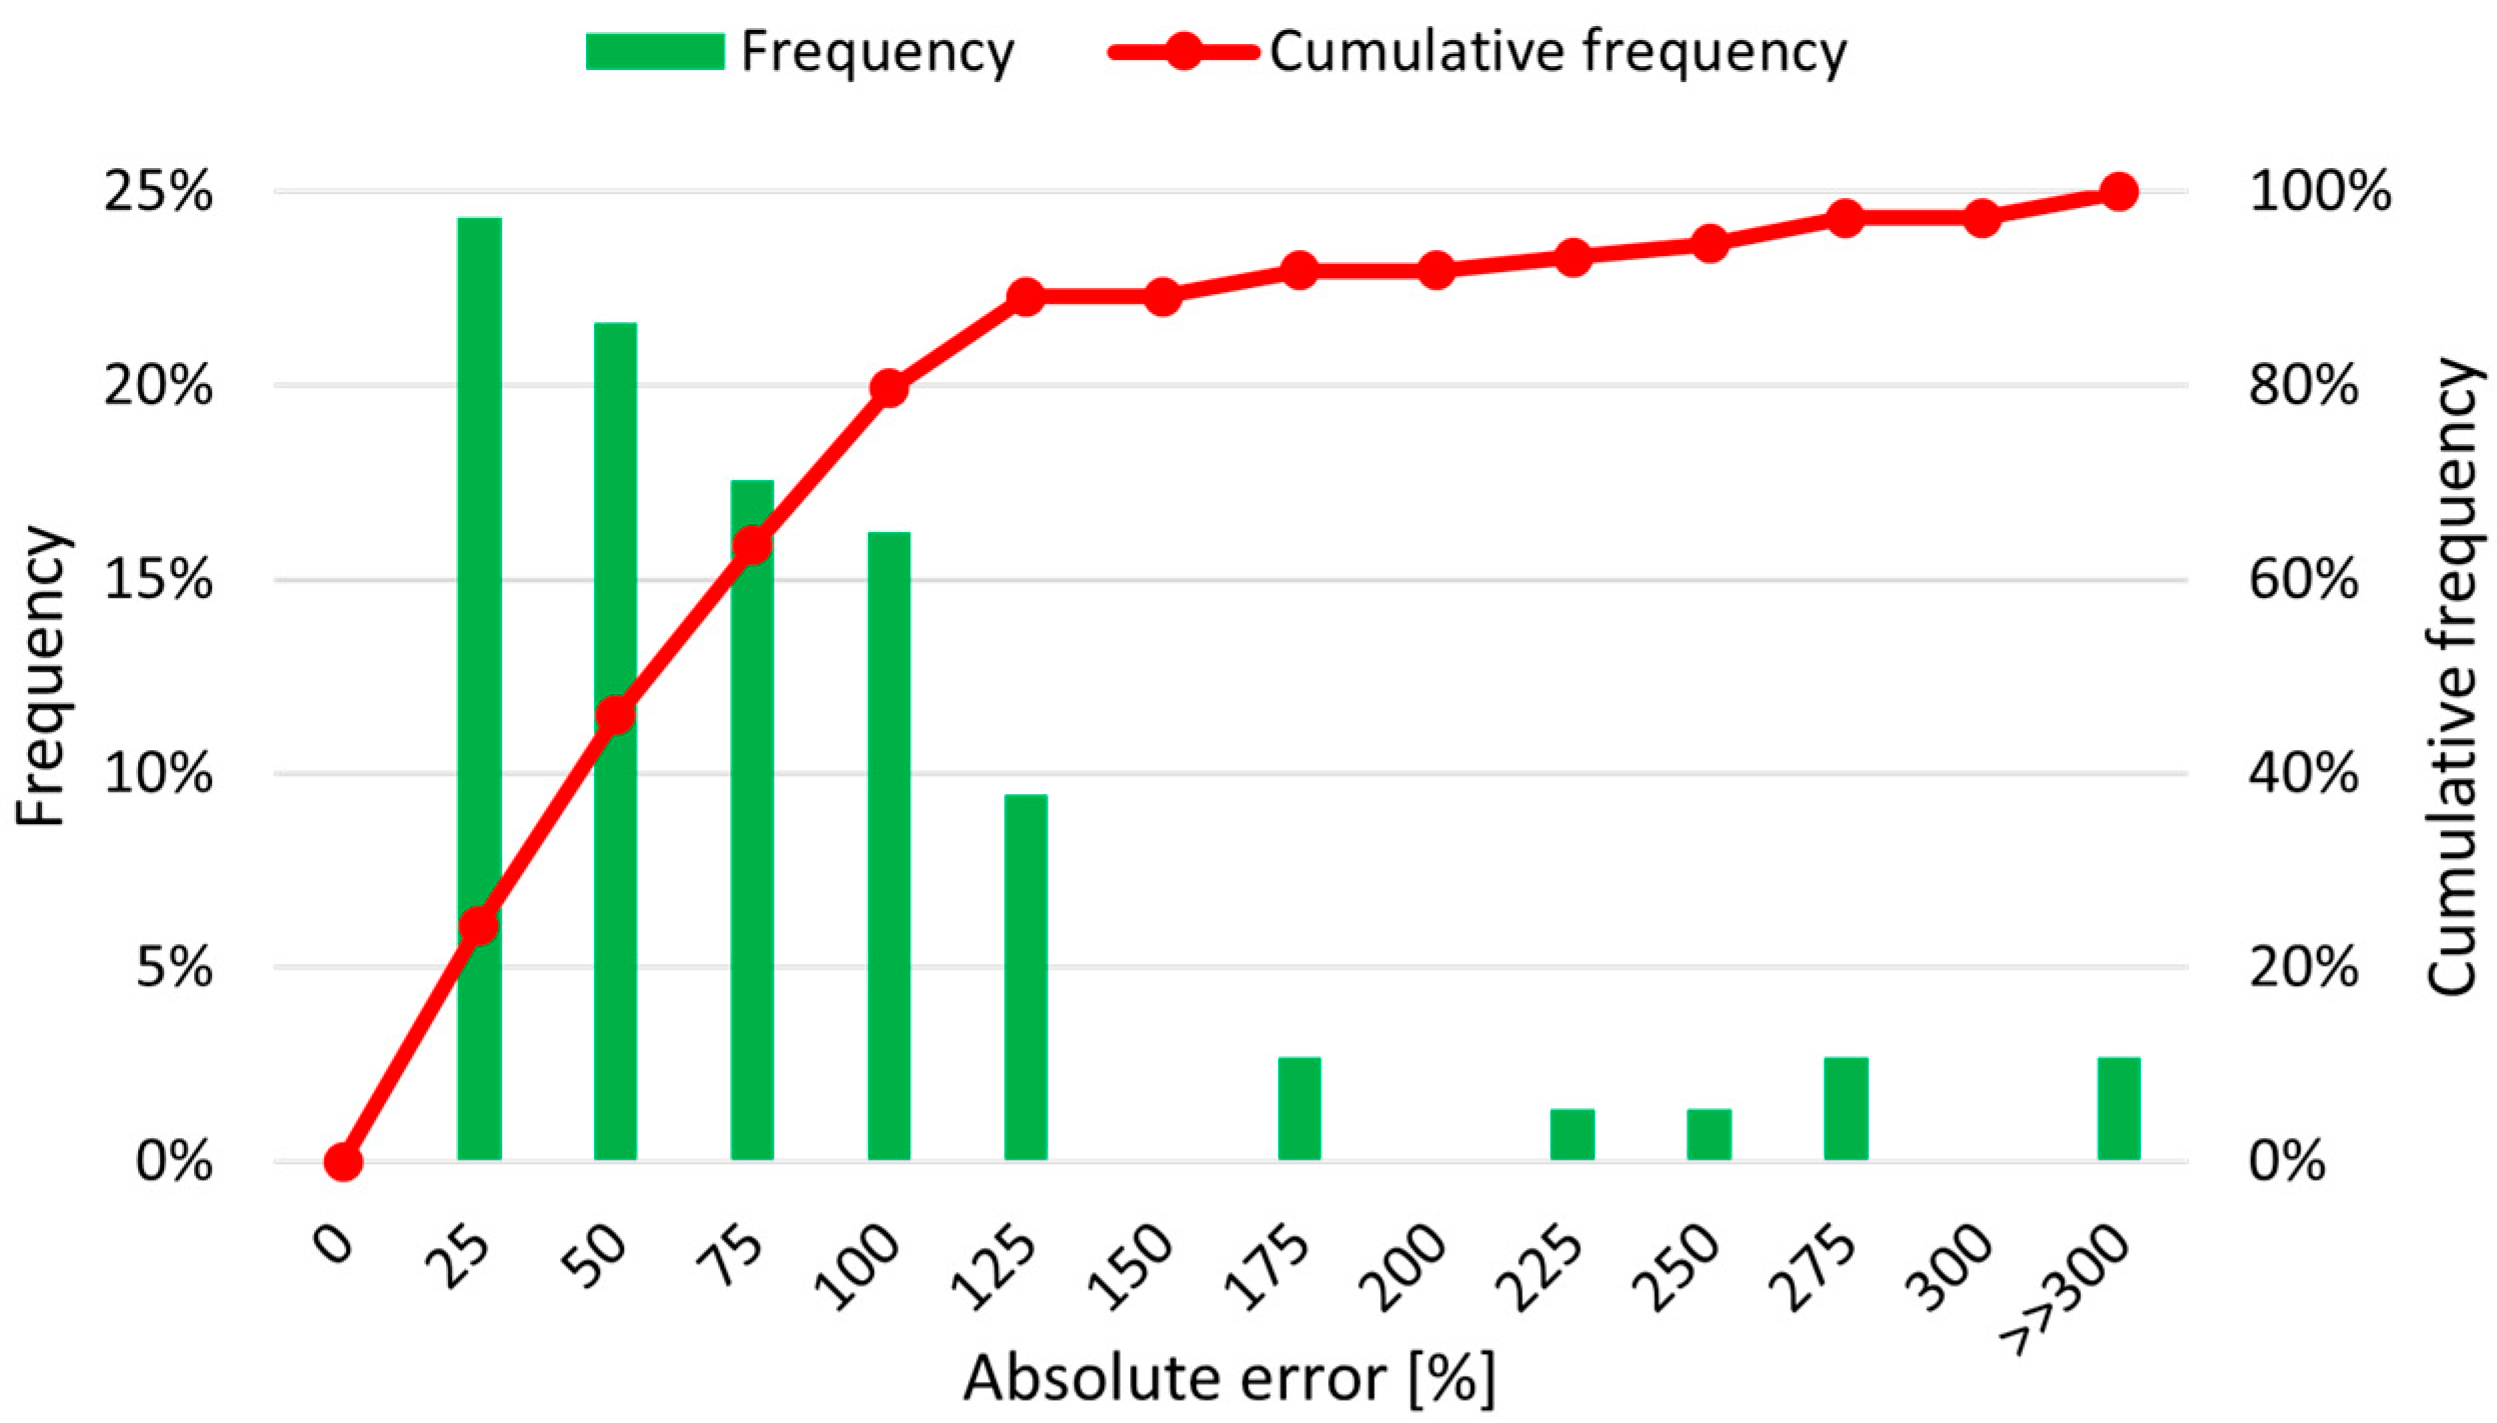
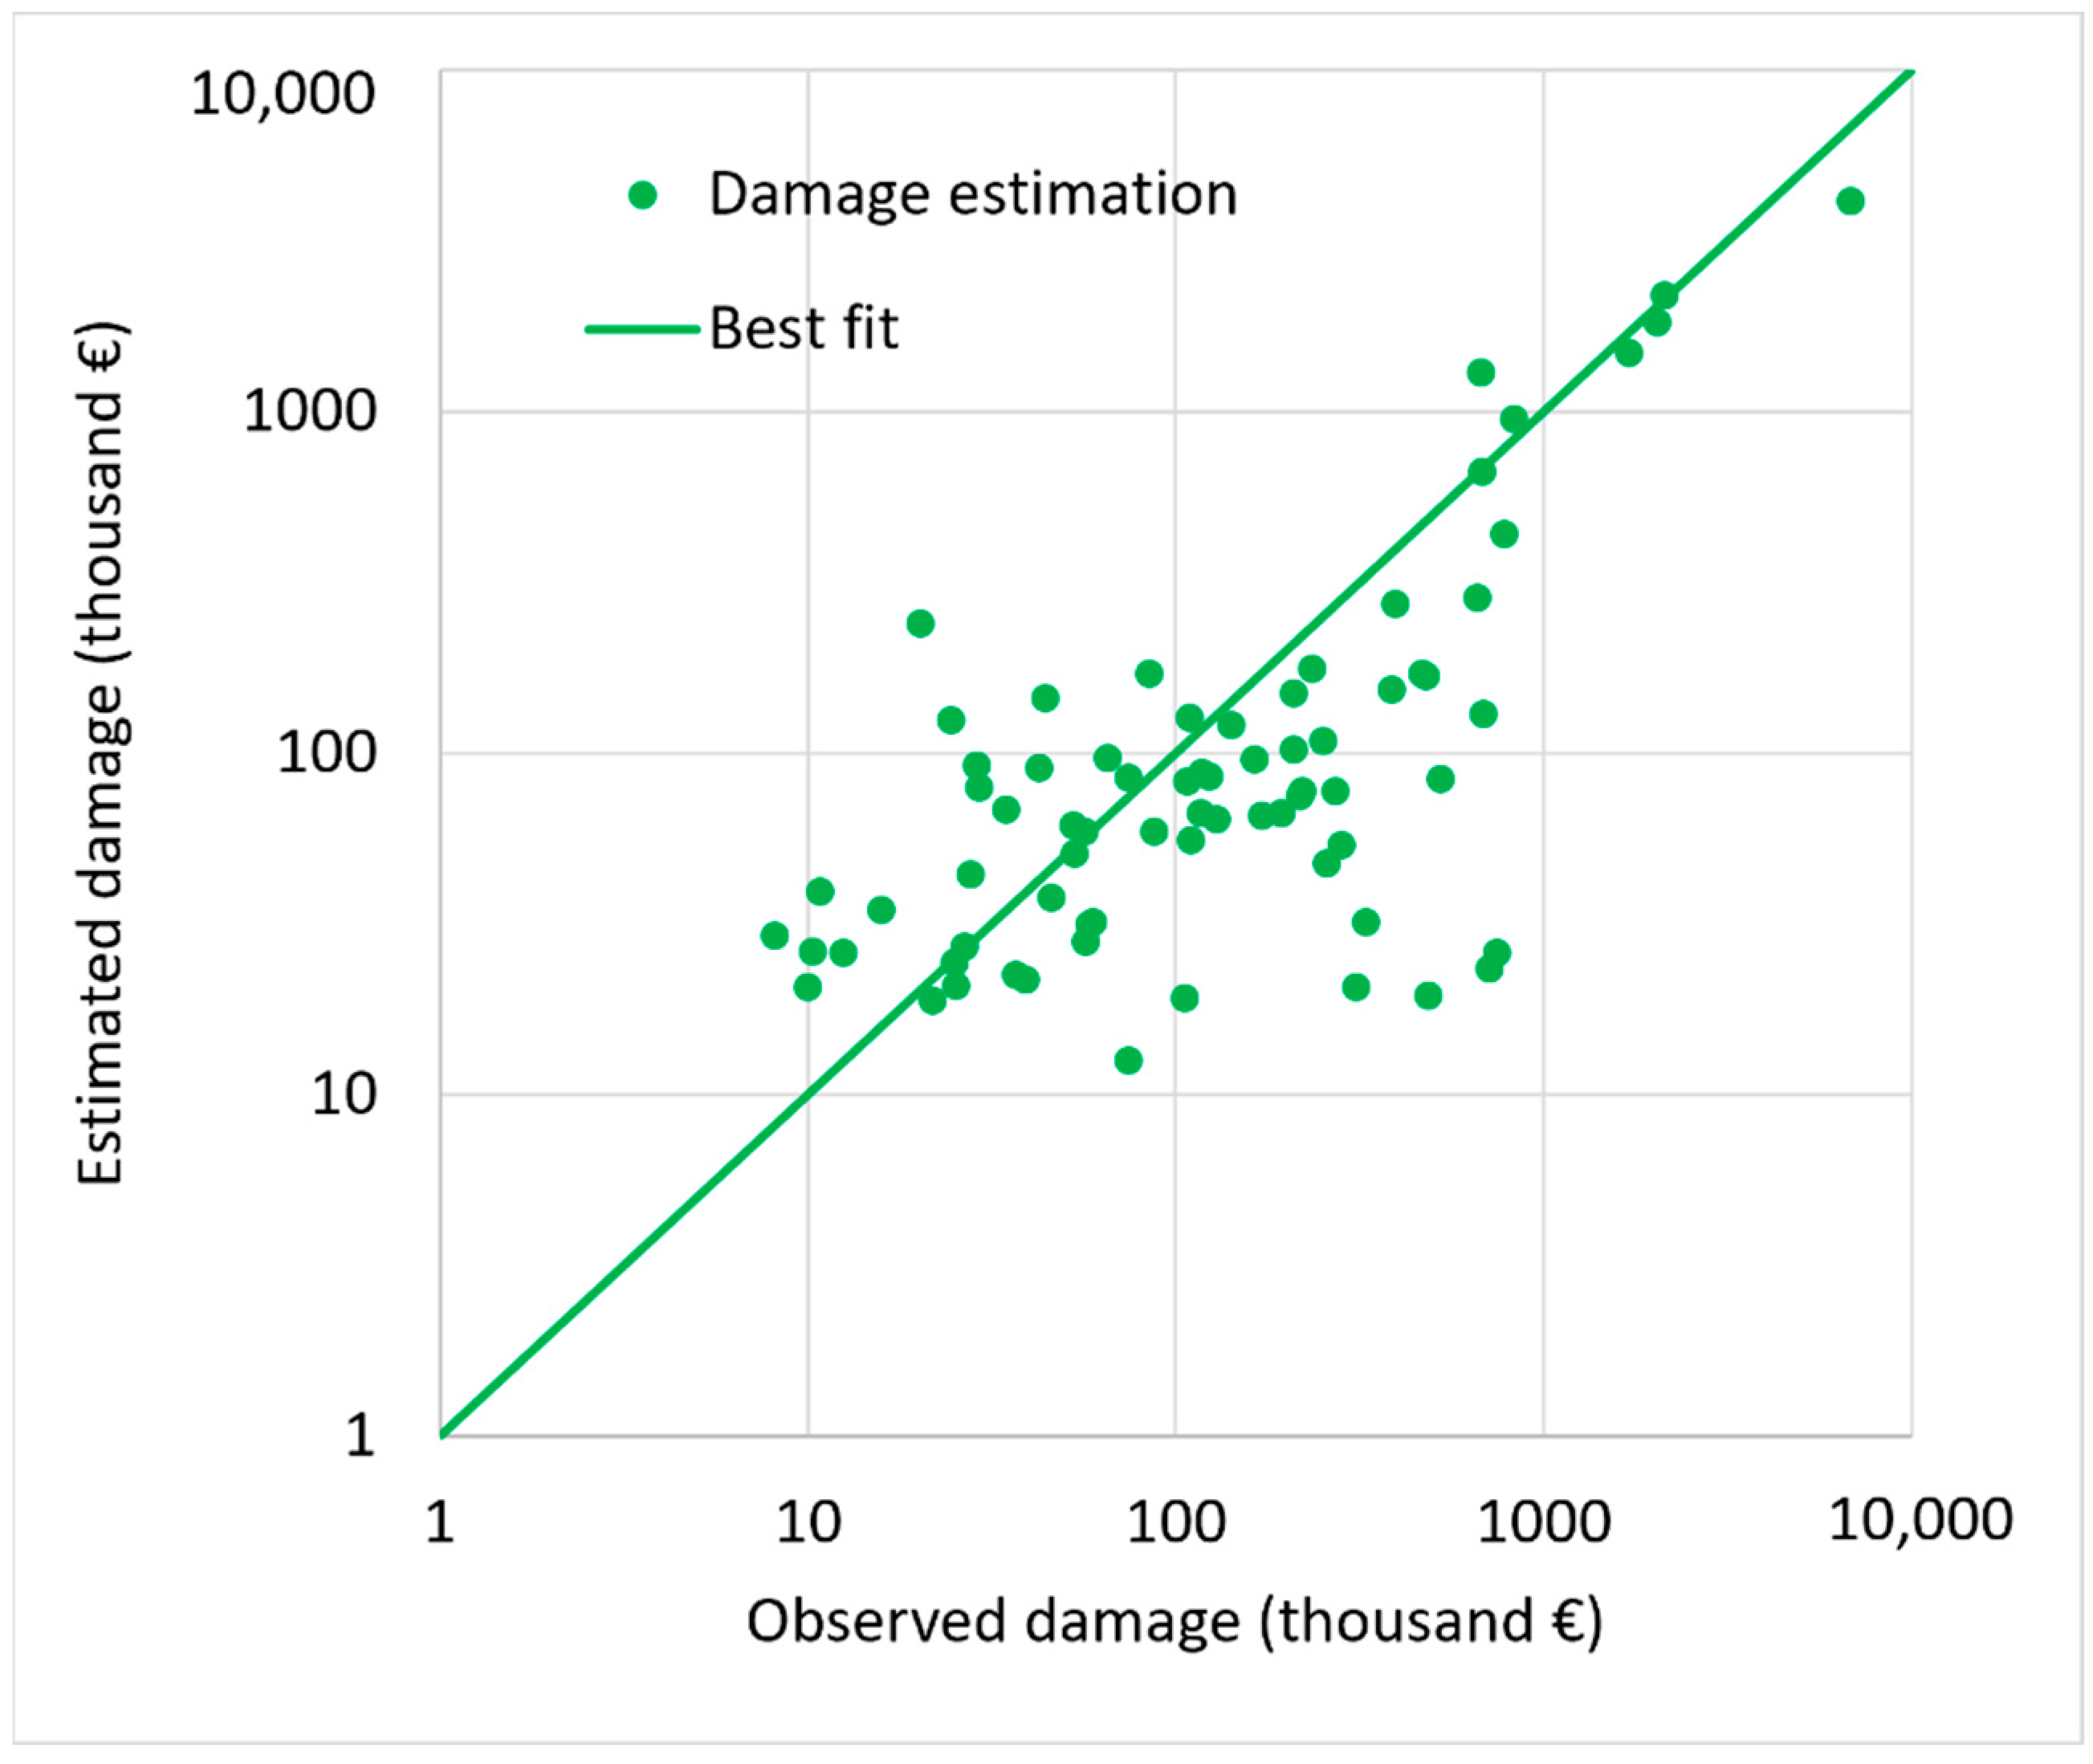
4.1. Model Calibration on the Po-Venetian Floodplain HA
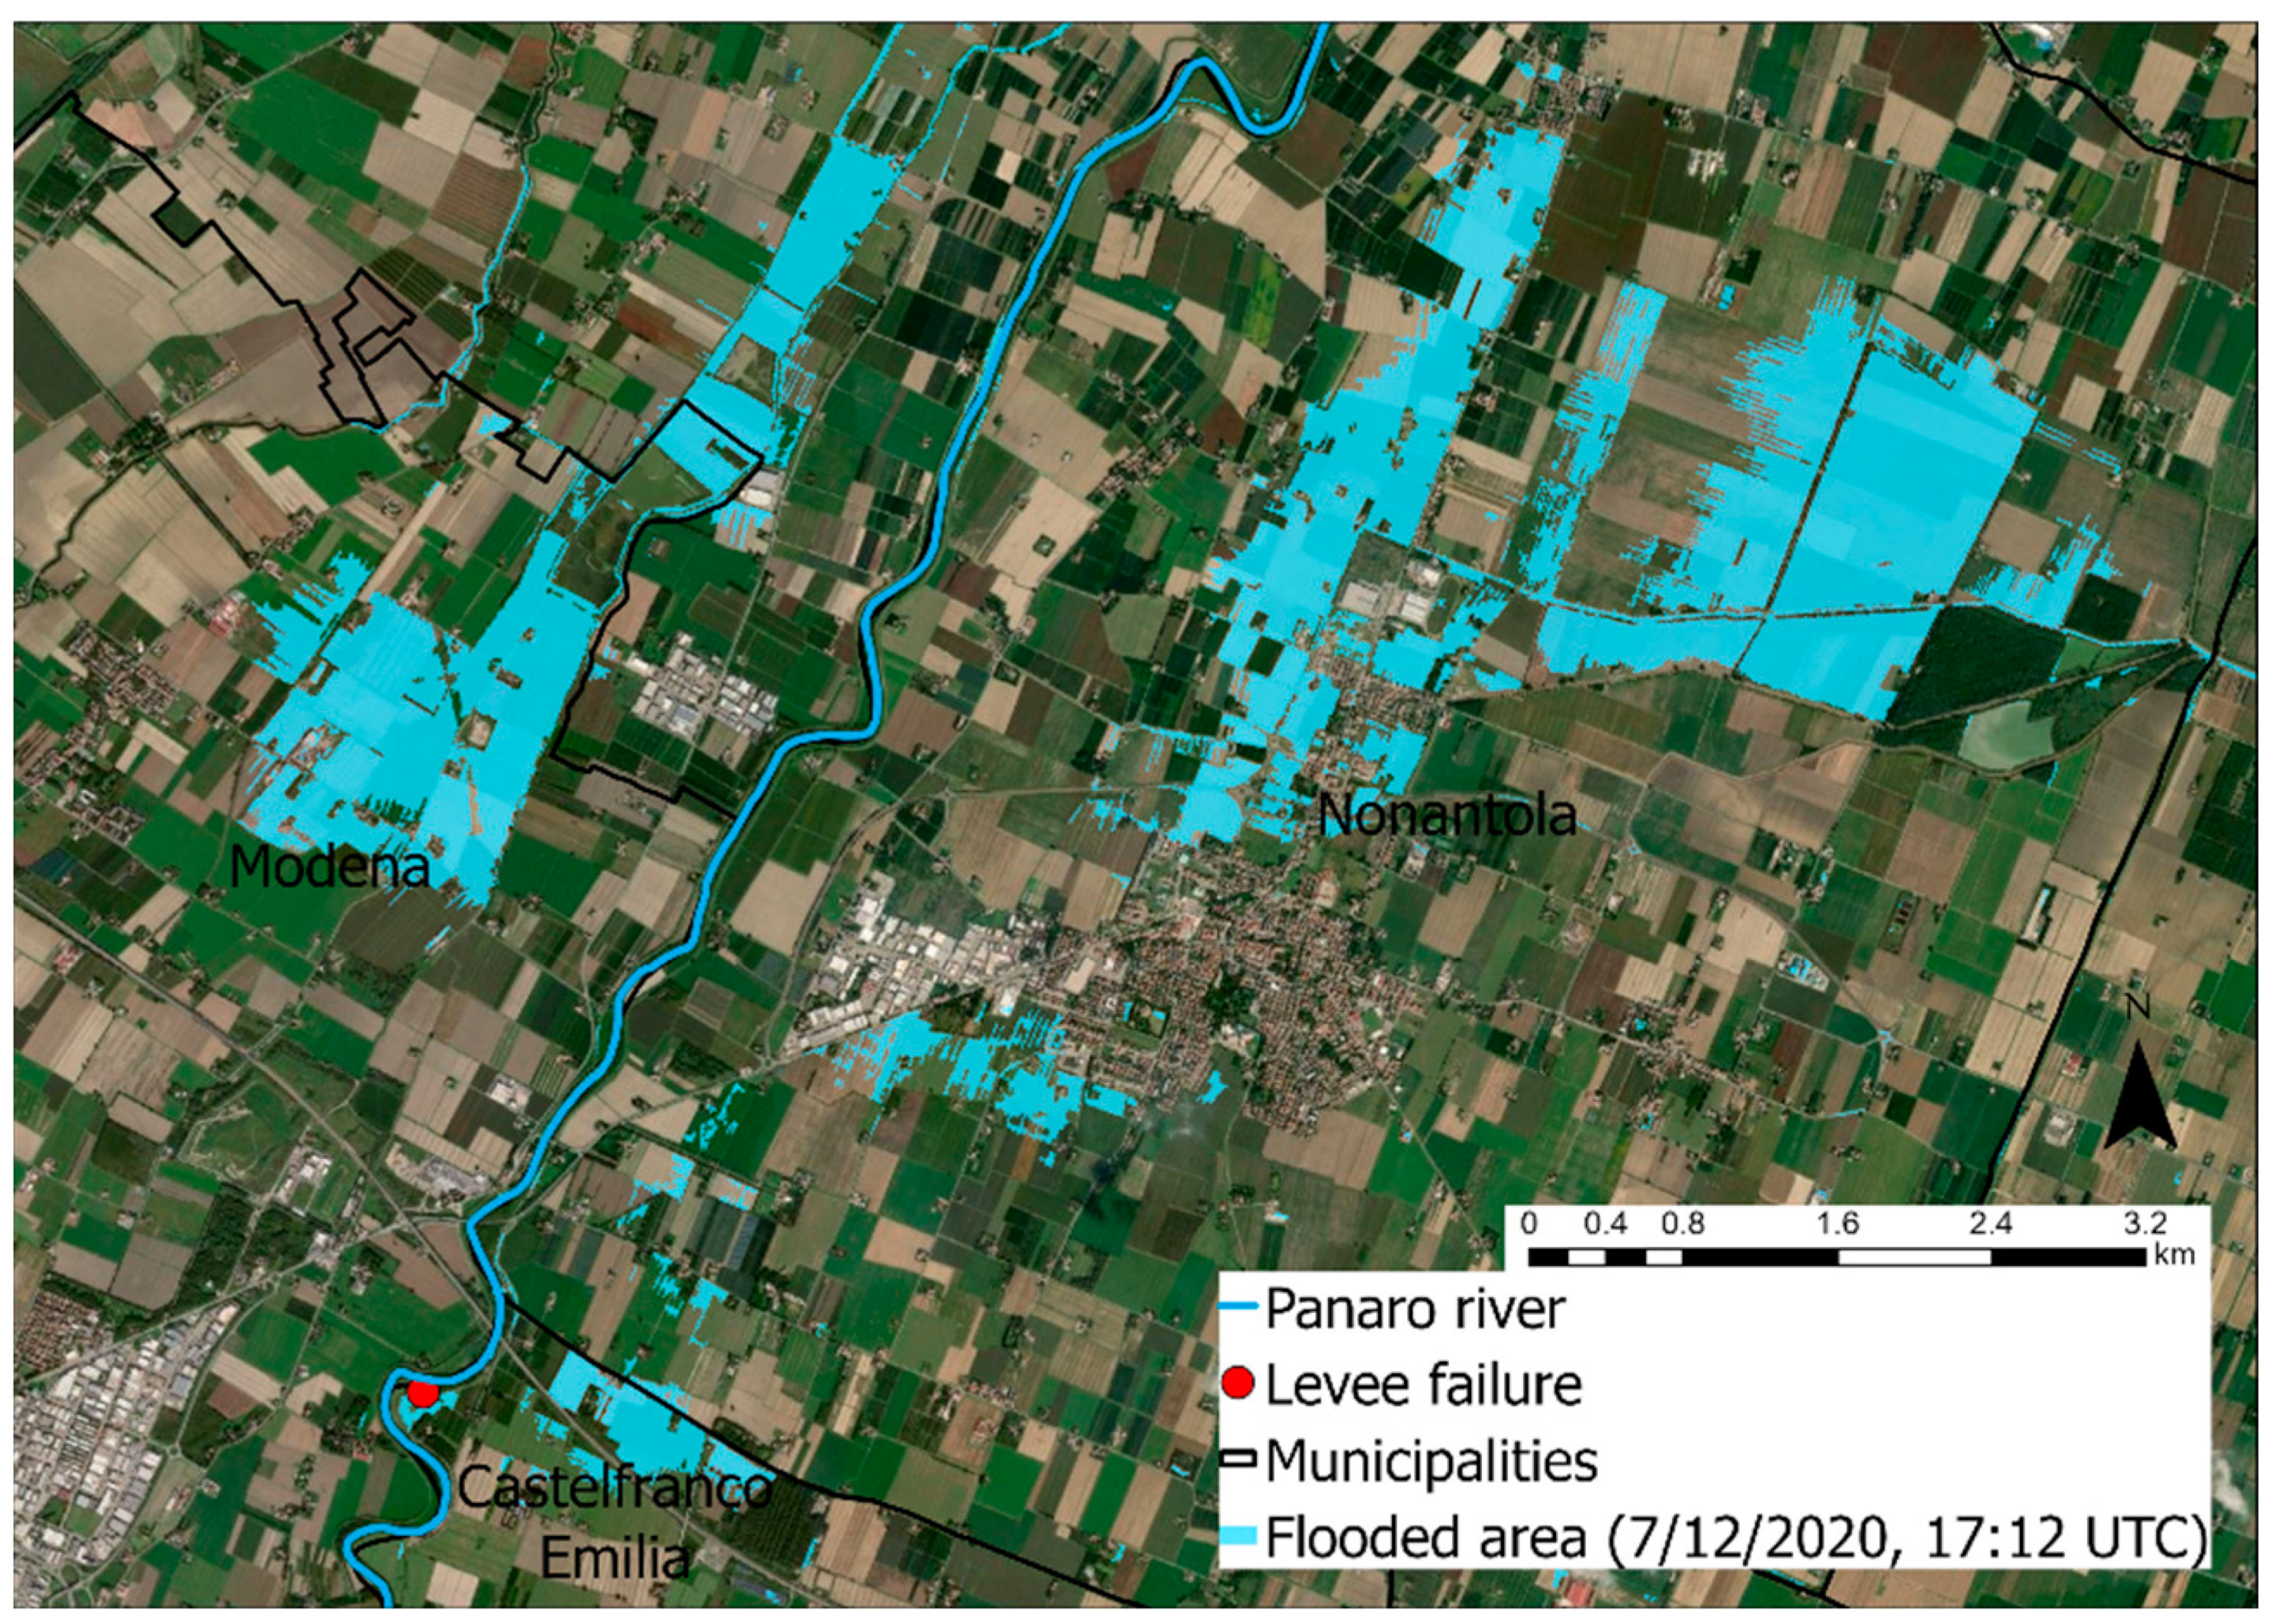
4.2. Implementation of the Model in Emilia-Romagna December 2020 Flood
5. Discussion
5.1. Comparison between HA
5.2. Discussion of the Results
6. Conclusions
Author Contributions
Funding
Institutional Review Board Statement
Informed Consent Statement
Data Availability Statement
Acknowledgments
Conflicts of Interest
References
- Molinari, D.; Menoni, S.; Aronica, G.T.; Ballio, F.; Berni, N.; Pandolfo, C.; Stelluti, M.; Minucci, G. Ex post damage assessment: An Italian experience. Nat. Hazards Earth Syst. Sci. 2014, 14, 901–916. [Google Scholar] [CrossRef] [Green Version]
- Meyer, V.; Becker, N.; Markantonis, V.; Schwarze, R.; van den Bergh, J.C.J.M.; Bouwer, L.M.; Bubeck, P.; Ciavola, P.; Genovese, E.; Green, C. Assessing the costs of natural hazards–state of the art and knowledge gaps. Nat. Hazards Earth Syst. Sci. 2013, 13, 1351–1373. [Google Scholar] [CrossRef]
- Dottori, F.; Figueiredo, R.; Martina, M.L.V.; Molinari, D.; Scorzini, A.R. INSYDE: A synthetic, probabilistic flood damage model based on explicit cost analysis. Nat. Hazards Earth Syst. Sci. 2016, 16, 2577–2591. [Google Scholar] [CrossRef] [Green Version]
- Centre for Research on the Epidemiology of Disaster (CRED) UNISDR. The Human Cost of Natural Disasters: A Global Perspective; Centre for Research on the Epidemiology of Disaster: Brussels, Belgium, 2015. [Google Scholar]
- Gerl, T.; Kreibich, H.; Franco, G.; Marechal, D.; Schröter, K. A review of flood loss models as basis for harmonization and benchmarking. PLoS ONE 2016, 11, e0159791. [Google Scholar] [CrossRef] [PubMed] [Green Version]
- Scorzini, A.R.; Frank, E. Flood damage curves: New insights from the 2010 flood in Veneto, Italy. J. Flood Risk Manag. 2017, 10, 381–392. [Google Scholar] [CrossRef]
- Schröter, K.; Kreibich, H.; Vogel, K.; Riggelsen, C.; Scherbaum, F.; Merz, B. How useful are complex flood damage models? Water Resour. Res. 2014, 50, 3378–3395. [Google Scholar] [CrossRef] [Green Version]
- Smith, D.I. Flood damage estimation—A review of urban stage-damage curves and loss functions. Water 1994, 20, 231–238. [Google Scholar]
- Merz, B.; Kreibich, H.; Schwarze, R.; Thieken, A. Review article: Assessment of economic flood damage. Nat. Hazards Earth Syst. Sci. 2010, 10, 1697–1724. [Google Scholar] [CrossRef]
- Olesen, L.; Löwe, R.; Arnbjerg-Nielsen, K. Flood Damage Assessment–Literature Review and Recommended Procedure; Cooperative Research Centre for Water Sensitive Cities: Melbourne, Australia, 2017; Available online: https://watersensitivecities.org.au/content/flood-damage-assessment-literature-review-recommended-procedure/ (accessed on 28 November 2021).
- Carisi, F.; Schröter, K.; Domeneghetti, A.; Kreibich, H.; Castellarin, A. Development and assessment of uni-and multivariable flood loss models for Emilia-Romagna (Italy). Nat. Hazards Earth Syst. Sci. 2018, 18, 2057–2079. [Google Scholar] [CrossRef] [Green Version]
- Luino, F.; Chiarle, M.; Nigrelli, G.; Agangi, A.; Biddoccu, M.; Cirio, C.G.; Giulietto, W. A model for estimating flood damage in Italy: Preliminary results. WIT Trans. Ecol. Environ. 2006, 98, 65–74. [Google Scholar]
- Huizinga, J.; De Moel, H.; Szewczyk, W. Global Flood Depth-Damage Functions: Methodology and the Database with Guidelines; Joint Research Centre: Ispra, Italy, 2017. [Google Scholar]
- Hammond, M.J.; Chen, A.S.; Djordjević, S.; Butler, D.; Mark, O. Urban flood impact assessment: A state-of-the-art review. Urban Water J. 2015, 12, 14–29. [Google Scholar] [CrossRef] [Green Version]
- Cammerer, H.; Thieken, A.H.; Lammel, J. Adaptability and transferability of flood loss functions in residential areas. Nat. Hazards Earth Syst. Sci. 2013, 13, 3063–3081. [Google Scholar] [CrossRef] [Green Version]
- Merz, B.; Kreibich, H.; Lall, U. Multi-variate flood damage assessment: A tree-based data-mining approach. Nat. Hazards Earth Syst. Sci. 2013, 13, 53–64. [Google Scholar] [CrossRef]
- Arrighi, C.; Brugioni, M.; Castelli, F.; Franceschini, S.; Mazzanti, B. Urban micro-scale flood risk estimation with parsimonious hydraulic modelling and census data. Nat. Hazards Earth Syst. Sci. 2013, 13, 1375–1391. [Google Scholar] [CrossRef] [Green Version]
- Albano, R.; Mancusi, L.; Sole, A.; Adamowski, J. Collaborative strategies for sustainable EU flood risk management: FOSS and geospatial tools—Challenges and opportunities for operative risk analysis. ISPRS Int. J. Geo-Inf. 2015, 4, 2704–2727. [Google Scholar] [CrossRef]
- Pita, G.L.; Albornoz, B.S.; Zaracho, J.I. Flood depth-damage and fragility functions derived with structured expert judgment. J. Hydrol. 2021, 603, 126982. [Google Scholar] [CrossRef]
- Malgwi, M.B.; Schlögl, M.; Keiler, M. Expert-based versus data-driven flood damage models: A comparative evaluation for data-scarce regions. Int. J. Disaster Risk Reduct. 2021, 57, 102148. [Google Scholar] [CrossRef]
- Zischg, A.P.; Röthlisberger, V.; Mosimann, M.; Profico-Kaltenrieder, R.; Bresch, D.N.; Fuchs, S.; Kauzlaric, M.; Keiler, M. Evaluating targeted heuristics for vulnerability assessment in flood impact model chains. J. Flood Risk Manag. 2021, 14, e12736. [Google Scholar] [CrossRef]
- Pogliani, A.; Bertulessi, M.; Bignami, D.F.; Boschini, I.; Del Vecchio, M.; Menduni, G.; Molinari, D.; Zambrini, F. A Zero-Order Flood Damage Model for Regional-Scale Quick Assessments. Water 2021, 13, 1292. [Google Scholar] [CrossRef]
- Ajmar, A.; Boccardo, P.; Borglia, M.; Kucera, J.; Giulio-Tonolo, F.; Wania, A. Response to flood events: The role of satellite-based emergency mapping and the experience of the Copernicus emergency management service. In Flood Damage Survey and Assessment: New Insights from Research and Practice; John Wiley & Sons: Hoboken, NJ, USA, 2017; pp. 213–228. [Google Scholar]
- Voigt, S.; Giulio-Tonolo, F.; Lyons, J.; Kučera, J.; Jones, B.; Schneiderhan, T.; Platzeck, G.; Kaku, K.; Hazarika, M.K.; Czaran, L. Global trends in satellite-based emergency mapping. Science 2016, 353, 247–252. [Google Scholar] [CrossRef]
- Molinari, D.; Scorzini, A.R.; Arrighi, C.; Carisi, F.; Castelli, F.; Domeneghetti, A.; Gallazzi, A.; Galliani, M.; Grelot, F.; Kellermann, P. Are flood damage models converging to “reality”? Lessons learnt from a blind test. Nat. Hazards Earth Syst. Sci. 2020, 20, 2997–3017. [Google Scholar] [CrossRef]
- Regione Emilia-Romagna, Ambiente Regione Emilia-Romagna. 9 August 2021. Available online: https://ambiente.regione.emilia-romagna.it/it/notizie/allegati/allegati-2021/prot__02-03-2021_0177836-allegato-ndeg-1-relazione_di_dettaglio_sgn_-1-_timbrato.pdf (accessed on 28 November 2021).
- Thieken, A.H.; Müller, M.; Kreibich, H.; Merz, B. Flood damage and influencing factors: New insights from the August 2002 flood in Germany. Water Resour. Res. 2005, 41, W12430. [Google Scholar] [CrossRef]
- Felice, E. The roots of a dual equilibrium: GDP, productivity, and structural change in the Italian regions in the long run (1871–2011). Eur. Rev. Econ. Hist. 2019, 23, 499–528. [Google Scholar]
- Camarasa-Belmonte, A.M.; Soriano-García, J. Flood risk assessment and mapping in peri-urban Mediterranean environments using hydrogeomorphology. Application to ephemeral streams in the Valencia region (eastern Spain). Landsc. Urban Plan. 2012, 104, 189–200. [Google Scholar] [CrossRef] [Green Version]
- Pellegrini, M. The Po valley: Methods of study, geological characteristics and example of geomorphological evolution. In Proceedings of the 15th Plenary Meeting IGU Geomorphological Survey and Mapping, Modena, Italy, 7–15 September 1979; pp. 83–101. [Google Scholar]
- Istituto Nazionale di Statistica. Il mercato del lavoro 2019. In Una Lettura Integrata; Istituto Nazionale di Statistica: Rome, Italy, 2020; Volume 16, ISBN 978-88-458-2009-0. [Google Scholar]
- Rapoport, A. Spatial organization and the built environment. In Companion Encyclopedia of Anthropology: Humanity, Culture and Social Life; Rouledge: London, UK; New York, NY, USA, 1994; pp. 460–502. [Google Scholar]
- Domeneghetti, A.; Carisi, F.; Castellarin, A.; Brath, A. Evolution of flood risk over large areas: Quantitative assessment for the Po river. J. Hydrol. 2015, 527, 809–823. [Google Scholar] [CrossRef]
- Masoero, A.; Claps, P.; Asselman, N.E.; Mosselman, E.; Di Baldassarre, G. Reconstruction and analysis of the Po River inundation of 1951. Hydrol. Processes 2012, 27, 1341–1348. [Google Scholar] [CrossRef] [Green Version]
- Orlandini, S.; Moretti, G.; Albertson, J.D. Evidence of an emerging levee failure mechanism causing disastrous floods in Italy. Water Resour. Res. 2015, 51, 7995–8011. [Google Scholar] [CrossRef] [Green Version]
- Mazzoleni, M.; Bacchi, B.; Barontini, S.; Di Baldassarre, G.P.M.; Ranzi, R. Flooding hazard mapping in floodplain areas affected by piping breaches in the Po river, Italy. J. Hydrol. Eng. 2014, 19, 717–731. [Google Scholar] [CrossRef]
- Camuffo, D.; Enzi, S. The analysis of two bi-millennial series: Tiber and Po river floods. In Climatic Variations and Forcing Mechanisms of the Last 2000 Years; Springer: Berlin/Heidelberg, Germany, 1996; pp. 433–450. [Google Scholar]
- Istituto Nazionale di Statistica. Atti Del 9° Censimento Generale Dell’Industria E Dei Servizi E Censimento Delle Istituzioni Non Profit, Le Sezioni Di Censimento; Istituto Nazionale di Statistica: Rome, Italy, 2011.
- Cacace, F.; Zuccaro, G.; De Gregorio, D.; Perelli, F.L. Building Inventory at National scale by evaluation of seismic vulnerability classes distribution based on Census data analysis: BINC procedure. Int. J. Disaster Risk Reduct. 2018, 28, 384–393. [Google Scholar] [CrossRef]
- Notti, D.; Giordan, D.; Caló, F.; Pepe, A.; Zucca, F. Potential and limitations of open satellite data for flood mapping. Remote Sens. 2018, 10, 1673. [Google Scholar] [CrossRef] [Green Version]
- Inès, J.-B.; Annett, W.; Simone, D. Manual for CEMS-Rapid Mapping Products; Publications Office of the European Union: Luxembourg, 2020. [Google Scholar]
- Rojas, R.; Feyen, L.; Watkiss, P. Climate change and river floods in the European Union: Socio-economic consequences and the costs and benefits of adaptation. Glob. Environ. Chang. 2013, 23, 1737–1751. [Google Scholar] [CrossRef]
- Köppen, W. Das geographische system der klimat. Handbuch Der Klimatologie; Gebrüder Borntraeger Verlagsbuchhandlung: Berlin, Germany, 1936; Volume I. [Google Scholar]
- Fratianni, S.; Acquaotta, F. The climate of Italy. In Landscapes and Landforms of Italy; Soldati, M., Marchetti, M., Eds.; Springer International Publishing: Berlin/Heidelberg, Germany, 2017; pp. 29–38. [Google Scholar]
- Pinna, M.; Vittorini, S. Contributo alla determinazione dei regimi pluviometrici in Italia. Soc. Geogr. Ital. 1989, 39, 147–168. [Google Scholar]
- Guzzetti, F.; Cardinali, M.; Reichenbach, P. The AVI Project: A bibliographical and archive inventory of landslides and floods in Italy. Environ. Manag. 1994, 18, 623–633. [Google Scholar] [CrossRef]
- Terranova, O.G.; Gariano, S. Rainstorms able to induce flash floods in a Mediterranean-climate region (Calabria, Southern Italy). Nat. Hazards Earth Syst. Sci. 2014, 14, 2423–2434. [Google Scholar] [CrossRef] [Green Version]
- Istituto Nazionale di Statistica. Censimento della Popolazione e delle Abitazioni; Istituto Nazionale di Statistica: Rome, Italy, 2011.
- Istituto Nazionale di Statistica. Costruzioni, Censimento ISTAT; Istituto Nazionale di Statistica: Rome, Italy, 2011.
- Lee, K.; Flamant, C.; Ducrocq, V.; Duffourg, F.; Fourrié, N.D.S. Convective initiation and maintenance processes of two back-building mesoscale convective systems leading to heavy precipitation events in Southern Italy during HyMeX IOP 13. Q. J. R. Meteorol. Soc. 2016, 142, 2623–2635. [Google Scholar] [CrossRef]
- Buzzi, A.; Foschini, L. Mesoscale Meteorological Features Associated with Heavy Precipitation in the Southern Alpine Region. Meteorol. Atmos. Phys. 2000, 72, 131–146. [Google Scholar] [CrossRef]
- Frigerio, I.; De Amicis, M. Mapping social vulnerability to natural hazards in Italy: A suitable tool for risk mitigation strategies. Environ. Sci. Policy 2016, 63, 187–196. [Google Scholar] [CrossRef]
- Bignami, D.F.; Dragoni, A.; Menduni, G. Assessing and improving flood and landslide community social awareness and engagement via a web platform: The case of Italy. Int. J. Disaster Risk Sci. 2018, 9, 530–540. [Google Scholar] [CrossRef] [Green Version]
- Frigerio, I.; Carnelli, F.; Cabinio, M.; De Amicis, M. Spatiotemporal pattern of social vulnerability in Italy. Int. J. Disaster Risk Sci. 2018, 9, 249–262. [Google Scholar] [CrossRef] [Green Version]


| Damaged Properties | Number of Claims | Total Observed Damage |
|---|---|---|
| Main dwellings | 2394 | EUR 47,5 M |
| Holiday houses | 237 | EUR 4,5 M |
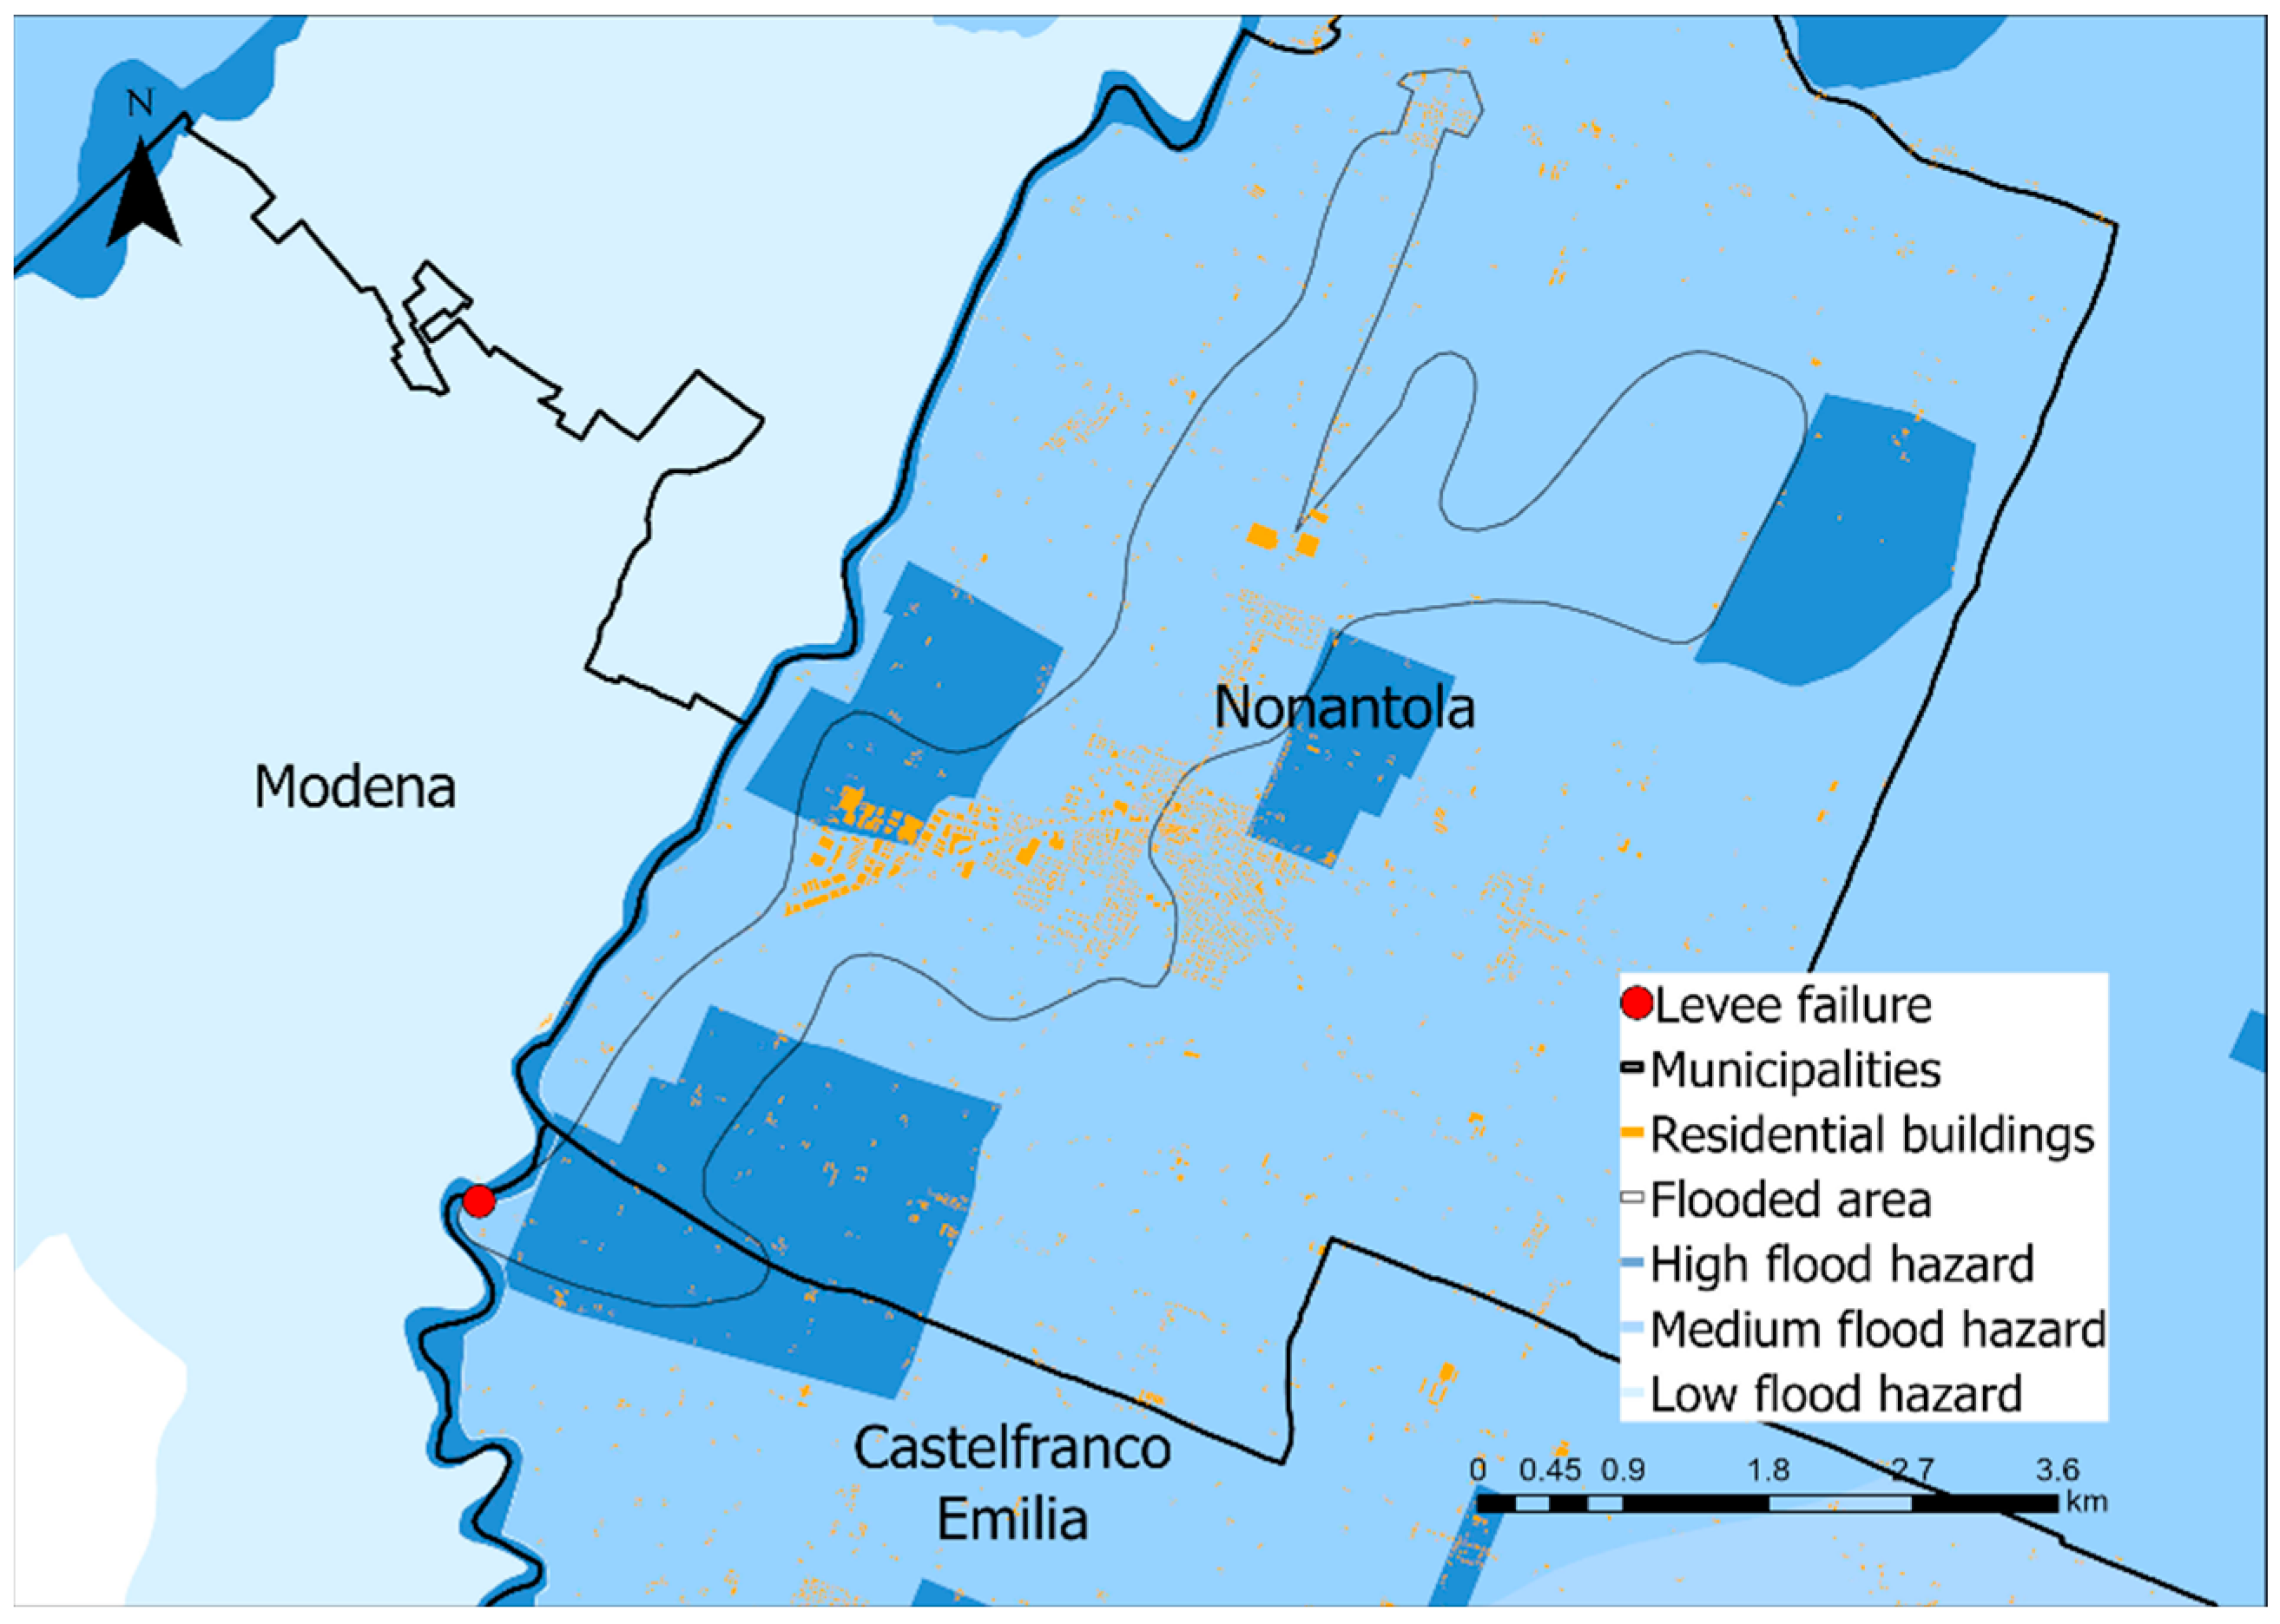
| Municipality | Flooded Area | Estimated Damage D | Observed Damage D0 | Error |
|---|---|---|---|---|
| Castelfranco Emilia | 926.67 m2 | 77,900 EUR | 466,400 EUR | 83% |
| Nonantola | 367,109.93 m2 | 24,3 MEUR | 48,6 MEUR | 50% |
| Main Indexes | Po-Venetian Plain | Southern Italy | Relative Difference |
|---|---|---|---|
| Surface area (km2) | 64,662 | 84,339 | −23% |
| Inhabitants (-) | 19,478,791 | 17,244,202 | +13% |
| Density (km−2) | 301 | 204 | +47% |
| GDP (millionEUR) | 703,193 | 314,523 | +124% |
| Per capita GDP (EUR) | 36,100 | 18,239 | +98% |
| Net annual income per family (EUR) | 34,427 | 25,783 | +34% |
| Po-Venetian Plain | Southern Italy | |
|---|---|---|
| Exponent (-) | 0.96 | 0.96 |
| Coefficient (EUR/m2) | 110.47 | 532.14 |
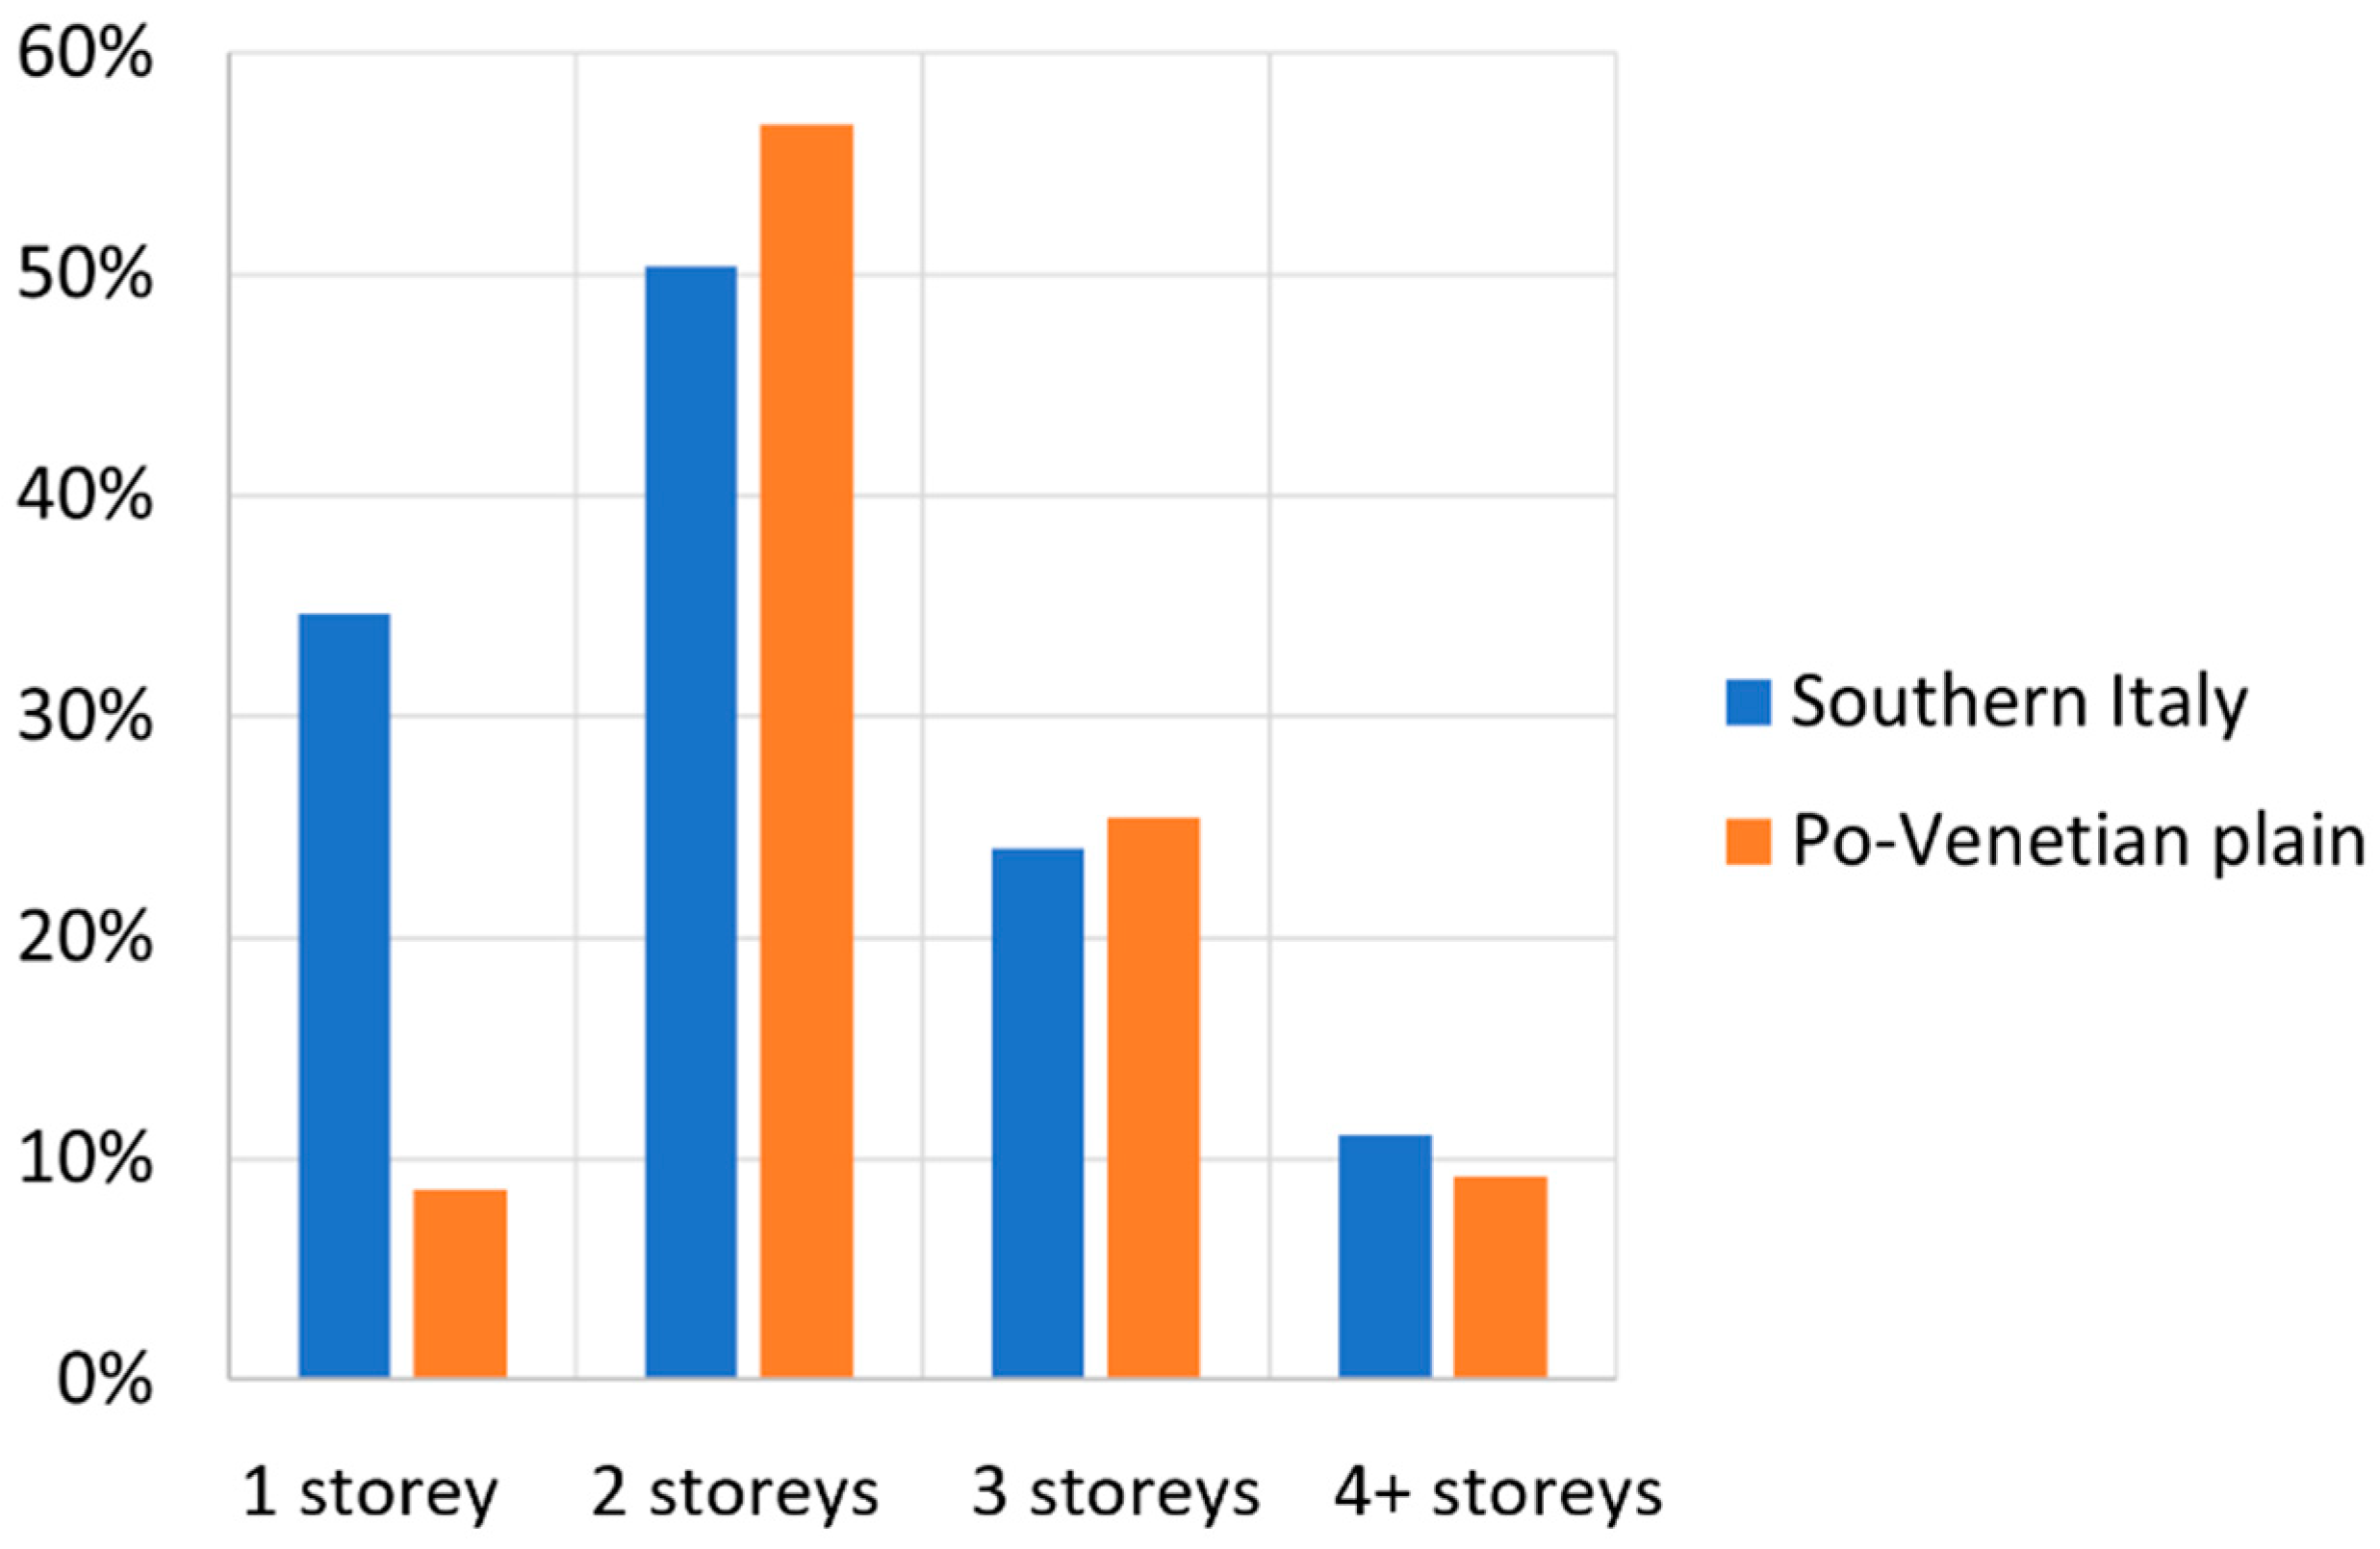
| Main Features | Nonantola | Castelfranco Emilia |
|---|---|---|
| Surface (km2) | 55.32 | 102.51 |
| Inhabitants (-) | 16,119 | 33,046 |
| Density (km−2) | 291.38 | 322.37 |
| Elevation (m a.s.l.) | 20 | 40 |
| Total residential buildings | 6349 | 15,029 |
| Buildings with 1 floor | 54 | 274 |
| Buildings with 2 floors | 1218 | 2186 |
| Buildings with 3 floors | 919 | 1348 |
| Buildings with 4+ floors | 113 | 552 |
| Classification of degree of urbanization | Town and suburbs | Rural areas |
| Low flood hazard mapping surface (km2) | 55.32 (100%) | 102.24 (100%) |
| Medium flood hazard mapping surface (km2) | 55.32 (100%) | 102.24 (100%) |
| High flood hazard mapping surface (km2) | 8.09 (15%) | 8.19 (8%) |
Publisher’s Note: MDPI stays neutral with regard to jurisdictional claims in published maps and institutional affiliations. |
© 2022 by the authors. Licensee MDPI, Basel, Switzerland. This article is an open access article distributed under the terms and conditions of the Creative Commons Attribution (CC BY) license (https://creativecommons.org/licenses/by/4.0/).
Share and Cite
Manselli, L.; Molinari, D.; Pogliani, A.; Zambrini, F.; Menduni, G. Improvements and Operational Application of a Zero-Order Quick Assessment Model for Flood Damage: A Case Study in Italy. Water 2022, 14, 373. https://doi.org/10.3390/w14030373
Manselli L, Molinari D, Pogliani A, Zambrini F, Menduni G. Improvements and Operational Application of a Zero-Order Quick Assessment Model for Flood Damage: A Case Study in Italy. Water. 2022; 14(3):373. https://doi.org/10.3390/w14030373
Chicago/Turabian StyleManselli, Luca, Daniela Molinari, Arianna Pogliani, Federica Zambrini, and Giovanni Menduni. 2022. "Improvements and Operational Application of a Zero-Order Quick Assessment Model for Flood Damage: A Case Study in Italy" Water 14, no. 3: 373. https://doi.org/10.3390/w14030373
APA StyleManselli, L., Molinari, D., Pogliani, A., Zambrini, F., & Menduni, G. (2022). Improvements and Operational Application of a Zero-Order Quick Assessment Model for Flood Damage: A Case Study in Italy. Water, 14(3), 373. https://doi.org/10.3390/w14030373