Article

Performance Evaluation and Water Availability of Canal Irrigation Scheme in Punjab Pakistan

by
Imran Sajid
1,*,
Bernhard Tischbein
1,
Christian Borgemeister
1 and
Martina Flörke
2
1
Center for Development Research (ZEF), University of Bonn, 53113 Bonn, Germany
2
Engineering Hydrology and Water Resources Management, Ruhr-Universität Bochum, 44801 Bochum, Germany
*
Author to whom correspondence should be addressed.
Water 2022, 14(3), 405; https://doi.org/10.3390/w14030405
Submission received: 4 January 2022 / Revised: 25 January 2022 / Accepted: 26 January 2022 / Published: 28 January 2022
(This article belongs to the Section Water Resources Management, Policy and Governance)

Abstract

:
The supply of surface water by century-old infrastructure causes substantial water loss and triggers huge abstractions of groundwater, resulting in low irrigation efficiency. We evaluated the irrigation performance (application and conveyance efficiencies) and water availability (supply-demand) from the field to the Mungi Distributary canal level in Punjab, Pakistan. Between April–September 2019 and 2020, we monitored water delivery in the canal network, soil moisture content in cotton fields, and the canal and groundwater quality. The crops’ actual evapotranspiration was estimated using the AquaCrop model. We found conveyance efficiencies >90% for minor distributaries, 70–89% for watercourses, and ~75% for field ditches per kilometer. Field application efficiency was >90% for drip and ~35% for flood basin, whereas for raised-bed furrow, conventional furrow, and ridge-furrow irrigation methods, it varied between 44% and 83%. The deficits of canal water supply versus demand for cotton fields ranged from 45% to 73%, whereas the Mungi Distributary canal water showed a 68.6% and 19.8% shortfall in the April–September and October–March seasons of 2018/2019, respectively. The study suggests prioritizing improvements to field water application rather than canals with better water quality; additionally, surplus water from the Mungi canal in November and December could be stored for later use.

1. Introduction

In Pakistan, irrigated agriculture is the major consumer of surface and groundwater [1]. Main crops, such as wheat, sugarcane, rice, and cotton, account for ~80% of all water consumption in the country [2]. Pakistan’s surface water originates mainly from precipitation during the monsoon period (April–September) and snowmelt from the Himalayas. The Indus basin is the primary supplier of surface water to the country through five tributaries: the Indus, Jhelum, Sutlej, Chenab, and Ravi. The Indus Basin Irrigation System (IBIS) feeds the withdrawals from these rivers into a complex and extensive network of canals and conveying water to farmers [3].
The IBIS is considered the world’s most extensive contiguous irrigation system that regulates water at three systems levels in the network of the canals. The primary system comprises of large main and branch canals that convey water to the major and minor distributaries in the secondary system, while the major distributaries supply water to minor irrigation canals that permit a fixed water flow to smaller channels that are called watercourses (the tertiary system). The Warabandi principle guides the surface water allocation to all farmers with fields along each watercourse based on fixed seven day turns [4].
Public authorities have regulated surface water distribution in the IBIS based on the Warabandi principle, which was put in place over a century ago. Under Warabandi, surface water is distributed in a fixed rotation of once a week for a specific time window in a pre-determined schedule specifying day, time, and duration of canal water supply that is proportional to the size of land that each farmer holds [5]. The main purpose of the Warabandi was to cope with the water scarcity condition in the area by irrigating as much land as possible with limited surface water to sustain an equitable distribution of available water to farmers [3].
The Warabandi rule remains challenging in addressing the current surface water distribution in the irrigation sector, despite being relatively easy to run and control by public administration. For instance, it is a fixed supply-based irrigation form that does not correspond to crops’ time-dependent water requirements and does not consider soil properties and rapid environmental changes (climate variability and change). In addition, it does not compensate for conveyance water losses along the canals that leads to lower water allowance of tail canal users [4,5]. The limited availability of surface water to farmers under Warabandi results in the uncontrolled pumping of groundwater (due to lack of regulation over access to groundwater) by farmers to overcome the limited canal water supply and to bring some flexibility in the rigid schedules in the canal system to fulfill the time-dependent crop demand [6].
Punjab is the most populous province in Pakistan, and 56% of the IBIS is found there. The province accounts for 69% of the total cropping area of the country and is known as the biggest consumer of water in the irrigation sector [7]. Sugarcane (annual crop), rice, and cotton are highly water-demanding crops that are grown in April–September during the monsoon season (Kharif) in Punjab [8]. Wheat and fodder crops are dominant in the second growing season of October–March (Rabi season), which is rather dry in Punjab in terms of rainfall, and the major canals are closed for maintenance mostly for a month [9].
Punjab, as part of IBIS, is facing severe water scarcity due to several problems in the irrigation sector. These obstacles include a rise in water demand due to population growth and an increase in cropping intensity to ~120%, whereas the IBIS was designed for a cropping intensity of 60–80% [10]. Furthermore, it is projected that by 2025, Pakistan would experience a 30% deficit in surface water that is attributed to siltation in reservoirs and it could be under pressure due to sharpening competition for water (industry, drinking water provision ecology/environmental flow, agriculture) and the impact of climate change (increasing evapotranspiration by rising temperatures), which will result in irrigation water scarcity in the country [11,12]. The combination of the shortfall of surface water and increased water demand has led to the uncontrolled abstraction of groundwater that has resulted in secondary salinization. Although abstracted groundwater is widely used in Punjab, surface water is in high demand for its good quality. However, old irrigation infrastructure and poor operation and maintenance in Punjab result in low delivery efficiency [13], leading to the inequitable and unreliable distribution of surface water, particularly to tail-end users. Additionally, the gap between supply and demand is further aggravated by poor on-farm water management techniques, such as insufficiently leveled fields and conventional and traditional surface irrigation methods that have a low application efficiency of ~35% [13,14,15,16].
Several studies have been conducted to address the irrigation water challenges in Punjab province. Some studies have used remote sensing data to estimate irrigation relevant indicators at a large scale [17,18,19,20,21,22,23,24], whereas other studies have examined the overall state of the canal irrigation scheme by carrying limited measurements in farmers’ fields and canals in remote areas of Punjab [2,9,10,25,26,27,28,29]. However, the development of water supply–demand strategies necessitate tangible information on the actual field conditions. Therefore, in this study, repeated measurements from farmers’ fields to the distributary canal level in distant areas of Punjab were used for an in-depth evaluation of the overall canal irrigation scheme performance.
This study is based on two years (2019 and 2020) of intensive fieldwork over a large command area of the Mungi Distributary canal irrigation scheme. To add value to the quality of the results and represent the entire irrigation scheme, different types of irrigation canals and cultivation methods were considered at the head, mid, and tail of the Mungi Distributary canal. Therefore, discharges in the minor distributary canals, watercourses, and field ditches were measured. The most common irrigation methods for cotton cultivation were selected (drip, flood basin, raised bed and furrow, conventional furrow, and ridge bed methods) and evaluated based on the field water balance parameters using in-depth analysis of the soil moisture content in the root zone of the crop. Additionally, Aquacrop, as an atmosphere-soil-water-crop model [30], was applied to enhance the estimation of actual evapotranspiration for commonly grown crops in the command area. Moreover, the estimated magnitude of pumped groundwater could be used as an entry-point for further studies on water-food-energy nexus including the issues of energy (fuel) demand and CO2-emissions.
The primary aim of this study was to evaluate the performance (conveyance and field application efficiencies) of the Mungi canal irrigation scheme and compare the actual canal water supply to crops’ demand related to the field, farm, and the Mungi Distributary canal level. The study provides field-based information to inform decisions on water supply–demand strategies.

2. Materials and Methods

The study structure is depicted in Figure 1 and is based on primary and secondary data collection. Primary data were gathered during the Kharif season in 2019 and 2020, including soil moisture content, field/canal discharge measurements, and interviews of farmers on crops phenological stages, yield, and field management activities, while the secondary data comprises of land cover data of Mungi (2018–2019 cropping seasons), the daily discharge of major canals, and climatic parameters of the area. The obtained data were used as input to the AquaCrop model to estimate the crops’ actual evapotranspiration, and empirical equations were used to determine conveyance/application efficiencies and water supply–demand. Methods are described in more detail below.

2.1. Description of the Study Area

The study was conducted at the cultivable command area of Mungi Distributary canal, which is fed by the Lower Chenab Canal (LCC) through the Gugera canal in Punjab. It is located between 30° 33′ to 31° 2′ N and 72° 08′ to 72° 48′ E with a rather flat topography featuring an elevation of 184 m above sea level. The head and tail design discharge values of the Mungi Distributary canal are ~4.6 and ~0.17 m3 s−1, respectively. The gross command area is ~20,290 ha, and the cultural command area is ~17,683 ha based on the information that is provided online at Punjab Irrigation Department [31].
The focus of this study was on cotton, which is dominating the cultivation in the Mungi area during Kharif season as a crop with high water demand. Table 1 presents the information on the selected fields. The fields were selected on the basis of their location along the Mungi canal (head, middle, and tail) and the use of different irrigation methods that are commonly used for cotton cultivation in Punjab. All fields are within the Mungi Distributary canal command area (CCA), except Field D (drip method), which is located at the Sumandry site next to Mungi Distributary CCA. Figure 2 shows the locations of fields and canal discharge measurement points.
Farm G was located at the tail of a watercourse that takes water from the Reakla minor distributary in the upper part of Mungi Distributary canal. It has 23.5 ha of land-cultivating cropping patterns, as illustrated in Table 2. In Farm G, the monitoring of 0.4 ha (one acre) of cotton plot practicing the raised bed and furrow method was considered for canal water supply and demand analysis.

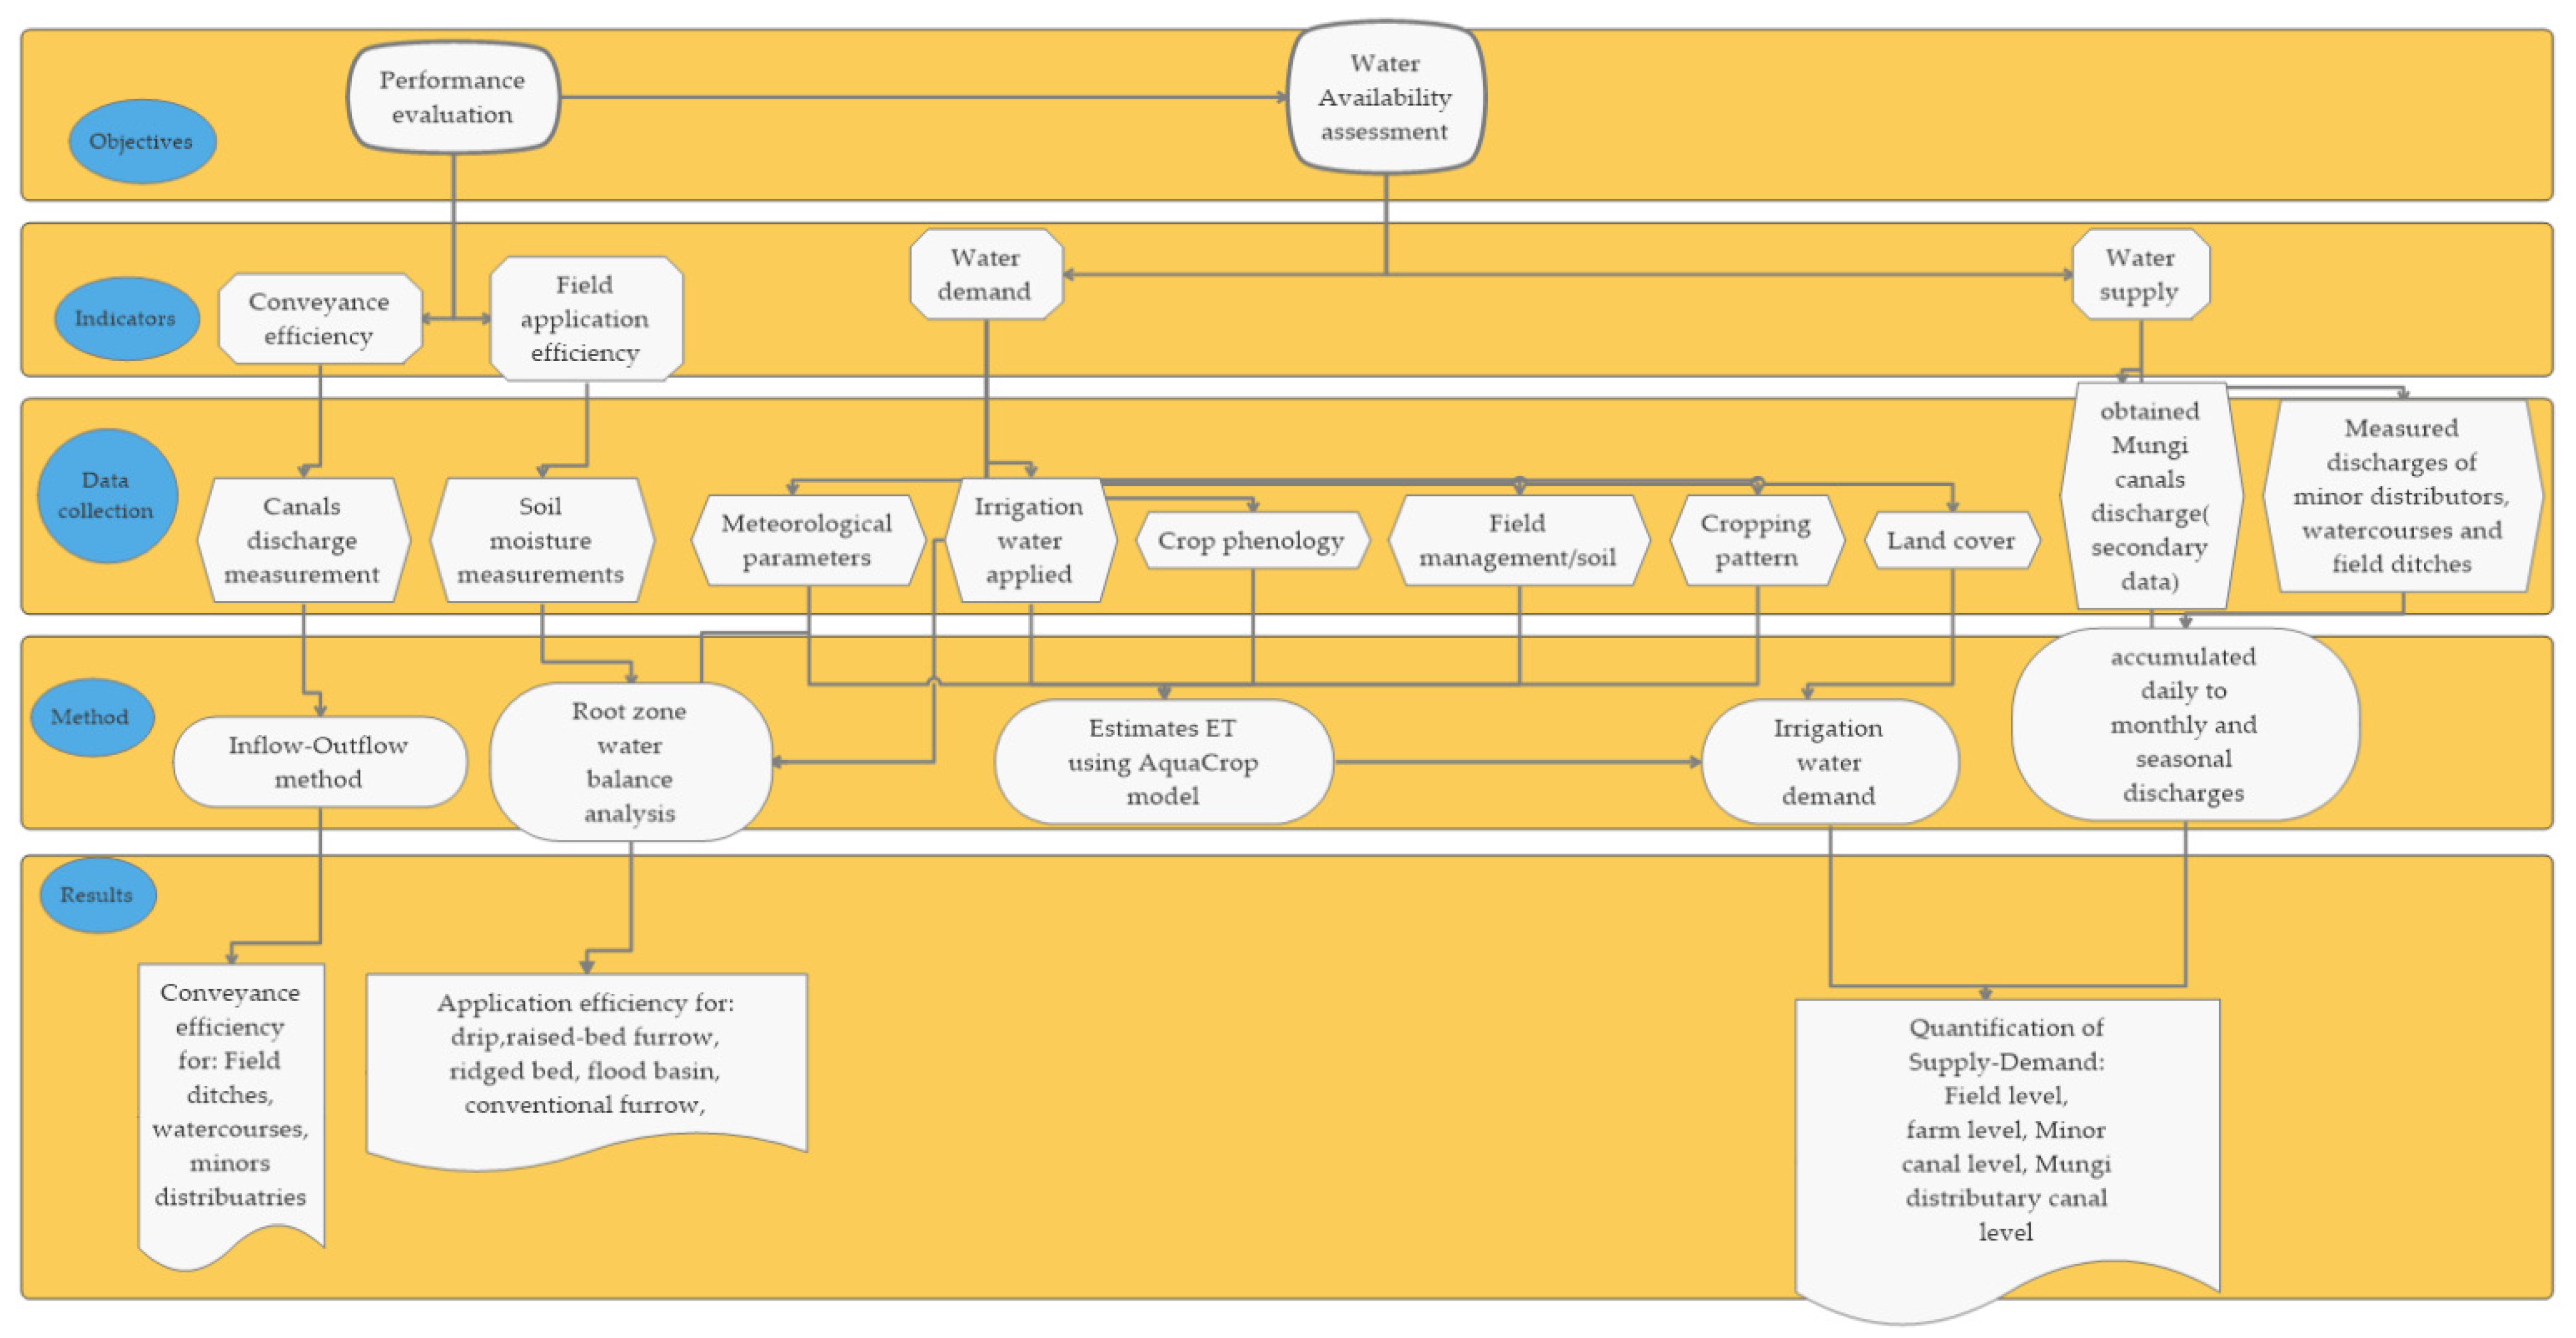
2.2. Irrigation Scheme Performance Evaluation

2.2.1. Measurements for Conveyance Efficiency

The discharge in the network of canals in Mungi Distributary CCA was measured using an M1 mini current meter [32], and the water losses in the canals were determined by the inflow-outflow method. During each measurement, an observation walk was conducted along each canal from the inflow to the outflow points to exclude that any outlet gets water before the outflow of the canal. Also, the discharge in the channels was measured repeatedly to minimize uncertainties. Figure 2 depicts the measurement points in the selected canals. A total of three important minor distributaries of the Mungi Distributary canal were considered: Reakla minor distributary (points 1–3) in the upper part, one minor distributary (points 7–8) in the middle, and Mungi minor distributary (points 10–11) in the lower section of Mungi Distributary canal. Additionally, two watercourses (points 3–4 and 3–5) and a field ditch (points 5–6) in the upper part and one field ditch(points 8–9) in the middle part of the Mungi Distributary canal were selected for measurements representing canals of major categories in the area and lined and unlined reaches were included.

2.2.2. Determination of the Irrigation Application Efficiency

The application efficiency is the ratio of the amount of irrigation water that is stored in the crop’s root zone to the water that is directed to the field. In this study, an in-depth analysis of the root zone water balance was considered following Equation (1) [33]:
A P E f = W A W B + n E T W i + W r × 100
where A P E f is the application efficiency, W A is the depth of soil moisture in mm (in the 1 m root depth of the crop) after an irrigation event, W B is the depth of soil moisture in mm (in the 1 m root depth) before an irrigation event, n is the number of days between sampling of the soil moisture before and after irrigation events, ET represents the evapotranspiration (mm) of the crop in the period of the two samplings, W i is the depth of the irrigation water applied (mm), and W r is the amount of rainfall during the two sampling periods (mm).
The application efficiency was solely estimated for cotton crop cultivation methods considering the crop’s one-meter root depth based on observation and to be comparable in all fields for soil moisture measurements. The applied water at each field by a canal, a tube well, or both was measured using a Cutthroat flume with a length of 1.2 m and width of 0.9 m. It was placed at the inlet of each field parallel to the direction of flow and leveled on all sides using a leveler. Once the flow was constant, the upstream and downstream readings were noted to determine the discharge.

2.2.3. Soil Moisture Measurements

The soil moisture content of each cotton field was measured periodically, yet always before and after irrigation events using an ML3 Theta Probe as a mobile soil moisture sensor. The user manual of the ML3 Theta Probe mobile sensor is provided online [34]. An auger was used to collect soil samples at intervals of 20 cm down to a depth of 100 cm at three random locations in each field: head, middle, and tail. The volumetric readings of each interval of soil samples were obtained using the soil moisture sensor in the field. Then, the samples were weighed in the field and brought to the laboratory. The samples were dried at 105 °C for 24 h in the oven to determine the gravimetric soil water content. The obtained gravimetric soil water content was multiplied by the bulk density of the referenced soil sample to attain the volumetric soil water content that was used for calibration of the soil moisture sensor’s reading.

2.3. Water Availability Assessment

We compared gross irrigation demand that was estimated from data that were collected in the fields, the Punjab Irrigation Department, and the AquaCrop modeling versus canal water supplied.

2.3.1. Water Demand

Mungi Land Cover

The land cover of the Mungi Distributary CCA was obtained from the Punjab Irrigation Department and reveals the share of major crops that are cultivated in the Kharif and Rabi seasons of 2018/2019 (Figure 3). The dominant Kharif season crops were cotton, which covered >38% of the area and rice, whereas the dominant Rabi season crop was wheat, which was cultivated on 64% of the command area and fodder.

Application of AquaCrop Model

Aquacrop, as an atmosphere-soil-water-crop model, can estimate the evapotranspiration of crops using Penman–Monteith equation [30], and was used to determine the actual evapotranspiration of the common crops that were grown in the area that is depicted in Figure 3. The Rabi crops in the Mungi area were wheat, fodder (berseem), tomato, potato, canola, and maize. While the Kharif crops that were cultivated as cotton, rice, fodder (sorghum), maize, and okra. Sugarcane and orchards (mainly citrus) were considered annual crops.
Most of the crops that were grown in the Mungi area were cultivated by the farmer in Farm G. Therefore, the crops information such as crop phenological stages, irrigation scheduling for each crop, and field management relevant information was obtained by interview questionnaires from the farmer of Farm G, and used reference data representing the Mungi Distributary CCA. In addition, this information was cross-checked by other selected farmers in fields A, B, C, D, E, and F. The input data for the AquaCrop model, including climate, crop phenological stages, irrigation application, soil properties, and field management are described in more detail below.
Climatic data: parameters such as maximum and minimum air temperature, solar radiation, rainfall, relative humidity, and wind speed were collected from the meteorological station of the University of Agriculture Faisalabad (UAF) from January 2008 to November 2020. It is an established physical meteorological station that is operated by officials and the nearest station in a distance of 62 km to the Mungi area. It has instruments to measure and record the mentioned meteorological parameters and broadcast them based on daily time steps online [35]. The average annual rainfall is ~411 mm (considering 2008–2020) for Faisalabad city and occurs generally during the monsoon season: July–September. The temperature can reach up to ~45 °C in summer, whereas might drop to ~0 °C in winter.
Crop phenological stages: information on each of the crop development stages, such as the plant density, sowing and harvest time, duration of flowering, time to reach emergence, maximum canopy, flowering, senescence, crop maturity, and the estimated yield were obtained.
Irrigation water application: irrigation method, depth of water application (the discharge of canal water and tube well water of Farm G was measured), number of irrigation events, and the duration of irrigation for each crop was obtained by the farmer of Farm G. The groundwater contribution via capillary rise was negligible in the Mungi area, as groundwater is found at a depth of >10 m from the surface.
Field management: field management practices for each crop, such as weed management percentage estimation, surface runoff in field (closed-end field), and applicability of mulches were attained.
Soil: soil textures of Mungi area are considered as loamy soils with relevant field capacity and wilting point of loamy soils as 31 and 15%, respectively (samples were taken from all cotton-selected fields in Figure 2 and tested in the lab that determined the soil texture in upper, middle, and lower part of Mungi as mostly loamy soil).
The Aquacrop model was calibrated for each crop grown in the Mungi using the model default referenced crop file and tuned based on the crop phenological stages and field management practices, while the obtained yield of the crops by the farmers were considered in the output of the model. The actual evapotranspiration of all crops was calculated using the Aquacrop model (considering the gross water that was applied to each field of the crop), except for citrus tree, which was designated as orchards, and its actual evapotranspiration was estimated by the CropWat model.

Irrigation Water Requirement

The irrigation water demand from the field to the Mungi Distributary canal level was evaluated by calculating the actual evapotranspiration of crops that were cultivated in Mungi area, crop water requirements, net, and gross irrigation water requirements.
The water requirement of each crop in the Mungi command area was calculated using Equation (2).
C W R i = E T i P e f f
where C W R i is the crop water requirement for a given crop i, E T i is the evapotranspiration of crop i, and P e f f is the effective rainfall considering the same period of growth for crop i.
The net irrigation water requirement (NIWR) is “the quantity of water necessary for crop growth” [36]. It depends on the effective rainfall and cropping pattern of the site, and it is described in Equation (3):
N I W R = i = 1 n C W R i S i S
where S i is the cultivated area under crop i and n is the number of crops that are grown in the area. S is the total cultivable command area.
The gross irrigation water requirement (GIWR) is “the quantity of water to be applied in reality, taking into account water losses” [36]. It is essential to have information on the irrigation efficiency of the scheme to calculate the GIWR from the NIWR (see Equation (4)). The total water requirement of the study area is obtained when the GIWR is multiplied by the area under cultivation.
G I W R = 1 E N I W R
In Equation (4), E is the overall irrigation efficiency of a system that considers conveyance and application efficiencies.

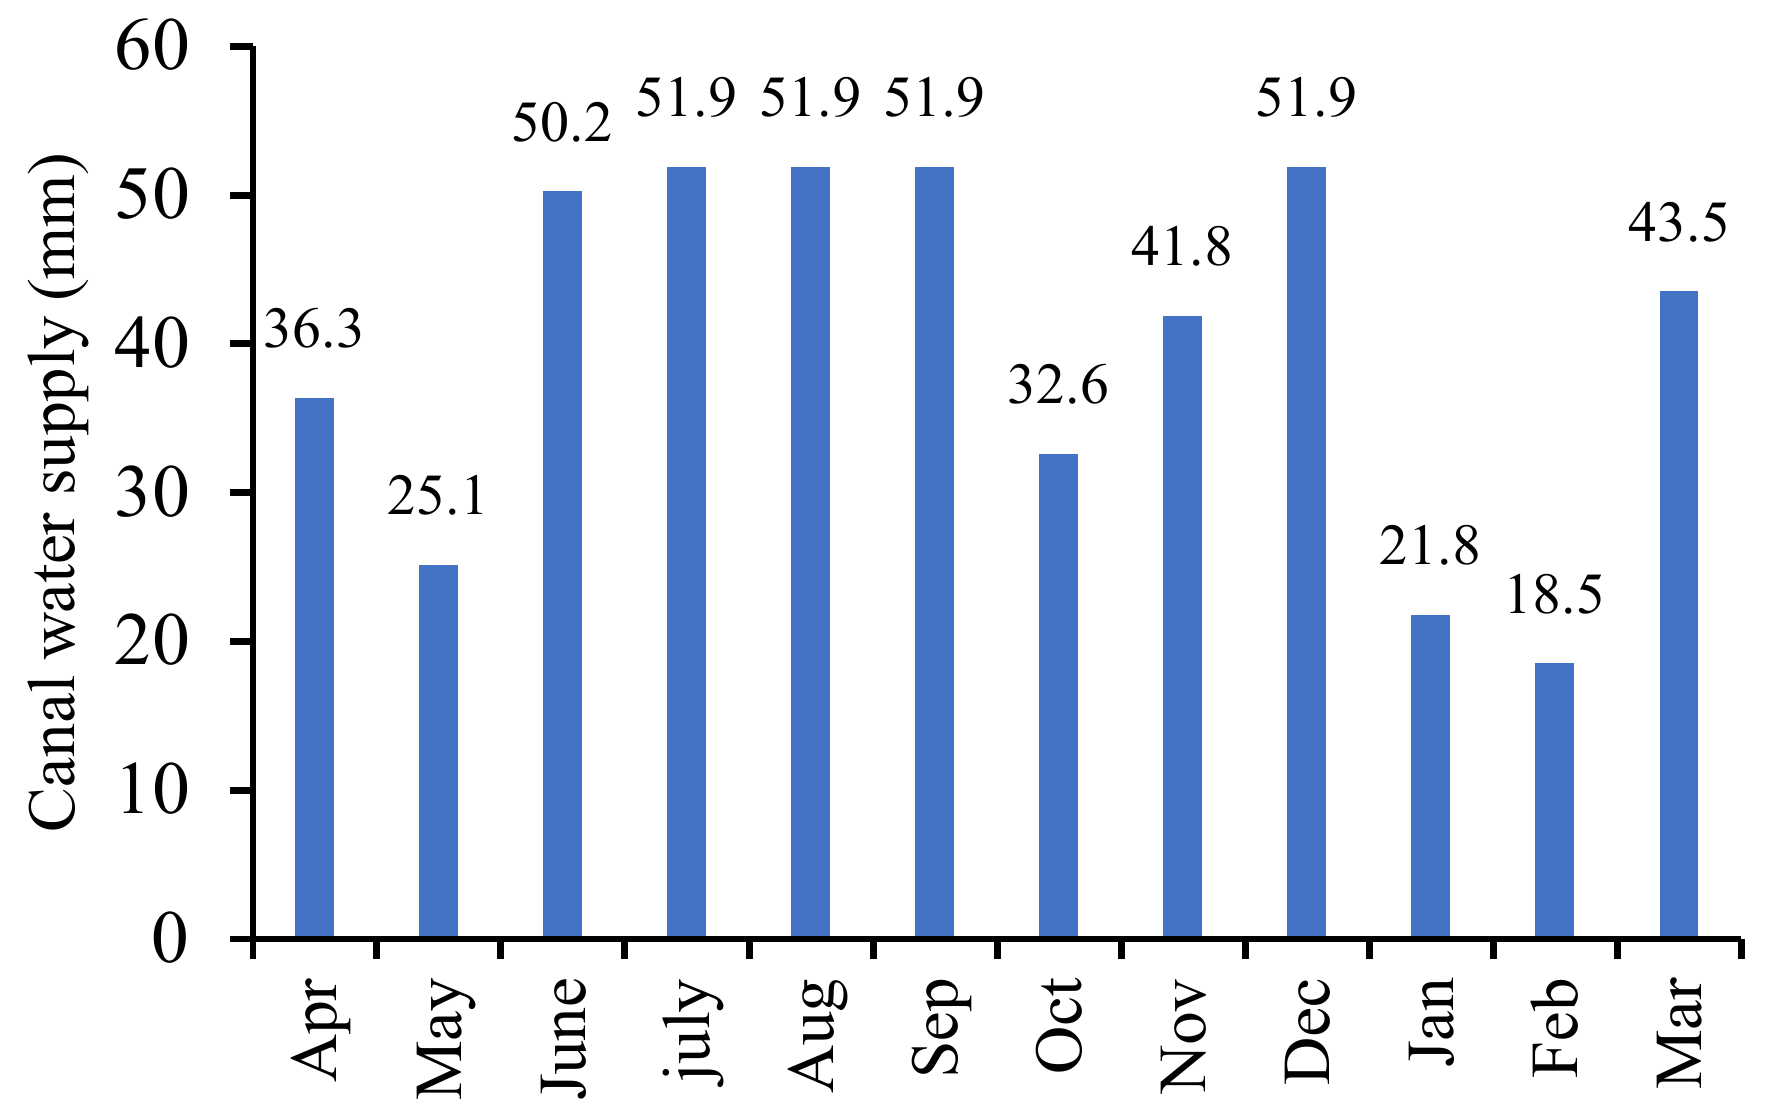
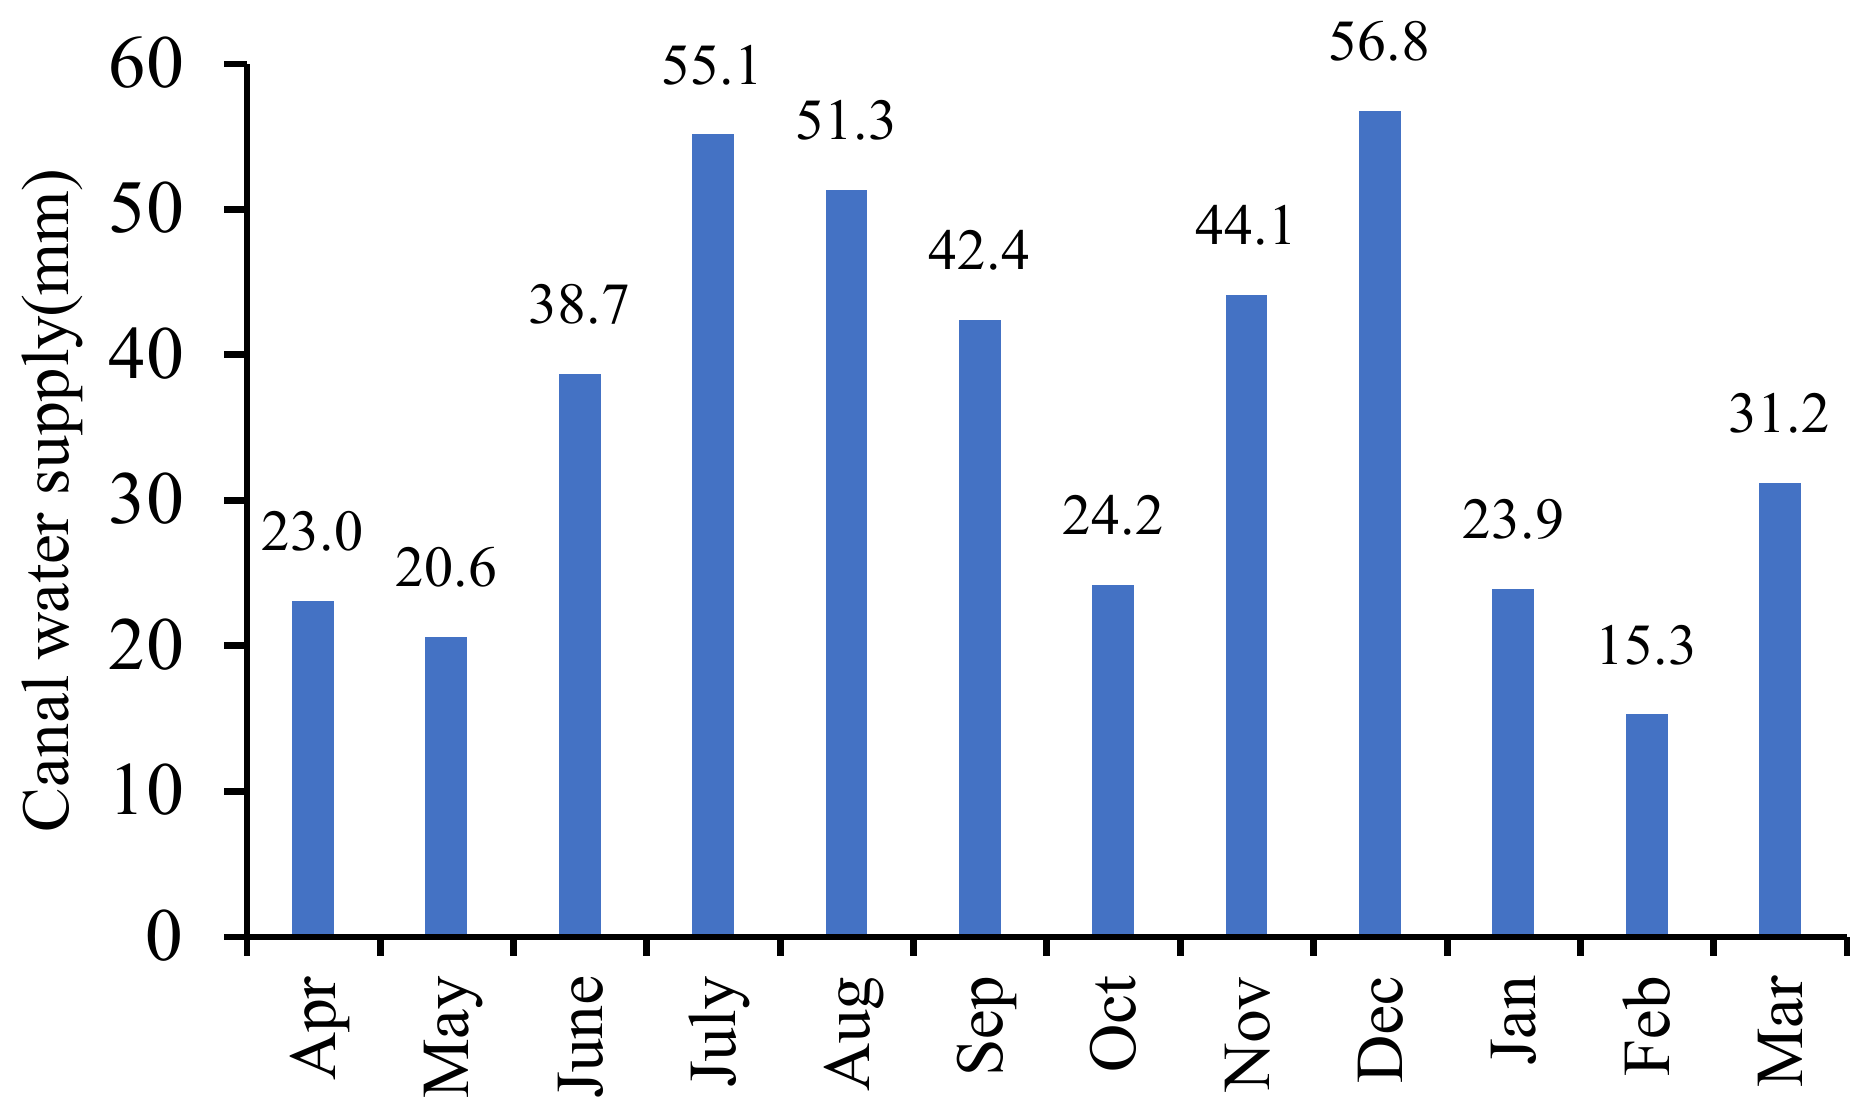
2.4. Water Supply of Irrigation Canals

The daily water allocations at the head of the Mungi minor distributary and Mungi Distributary canal for the Kharif and Rabi seasons of 2018/2019 were obtained from the Punjab Irrigation Department (PID) website portal [31], while, for the same period, the daily allowance of Reakla minor distributary was attained from the office of PID. Furthermore, Reakla and Mungi minor distributaries’ head discharges were measured using the current meter in the field, while their command areas are provided in Figure 2 and the share of crops on these command areas were masked out from land cover in Figure 3.
Reakla is the first minor distributary that takes water from the Mungi Distributary canal (as depicted in Figure 2) and is lined. It irrigated ~919 ha of land in the Kharif season and ~827 ha of land in the Rabi season of 2018/2019. As shown in Figure 4, the gross irrigation amount that was provided as inflow to Reakla minor distributary in 2018/2019 was ~267 mm for the Kharif season, whereas it was reduced to ~210 mm for the Rabi season because of the closure of the Mungi canal for maintenance.
The Mungi minor distributary is the last large minor distributary that is located at the tail part of the Mungi Distributary canal, as shown in Figure 2. The head discharge of this minor distributary was 0.28 m3 s−1 when Mungi Distributary canal was at the full supply level. It provided canal water to ~1341 ha of irrigated land in the Kharif season and ~1218 ha in the Rabi season of 2018/2019. The gross irrigation water inflow at the head of Mungi minor distributary was ~231 mm in the Kharif season and ~195 mm in the Rabi season of 2018/2019 (Figure 5).
The Mungi Distributary canal provided water to ~21,194 ha of irrigated land in the Kharif season, whereas it reduced to ~19,416 ha in the Rabi season of 2018/2019 based on the land cover of the canal command area that is presented in Figure 3. The gross water inflow at the head of the Mungi Distributary canal during the Kharif season was ~259 mm, whereas during the Rabi season, it was ~227 mm in 2018/2019 (Figure 6). The Mungi Distributary canal is closed for more than a month (mostly mid-January to mid-February) of the year for the maintenance of canals, according to farmers and records on the Punjab Irrigation Department website.

3. Results

3.1. Irrigation Scheme Performance Evaluation

3.1.1. Conveyance Efficiency of Canals

Table 3 shows the results as losses per unit of wetted area per unit time and the conveyance efficiency per kilometer reach. Figure 2 depicts the measurement points at each canal.
According to Table 3, the conveyance efficiency per kilometer in the lined canals of the minor distributaries was above 90% due to the prevention or at least strong reduction of seepage and percolation. However, the major component of water losses in lined canals, such as in the middle minor distributary (points 7–8 in Figure 1) was from water leakage through Mogas (outlets along the minor distributaries at different points to divert water to each watercourse). Most of the outlets (Mogas) are made from round concrete plates, and sometimes there are cracks and damaged parts, resulting in further leakages. Additionally, water losses that were perceived in the Mungi minor distributary (points 10–11) were due to sedimentation and vegetation growth, which is caused by poor maintenance. Also, a minor part of the losses in the canals was due to evaporation which was negligible in this study since it is not very high in relation to the seepage/percolation.
In the case of the watercourse (points 3–4) that was unlined and had a large amount of vegetation growing alongside, there was also considerable leakage of water that was observed from field outlets (Nakkas) that were located along this watercourse. Thus, the conveyance efficiency per kilometer was as low as 70%, whereas the watercourse (points 3–5) that was partially lined and had the smallest amount of leakage through outlets and had limited vegetation alongside it had 89% efficiency per kilometer.
Most field ditches that convey canal or tube well water to irrigated fields are covered with substantial amounts of vegetation and, in general, the hydraulic capacity is lower than the capacity of the watercourses. The range of conveyance efficiency per kilometer for the two field ditches (points 8–9 and 5–6) were 74% and 76%, respectively (Table 3). Moreover, The information that is provided in Table 3 enables the estimation of the magnitude of potential water-saving by lining as a function of the wetted area and considering the time (e.g., 1 h).
Lining canals can save large amounts of water losses in the canals by preventing the percolation and seepage that contribute to a more equitable distribution of water along the canals. Particularly, farmers that are located at the lower canal reaches can receive more water, which results in less pumping of groundwater. However, it hinders the recharge of groundwater, which currently acts as a storage facility for farmers. In Mungi, the farmers pump groundwater to compensate for the limited amount of surface water that they get from canals based on the Warabandi principle. The loss of water in canals that recharge groundwater is considered key in terms of this water being of better quality than the percolated water from crop fields to groundwater, which is polluted by fertilizer and plant substances. Therefore, the electrical conductivity (ECe) of the canal water at fields A, B, C, E, and F was measured as ~0.2 dS/m, while groundwater ECe was as 1.1, 1, 1.8, 2.09, and 2.42 dS/m for Fields C, G, B, F, and E, respectively. The groundwater ECe indicated an increasing tendency from upstream to downstream of the Mungi Distributary CCA.

3.1.2. Field Application Efficiency

Table 4 provides the estimated application efficiencies based on analysis of the water balance parameters at the crops’ root zone under various irrigation methods.
The farmer of Field A cultivated cotton in both years (2019 and 2020) using conventional furrow. The application efficiency for Field A in 2020 for three events was estimated as 68.1%, 74.6%, and 75% (Table 4). Variation in the application efficiency was determined by the amount of irrigation, contribution of rainfall, climatic conditions for evapotranspiration, and the availability of moisture content in the root zone. In 2019, the technical efficiency for the same field was 68.7%, 61.1%, and 50.6% for three different measurement periods. The lowest efficiency in 2019 was 50.6% for the period of 7–14 July, which corresponded to an over-irrigation of 57 mm. Besides over-irrigation, 23 mm of rainfall was recorded during this time. Although the soil moisture was in field capacity level (261 mm) in one meter depth of root zone, the farmer still irrigated the field due to habit of seven day rotation using the allocated canal water on its turn due to lacking storage facilities to save surplus water. Similarly, the low application efficiency of 61.6% (26 June to 3 July) was caused by refilling (63 mm) the soil moisture to more than the field capacity level by over-irrigation. However, the application efficiency reading of 74.6% (on 9–12 July 2020) showed a better water application timing and amount via the farmer where most of the applied water was beneficially used by the crop.
Field B with a raised bed and furrow irrigation method showed better efficiencies in both 2019 and 2020 than Field A except the lowest irrigation efficiency for Field B, which was assessed as 47.2% in the period of 13–20 August 2020 (Table 4). The lowest efficiency was due to a recorded 53.2 mm of rainfall following an irrigation depth of 37 mm that was applied even though 262.2 mm of moisture content in the root zone was already available. The farmer irrigated after each seven day period, despite having moisture in the soil because of Warabandi turn to be used (no storage facility was available). The head farmer of Field B was skillful and tried to optimize the amount of irrigation water. Thus, the farmer achieved slightly better application efficiencies in 2019 of 79.2%, 84.4%, and 71.5% than in 2020 with 81.6%, 76.9% and 47.2%, respectively (Table 4).
The technical efficiency values for the two irrigation events in Field C, which was practicing the flood irrigation method, were 35% and 39.3%. This was due to low plant density (more space between plants) and over-irrigation of 93 and 102 mm at each event, respectively. However, Field D, which used drip irrigation, showed the highest efficiency of over 90%. The farmer of Field D was very experienced and regularly optimized the irrigation quantity and timing by considering the soil properties of the field and used soil moisture sensor to consider availability of the moisture. Moreover, the farmer constructed a pond in the farm for frequent irrigating events by the drip and it enabled them to store the surplus water of the canal when it was available. Therefore, due to an increase in temperature during the months of May and June, the farmer irrigated the cotton field two times a day (in the morning and evening), applying 1 mm per event. Thus, Field D achieved the highest efficiency. Moreover, the farmer flooded the drip field due to availability of canal water in two events (20 days before sowing as pre-irrigation and on June 20; each event involved irrigation with 132 mm).
Similarly, Fields E and F cultivated cotton on the basis of a ridge-furrow method, and their application efficiency ranged from 44% to 83.9%. They showed similar efficiency in terms of water-saving compared to conventional furrow and raised bed irrigation methods. Farmers downstream of the Mungi Distributary canal applied the ridged bed method to account for the limited availability of canal water and to consume less groundwater.
The application efficiencies in June were higher in irrigated fields when compared with those in July or August (Table 4). This finding was attributed to fulfilling two-thirds of the cotton water requirement through monsoon rainfall in July and August, and farmers did not appropriately utilize the obtained moisture content from rainfall, whereas in June, almost all cotton demand was achieved through irrigation water.
All the selected farmers, except the farmer of Field D, were not using soil moisture sensors or other tools to realize the availability of moisture content of the fields to refill the soil to field capacity and keep the moisture within the allowable depletion range. Therefore, they irrigated the fields based on observation of soil or plants, weather condition, or just simply allocating more water for cotton based on irrigation habit of seven day rotation, according to the farmers’ descriptions.

3.2. Water Availability (Supply-Demand) Analysis

The obtained conveyance efficiency for the network of canals in the Mungi irrigation scheme (Table 3) was estimated to be 75%, assuming higher numbers of unlined watercourses and field ditches in the Mungi command area that their conveyance efficiencies ranged around 75% in Table 3. The technical application efficiency for the Mungi irrigation scheme was estimated as being 64% based on the mean of the cotton field efficiencies in Table 4, except for Field D (drip), as it is not located in the Mungi CCA and was installed in a very small share of the area. Thus, the overall irrigation efficiency of the Mungi Distributary irrigation scheme was estimated as 48% (Equation. (5)). This coincides with a study that considered the overall irrigation efficiency 45% for Lower Chenab canal command area that includes the Mungi area in Punjab [19]. Similarly, the overall irrigation efficiency of 42% was used for Kasur minor distributary canal command area in Punjab [9].
Irrigation efficiency = Field application efficiency × conveyance efficiency = 0.75 × 0.64 = 0.48

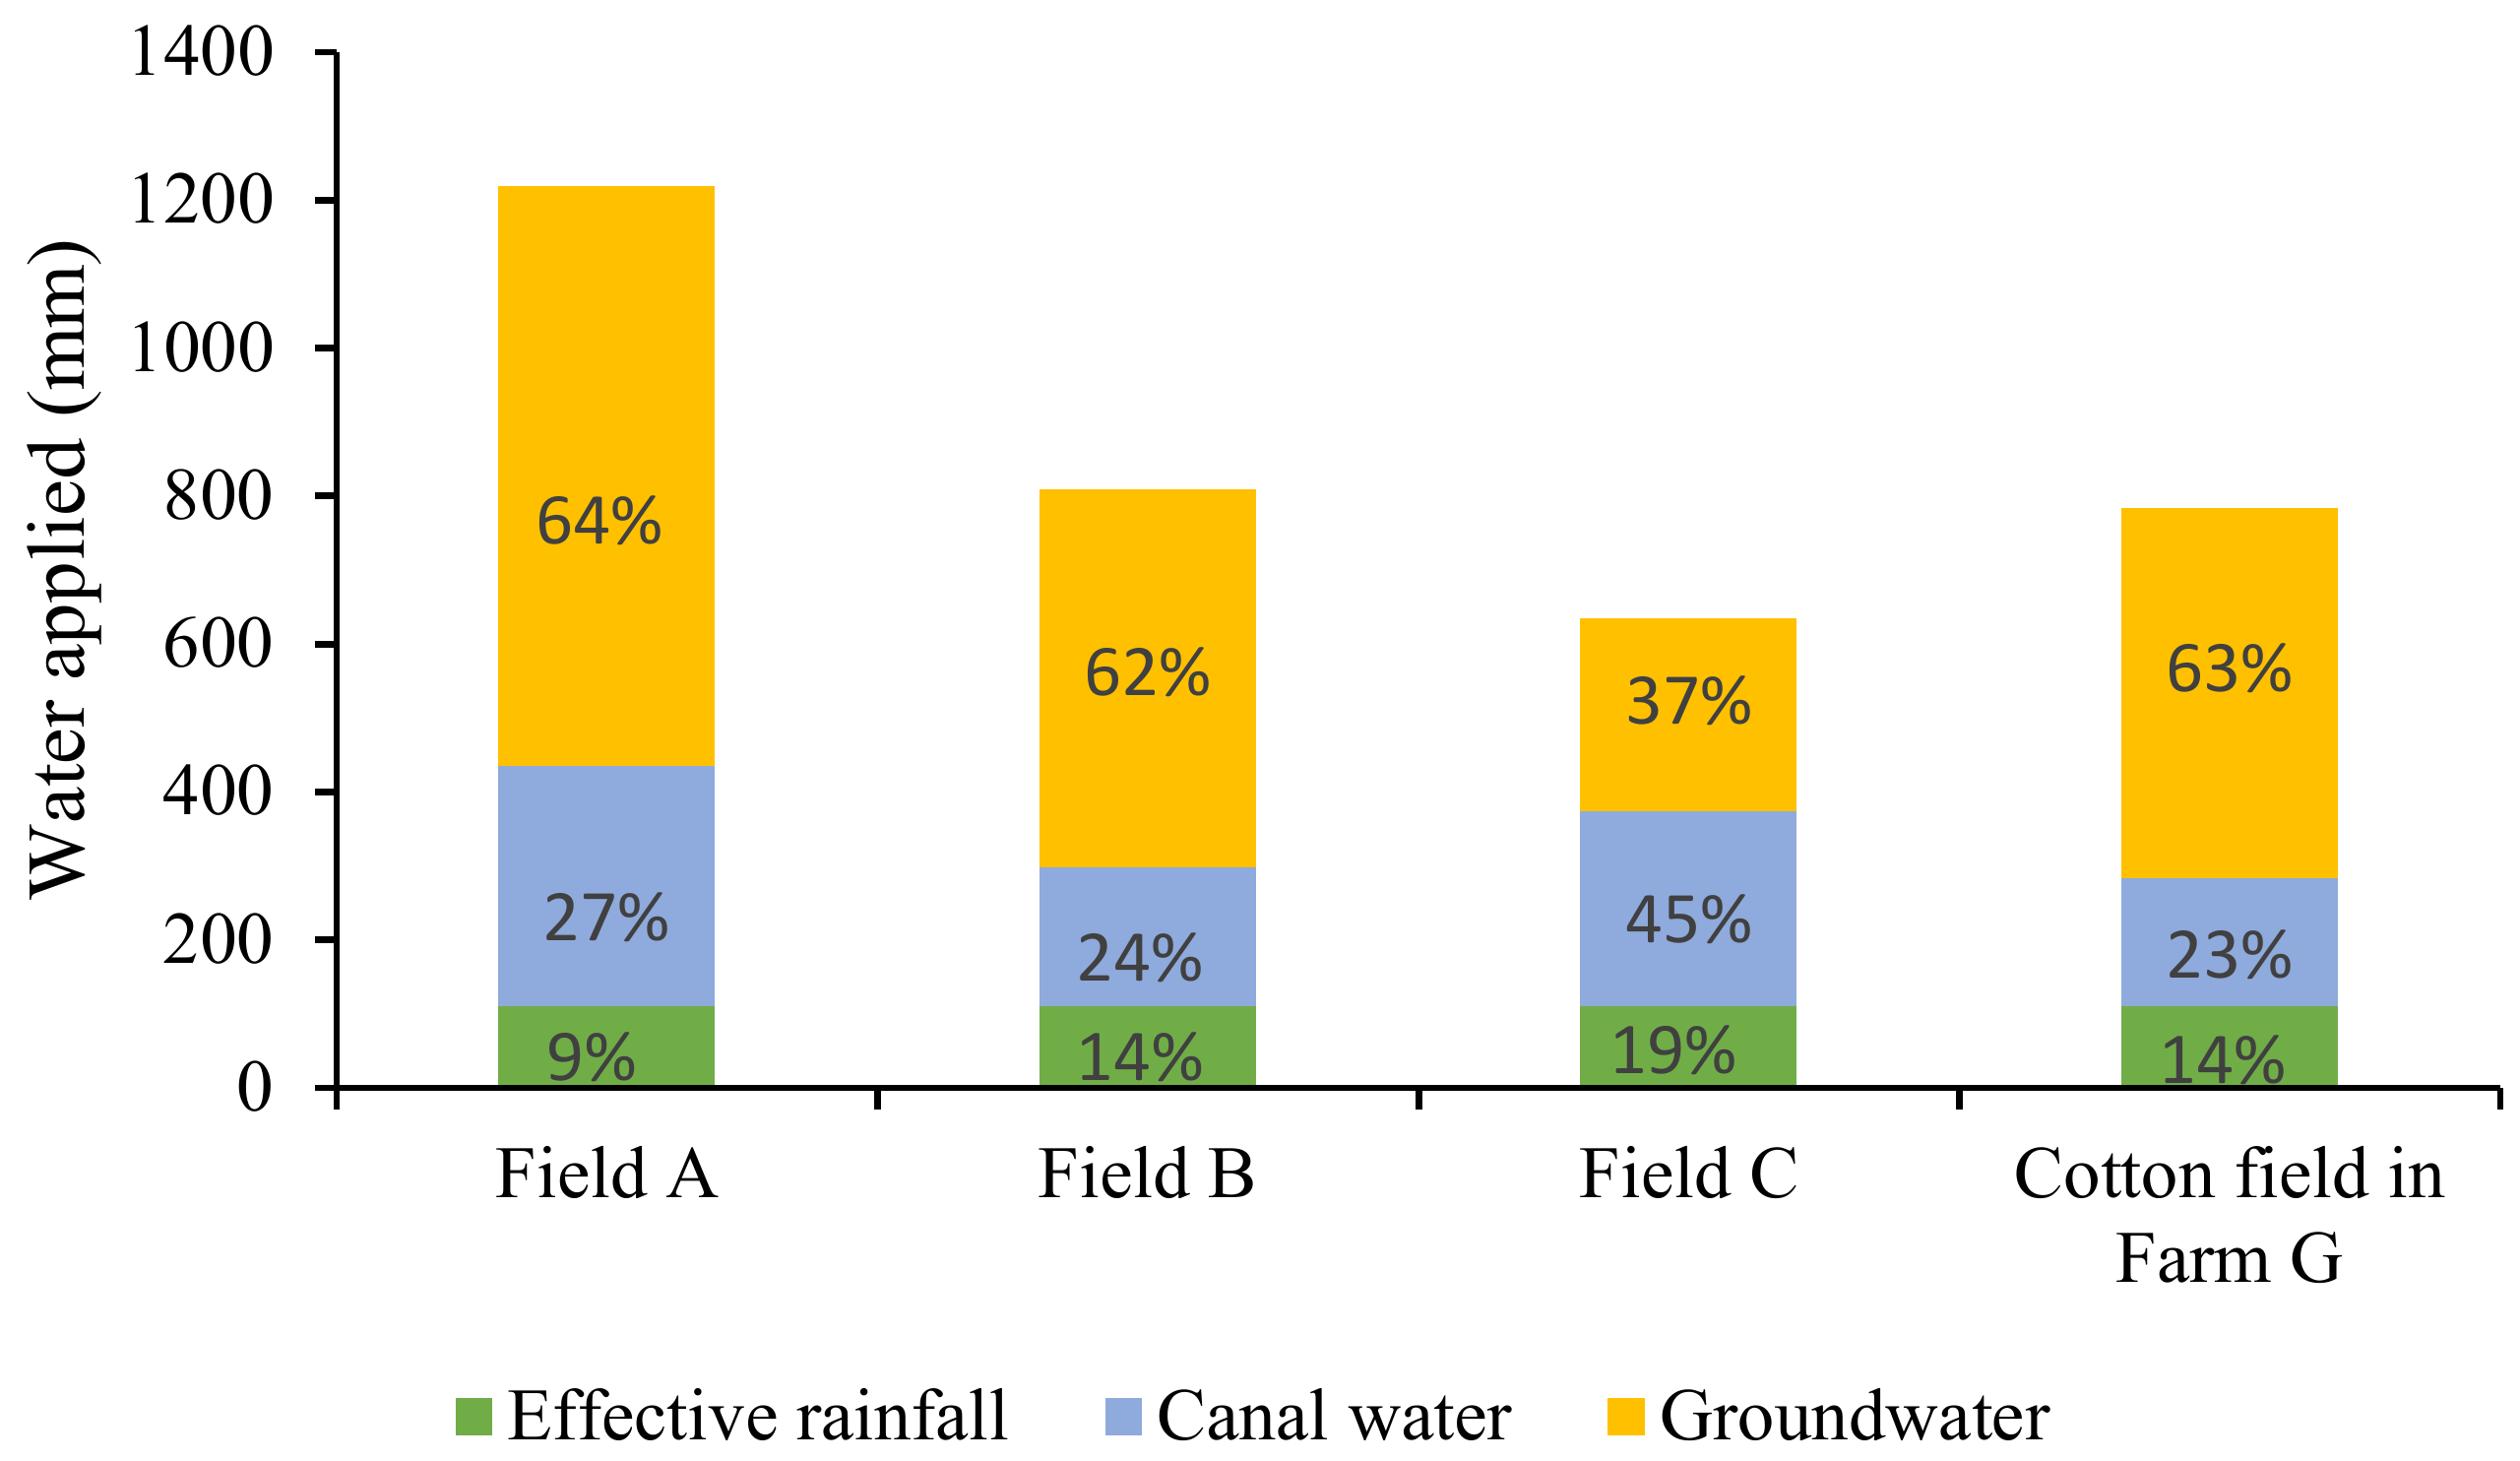
3.2.1. Field Level Supply and Demand

The canal water allocation of the cotton fields based on the Warabandi principle in Table 5 was measured at the inlet of the field when the Mungi Distributary canal was in full supply level and 19 weeks was considered as the growth period for cotton.
The factors influencing the Warabandi canal water allowance depend on the location of the farmers’ fields along the watercourse, conveyance efficiency of the minor distributors or watercourses, uptake of the water by referenced minor distributaries from the Mungi Distributary canal, and the allowance of head discharge to the Mungi Distributary canal. Hence, Farm G, which was located at the tail of the watercourse, received the least amount of canal water (9 mm) per seven day rotation, whereas Field C, which was in the middle of the same watercourse, received 13.8 mm of water per cycle. This is highlighted as a drawback of the Warabandi principle, which does not consider conveyance losses for the allocation of water to tail farmers, which results in the inequitable distribution of water between upstream and downstream farmers [3,5].
Additionally, there is a clear dependency on groundwater withdrawals in Punjab between upstream and downstream farmers [37]. Downstream farmers, such as in the case of Field E and F (we could not measure their canal water discharge due to irregular and unreliable flow of canal and they were mainly irrigating by tube well), were much more dependent on groundwater than upstream farmers. However, the middle minor distributary (points 7–8 in Figure 2) canal, which provides water to Field B received less canal water because of the construction of a bridge over the Mungi Distributary canal and interfered with the minor intake that resulted in a 10 mm canal water allowance per turn.
The Warabandi canal water deficit for cotton fields ranged from −45% to −73% comparing to the gross water that was applied (conjunctive use of canal and groundwater) over 19 weeks (cotton growth period) for the fields (Table 5).
It is evident from Figure 7 that despite having different locations in Mungi Distributary CCA, the farmers of fields A, B, and Farm G applied more than 60% groundwater using fuel energy over the crop growth period besides canal water contribution as ~25% and rainfall. However, the farmer of Field C, irrigated the field with limited gross water and the canal water input was ~45% of the total cotton requirement, as the farmer could not afford the fuel to extract groundwater for cotton, according to information provided by the farmer.

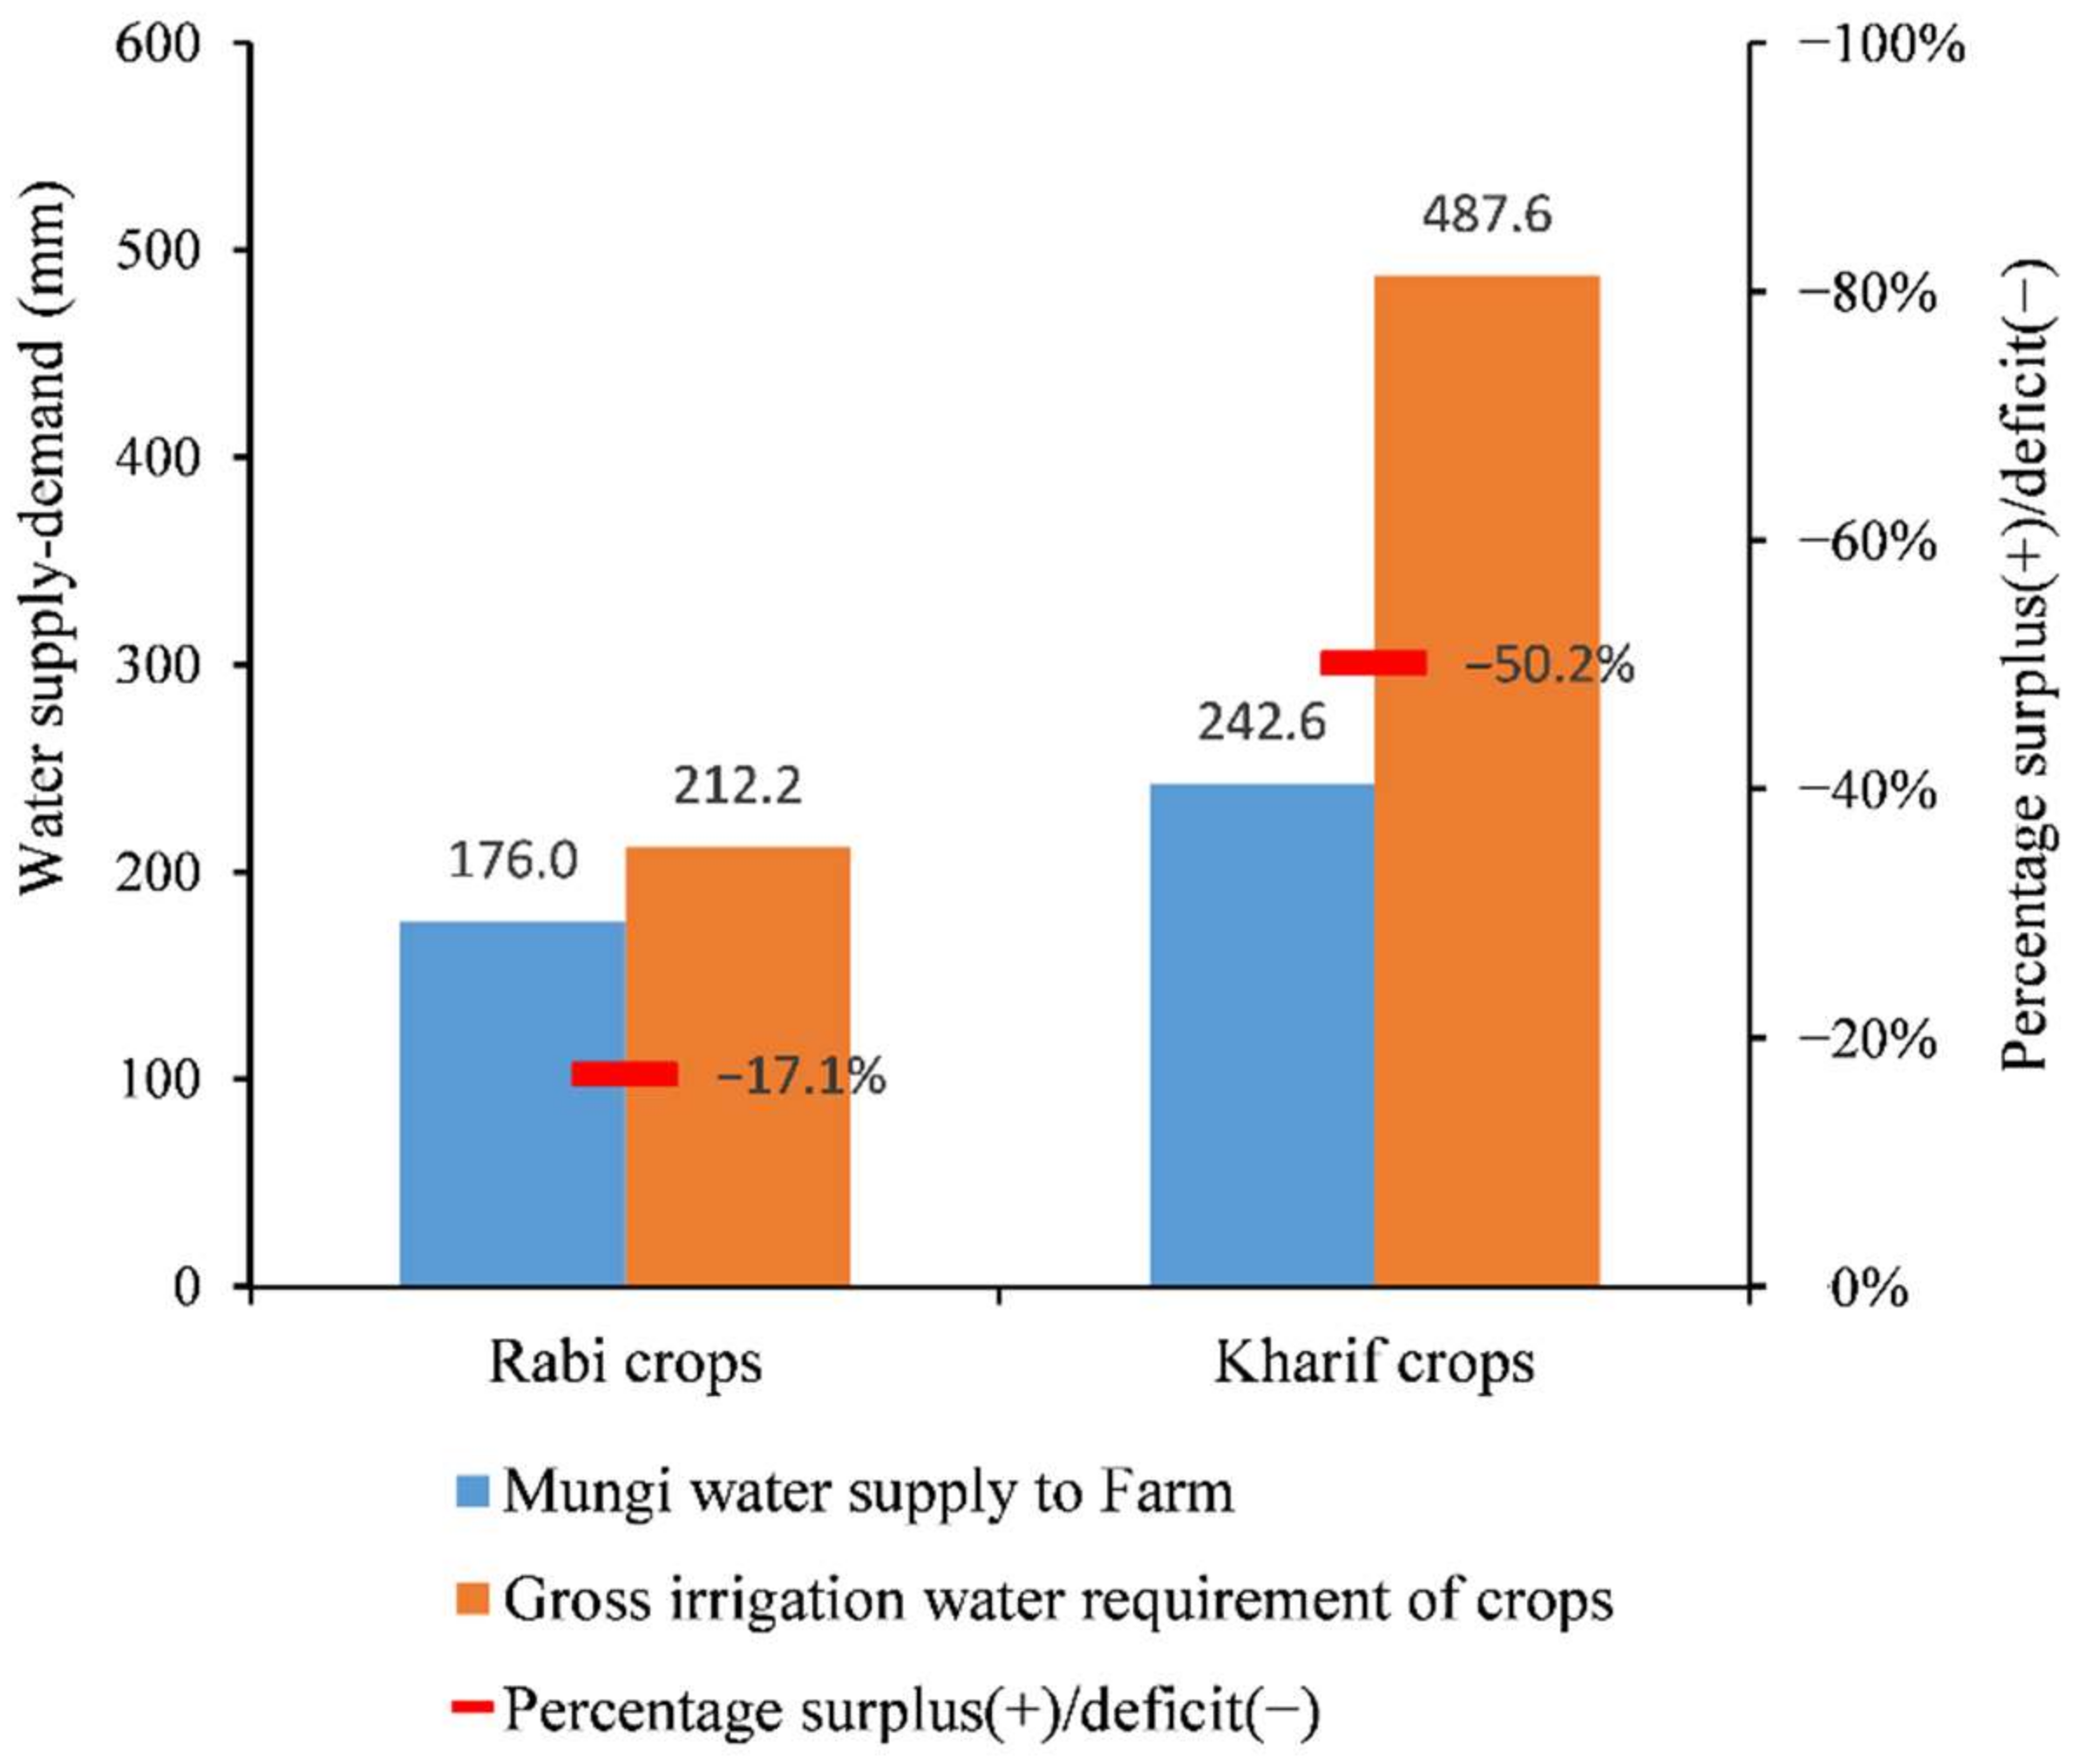
3.2.2. Farm Level Supply and Demand

In Farm G, canal water deficit for the Kharif season reached 50.2%, whereas Rabi crops were lower-water consumers, which resulted in a 17.1% shortage in canal water in 2018/2019 (Figure 8). The deficit part in both seasons was fulfilled by groundwater contribution.

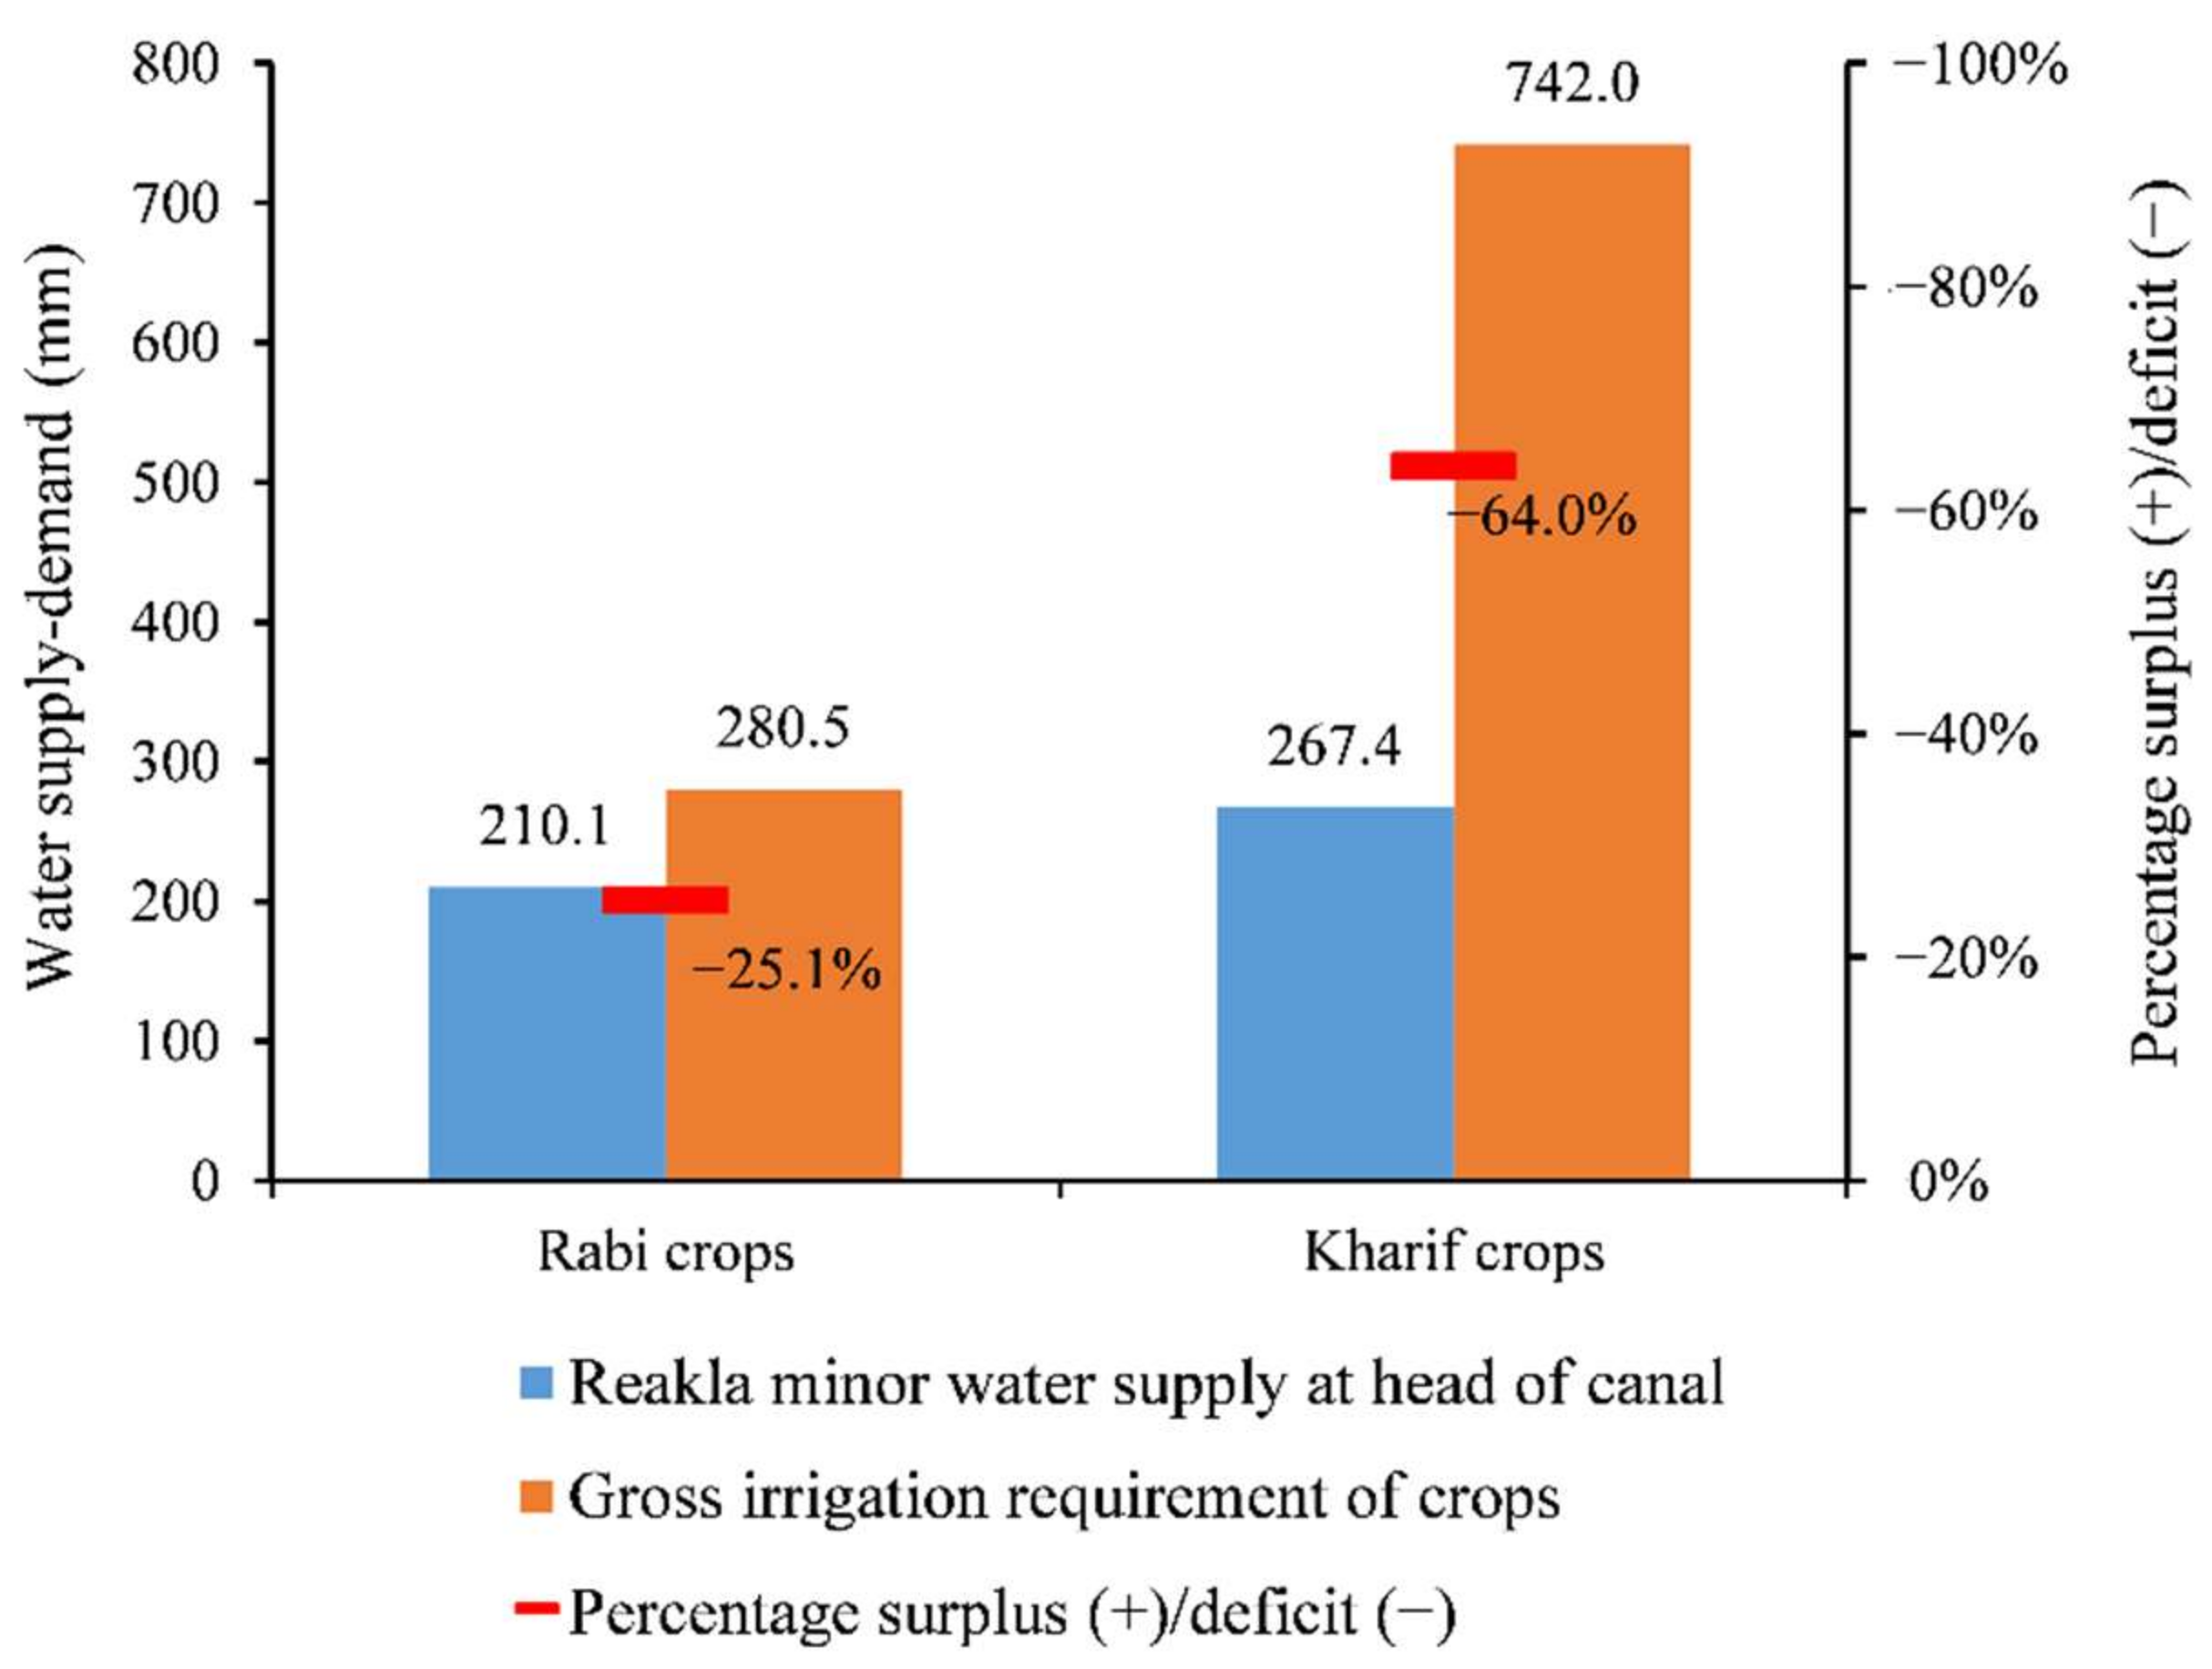
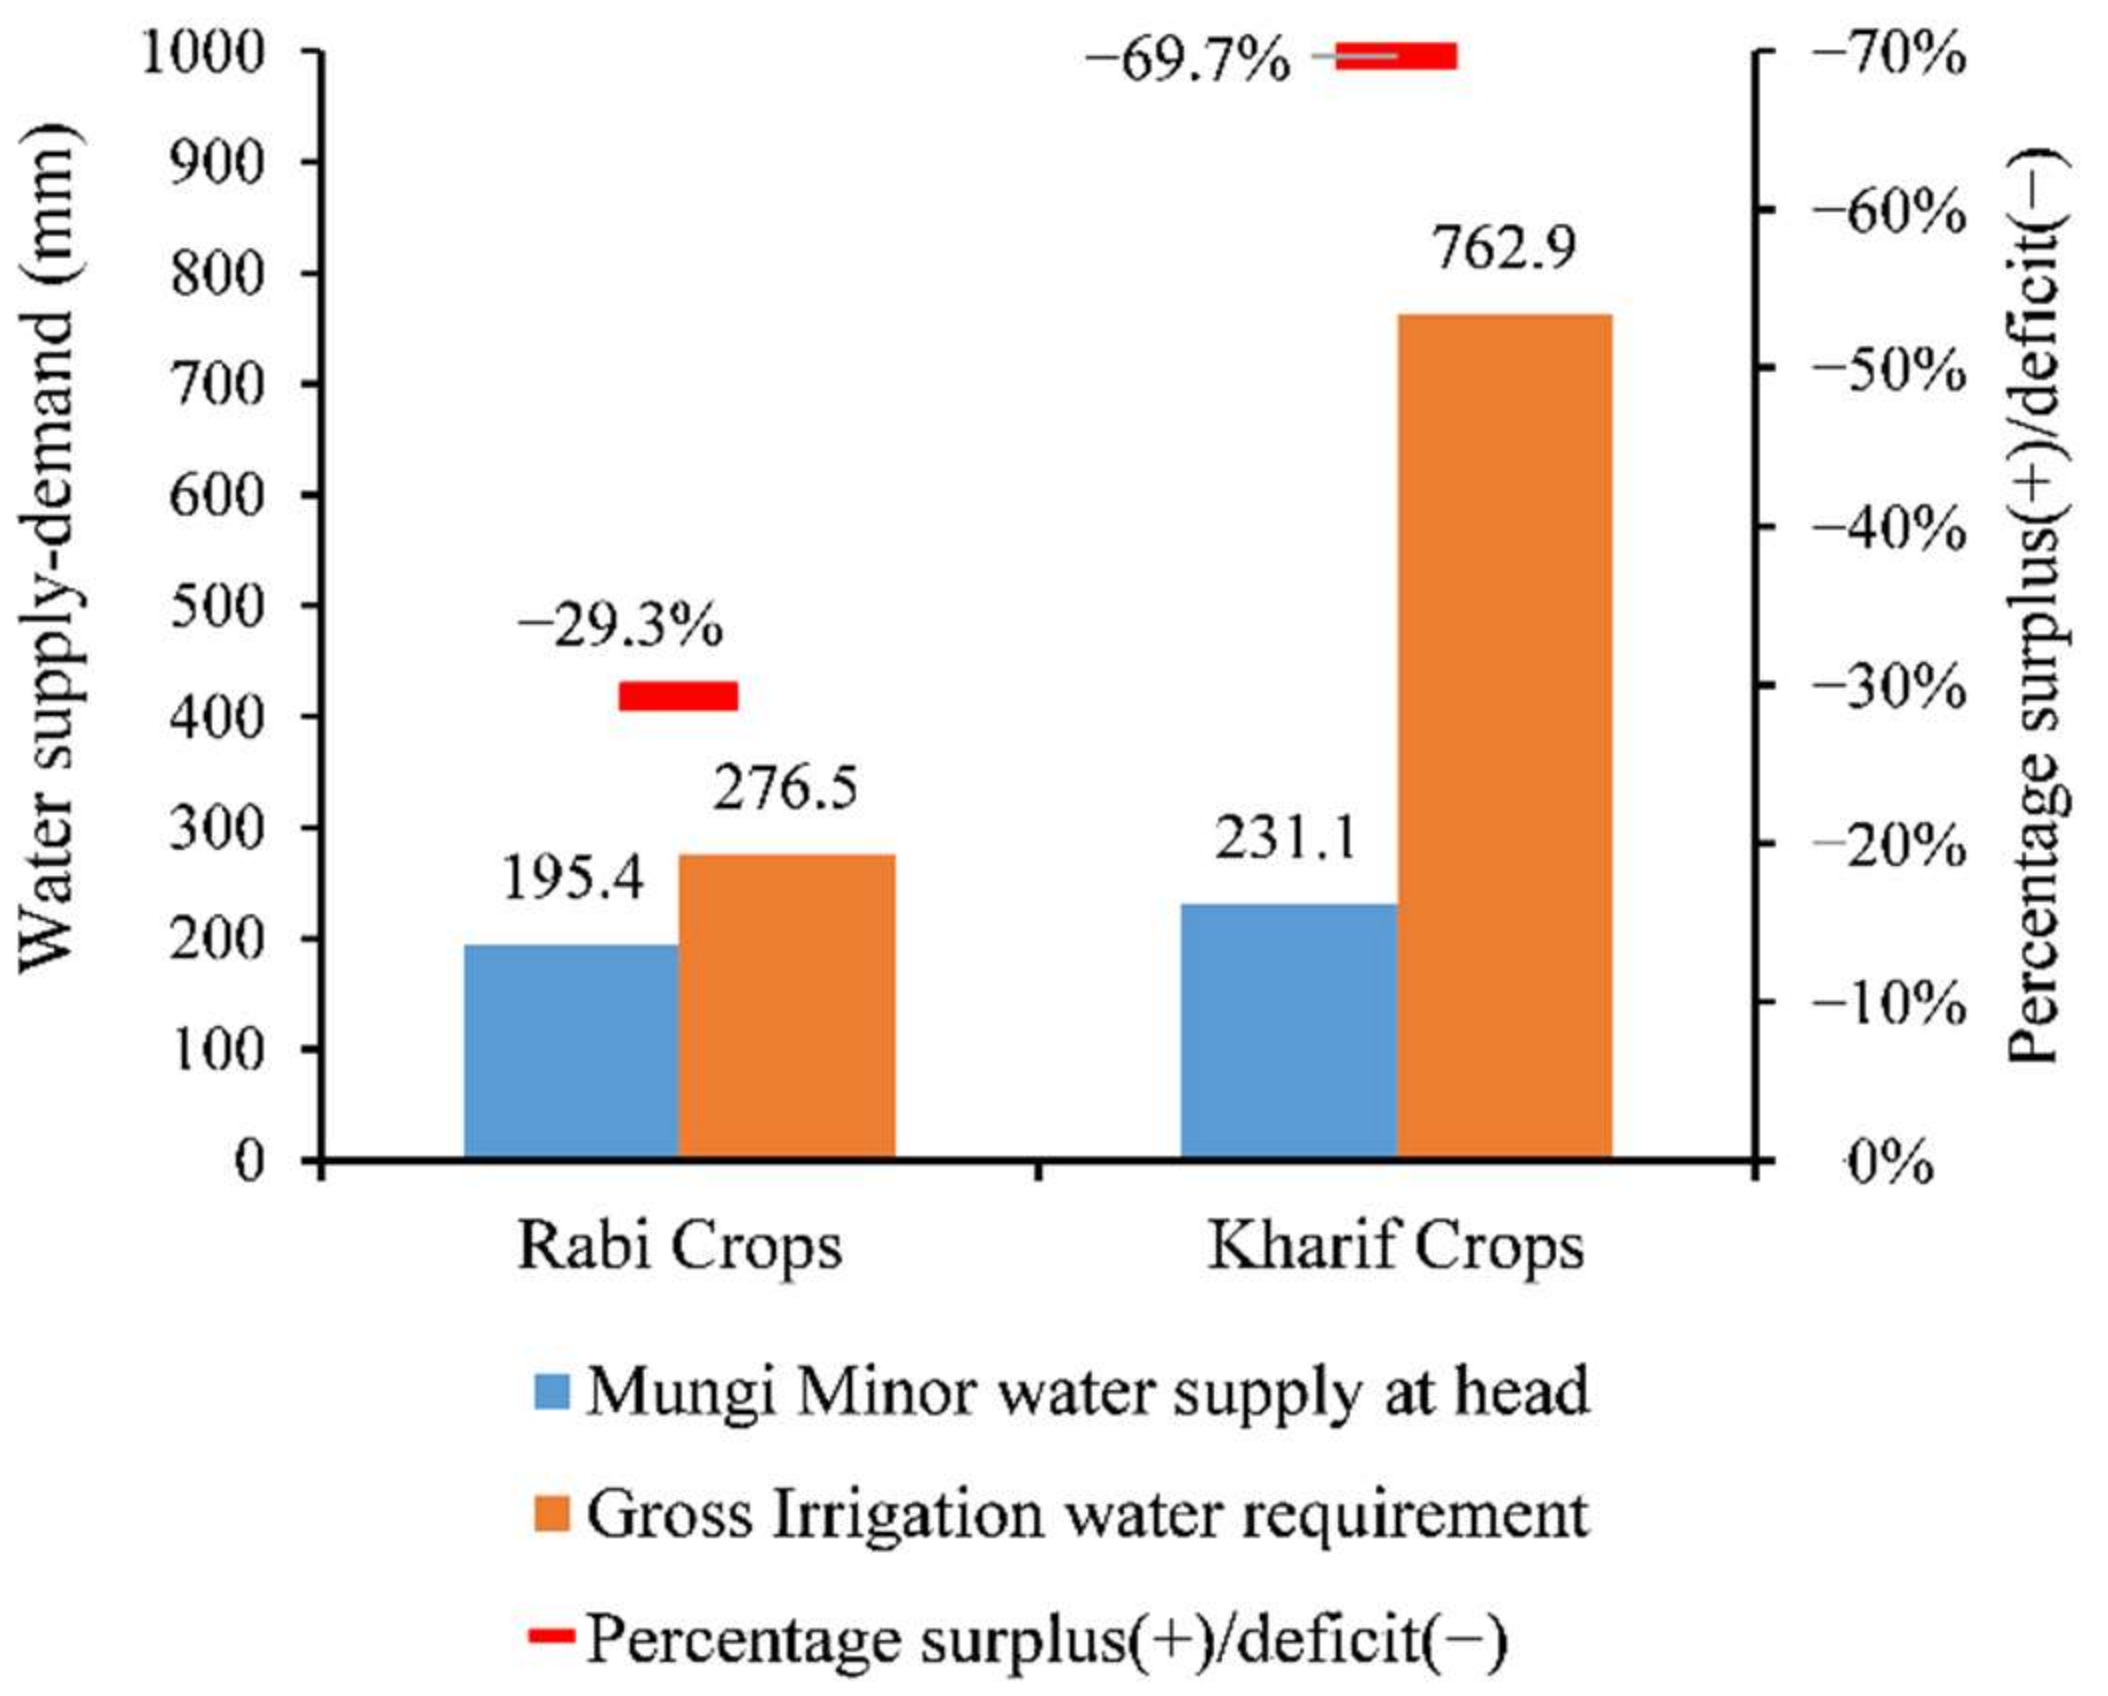
3.2.3. Supply and Demand of the Reakla and Mungi Minor Distributaries

Figure 9 presents the demand and supply of the Reakla minor distributary in the upper part of the Mungi Distributary canal. Considering a 48% overall irrigation efficiency of the Mungi scheme, the canal water in the Kharif season faced a 64% deficit to fulfill the requirement of crops in the Reakla command area, whereas for the Rabi crops, because of the climatic conditions and crops that consume less water, it was marked with a shortage of 25.1%.
In case of the Mungi minor distributary at tail of the Mungi Distributary canal, the Kharif season corresponds to a huge demand for water due to cultivated water-intensive crops, such as cotton, rice, and sugarcane. As shown in Figure 10, the Kharif season is marked as a 69.7% deficit, whereas the Rabi season accounted for a 29.3% shortfall in terms of fulfilling a demand by canal water.
The slight difference of canal water deficit in the Kharif and Rabi season at both Reakla and Mungi minor distributaries was driven from a variation in the share of water-intensive crops in these command areas such as more lands that were under cultivation of cotton, rice, and orchards in the Mungi minor command area.

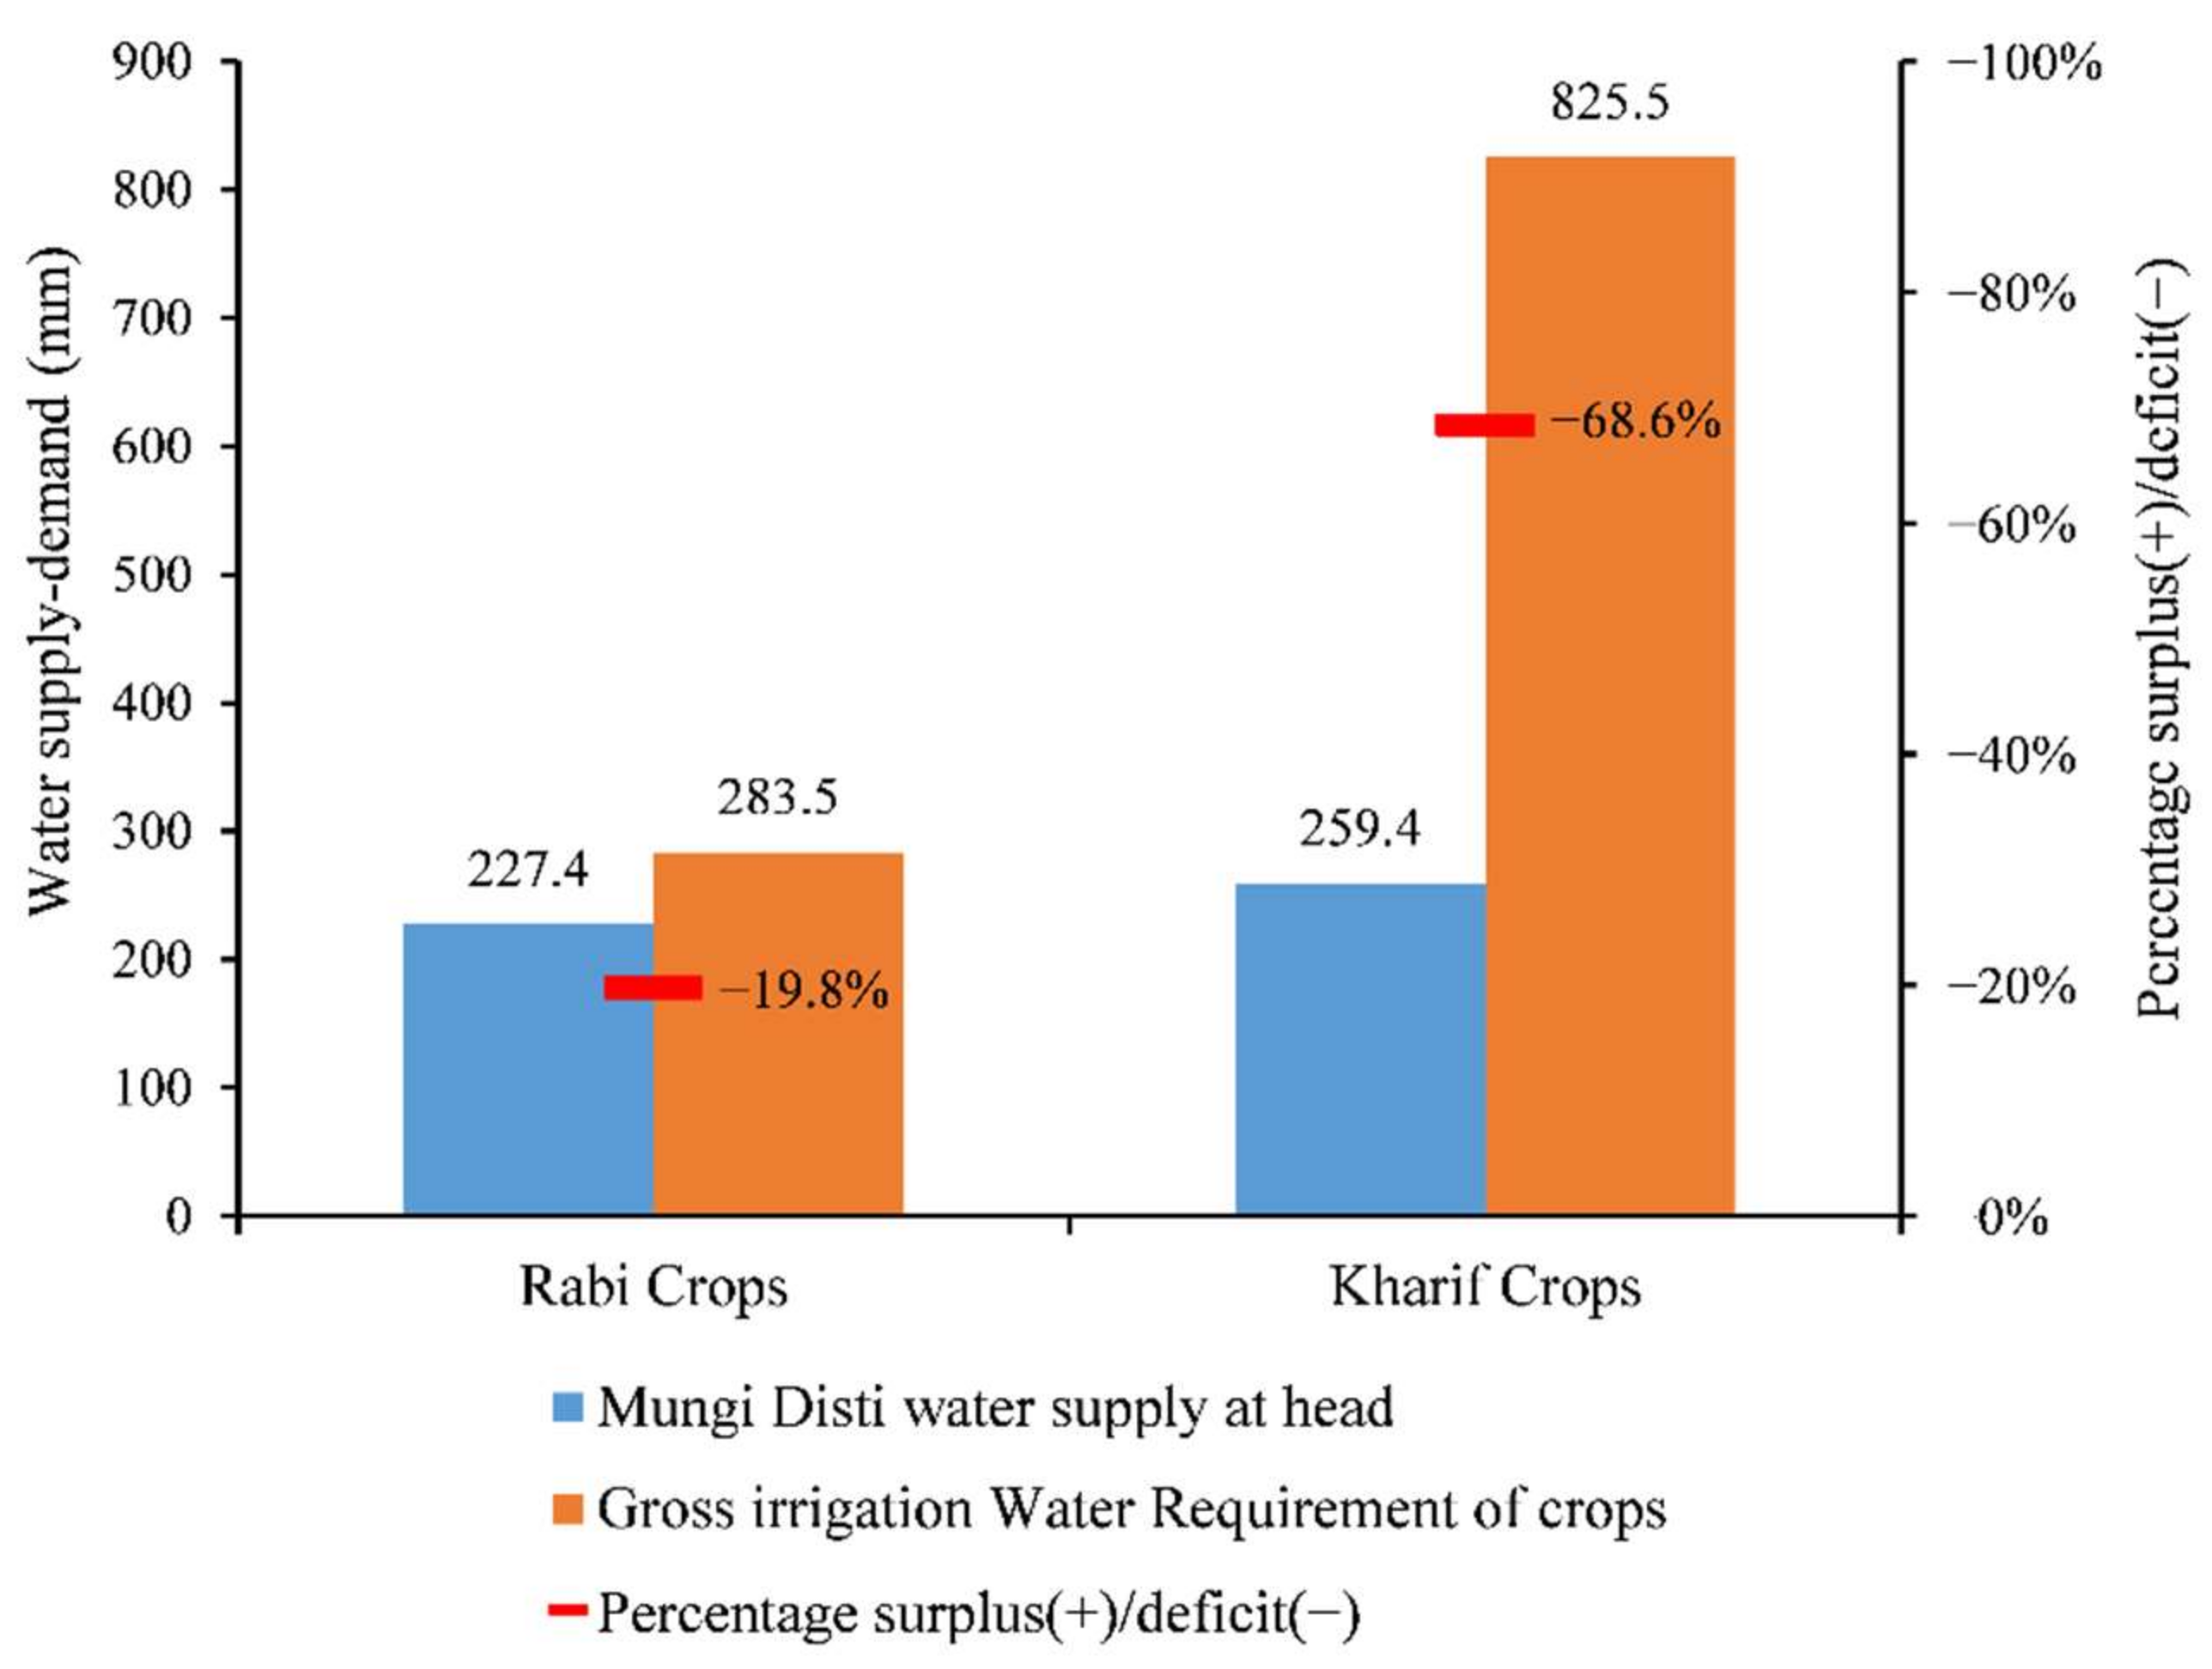
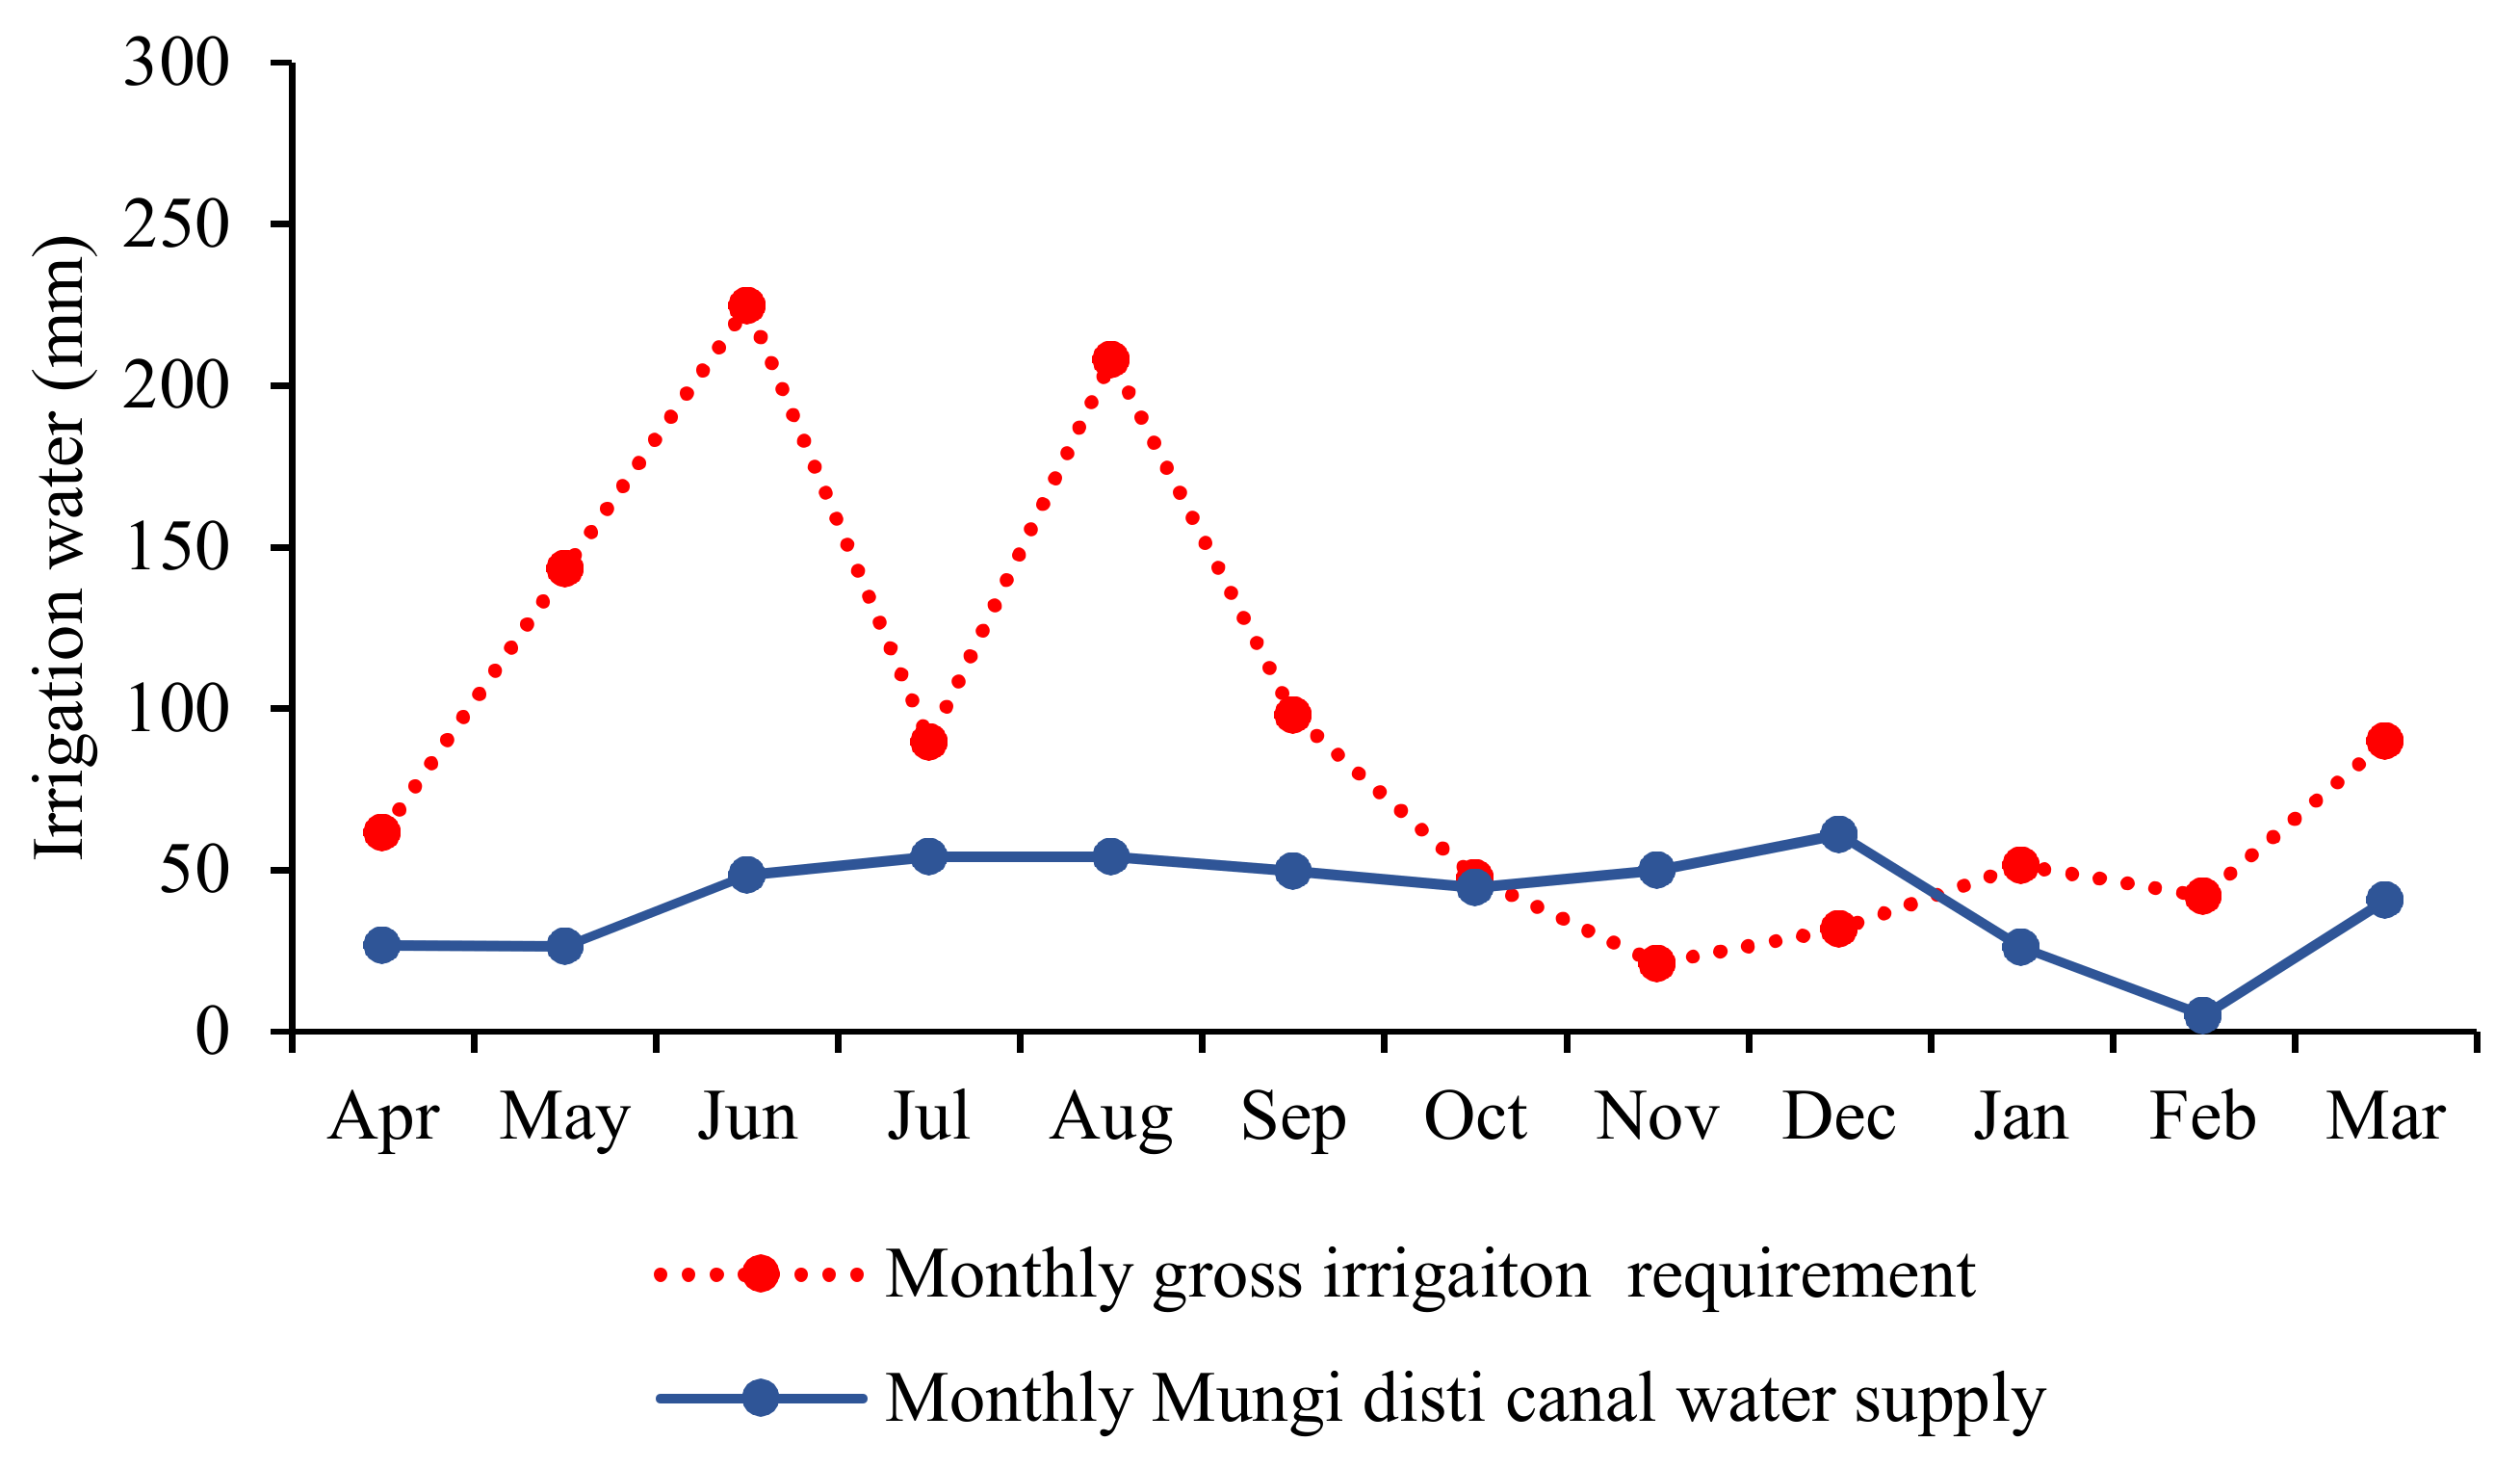
3.2.4. Mungi Distributary Canal Supply and Demand

The actual evapotranspiration (ET) and monthly gross irrigation water requirements of the crops that were cultivated in the Mungi area are presented in Table 6. The actual ET values in the Table 6 for each crop are in range of ET that was estimated in a study by FAO on agro-ecological zones of Punjab for the common crops that were cultivated in the Punjab province [38].
The Mungi Distributary canal water supply in the Kharif season showed a 68.6% deficit, whereas in the Rabi season, there was a shortage of 19.8% because of the cultivation of low water-consuming crops, which were mainly wheat in 2018/2019 (Figure 11).
Figure 12 illustrates the monthly canal water supply and demand in the cropping season of 2018/2019 at the Mungi Distributary canal level. June was the most water-stressed month where no effective rainfall that contributed to match the demand for crops. This demand was mainly satisfied by pumping groundwater using fuel energy. However, in July, the monsoon season started with 131.6 mm of effective rainfall, which drastically lowered the net and gross irrigation demand. In August 2018, no effective rainfall was recorded, but 15 mm of effective rainfall contributed to plant growth in September. Additionally, in September, most crops required less water due to reaching maturity. Thus, the gross demand increased in August and lowered again in September.
Moreover, major crops of the Kharif season, such as cotton, rice, maize, okra, and fodder, were harvested in October and did not need water for irrigation, so the demand side dropped to the level of supply line in October. Furthermore, in the transition point that starts from October, the canal water supply of the Mungi canal remained above demand until the end of December. In these months, there was a shift from the Kharif to the Rabi season because of a short pause to prepare land for Rabi crops and climatic conditions that correspond to low potential evapotranspiration.
For this reason, most Rabi crops were sowed either in November or December, and after December, Rabi crops started to consume water, so demand exceeded supply again from January onwards. Thus, there is a potential option for canal water-saving at farmers’ farms in a storage pond in October, November, and December so that the canal water can be used later on in January or February. The storage of water in ponds at farms of the farmers can enable some flexibility within the frame of the rigid Warabandi system. This would provide support to (i) better match the time –depending crop water demand, (ii) enhance utilizing rainfall, and (iii) lower the pressure on groundwater use in terms of conservation of this resource, save energy for fuel-based pumping, as well as reduce CO2-emission.

4. Discussion and Conclusions

The application efficiency that is improved by advancing surface irrigation techniques going from flood basin (~35% technical efficiency) towards conventional furrow, raised bed-furrow, and ridge-bed furrow (the efficiency varied from 44% to 83%), while substituting irrigation technology could further boost the efficiency, for example, in case of drip method by over 90%. It was revealed that cultivating cotton under bed planting in Punjab could save up to 38% more irrigation water than conventional irrigation methods [27], while another study in the Lower Chenab CCA in Punjab showed that the drip method saved 60–80% of applied water in comparison to the bed planting of maize fields [26]. Therefore, the highly inadequate canal water supply under the Warabandi principle and the high cost of groundwater in Mungi area affected farmers’ decisions on their choice of crop cultivation [39].
Losses in the canal network and during field water application were recharging the aquifer, which provides a supplementary storage facility for farmers by pumping groundwater using fuel energy to fulfill their crop demands under the Warabandi principle. On the other side, seepage and percolation drive matter flow, potentially polluting the aquifer. Thus, rising conveyance efficiency is interlinked with groundwater quantity and quality and the amount of CO2 emissions that are caused by pumping. In general, canal water is of better quality than water that is percolating through the root zone of irrigated fields (loaded with fertilizers and plant protective agents) in Punjab [40]. Therefore, high priority should be given to improvements of field water application as these will lower potential groundwater pollution.
The major sources of recharging groundwater in Punjab are rainfall, field percolation, and water losses in irrigation canals [41]. A study found that the adequacy and reliability deliveries of conjunctive use of surface and groundwater decrease towards the end of canals due to the combined effect of erratic supply of canal water and salinization of groundwater in the Rechna Doab irrigation scheme in Punjab [17]. Deteriorating trends in groundwater quality have been observed in Punjab and more groundwater is expected to be used in the near and mid future that can enhance future sustainability challenges in terms of water quantity as well as quality, severely impacting drinking water provision [25,42].
Focusing on technical interventions, we see two main entry points for optimizing irrigation application efficiency. First, irrigation scheduling that is considered in this study, which employs proper timing and efficient use of irrigation water based on crop production in the Mungi area. The moisture that is obtained from rainfall in the soil could be utilized by adapting irrigation events accordingly, or the soil moisture could be maintained within the optimal depletion zone by refilling it in each irrigation event slightly under the field capacity to reduce percolation and evaporation amounts. The second option involves advanced handling of the irrigation water application processes in the crops’ root zone that could potentially reduce non-beneficial uses of water and have been investigated and addressed by several studies. Numerical simulations that are based on Richards’s equation were used in a study to minimize the water percolation below the root level [43], while another research applied a mathematical model for an optimal control zone of irrigation water optimization to preserve crop and prevent water non-beneficial usage [44]. Similarly, a study deliberated the analysis of irrigation water dynamics and soil moisture in crops’ root zones considering a zone model predictive control (MPC) which keeps soil moisture at the optimal level with less water consumption [45].
The study also indicated a large gap in the Mungi Distributary canal water supply and demand of crops within its command area. Our analysis revealed a canal water deficit of 68.6% in the Kharif season and 19.8% in the Rabi season of 2018/2019. In another study in Punjab, by using remote sensing data and considering an irrigation efficiency of 45%, the canal water deficit was estimated for the Mungi Distributary canal as 36% and 32% for the Rabi seasons of 2009/2010 and 2010/2011, respectively, which is slightly higher than the current study [19]. This difference could be due to the changes in the cropping pattern from year to year or could be also due to different meteorological conditions in 2009/10 and 202/11 versus 2018/19, or variation of inflow to the Mungi Distributary canal and also depends on the accuracy of the remote sensing data. Furthermore, the supply-demand of the Mungi Distributary canal was assessed during 2011–2012 using SWAT and CROPWAT models [20]. The study showed an over 50% deficit of Mungi canal water in that year considering a 45% overall irrigation efficiency, whereas the most water-stressed months were highlighted as June, July, and August; although the study did not consider effective rainfall for the months of July and August.
Despite the fact that the Mungi Distributary canal is undersupplied in both the Kharif and Rabi seasons, there are periods with water availability that exceed the demand in the months of November and December. The potential of this surplus water is a source to be beneficially used in deficit periods could be mobilized by constructing decentral storage facilities in the farmers’ farms in the Mungi area. Comparable results were obtained by a study that found the supply of the Mungi Distributary canal exceeded the demand of crops during October, November, and December, but the demand increased from January in the Rabi seasons of both 2009/2010 and 2010/2011 [19]. Furthermore, the groundwater extraction significantly increased at the tail of Mungi Distributary, especially in peak water-stressed months [2]. This phenomenon could be confirmed in this study by observing zero discharge at the tail of the Mungi Distributary canal while crops were cultivated there, and, due to the unreliable supply of canal water, the farmers of Field E and F were more dependent on groundwater abstraction.
The study provided detailed information on the status of irrigation conditions in Mungi Distributary CCA that could be used as potential groundwork for policymakers to make decisions that are based on actual field information for the development of water supply-demand strategies. Moreover, the quantification of groundwater that is extracted by farmers using fuel energy could further benefit scientific works on approaches to the water–food–energy nexus to reduce CO2 emissions and conserve groundwater in terms of quantity and quality. The study suggests the inclusion of the impact of rising efficiency on groundwater quantity and quality in further research and in decision-making for the improvement of the canal irrigation schemes.
The behaviour of over-irrigation can be changed or even avoided by training of farmers on the management of soil moisture content in crops’ root zones and informing them by relevant institutions or by conducting joint field experiments on their plots together with scientists and extension service institutions. These measures on improving knowledge and skills are especially promising in terms of the practical impact, when going hand-in-hand with creating incentives to implement the improvements; the willingness of farmers to avoid over-irrigation can be enhanced by establishing on-farm water storage facilities (e.g., small ponds) which enable them to store surplus water (instead of wasting by over-irrigation) for use at the farm in periods with insufficient water supply in the canal network (infrastructural re-design for creating an ‘enabling environment’ to avoid over-irrigation).

Author Contributions

Conceptualization, I.S. and B.T.; methodology, I.S. and B.T.; software, I.S.; validation, I.S.; formal analysis, I.S.; investigation, I.S. and B.T.; resources, I.S., B.T. and C.B.; data curation, I.S. and B.T.; writing—original draft preparation, I.S.; writing—review and editing, I.S., B.T., M.F. and C.B.; visualization, I.S. and B.T.; supervision, M.F. and C.B.; project administration, B.T.; funding acquisition, B.T and C.B. All authors have read and agreed to the published version of the manuscript.

Funding

This research received no external funding.

Institutional Review Board Statement

The study was conducted in accordance with Research Ethics Standards defined by Bonn University and approved by Research Ethics Committee, Center for Development Research (ZEF), University of Bonn-Germany.

Informed Consent Statement

Informed consent was obtained from all subjects involved in the study.

Data Availability Statement

Climatic data can be obtained by this link: http://uaf.edu.pk/faculties/agri/depts/crop_physiology/agri_met_cell/met_bulletin.html (accessed on 2 January 2022). Canal discharge data: https://irrigation.punjab.gov.pk/channel-information (accessed on 2 January 2022).

Acknowledgments

The fieldwork was financed by Fiat Panis Foundation through the Center for Development Research (ZEF), Bonn University Germany and conducted at Mungi area in cooperation with the Department of Irrigation and Drainage, Faculty of Agricultural Engineering & Technology, University of Agriculture, Faisalabad-Pakistan in context with the InoCottonGROW project funded by BMBF. This work was supported by the Open Access Publication Fund of the University of Bonn.

Conflicts of Interest

The authors declare no conflict of interest.

References

  1. Bhatti, A.M.; Suttinon, P.; Nasu, S. Agriculture Water Demand Management in Pakistan: A review and perspective. Soc. Soc. Manag. Syst. 2009, 9, 1–7. [Google Scholar]
  2. Yongguang, H.; Buttar, N.A.; Shabbir, A.; Faheem, M.; Aleem, M. Precision management of groundwater abstraction on different spatial scales of lower Chenab canal system in Punjab, Pakistan. IFAC-PapersOnLine 2018, 51, 397–401. [Google Scholar] [CrossRef]
  3. Bandaragoda, D.J.; Rehman, S. Warabandi in Pakistan’s Canal Irrigation Systems Widening Gap between Theory and Practice; International Irrigation Management Institute (IIMI): Colombo, Sri Lanka, 1995; 89p, ISBN 9290901691. [Google Scholar]
  4. Bhutta, M.N.; van der Velde, E.J. Equity of water distribution along secondary canals in Punjab, Pakistan. Irrig. Drain. Syst. 1992, 6, 161–177. [Google Scholar] [CrossRef]
  5. Jurriens, M.; Mollinga, P.P.; Wester, P. Scarcity by Design: Protective Irrigation in India and Pakistan; ILRI: Nairobi, Kenya, 1996. [Google Scholar]
  6. Qureshi, A.S.; McCornick, P.G.; Sarwar, A.; Sharma, B.R. Challenges and Prospects of Sustainable Groundwater Management in the Indus Basin, Pakistan. Water Resour. Manag. 2010, 24, 1551–1569. [Google Scholar] [CrossRef] [Green Version]
  7. FAO. Transboundary River Basin Overview—Kura Araks; Fao Aquastat: Rome, Italy, 2016. [Google Scholar]
  8. Muzammil, M.; Zahid, A.; Breuer, L. Water resources management strategies for irrigated agriculture in the indus basin of Pakistan. Water 2020, 12, 1429. [Google Scholar] [CrossRef]
  9. Ahmad, I.; Ahmed, S.M.; Mahmood, S.; Afzal, M.; Yaseen, M.; Saleem, M.; Rizwan, M. To Develop a Crop Water Allocation Model for Optimal Water Allocation in the Warabandi Irrigation System. Arab. J. Sci. Eng. 2019, 44, 8585–8598. [Google Scholar] [CrossRef]
  10. The Effects of the Equitable Canal Water Allocation Model Scheduling on Crops and Soils under the Warabandi Water Management System: A Case Study of the Hakra Branch Canal Command Area of the Punjab Province Pakistan. Available online: https://ir.canterbury.ac.nz/handle/10092/12435 (accessed on 2 January 2022).
  11. Haddeland, I.; Heinke, J.; Biemans, H.; Eisner, S.; Flörke, M.; Hanasaki, N.; Konzmann, M.; Ludwig, F.; Masaki, Y.; Schewe, J.; et al. Global water resources affected by human interventions and climate change. Proc. Natl. Acad. Sci. USA 2014, 111, 3251–3256. [Google Scholar] [CrossRef] [Green Version]
  12. Sarwar, A. Water management in the indus basin in Pakistan: Challenges and opportunities. Indus. River Basin. Water Secur. Sustain. 2019, 31, 375–388. [Google Scholar] [CrossRef]
  13. Hussain, I.; Hussain, Z.; Sial, M.H.; Akram, W.; Farhan, M.F. Water Balance, Supply and Demand and Irrigation Efficiency of Indus Basin. Water 2011, 49, 13–38. [Google Scholar]
  14. Asian Development Bank Report and Recommendation of the President to the Board of Directors. Proposed Multitranche Financing Facility India: Uttaranchal Power Sector Investment Program. Available online: https://www.adb.org/sites/default/files/project-document/68491/37139-ind-rrp.pdf (accessed on 2 January 2022).
  15. Young, W.J.; Anwar, A.; Bhatti, T.; Borgomeo, E.; Davies, S.; Garthwaite, W.R., III; Gilmont, E.M.; Leb, C.; Lytton, L.; Makin, I.; et al. Pakistan: Getting More from Water. Water Security Diagnostic; World Bank: Washington, DC, USA, 2019. [Google Scholar]
  16. Mekonnen, M.M.; Hoekstra, A.Y. Four billion people facing severe water scarcity. Sci. Adv. 2016, 2, e1500323. [Google Scholar] [CrossRef] [PubMed] [Green Version]
  17. Ahmad, M.D.; Turral, H.; Nazeer, A. Diagnosing irrigation performance and water productivity through satellite remote sensing and secondary data in a large irrigation system of Pakistan. Agric. Water Manag. 2009, 96, 551–564. [Google Scholar] [CrossRef]
  18. Ahmad, M.U.D.; Bastiaanssen, W.G.M.; Feddes, R.A. A new technique to estimate net groundwater use across large irrigated areas by combining remote sensing and water balance approaches, Rechna Doab, Pakistan. Hydrogeol. J. 2005, 13, 653–664. [Google Scholar] [CrossRef]
  19. Waqas, M.M.; Awan, U.K.; Cheema, M.J.M.; Ahmad, I.; Ahmad, M.; Ali, S.; Shah, S.H.H.; Bakhsh, A.; Iqbal, M. Estimation of Canal Water Deficit Using Satellite Remote Sensing and GIS: A Case Study in Lower Chenab Canal System. J. Indian Soc. Remote Sens. 2019, 47, 1153–1162. [Google Scholar] [CrossRef]
  20. Ahmed, S.; Cheema, M.J.M.; Ahmed, W.; Arshad, M. Delineation of hydrological response units to estimate water demand of canal command in lower chenab canal using gis modeling. Pakistan J. Agric. Sci. 2018, 55, 211–215. [Google Scholar] [CrossRef]
  21. Using RS and GIS to Access Crop Water Productivity after Canal. Available online: http://wseas.us/e-library/conferences/2015/Tenerife/ENVIR/ENVIR-34.pdf (accessed on 2 January 2022).
  22. Mikosch, N.; Becker, R.; Schelter, L.; Berger, M.; Usman, M.; Finkbeiner, M. High resolution water scarcity analysis for cotton cultivation areas in Punjab, Pakistan. Ecol. Indic. 2020, 109, 105852. [Google Scholar] [CrossRef]
  23. Usman, M.; Qamar, M.U.; Becker, R.; Zaman, M.; Conrad, C.; Salim, M. Numerical modelling and remote sensing based approaches for investigating groundwater dynamics under changing land-use and climate in the agricultural region of Pakistan. J. Hydrol. 2020, 581, 124408. [Google Scholar] [CrossRef]
  24. Finogenova, N.; Berger, M.; Schelter, L.; Becker, R.; Aus der Beek, T.; Usman, M.; Weber, F.-A.; Finkbeiner, M. Towards a Region-Specific Impact Assessment of Water Degradation In Water Footprinting. Indones. J. Life Cycle Assess. Sustain. 2019, 1, 8. [Google Scholar] [CrossRef]
  25. Shakir, A.S.; Rehman, H.; Khan, N.M.; Qazi, A.U. Impact of canal water shortages on groundwater in the Lower Bari Doab canal system in Pakistan. Pakistan J. Eng. Appl. Sci. 2011, 9, 87–97. [Google Scholar]
  26. Rizwan, M.; Bakhsh, A.; Li, X.; Anjum, L.; Jamal, K.; Hamid, S. Evaluation of the impact ofwater management technologies on water savings in the Lower Chenab Canal command area, Indus river Basin. Water 2018, 10, 681. [Google Scholar] [CrossRef] [Green Version]
  27. Bakhsh, A.; Rizwan, M. Improved on-farm water management practices. World Irrig. Forum 2016, 1, 6–8. [Google Scholar]
  28. Shabbir, A.; Arshad, M.; Bakhsh, A.; Usman, M.; Shakoor, A.; Ahmad, I.; Ahmad, A. Apparent and real water productivity for cotton-wheat zone of Punjab, Pakistan. Pakistan J. Agric. Sci. 2012, 49, 323–329. [Google Scholar]
  29. Bakhsh, A.; Chauhdary, J.N.; Ahmad, N. Improving crop water productivity of major crops by adopting bed planting in rechna doab Pakistan. Pakistan J. Agric. Sci. 2018, 55, 965–972. [Google Scholar] [CrossRef]
  30. Steduto, P.; Hsiao, C.T.; Fereres, E.; Raes, D. Crop Yield Response to Water; Food and Agriculture Organization of the United Nations: Rome, Italy, 2012; p. 503. ISBN 9789251072745. [Google Scholar]
  31. Mungi Canal Relevant Information. Available online: https://irrigation.punjab.gov.pk/channel-information (accessed on 2 January 2022).
  32. M1 Mini Current Meter Relevant Information. Available online: https://tinyurl.com/ycksc25k (accessed on 2 January 2022).
  33. Musa, J.J.; Mustapha, I.H.; Yerima, I.Y.; Kuti, I.A.; Abogunrin, M.E. Evaluation of Irrigation Application Efficiency: Case Study of Chanchaga Irrigation Scheme. Arid Zo. J. Eng. 2016, 12, 58–64. [Google Scholar]
  34. ML3 Theta Probe Mobile Sensor Relevant Information. Available online: https://delta-t.co.uk/wp-content/uploads/2017/02/ML3-user-manual-version-2.1.pdf (accessed on 2 January 2022).
  35. Meteorological Station of the University of Agriculture Faisalabad (UAF). Available online: http://uaf.edu.pk/faculties/agri/depts/crop_physiology/agri_met_cell/met_bulletin.html (accessed on 25 November 2021).
  36. Frenken, K. Irrigation Potential in Africa: A Basin Approach; FAO Land and Water Bulletin 4; Food and Agriculture Organization of the United Nations: Rome, Italy, 1997. [Google Scholar]
  37. Kazmi, S.I.; Ertsen, M.W.; Asi, M.R. The impact of conjunctive use of canal and tube well water in Lagar irrigated area, Pakistan. Phys. Chem. Earth 2012, 47–48, 86–98. [Google Scholar] [CrossRef]
  38. Agro-Ecological Zones in Punjab-Pakistan. Available online: https://www.fao.org/3/ca6938en/CA6938EN.pdf (accessed on 2 January 2022).
  39. Razzaq, A.; Qing, P.; ur Rehman Naseer, M.A.; Abid, M.; Anwar, M.; Javed, I. Can the informal groundwater markets improve water use efficiency and equity? Evidence from a semi-arid region of Pakistan. Sci. Total Environ. 2019, 666, 849–857. [Google Scholar] [CrossRef]
  40. Murray-Rust, D.H.; Vander Velde, E.J. Conjunctive use of canal and groundwater in Punjab, Pakistan: Management and policy options. Irrig. Drain. Syst. 1994, 8, 201–231. [Google Scholar] [CrossRef]
  41. Usman, M.; Liedl, R.; Zhang, F.; Zaman, M. Groundwater Irrigated Agriculture Evolution in Central Punjab, Pakistan. Sustain. Agric. Rev. 2018, 33, 259–294. [Google Scholar] [CrossRef]
  42. Kirby, M.; Ahmad, M.u.-D.; Mainuddin, M.; Khaliq, T.; Cheema, M.J.M. Agricultural production, water use and food availability in Pakistan: Historical trends, and projections to 2050. Agric. Water Manag. 2017, 179, 34–46. [Google Scholar] [CrossRef]
  43. Berardi, M.; D’Abbicco, M.; Girardi, G.; Vurro, M. Optimizing Water Consumption in Richards’ Equation Framework with Step-Wise Root Water Uptake: A Simplified Model. Transp. Porous Media 2022, 1–30. [Google Scholar] [CrossRef]
  44. Lopes, S.O.; Fontes, F.A.C.C.; Pereira, R.M.S.; De Pinho, M.; Gonçalves, A.M. Optimal Control Applied to an Irrigation Planning Problem. Math. Probl. Eng. 2016, 2016, 5076879. [Google Scholar] [CrossRef] [Green Version]
  45. Mao, Y.; Liu, S.; Nahar, J.; Liu, J.; Ding, F. Soil moisture regulation of agro-hydrological systems using zone model predictive control. Comput. Electron. Agric. 2018, 154, 239–247. [Google Scholar] [CrossRef]
Figure 1. Study flow chart.
Water 14 00405 g001
Figure 2. Location of the selected fields and canal measurement points in and near the Mungi Distributary canal command area.
Water 14 00405 g002
Figure 3. Land cover of Mungi Distributary canal command area for the Kharif and Rabi seasons of 2018/2019.
Water 14 00405 g003
Figure 4. Monthly water supply of the Reakla minor distributary 2018/2019.
Water 14 00405 g004
Figure 5. Monthly water supply of the Mungi minor distributary 2018/2019.
Water 14 00405 g005
Figure 6. Monthly water supply of the Mungi Distributary canal 2018/2019.
Water 14 00405 g006
Figure 7. Water supply contribution to the cotton fields’ in the Mungi area.
Water 14 00405 g007
Figure 8. Farm G canal water supply and demand comparison.
Water 14 00405 g008
Figure 9. Water demand and supply of the Reakla minor distributary.
Water 14 00405 g009
Figure 10. Water demand and supply of the Mungi minor distributary.
Water 14 00405 g010
Figure 11. Mungi Distributary canal water supply and demand.
Water 14 00405 g011
Figure 12. Monthly water supply of Mungi Distributary canal and gross irrigation water requirement.
Water 14 00405 g012
Table 1. Information regarding the fields that were selected in and near Mungi Distributary canal command area.
Field NameIrrigation MethodPlot Size
(Hectare)
Year of
Observation
Field AConventional Furrow0.42019/2020
Field BRaised Bed and Furrow0.4 and 0.62019/2020
Field CFlood basin0.82019
Field DDrip0.32019
Field ERidge-furrow0.62020
Field FRidge-furrow 0.482020
Cotton field
In Farm G
Raised Bed and Furrow 0.4 2019
Table 2. Farm G’s Kharif and Rabi season cropping patterns for 2018/2019.
SeasonCropsArea of the Crop (Hectare)
Kharif seasonMaize10.1
Cotton2.8
Rice5.3
Vegetable (okra)0.8
Fodder (sorghum)1.2
Annual cropSugarcane3.2
Rabi seasonWheat15.4
Canola2.8
Maize1.2
Fodder (berseem)0.8
Table 3. Evaluation conveyance efficiency in canals of typical hierarchy levels in Mungi.
Canal DescriptionConditionLength (m)Discharge
Capacity (L/s)
Percolation and Seepage Losses (L/m2 Wetted Area) × hConveyance Efficiency per Kilometer
(1–2) Reakla minorLined26032009.897.4
(10–11) Mungi minor Lined1728717.195.1
(7–8) middle minorLined14805115.490.72
(3–5) WatercoursePartially lined28007020.2489.7
(3–4) Watercourseunlined11356345.6270.63
(8–9) Field ditchunlined6204436.674.3
(5–6) Field ditchunlined3035635.276.4
Table 4. Application efficiency of cotton cultivation methods in the Mungi area.
Field
Description
Field Capacity
(mm)
Date of IrrigationGross Water Applied (mm)Date of Soil Sampling (Before–After) IrrigationApplication Efficiency (%)
Field A 2020250-021 June–3 July68.1
9 July509–12 July74.6
-09–13 August75
Field A 2019-021–26 June68.7
26 June6326 June–3 July61.6
10 July577–14 July50.6
Field B 202024028 June3828 June–3 July81.6
12 July2912–19 July76.9
16 August3713–20 August47.2
Field B 201923 June4219 June–3 July79.2
3 July353–14 July84.4
14 July2514–20 July71.5
Field C 201921023 June9321 June–7 July35
17 July10217–20 July39.3
Field D 2019290Irrigating everyday by 1 or 2 mm1225 June–3 July91.4
53–7 July93.02
97–20 July98.4
Field E 202027030 June1528 June–3 July79.6
12 July3212–16 July44
Field F 202031030 June3028 June–3 July83.9
-09–19 July51.3
17 August349–20 August77.7
Table 5. Canal water supply and demand of cotton fields in the Mungi Distributary canal command area.
Field NameWeekly Canal Water
Allowance (mm)
Canal Water Applied Over Cotton Growth
Period (mm)
Groundwater Applied Over Cotton Growth Period (mm)Gross Water Applied Over Cotton Growth Period (mm)Canal Water Percentage
Deficit (−)
Field A17324.5756.51081−69.98
Field B10187.6486.4674−72.12
Field C13.8263.7216.3480−45.07
Cotton field in Farm G9172.4477.6650−73.48
Table 6. Monthly water supply of the Mungi Distributary Canal and the gross irrigation water requirement of the Mungi canal irrigation scheme.
Rabi CropsKharif CropsAnnual CropMonthly 1 GIWR (mm)Monthly Mungi Canal Water Supply (mm)
WheatFodder (Berseem)Tomato Potato CanolaMaizeCottonRiceFodder (Surghum)Maize OkraSugarcaneOrchard as Citrus
Actual ET (mm)
April15.263.7138.6 109.725.3 81.7 54.3159.751.261.726.6
May 31 88.4120190 128.4191.2119.7143.326.3
June 129.33601693.6180.4175.4159.9224.748.6
July 188.6240 128.2174.3171.8182.589.854.2
August 174.9180 164.736.6161.2173.1208.054.1
September 127.260 138.1 128.196.598.049.6
October 13.425.9 63.3 31.4 89.958.647.544.6
November13.217.3 37.314.8 2 48.223.821.250.1
December26.720.4 46.210.9 13.24.431.761.0
January47.413.68.647.111.616 9.47.651.426.2
February61.125.457.4 24.853.7 27.531.341.85.0
March92.4100.6111.4 16129.6 14.3 89.444.490.140.6
Sowing date22 Nov19 Nov 24 Jan 15 Oct6 Oct30 Jun28 Apr27 May29 Mar8 Jan8 Apr15 Feb1 Apr
Harvest date16 Apr 24 Jan13 May30 Jan14 Mar17 Oct 31 Oct10 Oct 30 Jun28 Apr21 Aug14 Feb30 Mar
1 GIWR: gross irrigation water requirement.
Publisher’s Note: MDPI stays neutral with regard to jurisdictional claims in published maps and institutional affiliations.

