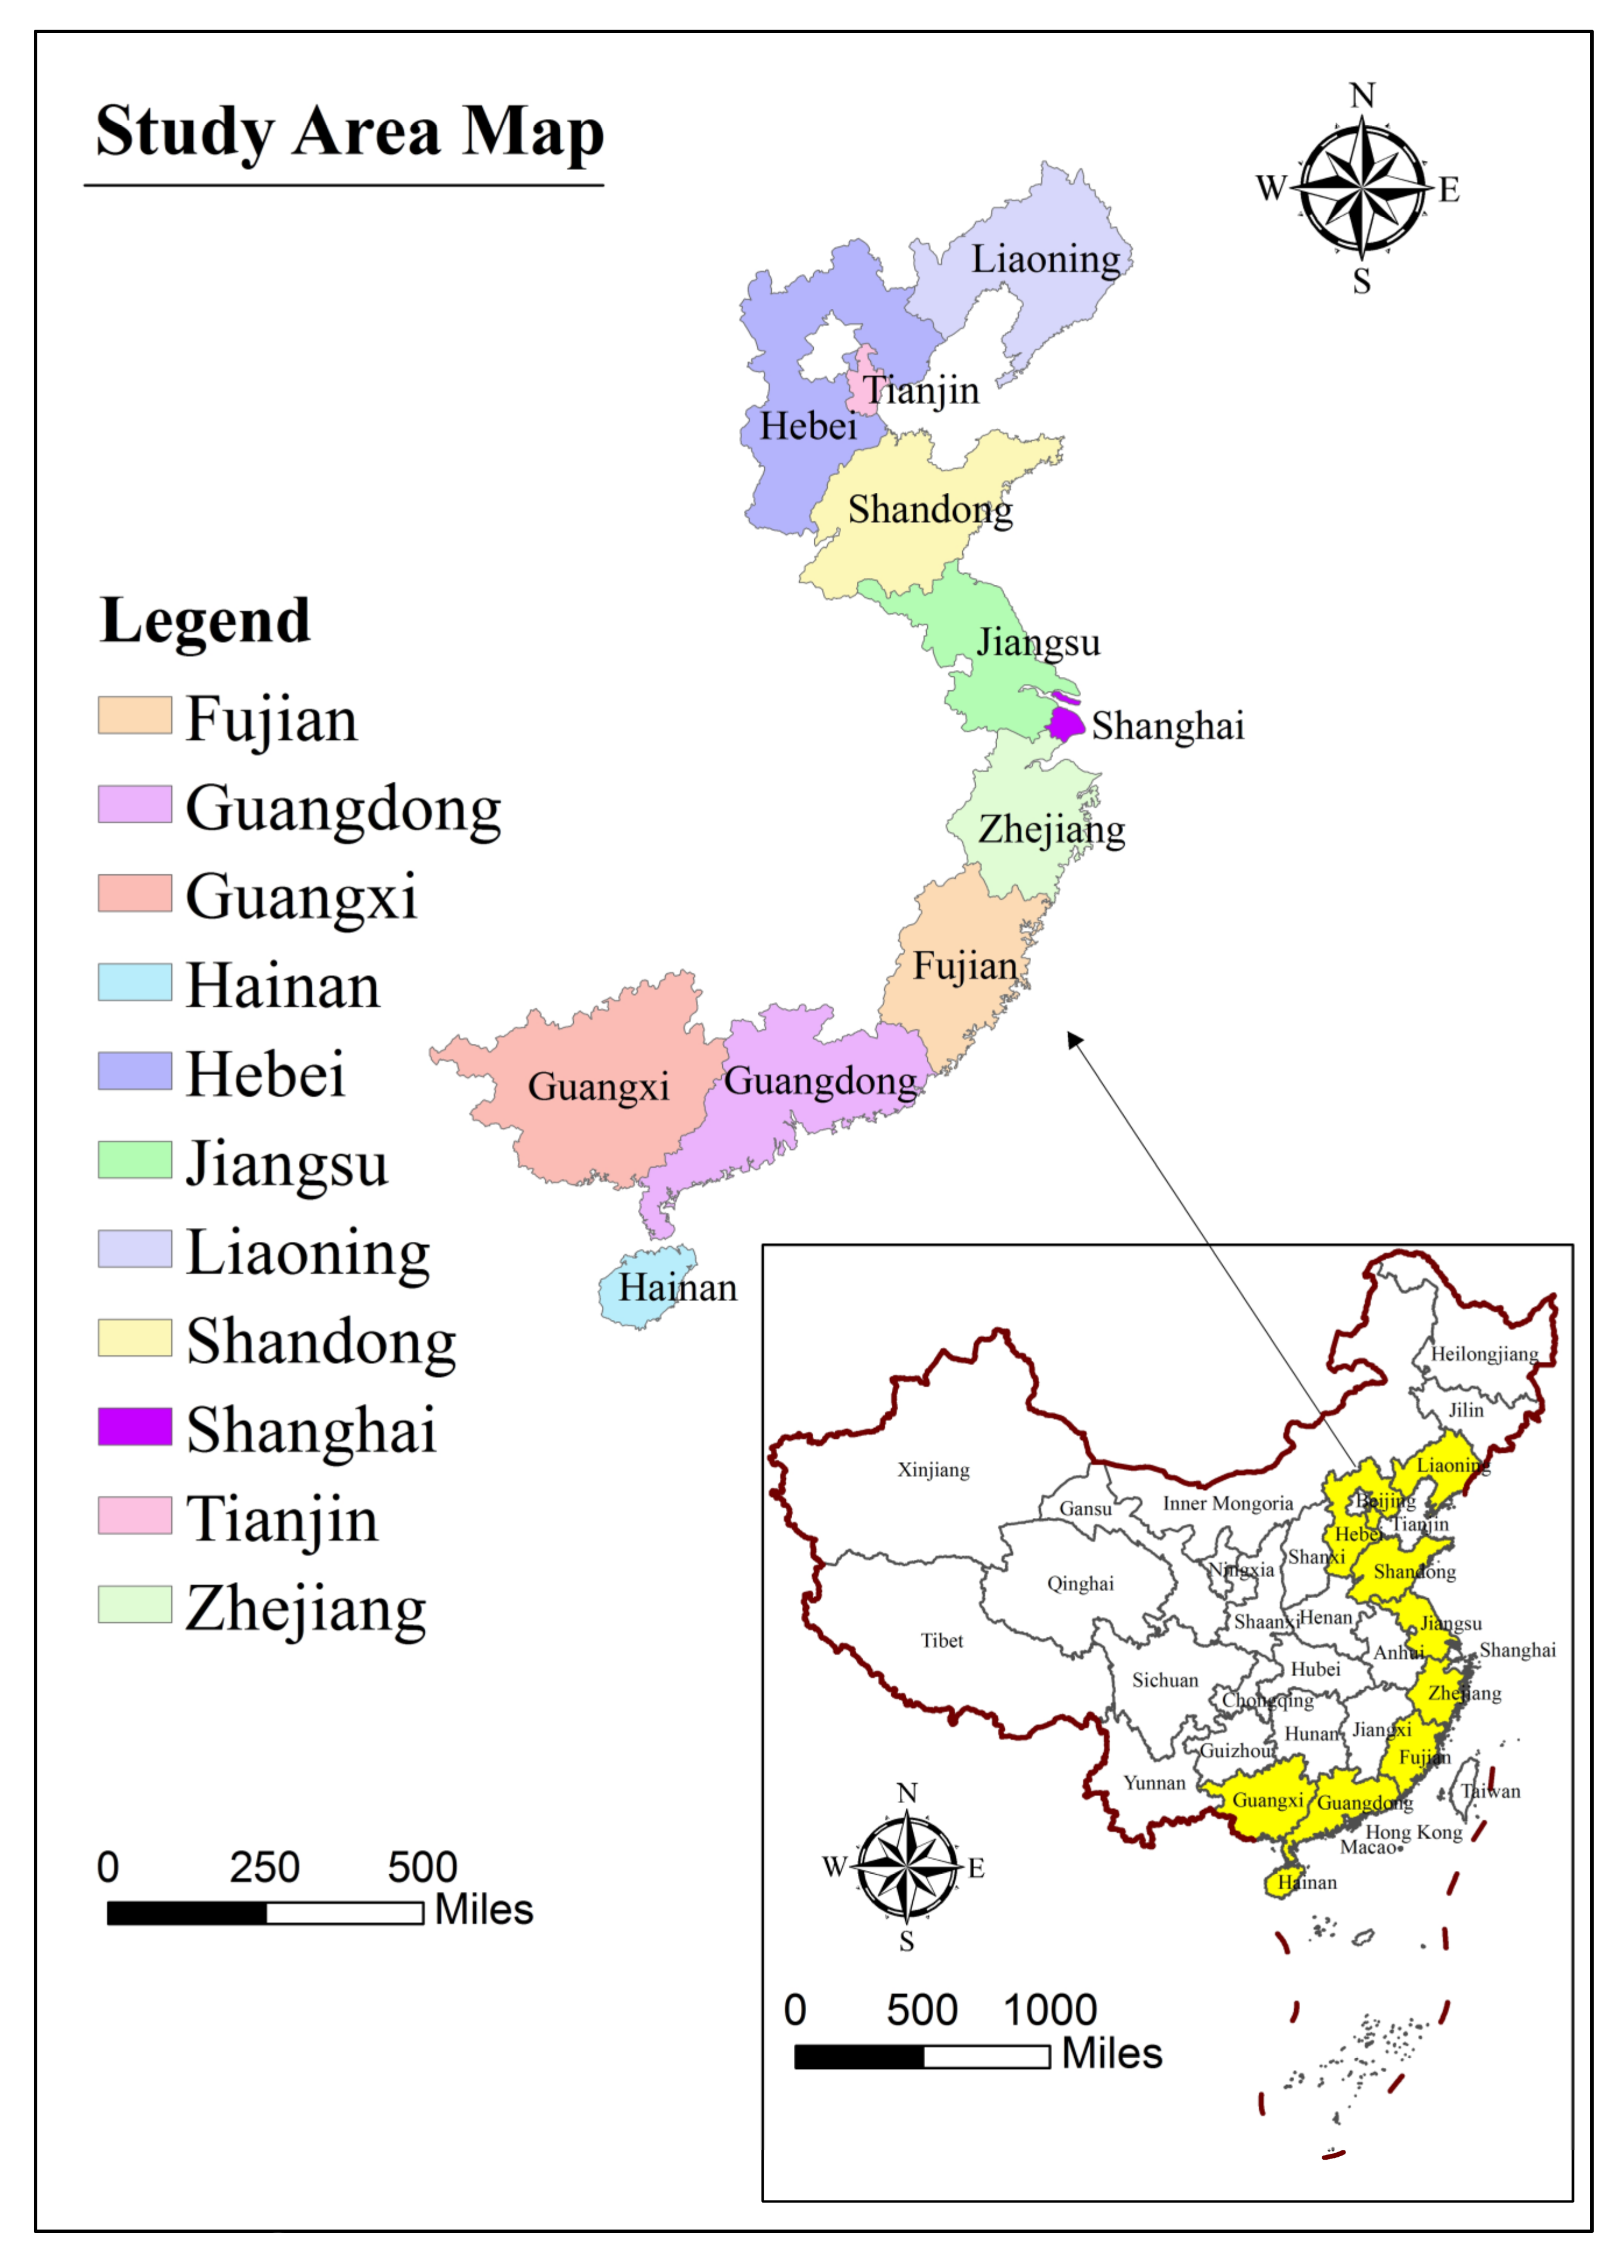
The paper analyzed the panel data of 11 provinces along China’s coast from 2006 to 2018 (
Figure 2). The data are mainly from the 2007–2019 China Marine Statistics Yearbook, the China Statistical Yearbook, and the China Environmental Statistics Yearbook. The missing data are supplemented by the interpolation method. Considering the resource and environmental constraints in the marine economic system, this paper incorporated the utilization of marine resources and their impact on the environment into the evaluation system based on capital and labor inputs.
2.3.1. Input Indicator
(1) Capital.
In this paper, the marine economic capital stock was used as the capital input index. The capital stock measures the total cost of construction and acquisition of fixed assets related to production activities over a period. Referring to the research of Shan [
39], this paper used the perpetual inventory method to measure the fixed assets of 11 coastal areas. As shown in Formula (10):
and
represent the capital stock in period
and
respectively,
indicates the investment for the current year, expressed in terms of fixed asset completions, and
represents the fixed asset investment price index for each province for the year. This paper selected 2006 as the base period and drew on Xu’s treatment method [
40] to determine the capital stock of the base period in each region as:
, and
to the average annual growth rate of the
region for 2006–2018.
represents the depreciation rate of the total amount of fixed asset formation. Drawing on the practice of Shan [
39],
takes the value of 10.96%. Finally, the capital stock data of coastal provinces were converted into marine economic capital stock by reference to the research of He et al. [
41]. The formula is as follows:
Among them, , , , and represent the gross domestic product (GDP), capital stock, GOP, and marine capital stock of coastal provinces, respectively.
(2) Labor.
In the Marine Economic Statistics Yearbook, after 2006, the number of sea-related employees in coastal areas was used to reflect the amount of labor input, which has been used until now, and the data is comparable. Therefore, with reference to the results of national economic research, the paper selected this indicator to measure labor input and records it as L.
(3) Resource.
Because the development of the marine economy is highly dependent on resource endowment, the input of marine resources is very important to the development of marine economy. Drawing on the practice of Zhao et al. [
42], this paper selected the length of the wharf, the number of coastal travel agencies, and the area of marine aquaculture. It was then converted using the entropy method as a comprehensive indicator of resource input. The calculation process for the composite indicators is as follows:
Non-quantitative processing of indicators. The original indicator data matrix is , wherein the is the value of the regional i indicator j, the proportion of this value is . Therefore, the original matrix can be converted into a scaleless matrix .
Calculate the entropy value of indicator j:.
Calculate the difference coefficient of indicator . Given the indicator , the smaller the difference between the of each sample, the greater the entropy value , the smaller the role of indicator in the comprehensive evaluation. We define , So, the bigger the , the more important the indicator is in the comprehensive evaluation.
Calculate the objective weight of indicator j:.
Calculate the composite index of resource inputs h:.
Through the above measurement steps, the weights of the length of the wharf, the number of coastal travel agencies and the area of marine aquaculture in 2006–2018 were 0.219, 0.167, and 0.614 respectively, and the resource input index was obtained as the final value according to the comprehensive weighting of this weight.
2.3.2. Output Indicator
(1) Desirable output.
The economic benefits brought by marine resources can well reflect the development of the marine economy [
43,
44]. Therefore, the GOP was used as the desirable output of the model. The regional GOP was converted to constant price levels on a 2006 basis [
45].
(2) Undesirable output.
Marine economy is similar to the national economy, in that the production and operation process will also have a negative impact on the ecological environment. Therefore, based on taking full account of the particularity and data accessibility of the marine economy, we followed the practice of Zang [
46] and used the research results of Zeng [
47] to select marine wastewater, marine exhaust gas, and marine solid waste emissions as environmental pollution indicators.
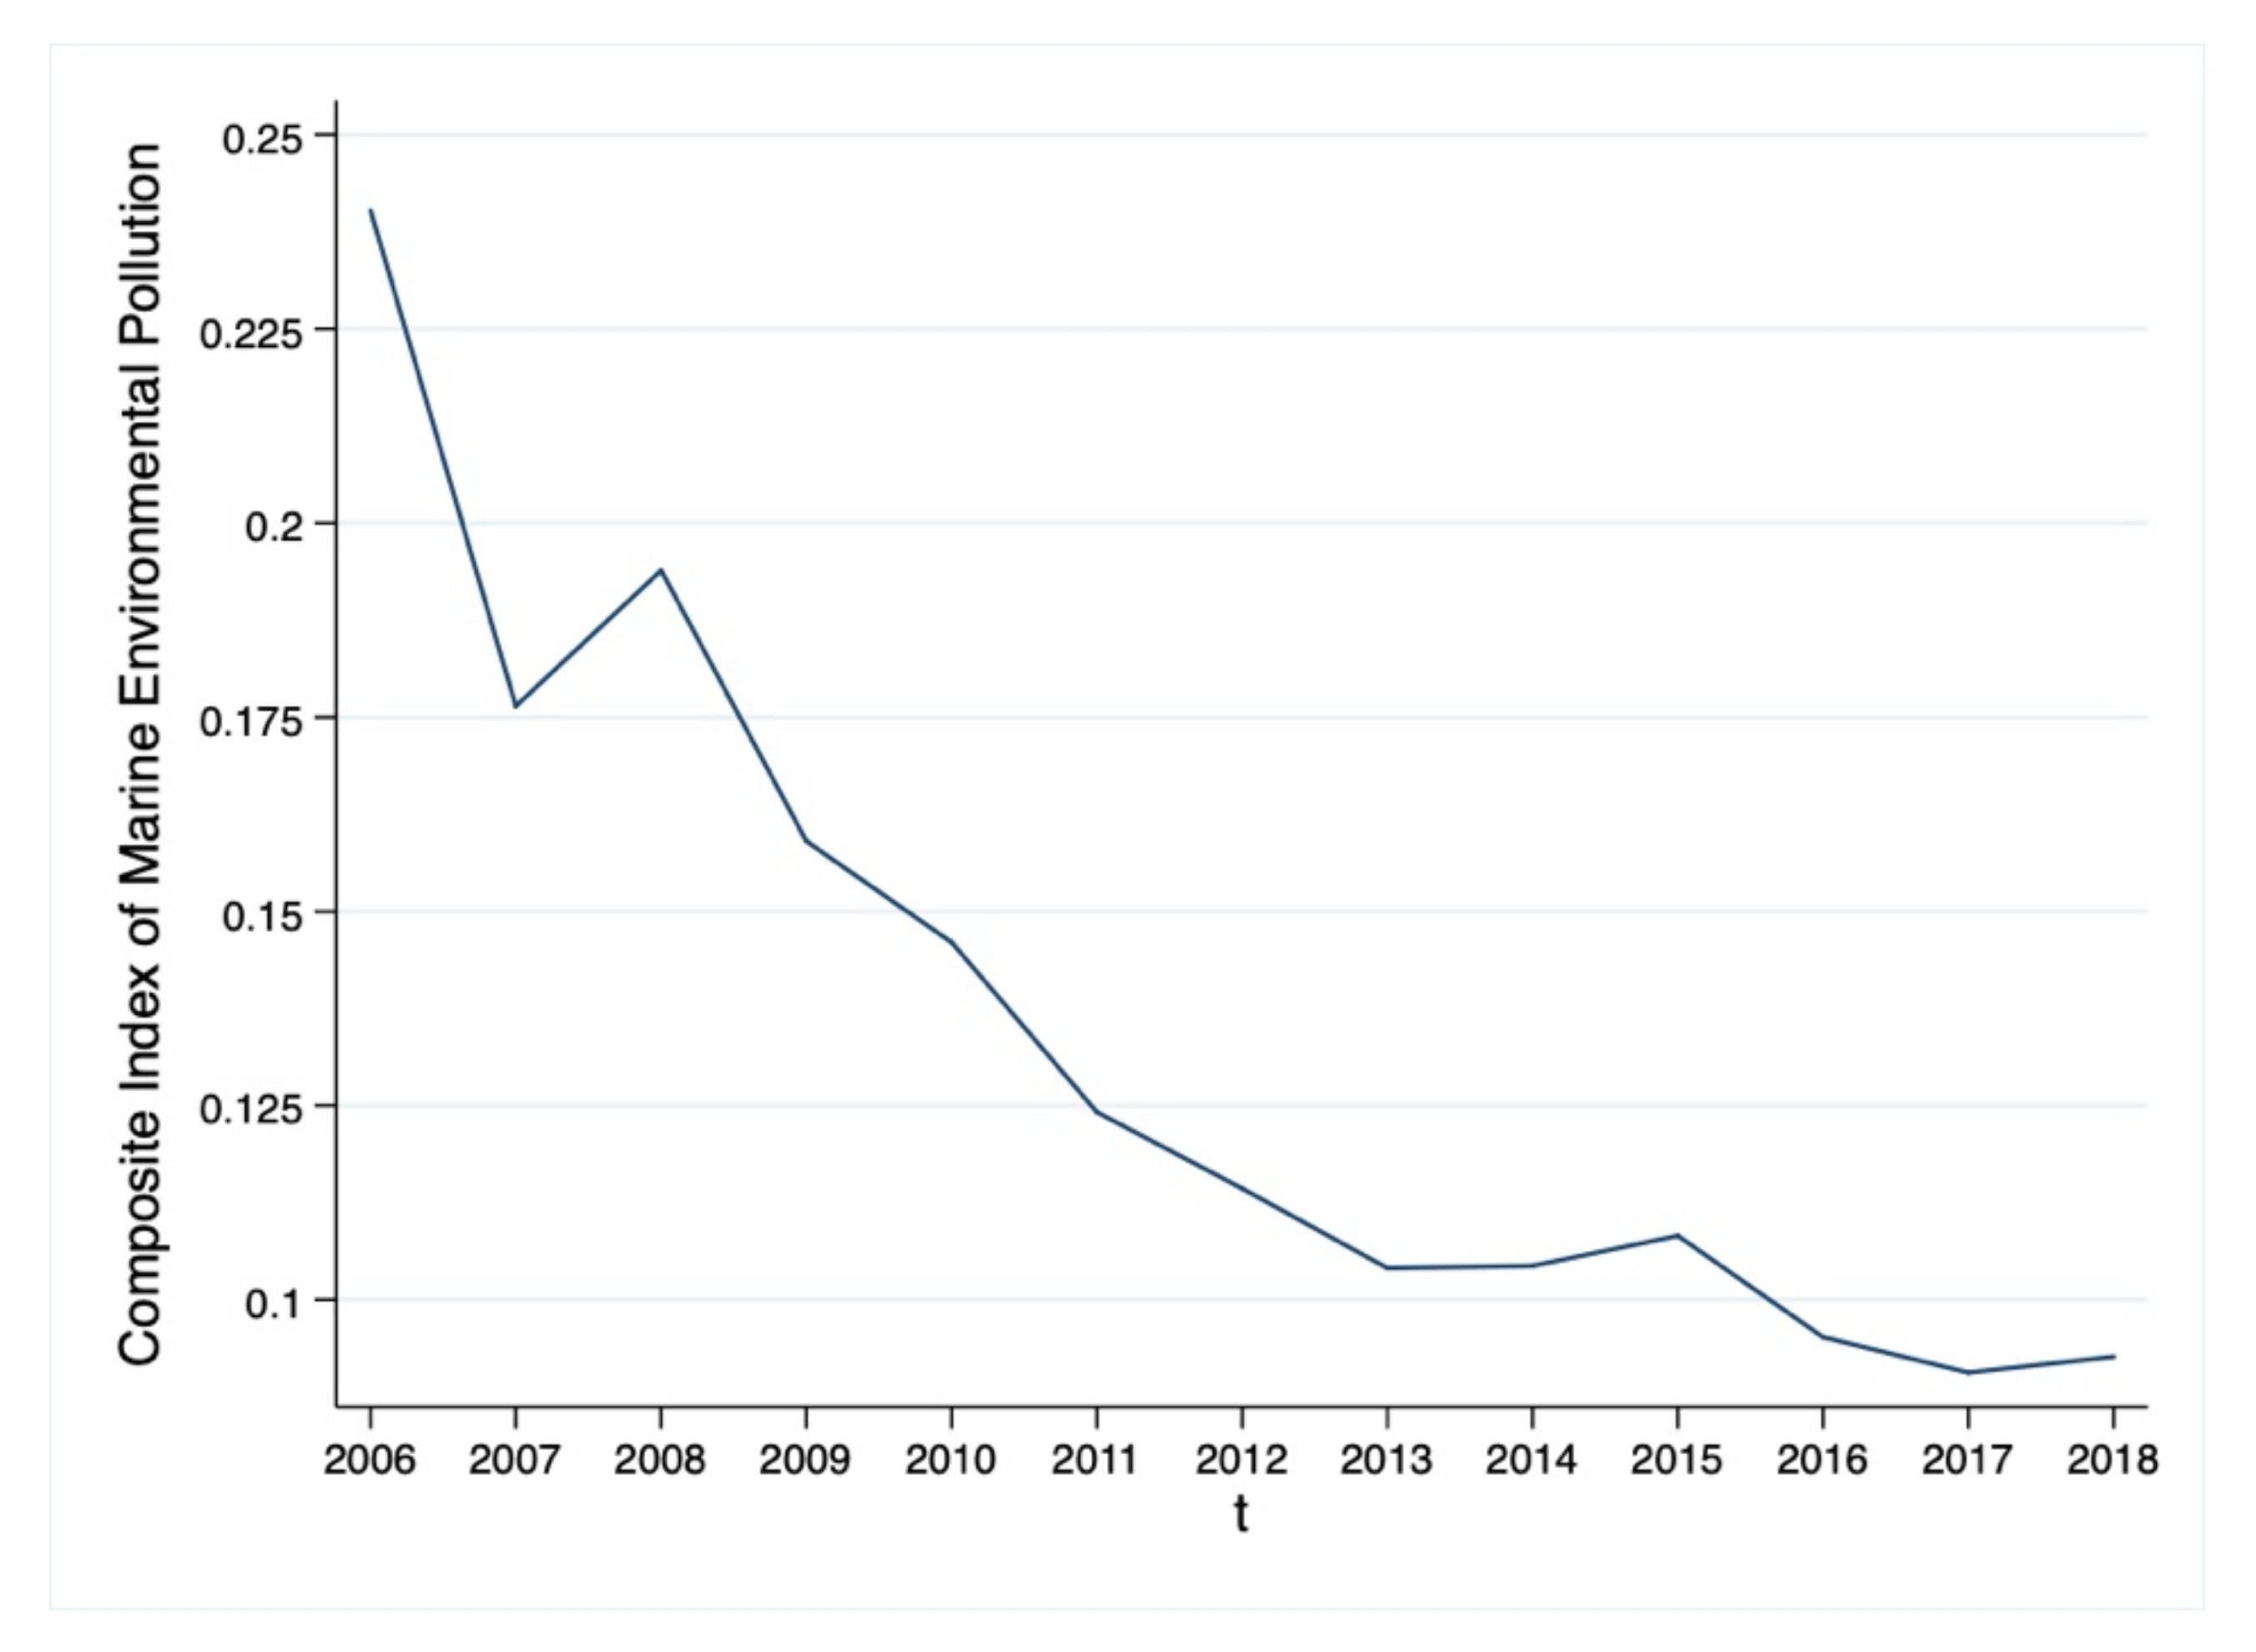
Marine industrial pollution emissions were converted according to “(GOP/GDP) × industry pollution emissions”. Then, using the entropy method, the weights of total marine wastewater discharge, total exhaust emission, and solid waste emission were 0.150, 0.127, and 0.723 respectively, according to which the three indicators of marine “three waste” emissions were combined into a comprehensive index of marine environmental pollution
[
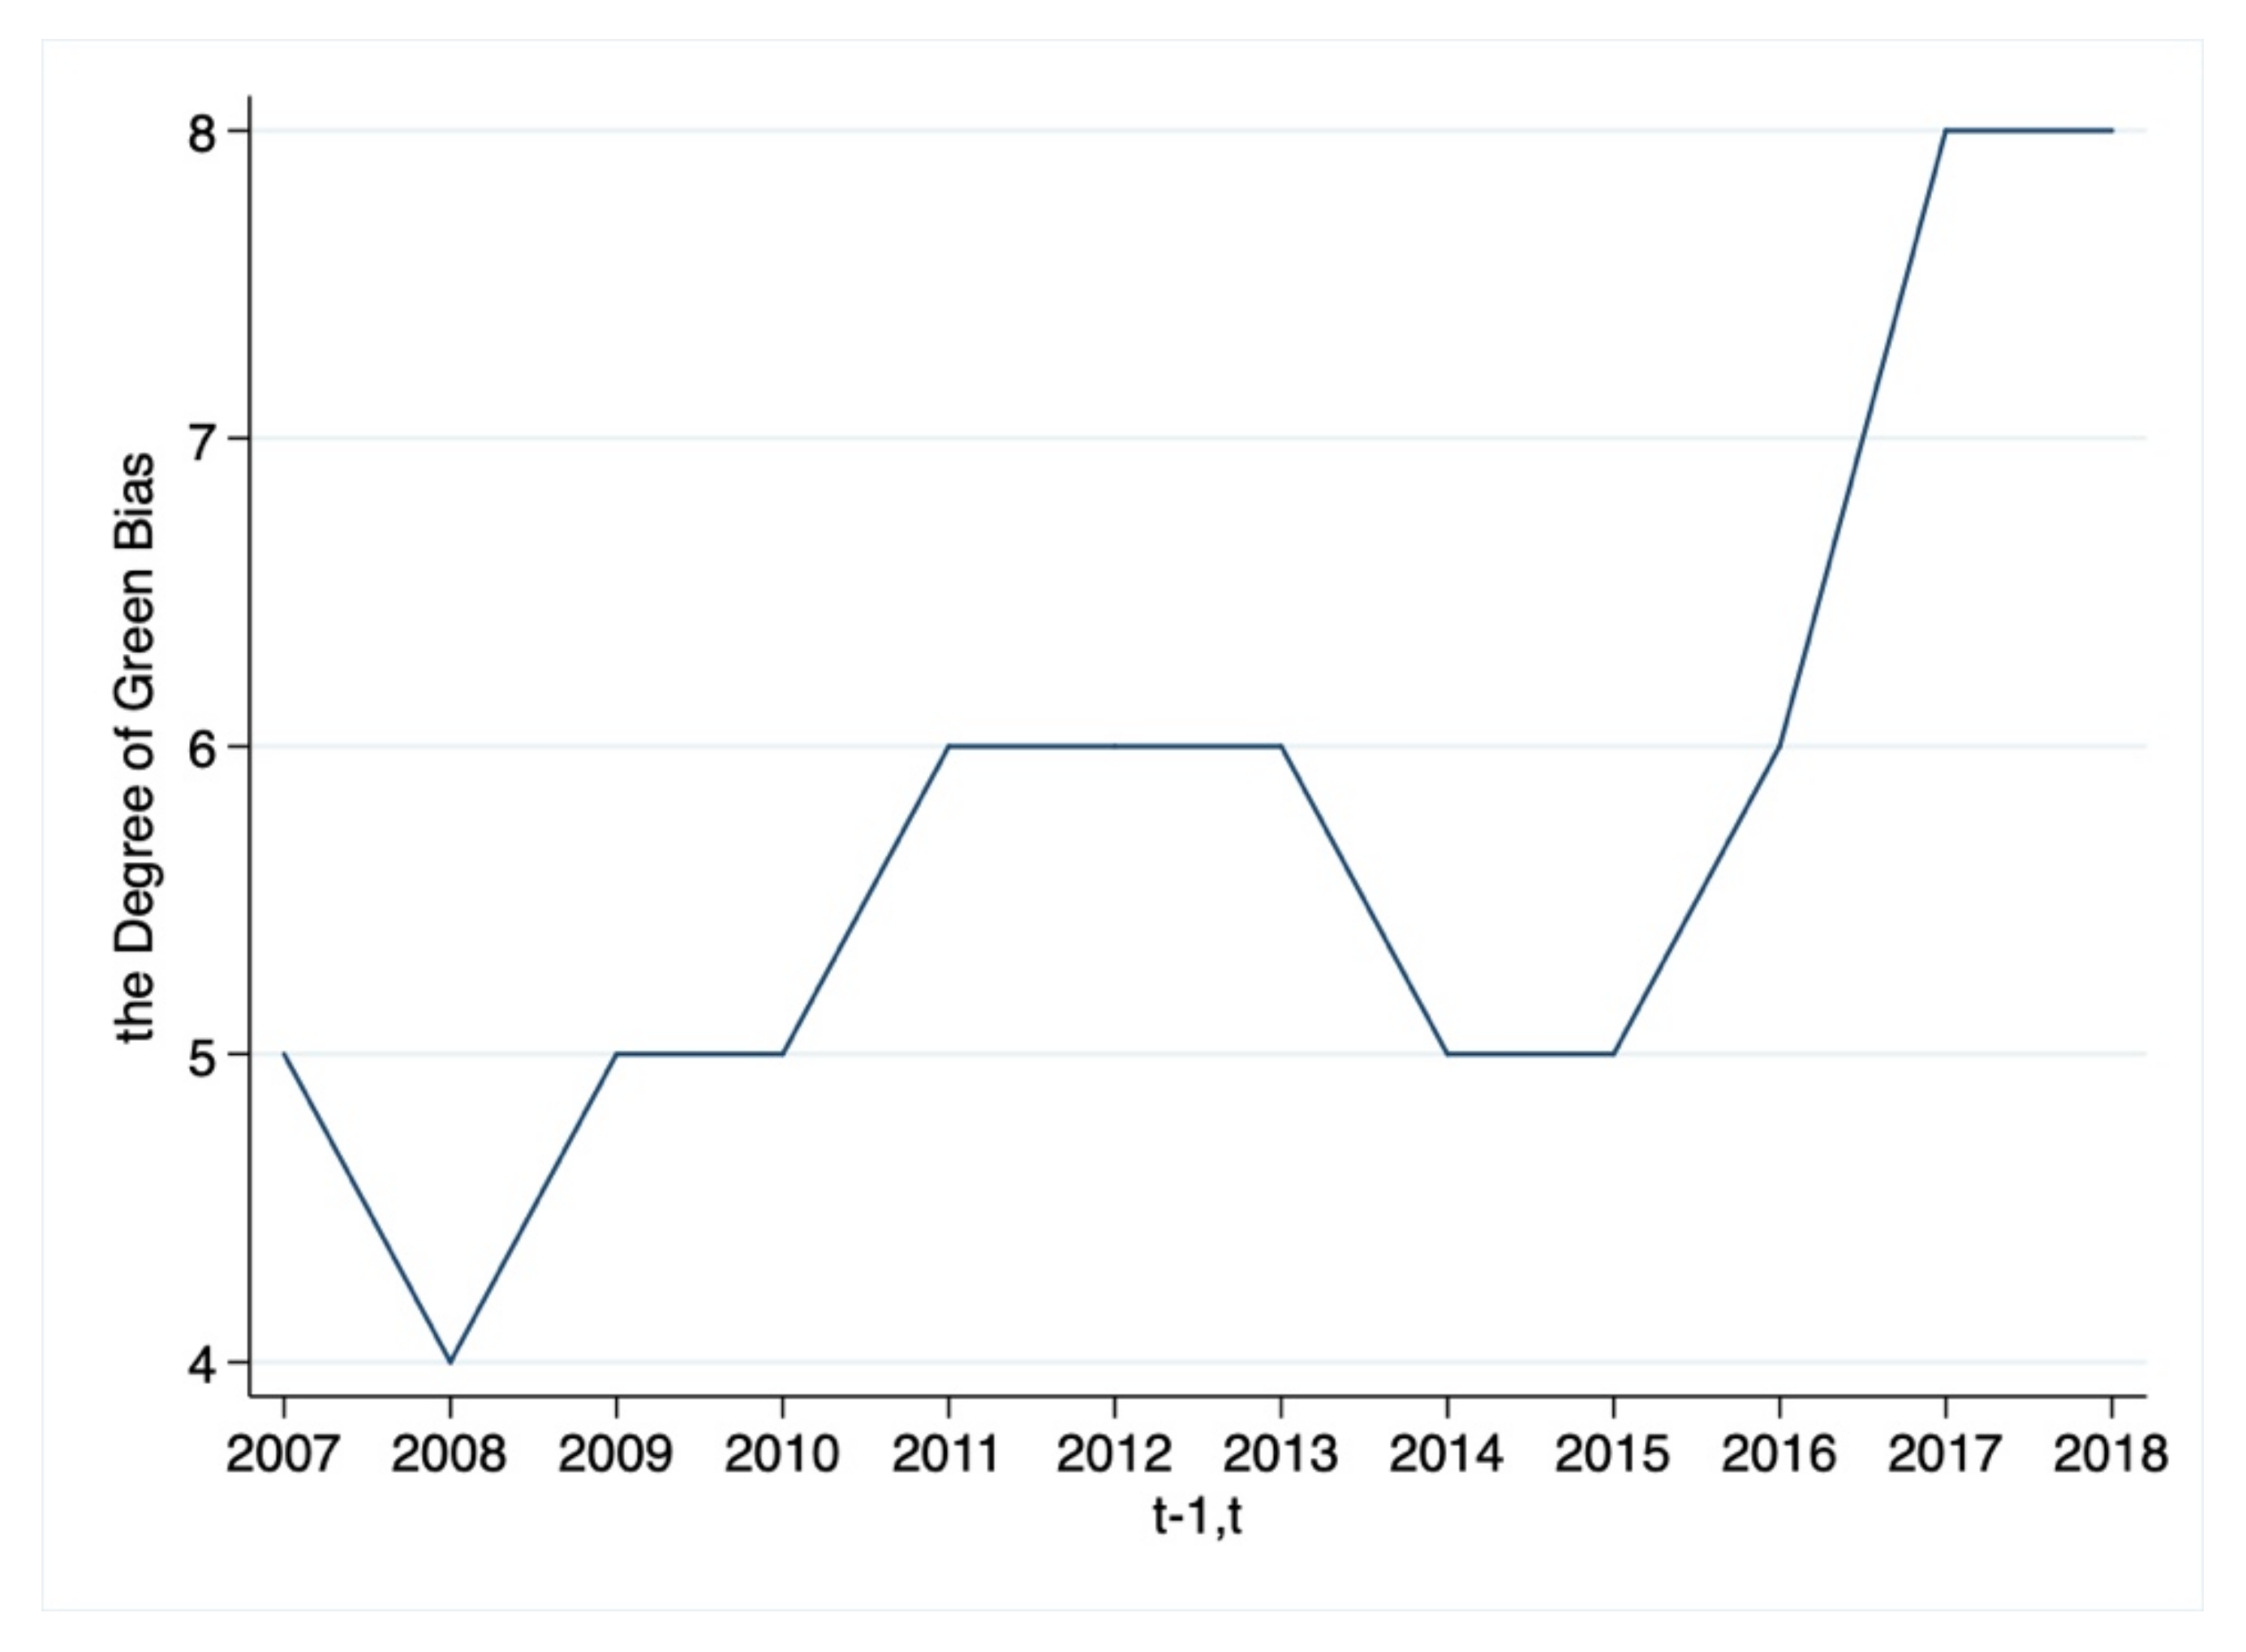
48]. This was used as an indicator of undesirable outputs. The larger the indicator, the more serious the pollution of the marine environment. China’s coastal environmental pollution index is shown in
Figure 3:
As can be seen from
Figure 3, the pollution index
in 2006–2018 shows a small range of fluctuations and an overall downward trend. Specifically, before 2008, the fluctuation of marine environmental pollution index in coastal areas of China was relatively obvious. At this stage, the marine economy has been constantly subjected to structural adjustment, the development of which is relatively extensive. Between 2008 and 2013, the comprehensive index
began to decline year by year. This is mainly due to the formulation and implementation of the government’s policies on the regulation of the marine environment, as well as the continuous promotion of marine environmental protection. After 2013, the pollution index
showed a steady downward trend, which was due to the implementation of policies, a positive effect of the previous policy on the environment that was highlighted. The development of marine green production technology has made the marine environmental protection stable and progressive during this period.
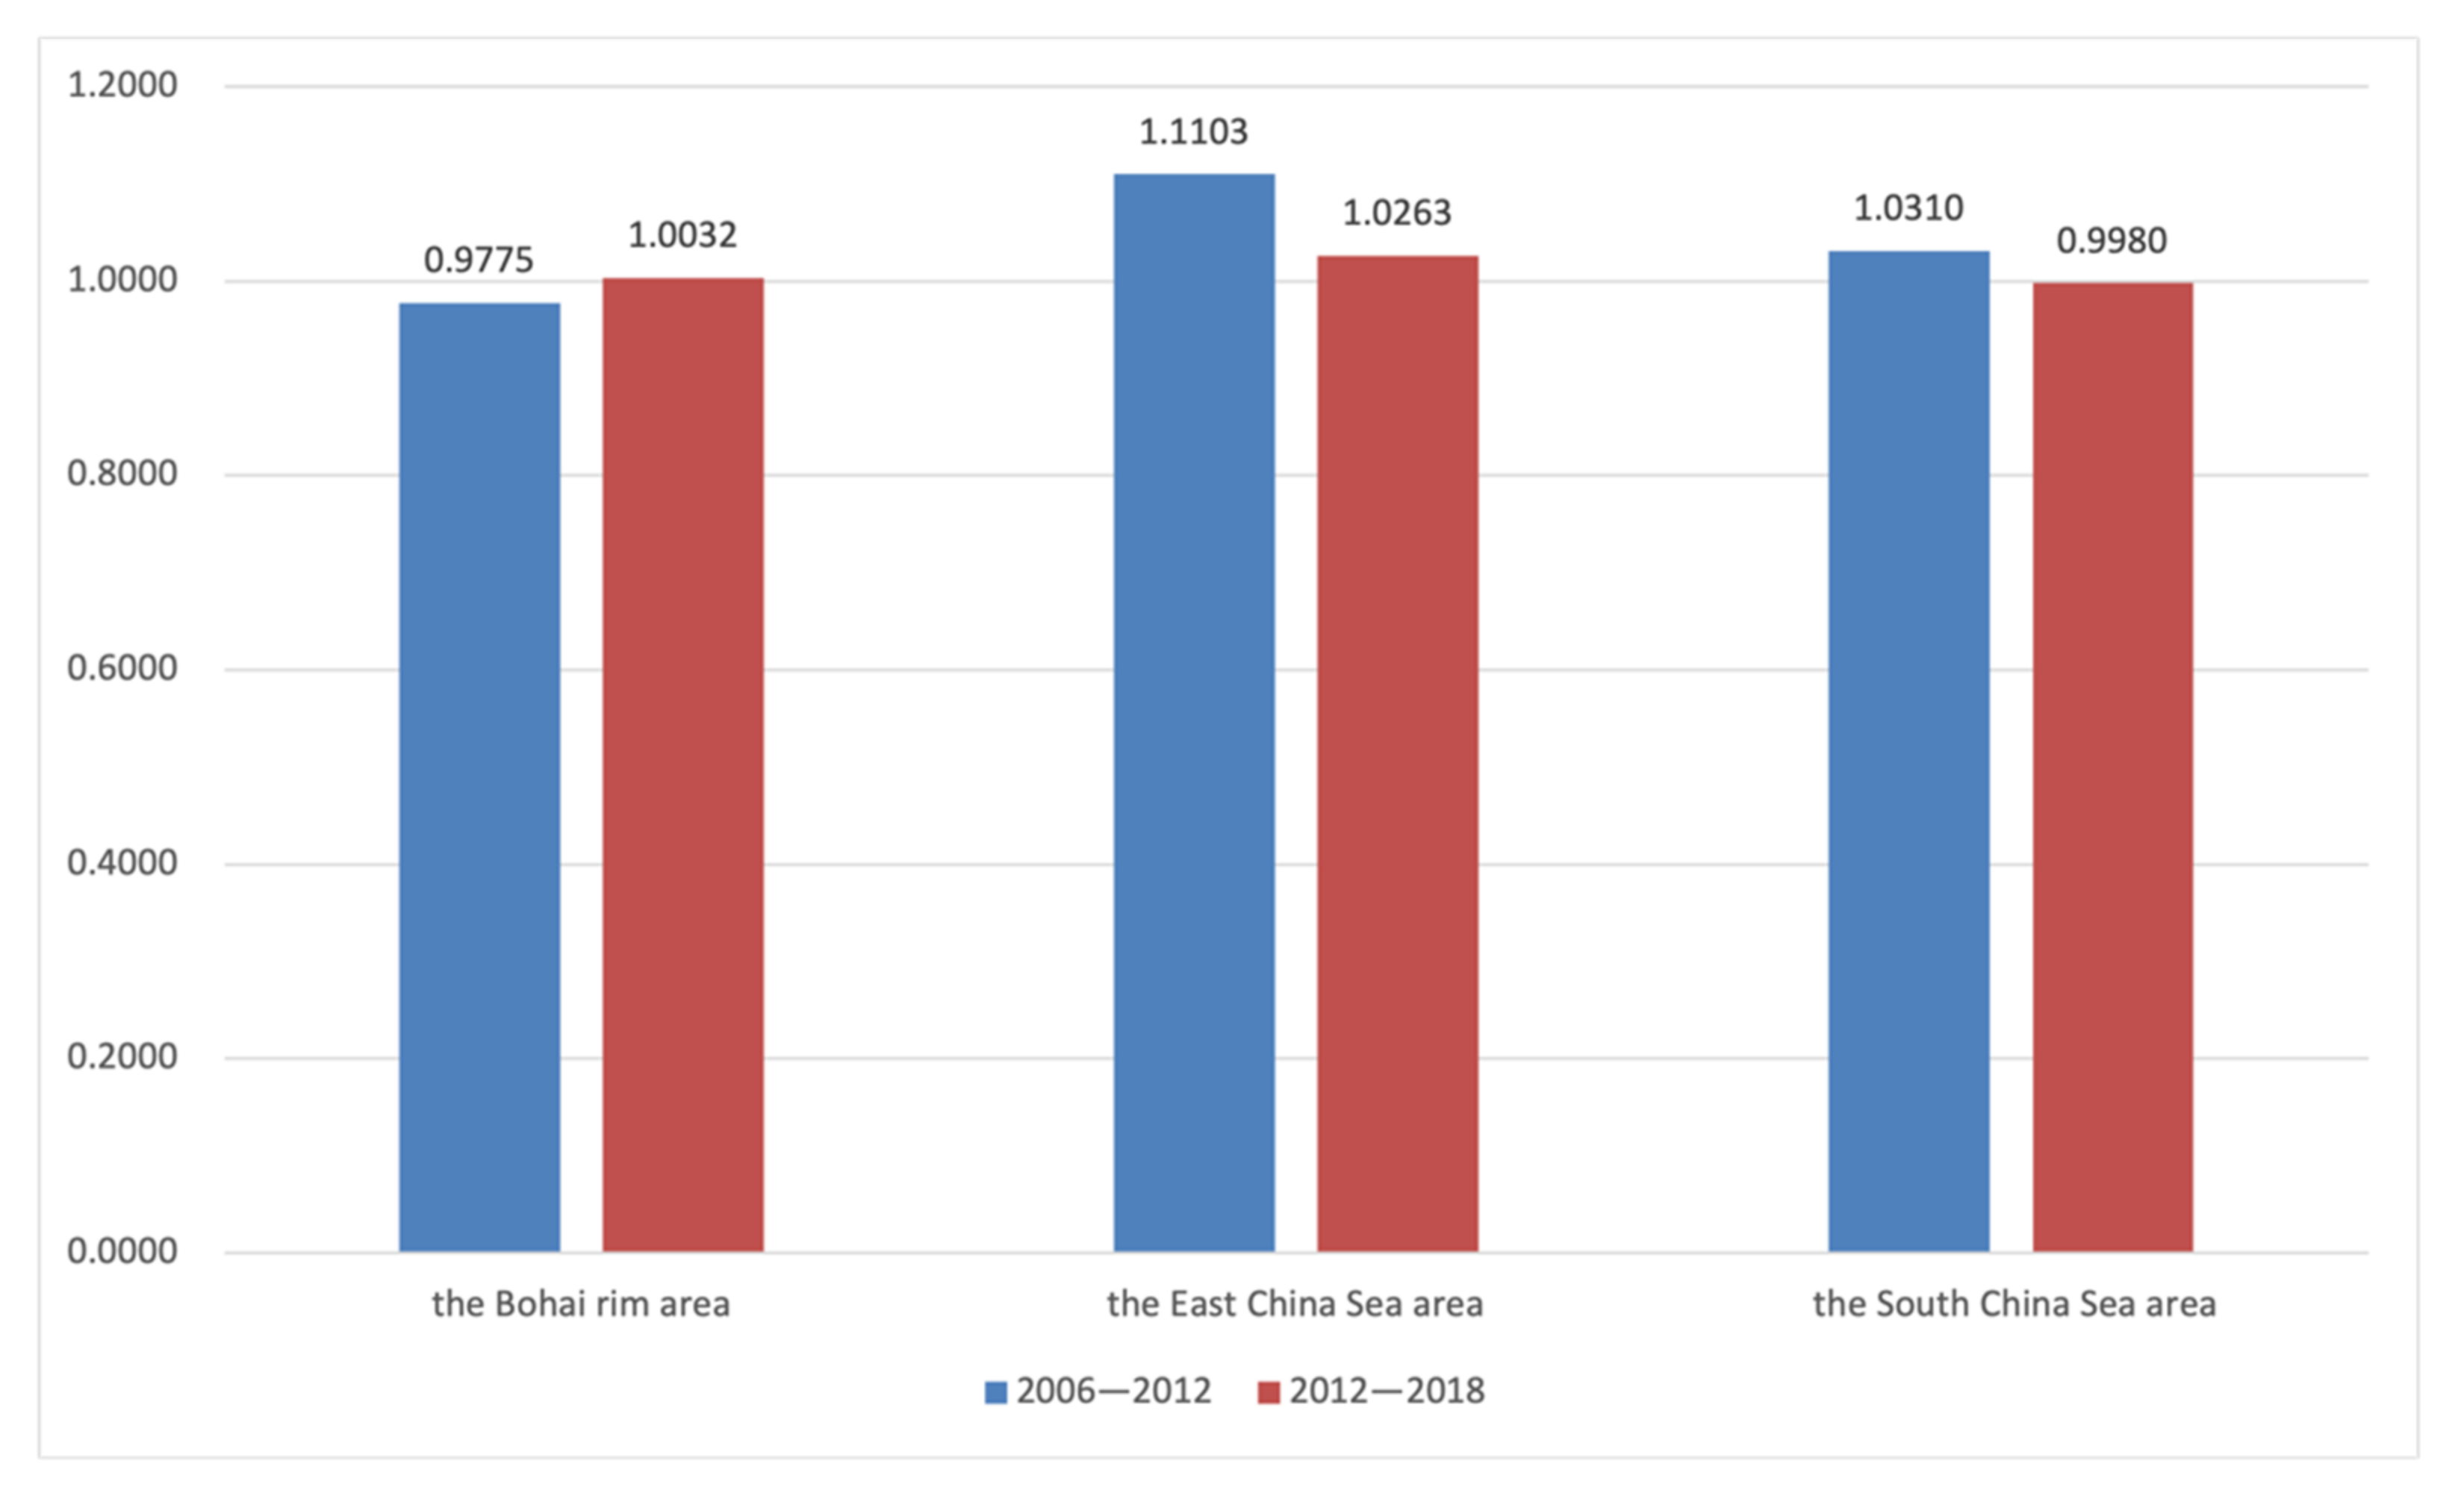
Combining the above factors, the GTFP was measured. Referring to the Classification and Code of Coastal Administrative Areas (HY/T094-2006), the 11 coastal provinces are divided into the areas of Bohai rim, the East China Sea, and the South China Sea. Among them, the Bohai rim area includes Tianjin, Hebei, Liaoning, and Shandong. The area of East China Sea includes Shanghai, Jiangsu, and Zhejiang. The area of South China Sea includes Fujian, Guangdong, Guangxi, and Hainan.
Table 2 gives the basic characteristics of the input and output indicator data. The ratio of the maximum and minimum capital input is 75.08, and the mean value of capital input exceeds the median; the ratio of maximum to minimum labor input is about 11.05, which is the smallest of several other inputs, and the standard deviation and median of the three resource input indicators are very different. It can be seen that the difference between provinces in capital input is large, material capital input shows path dependence, and the capital stock of large provinces have absorbed and accumulated more capital, resulting in the phenomenon of factor aggregation; in recent years, the mobility of the labor force between provinces is large, the distribution of labor input between provinces is relatively small, but there is still a certain gap between the quality and skill level of the labor force in different provinces; the marine economic development of each province is highly dependent on resources, but the distribution is more scattered. From the output point of view, the maximum desirable output is close to 40 times the minimum value, the scale and speed of inter-provincial marine economic growth are very different, and the maximum desirable output is also dozens of times the minimum, reflecting that the marine economic development of many provinces is at the expense of the environment, and China’s marine environmental efficiency still needs to be improved.


