Article

An Insight into the Factors Controlling Delta Flood Events: The Case of the Evros River Deltaic Plain (NE Aegean Sea)

by
Serafeim Poulos
1,*,
Aikaterini Karditsa
2,
Maria Hatzaki
3,
Athina Tsapanou
1,
Christos Papapostolou
4 and
Konstantinos Chouvardas
5
1
Laboratory of Physical Geography, Sector of Geography and Climatology, Department of Geology and Geoenvironment, National and Kapodistrian University of Athens, 15784 Athens, Greece
2
Department of Port Management and Shipping, National and Kapodistrian University of Athens, Evripos Campus, 34400 Athens, Greece
3
Laboratory of Climatology and Atmospheric Environment, Sector of Geography and Climatology, Department of Geology and Geoenvironment, National and Kapodistrian University of Athens, 15784 Athens, Greece
4
Special Service for Public Works of Macedonia, Epirus and Thrace, Ministry of Infrastructure and Transport, 68132 Alexandroupolis, Greece
5
Independent Directorate of Civil Protection, Region of Eastern Macedonia-Thrace, 69100 Komotini, Greece
*
Author to whom correspondence should be addressed.
Water 2022, 14(3), 497; https://doi.org/10.3390/w14030497
Submission received: 16 December 2021 / Revised: 21 January 2022 / Accepted: 2 February 2022 / Published: 7 February 2022
(This article belongs to the Special Issue Coastal and Continental Shelf Dynamics in a Changing Climate)

Abstract

:
The present contribution aims to give an insight into the main terrestrial and marine processes leading to delta flooding in the case of the transboundary Evros delta, located at the microtidal NE Aegean Sea, on the basis of recorded flood events in the Evros deltaic plain. The prevailing weather conditions at the onset of the event, along with sea-level rise above the mean state, portray the mechanism for the development of compound flood events and subsequent riparian flooding. This system blocks the riverine water’s seaward exit, resulting in the flooding of the lower deltaic plain. The river discharge is recognized as a secondary factor acting mainly toward the persistence of the events. Several limitations restrict the quantification potential of the relative contribution of the key factors to the development, onset, and duration of a flood. Mitigation of the impacts of such flood events requires intercountry cooperation and a management plan based on a network of environmental monitoring.

1. Introduction

Deltaic regions cover approximately 1% of the land globally, accommodating more than 7% of the world population (about half a billion people) [1]. Thus, they constitute very important coastal areas for human activity (e.g., agricultural, industrial production) [2,3]; while conservative estimates value major deltas worldwide at tens of trillions of U.S. dollars in terms of economic revenue and ecosystem services [4,5], this estimate—derived from delta wetlands—is largely due to their physical features and the biodiversity of their ecosystems, and the global value of wetland ecosystem services has been estimated to be USD 26.4 trillion/year (after [6]). Nevertheless, coastal population is expected to increase in most of the deltaic areas during the next few decades due to growing employment and economic opportunities (e.g., [7,8]). Moreover, 85% of the deltas are recorded to have experienced severe flooding since 2000, due to climate change, resulting in the temporary submergence of 260,000 km2 of coastal land [4]. This situation is expected to worsen as, according to conservative estimates, about 50% of the deltaic plains are vulnerable to flooding under the projected values for sea-level rise in the twenty-first century [5,9,10].
Flood risk is further exacerbated during the co-occurrence of meteorological, oceanographic, and hydrological processes, which regularly have greater impact on flood magnitude and duration than when they occur separately [11,12,13], a condition known as “compound flood event”. These events are exceptionally intensive when related to the passage of hurricanes (e.g., [12,13]). Flooding may come from the co-occurrence of a storm surge with increased river discharge and/or can be further amplified by succeeding precipitation. Furthermore, a storm surge (even a non-significant one) may block or decelerate the precipitation’s drainage into the sea [14], resulting in flooding along the coastal area [15,16], whilst precipitation and subsequent river run-off may take place in soil previously saturated by a prolonged storm event [17]. Apparently, heavy precipitation events and storm surges coincide when they are driven by deep low-pressure systems [15,18].
The joint probability of a compound flooding mechanism has been globally investigated by several studies (e.g., [11,19,20,21,22,23]). Even though during the last decades there have been case studies worldwide considering compound floods (e.g., in the Mediterranean deltas of the Ebro, the Rhône, and the Po [24,25]; in Europe [14,17,26,27]; in the United States [15,20,28]; in Australia [29,30,31]; and in China [29,32,33]), a better understanding of the drivers involved (terrestrial, atmospheric, and marine) is still required for the successful management [11,19,23,34] and the mitigation of future trends related to climate change (e.g., [10,17,19]). Toward this end, the European Union, in order to support Member States in managing flood risk, issued Directive 2007/60/EC according to which Member States must prepare a preliminary assessment of flood risks.
Regarding delta flood management, as for any compound coastal flooding, issues such as flood preparedness and/or adaptation are of major importance [35]. Subsequently, three kinds of interventions have been identified [10]: (i) hard engineering (traditional) or “gray” infrastructure, such as dams, levees, hardened ditches, etc.; (ii) soft engineering (nature-based) or “green” infrastructure projects designed to mimic nature by capturing and slowing the advance of floodwaters (e.g., wetland creation, living shorelines, mangrove planting, etc.); and (iii) non-structural anti-flood measures (policy-driven). However, the application of any kind of management scheme becomes more difficult in the case of transboundary river-delta systems, as in the case of the Danube delta (wetlands) [36], the Mekong river delta [37], the Okavango delta [38], and the Bangladesh delta [39].
As there are limited studies investigating compound floods in deltas, particularly in the Mediterranean Sea [24,25], the present contribution aims to give an insight into the main drivers leading to delta flooding of the Evros/Maritza/Meriç river (hereafter, Evros river) in the microtidal environment of the Aegean Sea, through the analysis of recorded flood events in combination with concurrent available satellite imagery and fluvial, meteorological, and coastal oceanographic data. The effort becomes more demanding considering the transboundary character of both the Evros delta and its catchment (the second largest after the Danube delta in the Balkan Peninsula), which makes management and mitigation of coastal flooding at its vulnerable low-lying coastal area a challenging task.
This work attempts to address all natural factors involved in deltaic compound flooding, a subject of limited investigation, aiming to demonstrate their interrelationship together with the spatial extent of flooding and to discuss issues related to flooding management and adaptation.

2. Study Area

The Evros river deltaic plain (Figure 1c) lies between Greece and Turkey and covers an area of 188 km2, of which about 92% belongs to Greece and 8% to Turkey. Its drainage basin accounts for 52,900 km2 (Bulgaria 66%, Turkey 28%, and Greece 6%), whilst about 200 km out of the 540 km of its length is the borderline between Greece and Turkey. Its largest tributaries are the Ergene (Turkey), Tundzha (Bulgaria), Ardas (Greece), and Erythropotamos (Greece), covering about 20.5%, 16%, 11%, and 3% of the total Evros basin, respectively [40]. The deltaic plain hosts the main (active) distributary of the river, whilst an older distributary is also present and activated during high water discharges. Morphologically, it is characterized by a rather smooth relief lying in low elevations (<5 m), bounded southeastwards by a hill (emergence of the underlying bedrock) and incorporating several lagoons and water bodies at its seaward side. Its morphodynamic configuration classifies it as a wave/fluvial-dominated type of delta, based on Galloway’s (1975) classification [41].
The deltaic coast is located in the semi-protected and relatively shallow embayment of the Alexandroupolis Gulf (NE Aegean Sea), which is exposed to west (4.1%), southwest (10.7%), and south (4.4%) wind-induced waves [42]. Astronomical tides do not exceed 20 cm, while the sea-level variations from the nearby station (Alexandroupolis port) indicate that mean high water reaches 0.82 m, while mean low water is 0.60 m [43].
The Evros delta area belongs to the Mediterranean climate zone. According to the HNMS meteorological station of Alexandroupolis (Hellenic National Meteorological Service (HNMS); http://www.emy.gr/emy/el/climatology/ (accessed on 15 February 2021)), which is the nearest one to the delta, the total annual precipitation reaches 550 mm, with November and December being the wettest (>80 mm) and July and August the driest months (<20 mm), while more than 100 rainy days are recorded per year. The mean annual temperature is 15.2 °C, whereas July is the warmest (26.2 °C) and January the coldest month (5.1 °C).
The mean annual freshwater discharge is highly controlled by the operation of more than 25 large (hydroelectric, irrigation, reservoir) dams and hundreds of small flow control reservoirs (722 dams only in Bulgaria), along the main Evros river and its tributaries. In the downstream part, after dam controlling, water discharge was calculated at about 340 m3/s, whilst sediment load was at about 0.5 Mt/year, most of which (~90%) is dissolved sediment [41]. Therefore, the Evros river’s discharge forms a plume whose dynamics and distribution is related to coastal hydrodynamic activity [44]. However, the Evros river is characterized by high inter-annual flow fluctuations [45,46] with increasing flood frequency during the last years (water discharge > 2500 m3/s), implying an association with both climate variations and dam operation in the river basin [47], which often cause extended economic damages in the riparian and deltaic part [48].
In terms of land use, about 46% of the deltaic area constitutes agricultural land, 41% natural land (vegetation and heath), 8% water bodies, and 5% artificial structures [41]; the latter include artificial dikes, ditches, flood control embankments, pumping stations, drainage canals, and alignments along the river route for flood control. In addition, a major part of the Evros deltaic plain has been classified as a Ramsar wetland, a Special Protection Area (SPA), and also an Important Bird Area (IBA) and recognized as a National Park [49,50].
During the last years, in line with the European Directives 2007/60/EC and 2000/60/EC, important efforts have been put into flood risk management plans (e.g., [47,51,52]), recognizing that the deltaic plain is the most vulnerable part, susceptible to overflowing of the embankments and flooding with flow depths exceeding 2 m. However, management of the Evros river raises many challenges due to its transboundary character with countries that are not all EU members.

3. Data and Methods

The recorded flood events (in terms of onset date and duration) of the Evros deltaic area during 2005–2018 analyzed in this study (Table 1) were provided by the Civil Protection Directorate of the Region of East Macedonia and Thrace, Greece. The analysis of the flood events in the Evros delta was performed with regard to (a) prevailing meteorological and sea-level (tide) conditions, (b) water discharge, and (c) spatial identification of flooding area.

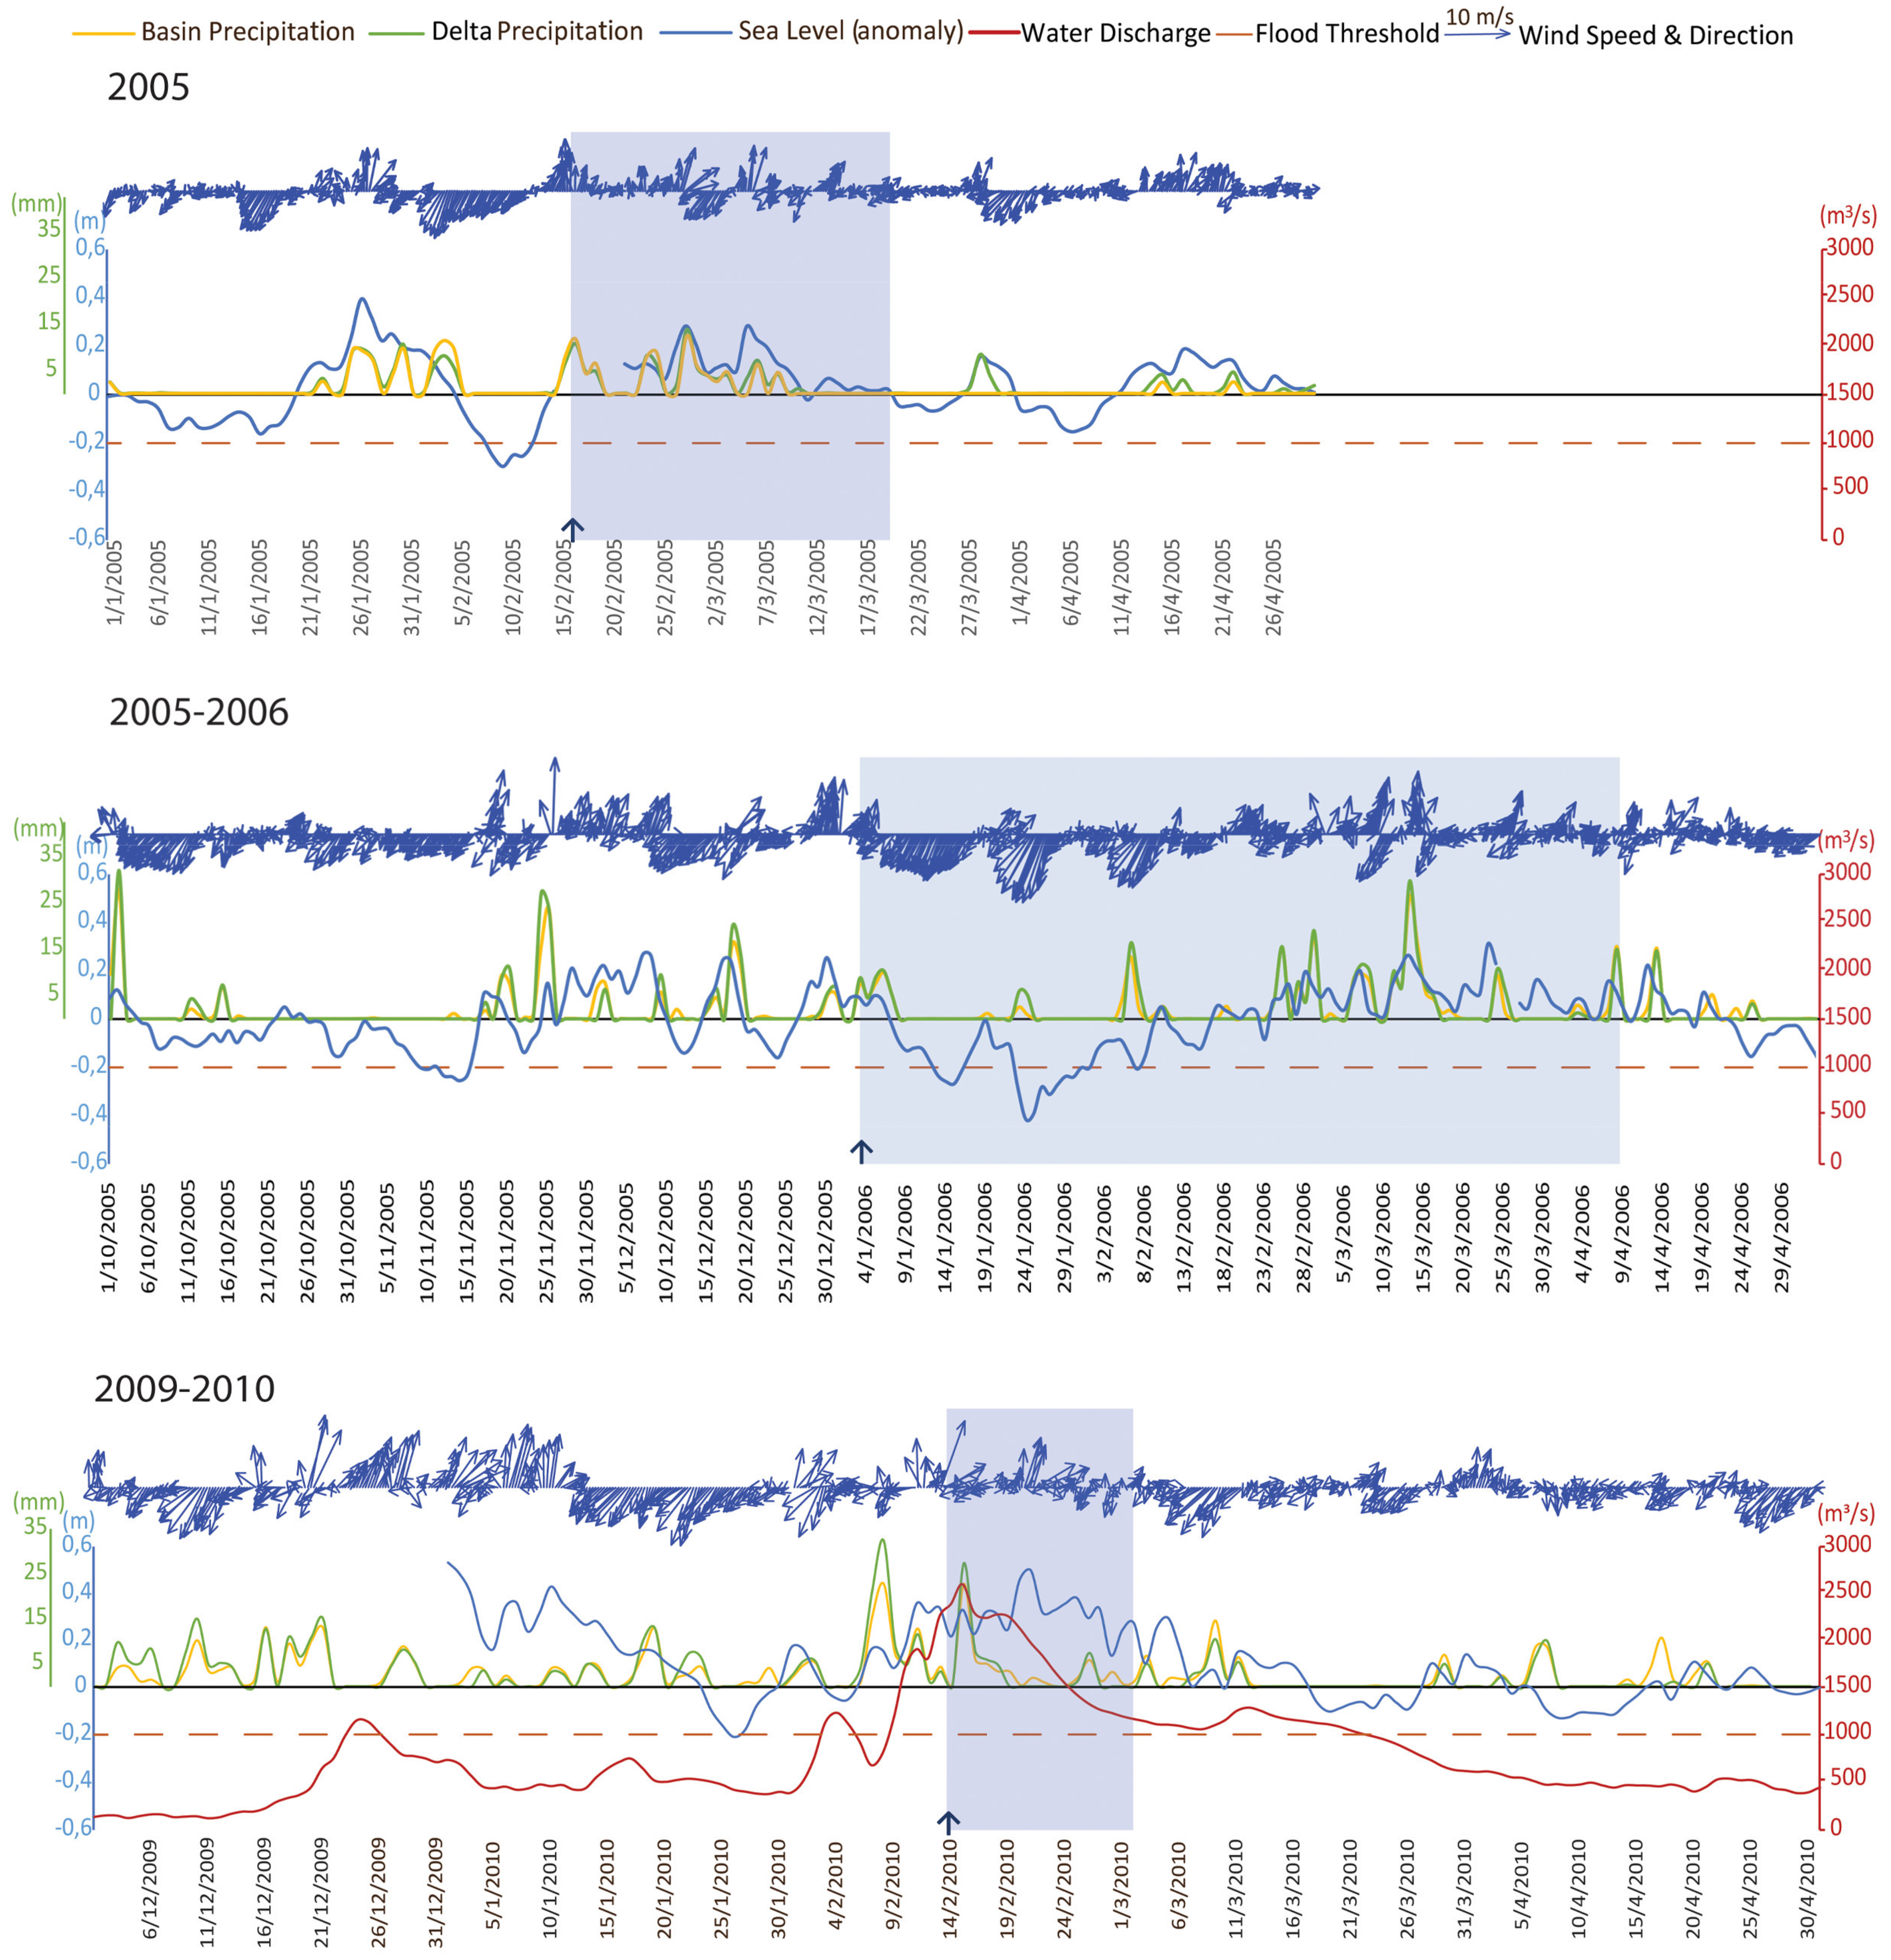
3.1. Meteorological, Hydrological, and Oceanographic Data

For the investigation of the Evros river deltaic plain flooding mechanism, the following datasets were gathered and analyzed with a focus on the period before and during the flood events:
(i)
The weather analysis charts available every 6 h, produced by the UK Met Office and the Deutscher Wetterdienst, archived in www1.wetter3.de and www2.wetter3.de, respectively. The weather analysis charts were studied in order to get the picture of the meteorological conditions prevailing around the onset of the flood events.
(ii)
The 6 h wind from the ECMWF ERA5 reanalysis datasets [53] on a 0.125° × 0.125° grid, for the 2005–2018 period downloaded from the Copernicus Climate Data Store, covering the greater Evros area. The time series of the wind vector at a grid point representing the deltaic nearshore area were examined and presented in order to figure out the prevailing wind directions for the entire examined period and specifically around the events.
(iii)
Daily precipitation from the EOBS gridded observational dataset (v.23.1e) with horizontal resolution of 0.1° × 0.1°, for 2005–2018 [54], covering the entire Evros basin. The precipitation amounts were spatially averaged over the Evros basin and over its delta for the generation of two respective daily time series for the examined period. The spatial averaging was performed on the geographical boundaries of the basin and the delta (as shown in Figure 1b,c).
(iv)
Hourly values of the sea level from the station of the Hellenic Navy Hydrographic Service located at the port of Alexandroupolis, for the period 2005–2018. To get a perspective of the net effect of the sea-level rise to the onset of the flood event, we calculated the daily sea-level anomalies by subtracting from the recorded value of each calendar day the long-term mean value derived by the respective calendar days. Thus, in the resultant time series, positive anomalies indicate a rise above the mean state.
(v)
Daily values of river water discharge from Ipsala station from DSI (Devlet Su Isleri), Turkey, for the period 2008–2019. The discharge was investigated as it gives important information on how the high level of water discharge can contribute to a flood event.
Additionally, the relationship between wind direction and sea level was examined for the flood events and for the entire time span of the flood events (2005–2018), on the basis of circular statistics [55,56], to get an insight into the dependence of the sea-level values on the wind conditions.

3.2. Satellite Imagery

Satellite images corresponding to the investigated flood event periods were selected and utilized to trace the flood event’s spatial impact and the frequency of occurrence in the deltaic plain. Selection of the imagery was based on their availability for each examined period, whilst in cases where, due to cloudy conditions, there was no available image within the flood period, the closest image (temporarily) to the flood event was selected. An additional image selected during a dry (after summer) period constituted the background information for the comparison and the evaluation of flooding extent. The satellite data employed in the study consist of Landsat-5 (L5), Landsat-7 (L7), and Landsat-8 (L8) imagery, which were acquired from the United States Geological Survey (USGS) Explorer (http://earthexplorer.usgs.gov/ (accessed on 15 February 2021)) platform. The L5 consists of four spectral bands with 60 m spatial resolution (https://landsat.usgs.gov/ (accessed on 15 February 2021)), the L7 SAT imagery has eight spectral bands with a spatial resolution of 30 m, whereas L8 SAT on top of the eight spectral bands has one panchromatic band with a 15 m spatial resolution.
The products were radiometrically calibrated and orthorectified and distributed as scaled digital numbers (DN). Then, they were atmospherically corrected and converted to calibrated reflectance values (Rrs) by using the ENvironment for Visualizing Images (ENVI) software (version 5.3) through the FLAASH (Fast Line-of-sight Atmospheric Analysis of Hypercubes) tool [57]. Flooded areas were derived from satellite products with ENVI software’s automatic generation of a land cover map combined with supervised classification algorithm of the maximum-likelihood classifier (MLC) [58] which included all image bands into the classification. The methodology has been previously applied successfully on deltaic areas (e.g., [59]), whilst imagery outputs were subjected to accuracy assessment. Therefore, the classification of either (i) wet areas (water bodies) or (ii) dry areas was accomplished and, accordingly, flooded areas were determined based on the comparison of each flood event satellite image with a selected background image coming from the dry (September) period (image date: 4 September 2015).
Finally, a flood frequency map was created, with the use of GIS software by superpositioning all eight elaborated flood event images (raster calculator) and classifing, to eight frequency classes the spatial coverage of flooding. The source and original satellite images are given in the respective table of Appendix A.

4. Results

4.1. Comparative Analysis of Meteorological and Hydrological Conditions

The examination of the weather charts produced by the UK Met Office (http://www1.wetter3.de/archiv_ukmet_dt.html (accessed on 15 December 2021)) and Deutscher Wetterdienst (http://www2.wetter3.de/Archiv/ (accessed on 15 December 2021)) for several time steps before, during, and after the flood onset, accompanied by the respective spatial distribution of precipitation, showed that, for all examined cases, low pressures prevailed over the southern Balkans, while frontal systems reached the Evros delta on the previous day or on the day of the flood onset. The frontal passages having a north-to-south axis relate to southerly winds preceding the front, and they are usually accompanied by substantial rain. In Figure 2, the respective synoptic chart, the accumulated 6 h rainfall map, and the flood coverage extracted after the elaboration of satellite imagery are presented for FE-3 (the respective figures for the other flood events can be found in the Appendix B).
Furthermore, to get a better insight on the spatiotemporal co-behavior of the factors leading to flooding, wind, sea level, precipitation, and discharge level were analyzed for the entire examined period (2005–2018).
The relationship between wind direction (represented by the ERA5 grid point outside the deltaic area) and sea-level rise for the examined period showed that the maximum sea level occurs with southerly winds (Figure 3). It was found that the sea level was statistically significantly (a < 0.05) higher for SE, S, and SW wind directions, while it was maximum for southern winds. The lower sea-level values occurred for NE winds, which substantially prevailed over winds from other directions, mainly during summer.
Inversely, by examining the wind direction in relation to mean high water (0.82 m) and mean low water (0.60 m), it was found that for sea-level values above the mean high water, the mean wind direction was about 120° (SE winds), while for values below the mean low water, the mean wind direction was about 50° (NE winds). In addition, the linear–circular correlation between wind direction and sea level on a 6-hourly lag basis was maximum for about a 1-day lag, indicating that the previous day’s wind conditions could trigger the piling up of the water.
Regarding precipitation amounts, the spatially averaged precipitation—as described in Section 3—was calculated on a daily basis for the Evros catchment and deltaic plain, respectively. The total annual precipitation corresponding to the catchment and the delta reached 600 mm and 470 mm, respectively. It should be noted that the two spatially averaged data series were strongly correlated (Spearman’s rank correlation coefficient 0.70), which indicates that a common precipitation pattern exists over the entire catchment area.
The river discharge ranged from 19.5 to over 3000 m3/s, with the median value at 170 m3/s. It is worth noting that the 95th percentile value corresponded to ~1000 m3/s, which coincides with the alert threshold applied by the dam management authorities.
Moving a step forward, the lag correlation between the Evros basin precipitation and the river discharge indicated a weak (yet statistically significant at a = 0.01) correlation between them, reaching a maximum at 5-days lag of the river discharge. It should be emphasized, though, that the river discharge values strongly depend on the dams’ management, as discussed below, and, thus, they are subject to both natural factors and anthropogenic intervention.

4.2. Temporal Evolution of Factors Leading to Flood Events

For the investigation of the conditions leading to the onset of a flood event, the daily time series of sea-level anomaly, drainage basin and delta precipitation, wind vector, and river discharge were analyzed comparatively, for each of the eight flood events (FEs) listed in Table 1 and presented separately in Figure 4.
FE1 took place in 2005 from 16 February 2005 to 17 March 2005, covering a period of one month. The onset of the flood coincided with a maximum positive pick on sea-level anomaly, 2 days of south winds, and maximum precipitation. This combination of these maximum values was the second one, following a preceding corresponding phenomenon 20 days earlier with a duration of 15 days, which was disrupted by a short dry period and fall of sea level. Even though no discharge data were available to justify any coincidence of rainfall in the delta area and within the catchment area, we can assume that during the flood event water discharge was above its mean level, which is the case of the events described below.
FE2 lasted for an exceptionally long period of about 3 months in 2006 (from 4 January 2006 to 4 April 2006). The initiation of flooding was recorded after a prolonged period (>45 days) of medium-intensity rainfall (10–15 mm) with multidirectional winds, which, were in good association with sea-level anomaly (i.e., north winds coincide with negative anomaly, south winds coincide with positive anomaly). The event itself consisted of two phases; the first phase was characterized by negative sea-level anomaly and four rainfall events, while the second phase was characterized by positive sea-level anomaly and continuous rainfall with significant heights (10–30 mm). The absence of reliable discharge data did not permit any correlation between the onset and evolution of this flood event with the known rainfall levels, although this is most likely to be the case.
FE3 lasted for a period of 3 weeks (from 3 February 2010 to 24 February 2010) in 2010, being the combined result of strong 2-day winds of southern direction, positive anomalies of sea level, and the occurrence of precipitation. The initiation of the flood event coincided with a positive anomaly of sea level and increased rainfall in catchment area and over the deltaic plain associated with high water discharge, exceeding 2000 m3/s. Toward the end of the flood event, the discharge decreased below 1500 m3/s and rain stopped; however, the positive anomaly of the sea level was sustained.
FE4 took place in 2012 between 6 January 2012 and 6 February 2012. Flooding responded to intense rainfall (20 mm) and a rapid positive sea-level anomaly took place after a 2-day southern wind blowing, flooding maintained for a month incorporating a second intense precipitation event (24 January 2021–25 January 2021), whilst the sea-level anomaly was around zero and discharge levels were below the 900 m3/s. The end of the event and the subsequent period was characterized by a distinctive negative sea-level anomaly and relatively weak rainfall events, whilst water discharge increased to 1200 m3/s almost 5–6 days later, which may be explained by the presence and operation of the dams.
FE5 was the only one that took place at the end of a calendar year, near the beginning of the raining season of 2014 (between 4 and 30 December). During the flooding event (~25 days), precipitation reached 20 mm/day and the sea-level anomaly was mainly positive, whilst water discharge reached a maximum value of 2400 m3/s. The onset of the event was characterized by a positive sea-level anomaly, moderate rainfall heights, and relatively low discharge (~450 m/s). In general, the development, peak, and termination of the event followed the discharge tendency, which reached values greater than 2000 m3/s.
FE6, the shortest one (2 February 2015–8 February 2015), took place after an almost 2-month period after the fifth event; it evolved under strong southern winds, increased sea-level anomaly, and a long duration (10 days) of low precipitation, followed by a maximum water discharge (~3000 m3/s). The end of the event took place under an abrupt fall of both water discharge (1500 m3/s) and sea level under the predominance of northeasterly winds.
FE7 took place a month later (starting on 6 March) lasting for 24 days (till 31 March 2015). Its development seemed to be independent from sea-level variation and rainfall was present at its initiation and at its end, whilst the discharge was greater than 650 m3/s with a peak value around ~1800 m3/s.
FE8 was a relatively long event (from 6 March 2018 to 21 April 2018), lasting approximately 1.5 month, being associated with pronounced positive sea-level anomalies, the presence of repetitive rainfall events, and increased discharge levels (>900 m3/s). Interestingly, the flood continued for a period of about 20 days after the peak of the discharge, with the sea level essentially unchanged and with the absence of rainfall. On the other hand, prior to the initiation of the flood event, a long rainy period with a positive sea-level anomaly lasted for about a month, with discharge levels >400 m3/s.

4.3. Flooded Area Assessment

To assess the impact of flood events in the deltaic plain and define the specific areas that are more prone to flooding, we created Figure 5, in which the frequency of flood occurrence within the deltaic plain is provided. The map was based on the integration of the available satellite images regarding flood events considered hereby and is discussed in comparison with the “dry”-period image.
As can be seen (Table 2), almost half of the deltaic plain (108 km2, 49.7% of the deltaic plain) is very often prone to flooding (>62.5% of flood occurrence), whilst the most frequently (87.5–100%) flooded areas are located at the east side of the river and the broader lagoonal system covering an area of approximately 24.5 km2 (~11.3% of the total deltaic plain). Nevertheless, it is notable that the entire deltaic plain has been exposed to flooding at least once, which proves its significant susceptibility to floods.

5. Discussion

All the examined flood events took place from late December to late March, with most of them occurring in January and February. This flooding period coincides with the wet period of the Evros catchment area, i.e., the southern part of the Balkan peninsula. This period is also characterized by a variable wind regime and increased southerly winds compared to the period of the prevalence of the northerly etesian (May–October) winds [60,61].
The above results of the recorded flood events indicate that there is a pattern for the deltaic flood onset and duration. Specifically, a flood event commences when a low-pressure system accompanied by southerly winds and increased precipitation amounts affects both the Evros catchment and deltaic area. Thus, the prevailing weather conditions at the onset of the event, along with sea-level values above the mean state in all examined cases, portray the mechanism of flooding in the delta, implying that Evros delta compound flood events exhibit similar characteristics.
Furthermore, the findings of the spatial distribution of flooding indicate that the most frequently flooded areas (87.5–100%) are located at the lower deltaic area (east side of the river and the broader lagoonal system). This implies that flooding most frequently commences as the consequence of the aforementioned low-pressure systems and their subsequent southern winds and sea-level rise, which block the river debouchment, preventing waters from seaward extrusion. Accordingly, the additional contribution of precipitation expands flooding to the wider deltaic plain, whilst flooding in the riparian areas is related to the increased discharge values that come next.
The flood events could be distinguished according to their life span as follows: (i) events lasting >1 month; (ii) events lasting <1 month; and (iii) short-lived events occurring between extended flooding periods (e.g., FE5 in Figure 2). Regarding sea-level conditions at the onset of the flooding, it was found that sea-level height at the nearby Alexandroupolis harbor exceeded 0.85 m and even 1 m, before and during the flood onset, while the mean annual sea-level height is 0.72 [43]. The daily precipitation amounts exceeded 10 mm, even reaching 35 mm (e.g., during FE-3). Regarding the river water discharge, it was found that in all cases (with available discharge data, i.e., since 2008), the discharge values exceed a threshold of ~1000 m3/s, except for FE-4, during which discharge values ranged between 300 and 800 m3/s. Ιn the case of the other events (i.e., FE-3, FE-6, FE-6, FE-7, and FE-8), discharge exceeded 2000 m3/s, reaching 3000 m3/s during the FE-6. Moreover, in most cases, values increased significantly, though with a delay of 5 days, with respect to precipitation occurrence and sea-level rise. The latter observation is closely related to the anthropogenic regulation of the river flow against natural flow after the construction of dams and their operation in association with water management.
Several limitations restrict the quantification potential of the relative contribution of the aforementioned factors to the development, onset, and duration of a flood. Firstly, the small number of events does not permit for statistically robust thresholds to be set. An additional limitation is the lack of soil saturation and evapotranspiration data regarding the deltaic plain. In particular, soil saturation and permeability prior to the flood event (pre-conditioning period) is of vital importance, as it determines the response of the ground to precipitation, river discharge, and even the potentiality of another flood event (as in the case of the FE-6 and FE-7). Moreover, the limited number of satellite images cannot give adequate information on the onset, evolution, and end of the flood event in order to identify specific features of the flooding’s spatiotemporal extent. Finally, the Evros basin is not a natural system as human interference is evident both at the catchment area scale (dam operation) and within the deltaic plain; the latter involves the presence of embankments and artificial flooding of parts of the deltaic plain.
The factors involved in the development of deltaic flooding are expected to be further intensified by climate change, including changes in wind and rainfall regimes and sea-level rise; the latter varies from 0.30 m (under SSP1-1.9) up to 0.70 m (under SSP5-8.5) by the end of the century [62], implying an additional coastal inundation and deltaic coast retreat (i.e., loss of a large part of the deltaic plain). Therefore, future work is essential to incorporate the climate changes into the mechanism of the deltaic flood.
The quantification of the flood events’ impacts in the deltaic plain, under the current and future climate, is useful, as it allows the identification of the deltaic hazard and its hot spots. Hence, for the mitigation of flooding impacts and their anticipated intensification due to climate change, an integrated management plan is required. Among the proposed adaptation measures, those proposed by Bates et al. [10] could be examined, referring to the following: (i) increasing the bankfull channel capacity; (ii) increasing infiltration rates; (iii) reducing the flooding area behind an adaptation structure; and (iv) changing local elevations. Such a plan should be based on a detailed, frequently revised terrain model, especially along the river distributaries and the deltaic coastal front, and a monitoring network of the environmental conditions. On this basis, a monitoring network can fundamentally contribute to the flood management. For instance, in the case of the Evros river, this network should contain the following: (a) weather stations (air temperature, precipitation, humidity, atmospheric pressure) in several sites within the river catchment area and the deltaic plain (e.g., one station for each second-order subbasin), (b) sea-level gauge near the river mouth, (c) water flow meters and water level gauges to the main and tributary channels entering the river, and (d) stations that measure soil humidity (saturation). Furthermore, a management plan needs to tackle land uses and agricultural practices, aiming also to protect lives, infrastructure, and natural resources. In addition, as most of the Mediterranean deltas have been impacted by human activities, protection practices largely depend on each particular delta and funding availability [63].
It is also crucial to establish a transboundary communication network for gathering/exchanging information regarding water flow from the operation of the dams within the drainage basin. Apparently, in the case of the Evros delta, the success of any flood-management plan needs the cooperation of the three countries (Bulgaria, Turkey, and Greece) that share its drainage basin [64,65].

6. Conclusions

The flood events recorded in the deltaic plain of the transboundary delta of the Evros river could be distinguished according to their life span in the following ways: (i) events lasting >1 month, (ii) events lasting <1 month, and (iii) short-lived events occurring between extended flooding periods.
The key factors regulating the onset of flood events are the prevailing weather conditions, along with rainfall levels (exceeding 10 mm/day over the deltaic plain) and the consequent rise of the sea level (above 0.2 m) attributed to southerly winds. This situation inhibits the riverine waters’ seawards flow, resulting in the lower deltaic plain flooding. The river discharge is recognized as a secondary factor acting mainly toward the persistence of the events and subsequent riparian flooding. More specifically, a sharp increase in discharge levels was recognized in most examined events, surpassing 1000 m3/s in almost all cases, with a time lag of approximately 3 days. In any case, the role of discharge cannot be assessed accurately due to the anthropogenic interference through the operation of the dams even though it can contribute to exceptionally high-water discharges. The synergy of the above factors comprises the mechanism for the development of compound flood events.
The mitigation of the impacts of such compound flood events requires a concrete management plan, the successful implementation of which is based on a network for environmental monitoring. Such a management plan would also contribute to the adaptation to sea-level rise, increased storminess, and extreme precipitation events, due to anticipated climate change.

Author Contributions

Conceptualization, S.P. and A.K.; methodology, S.P., A.K. and M.H.; software, A.K., M.H. and A.T.; validation, S.P. and C.P.; resources, C.P. and K.C.; data curation, A.K., M.H., A.T., C.P. and K.C.; writing—original draft preparation, S.P., A.K. and M.H.; writing—review and editing, S.P., A.K. and M.H.; visualization, A.K., M.H. and A.T.; supervision, S.P. All authors have read and agreed to the published version of the manuscript.

Funding

This research received no external funding.

Institutional Review Board Statement

Not applicable.

Informed Consent Statement

Not applicable.

Data Availability Statement

The reanalysis and the gridded meteorological data used in this study are freely available at the Copernicus Climate Data Store (https://cds.climate.copernicus.eu/#!/home (accessed on 15 December 2021)). The weather charts were downloaded from the UK Met Office (http://www1.wetter3.de/archiv_ukmet_dt.html (accessed on 15 December 2021)) and Deutscher Wetterdienst (http://www2.wetter3.de/Archiv/ (accessed on 15 December 2021)). The climatological data for the Hellenic National Meteorological Service station can be found at http://www.emy.gr/emy/el/climatology/ (accessed on 15 December 2021). The water discharge data were downloaded from https://cp.pamth.gov.gr/civil/?page_id=1453 (accessed on 15 December 2021). The sea-level height data were provided from the Hellenic Navy Hydrographic Service. The satellite images were derived from https://landsat.usgs.gov (accessed on 15 December 2021).

Acknowledgments

We thank the projection authors for developing and making the sea-level rise projections available, multiple funding agencies for supporting the development of the projections, and the NASA Sea-Level Change Team for developing and hosting the IPCC AR6 Sea-Level Projection Tool.

Conflicts of Interest

The authors declare no conflict of interest.

Appendix A

The following table presents the Landsat satellite images used for the flood extent mapping. The image acquisition date of each event can be found in Table 1.
Table A1. Satellite images used in the study.
Image Acquisition DateRaw Satellite ImageryRaw Satellite Imagery with Processed Deltaic AreaProcessed Satellite Imagery of the Evros Delta Area
16 March 2005 Water 14 00497 i001 Water 14 00497 i002 Water 14 00497 i003
15 February 2006 Water 14 00497 i004 Water 14 00497 i005 Water 14 00497 i006
23 April 2010 Water 14 00497 i007 Water 14 00497 i008 Water 14 00497 i009
23 January 2012 Water 14 00497 i010 Water 14 00497 i011 Water 14 00497 i012
22 December 2014 Water 14 00497 i013 Water 14 00497 i014 Water 14 00497 i015
23 January 2015 Water 14 00497 i016 Water 14 00497 i017 Water 14 00497 i018
13 April 2015 Water 14 00497 i019 Water 14 00497 i020 Water 14 00497 i021
20 March 2018 Water 14 00497 i022 Water 14 00497 i023 Water 14 00497 i024

Appendix B

The Figure A1, Figure A2, Figure A3, Figure A4, Figure A5, Figure A6 and Figure A7 present the meteorological conditions and the deltaic area flood extent, for the rest of the flood events of Table 1 apart from 2012, which is presented in Figure 2.
Figure A1. (a) Surface weather chart and (b) the respective precipitation map at a time close to the reported onset of the 2005 flood event; the red squares indicate the broader study area. (c) The flooded area of the Evros river deltaic plain at a time associated with the flood event. The dates corresponding to each map are given in Table 1.
Water 14 00497 g0a1
Figure A2. As in Figure A1, but for the 2006 flood event.
Water 14 00497 g0a2
Figure A3. As in Figure A1, but for the 2010 flood event.
Water 14 00497 g0a3
Figure A4. As in Figure A1, but for the 2014 flood event.
Water 14 00497 g0a4
Figure A5. As in Figure A1, but for the first 2015 flood event.
Water 14 00497 g0a5
Figure A6. As in Figure A1, but for the second 2015 flood event.
Water 14 00497 g0a6
Figure A7. As in Figure A1, but for the 2018 flood event.
Water 14 00497 g0a7

References

  1. Ericson, J.P.; Vörösmarty, C.J.; Dingman, S.L.; Ward, L.G.; Meybeck, M. Effective sea-level rise and deltas: Causes of change and human dimension implications. Glob. Planet. Chang. 2006, 50, 63–82. [Google Scholar] [CrossRef]
  2. Defrancesco, E.; Gatto, P.; Rosato, P.; Bozzolan, I. The valuation of Environmental Damage Compensation: An Integrated Framework. Riv. SIEV 2012, 9, 1–12. [Google Scholar]
  3. Pont, D.; Day, J.W.; Hensel, P.; Franquet, E.; Torre, F.; Rioual, P.; Ibàñez, C.; Coulet, E. Response Scenarios for the Deltaic Plain of the Rhône in the Face of an Acceleration in the Rate of Sea-Level Rise with Special Attention to Salicornia-Type Environments. Estuaries 2002, 25, 337–358. [Google Scholar] [CrossRef]
  4. Syvitski, J.P.M.; Kettner, A.J.; Overeem, I.; Hutton, E.W.H.; Hannon, M.T.; Brakenridge, G.R.; Day, J.; Vörösmarty, C.; Saito, Y.; Giosan, L.; et al. Sinking deltas due to human activities. Nat. Geosci. 2009, 2, 681–686. [Google Scholar] [CrossRef]
  5. Giosan, L.; Syvitski, J.; Constantinescu, S.; Day, J. Climate change: Protect the world’s deltas. Nature 2014, 516, 31–33. [Google Scholar] [CrossRef] [Green Version]
  6. Costanza, R.; de Groot, R.; Sutton, P.; van der Ploeg, S.; Anderson, S.J.; Kubiszewski, I.; Farber, S.; Turner, R.K. Changes in the global value of ecosystem services. Glob. Environ. Chang. 2014, 26, 152–158. [Google Scholar] [CrossRef]
  7. Chan, F.K.S.; Adekola, O.; Mitchell, G.; Ng, C.N.; McDonald, A. Towards Sustainable Flood Risk Management in the Chinese Coastal Megacities. A Case Study of Practice in the Pearl River Delta. Irrig. Drain. 2013, 62, 501–509. [Google Scholar] [CrossRef]
  8. Seto, K.C. Exploring the dynamics of migration to mega-delta cities in Asia and Africa: Contemporary drivers and future scenarios. Glob. Environ. Chang. 2011, 21, S94–S107. [Google Scholar] [CrossRef]
  9. Bevacqua, E.; Vousdoukas, M.I.; Zappa, G.; Hodges, K.; Shepherd, T.G.; Maraun, D.; Mentaschi, L.; Feyen, L. More meteorological events that drive compound coastal flooding are projected under climate change. Commun. Earth Environ. 2020, 1, 47. [Google Scholar] [CrossRef]
  10. Bates, P.D.; Quinn, N.; Sampson, C.; Smith, A.; Wing, O.; Sosa, J.; Savage, J.; Olcese, G.; Neal, J.; Schumann, G.; et al. Combined Modeling of US Fluvial, Pluvial, and Coastal Flood Hazard Under Current and Future Climates. Water Resour. Res. 2021, 57, e2020WR028673. [Google Scholar] [CrossRef]
  11. Zscheischler, J.; Westra, S.; van den Hurk, B.J.J.M.; Seneviratne, S.I.; Ward, P.J.; Pitman, A.; AghaKouchak, A.; Bresch, D.N.; Leonard, M.; Wahl, T.; et al. Future climate risk from compound events. Nat. Clim. Chang. 2018, 8, 469–477. [Google Scholar] [CrossRef]
  12. Huang, W.; Ye, F.; Zhang, Y.J.; Park, K.; Du, J.; Moghimi, S.; Myers, E.; Pe’eri, S.; Calzada, J.R.; Yu, H.C.; et al. Compounding factors for extreme flooding around Galveston Bay during Hurricane Harvey. Ocean Model. 2021, 158, 101735. [Google Scholar] [CrossRef]
  13. Ye, F.; Huang, W.; Zhang, Y.J.; Moghimi, S.; Myers, E.; Pe’eri, S.; Yu, H.-C. A cross-scale study for compound flooding processes during Hurricane Florence. Nat. Hazards Earth Syst. Sci. 2021, 21, 1703–1719. [Google Scholar] [CrossRef]
  14. Bevacqua, E.; Maraun, D.; Hobæk Haff, I.; Widmann, M.; Vrac, M. Multivariate statistical modelling of compound events via pair-copula constructions: Analysis of floods in Ravenna (Italy). Hydrol. Earth Syst. Sci. 2017, 21, 2701–2723. [Google Scholar] [CrossRef] [Green Version]
  15. Wahl, T.; Jain, S.; Bender, J.; Meyers, S.D.; Luther, M.E. Increasing risk of compound flooding from storm surge and rainfall for major US cities. Nat. Clim. Chang. 2015, 5, 1093–1097. [Google Scholar] [CrossRef]
  16. Van den Hurk, B.; van Meijgaard, E.; de Valk, P.; van Heeringen, K.-J.; Gooijer, J. Analysis of a compounding surge and precipitation event in the Netherlands. Environ. Res. Lett. 2015, 10, 035001. [Google Scholar] [CrossRef]
  17. Bevacqua, E.; Maraun, D.; Vousdoukas, M.I.; Voukouvalas, E.; Vrac, M.; Mentaschi, L.; Widmann, M. Higher probability of compound flooding from precipitation and storm surge in Europe under anthropogenic climate change. Sci. Adv. 2019, 5, eaaw5531. [Google Scholar] [CrossRef] [Green Version]
  18. Seneviratne, S.I.; Nicholls, N.; Easterling, D.; Goodess, C.M.; Kanae, S.; Kossin, J.; Luo, Y.; Marengo, J.; McInnes, K.; Rahimi, M.; et al. Changes in climate extremes and their impacts on the natural physical environment. In Managing the Risks of Extreme Events and Disasters to Advance Climate Change Adaptation. A Special Report of Working Groups I and II of the Intergovernmental Panel on Climate Change (IPCC); Field, C.B., Barros, V., Stocker, T.F., Qin, D., Dokken, D.J., Ebi, K.L., Mastrandrea, M.D., Mach, K.J., Plattner, G.-K., Allen, S.K., et al., Eds.; Cambridge University Press: Cambridge, UK; New York, NY, USA, 2012; pp. 109–230. [Google Scholar]
  19. Ward, P.J.; Couasnon, A.; Eilander, D.; Haigh, I.D.; Hendry, A.; Muis, S.; Veldkamp, T.I.E.; Winsemius, H.C.; Wahl, T. Dependence between high sea-level and high river discharge increases flood hazard in global deltas and estuaries. Environ. Res. Lett. 2018, 13, 084012. [Google Scholar] [CrossRef]
  20. Moftakhari, H.R.; Salvadori, G.; AghaKouchak, A.; Sanders, B.F.; Matthew, R.A. Compounding effects of sea level rise and fluvial flooding. Proc. Natl. Acad. Sci. USA 2017, 114, 9785–9790. [Google Scholar] [CrossRef] [Green Version]
  21. Couasnon, A.; Eilander, D.; Muis, S.; Veldkamp, T.I.E.; Haigh, I.D.; Wahl, T.; Winsemius, H.C.; Ward, P.J. Measuring compound flood potential from river discharge and storm surge extremes at the global scale. Nat. Hazards Earth Syst. Sci. 2020, 20, 489–504. [Google Scholar] [CrossRef] [Green Version]
  22. Ganguli, P.; Merz, B. Trends in Compound Flooding in Northwestern Europe During 1901–2014. Geophys. Res. Lett. 2019, 46, 10810–10820. [Google Scholar] [CrossRef] [Green Version]
  23. Del-Rosal-Salido, J.; Folgueras, P.; Bermúdez, M.; Ortega-Sánchez, M.; Losada, M.Á. Flood management challenges in transitional environments: Assessing the effects of sea-level rise on compound flooding in the 21st century. Coast. Eng. 2021, 167, 103872. [Google Scholar] [CrossRef]
  24. Alvarado-Aguilar, D.; Jiménez, J.A.; Nicholls, R.J. Flood hazard and damage assessment in the Ebro Delta (NW Mediterranean) to relative sea level rise. Nat. Hazards 2012, 62, 1301–1321. [Google Scholar] [CrossRef]
  25. Day, J.W.; Ibáñez, C.; Pont, D.; Scarton, F. Status and Sustainability of Mediterranean Deltas: The Case of the Ebro, Rhône, and Po Deltas and Venice Lagoon. In Coasts and Estuaries; Wolanski, E., Day, J.W., Elliott, M., Ramachandran, R., Eds.; Elsevier: Amsterdam, The Netherlands, 2019; pp. 237–249. [Google Scholar] [CrossRef]
  26. Kew, S.F.; Selten, F.M.; Lenderink, G.; Hazeleger, W. The simultaneous occurrence of surge and discharge extremes for the Rhine delta. Nat. Hazards Earth Syst. Sci. 2013, 13, 2017–2029. [Google Scholar] [CrossRef] [Green Version]
  27. Paprotny, D.; Vousdoukas, M.I.; Morales-Nápoles, O.; Jonkman, S.N.; Feyen, L. Compound flood potential in Europe. Hydrol. Earth Syst. Sci. Discuss. 2018, 2018, 1–34. [Google Scholar] [CrossRef] [Green Version]
  28. Sadegh, M.; Moftakhari, H.; Gupta, H.V.; Ragno, E.; Mazdiyasni, O.; Sanders, B.; Matthew, R.; AghaKouchak, A. Multihazard Scenarios for Analysis of Compound Extreme Events. Geophys. Res. Lett. 2018, 45, 5470–5480. [Google Scholar] [CrossRef] [Green Version]
  29. Wu, W.; McInnes, K.; O’Grady, J.; Hoeke, R.; Leonard, M.; Westra, S. Mapping Dependence Between Extreme Rainfall and Storm Surge. J. Geophys. Res. Ocean. 2018, 123, 2461–2474. [Google Scholar] [CrossRef]
  30. Zheng, F.; Westra, S.; Leonard, M.; Sisson, S.A. Modeling dependence between extreme rainfall and storm surge to estimate coastal flooding risk. Water Resour. Res. 2014, 50, 2050–2071. [Google Scholar] [CrossRef]
  31. Zheng, F.; Westra, S.; Sisson, S.A. Quantifying the dependence between extreme rainfall and storm surge in the coastal zone. J. Hydrol. 2013, 505, 172–187. [Google Scholar] [CrossRef]
  32. Tu, X.; Du, Y.; Singh, V.P.; Chen, X. Joint distribution of design precipitation and tide and impact of sampling in a coastal area. Int. J. Climatol. 2018, 38, e290–e302. [Google Scholar] [CrossRef]
  33. Lian, J.J.; Xu, K.; Ma, C. Joint impact of rainfall and tidal level on flood risk in a coastal city with a complex river network: A case study of Fuzhou City, China. Hydrol. Earth Syst. Sci. 2013, 17, 679–689. [Google Scholar] [CrossRef] [Green Version]
  34. Zheng, F.; Leonard, M.; Westra, S. Application of the design variable method to estimate coastal flood risk. J. Flood Risk Manag. 2017, 10, 522–534. [Google Scholar] [CrossRef]
  35. Wesselink, A.; Warner, J.; Syed, M.A.; Chan, F.; Tran, D.D.; Huq, H.; Huthoff, F.; Huthoff, F.; Pinter, N.; Van Staveren, M.; et al. Trends in flood risk management in deltas around the world: Are we going ‘soft’? Int. J. Water Gov. 2015, 3, 25–46. [Google Scholar] [CrossRef]
  36. Baboianu, G. Danube Delta: The Transboundary Wetlands (Romania and Ukraine). In The Wetland Book; Finlayson, C.M., Milton, G.R., Prentice, R.C., Davidson, N.C., Eds.; Springer: Dordrecht, The Netherlands, 2016; pp. 1–12. [Google Scholar] [CrossRef]
  37. Tran, T. Transboundary Mekong River Delta (Cambodia and Vietnam). In The Wetland Book; Finlayson, C.M., Milton, G.R., Prentice, R.C., Davidson, N.C., Eds.; Springer: Dordrecht, The Netherlands, 2016; pp. 1–12. [Google Scholar] [CrossRef]
  38. Motsumi, S.; Cassidy, L. Adaptive Management and Scale in a Flood-Pulsed Ecosystem—the Case of the Okavango Delta Management Plan, Botswana. J. Nat. Resour. Policy Res. 2012, 4, 271–291. [Google Scholar] [CrossRef]
  39. Mutahara, M.; Warner, J.; Khan, M.S.A. Analyzing the coexistence of conflict and cooperation in a regional delta management system: Tidal River Management (TRM) in the Bangladesh delta. Environ. Policy Gov. 2019, 29, 326–343. [Google Scholar] [CrossRef]
  40. Skias, S.; Kallioras, A.; Fotis, P. Basic Problems and Prerequisites Regarding Transboundary Integrated Water Resources Management in South East Europe: The Case of the River Evros/Maritza/Meriç. In Transboundary Water Resources Management: A Multidisciplinary Approach; Ganoulis, J., Aureli, A., Fried, J., Eds.; Wiley-VCH Verlag GmbH & Co. KGaA: Hoboken, NJ, USA, 2013. [Google Scholar]
  41. Karditsa, A.; Tsapanou, A.; Poulos, S.E. The evolution of the transboundary Evros river delta (Northeast Aegean Sea) under human intervention: A seven-decade analysis. Phys. Geogr. 2020, 41, 291–314. [Google Scholar] [CrossRef]
  42. Karditsa, A.; Poulos, S.E. Sedimentological investigations in a river-influenced tideless coastal embayment: The case of inner continental shelf of the NE Aegean sea. Cont. Shelf Res. 2013, 55, 86–96. [Google Scholar] [CrossRef]
  43. HNHS. Sea Level Statistics from the Greek Tide Gauge Network; Directorate Oceanography, Hellenic Navy Hydrographic Service: Athens, Greece, 2005. [Google Scholar]
  44. Tsapanou, A.; Oikonomou, E.; Drakopoulos, P.; Poulos, S.; Sylaios, G. Coupling remote sensing data with in-situ optical measurements to estimate suspended particulate matter under the Evros river influence (North-East Aegean sea, Greece). Int. J. Remote Sens. 2020, 41, 2062–2080. [Google Scholar] [CrossRef]
  45. Tzortziou, M.; Zeri, C.; Dimitriou, E.; Ding, Y.; Jaffé, R.; Anagnostou, E.; Pitta, E.; Mentzafou, A. Colored dissolved organic matter dynamics and anthropogenic influences in a major transboundary river and its coastal wetland. Limnol. Oceanogr. 2015, 60, 1222–1240. [Google Scholar] [CrossRef]
  46. UNECE. Assessment of Transboundary Rivers, Lakes and Groundwaters in the United Nations Economic Commission for Europe Region; United Nations Economic Commission for Europe: Geneva, Switzerland, 2011; p. 33. [Google Scholar]
  47. Angelidis, P.; Kotsikas, M.; Kotsovinos, N. Management of Upstream Dams and Flood Protection of the Transboundary River Evros/Maritza. Water Resour. Manag. 2010, 24, 2467–2484. [Google Scholar] [CrossRef]
  48. Zogaris, S.; Markogianni, V.; Ozeren, S.C.; Dimitriou, E. Assessment of riparian zone and river island conditions in a trans-boundary greenbelt: The Evros/Meriç river (Greece-Turkey). Fresenius Environ. Bull. 2015, 24, 269–277. [Google Scholar]
  49. Handrinos, G.; Kazantzidis, S.; Alivizatos, C.; Akriotis, T.; Portolou, D. International Waterbird Census in Greece (1968–2006): Analysis of the Population of Wildfowl (Anseriformes) and the Coot (Fulica atra); Hellenic Ornithological Society: Athens, Greece, 2015. [Google Scholar]
  50. Dimitriou, E.; Moussoulis, E.; Mentzafou, A.; Gritzalis, K.; Zoggaris, S.; Karaouzas, I.; Tzortziou, M.; Zeri, C.; Colombari, E.; Markogianni, V.; et al. Environmental Status Assessment for Evros River Basin; Hellenic Centre for Marine Research: Athens, Greece, 2010. [Google Scholar]
  51. Markantonis, V.; Meyer, V.; Lienhoop, N. Evaluation of the environmental impacts of extreme floods in the Evros River basin using Contingent Valuation Method. Nat. Hazards 2013, 69, 1535–1549. [Google Scholar] [CrossRef]
  52. YPEKA. Flood Risk Management Plan for Evros River Catchment Basin—STAGE II: Preparation of Flood Danger Maps and Flood Risk Maps; Special Secretariat for Water, Ministry for Environment, Energy and Climate Change of Greece: Athens, Greece, 2015.
  53. Hersbach, H.; Bell, B.; Berrisford, P.; Hirahara, S.; Horányi, A.; Muñoz-Sabater, J.; Nicolas, J.; Peubey, C.; Radu, R.; Schepers, D.; et al. The ERA5 global reanalysis. Q. J. R. Meteorol. Soc. 2020, 146, 1999–2049. [Google Scholar] [CrossRef]
  54. Cornes, R.C.; van der Schrier, G.; van den Besselaar, E.J.M.; Jones, P.D. An Ensemble Version of the E-OBS Temperature and Precipitation Data Sets. J. Geophys. Res. Atmos. 2018, 123, 9391–9409. [Google Scholar] [CrossRef] [Green Version]
  55. Jammalamadaka, S.R.; SenGupta, A. Topics in Circular Statistics; World Scientific Press: Singapore, 2001. [Google Scholar] [CrossRef]
  56. Soukissian, T.H. Probabilistic modeling of directional and linear characteristics of wind and sea states. Ocean Eng. 2014, 91, 91–110. [Google Scholar] [CrossRef]
  57. Thenkabail, P.S.; Enclona, E.A.; Ashton, M.S.; Van Der Meer, B. Accuracy assessments of hyperspectral waveband performance for vegetation analysis applications. Remote Sens. Environ. 2004, 91, 354–376. [Google Scholar] [CrossRef]
  58. Richards, J.A. Remote Sensing Digital Image Analysis; Springer: Berlin, Germany, 2013. [Google Scholar] [CrossRef]
  59. Hossen, H.; Negm, A. Change Detection in the Water Bodies of Burullus Lake, Northern Nile Delta, Egypt, Using RS/GIS. Procedia Eng. 2016, 154, 951–958. [Google Scholar] [CrossRef]
  60. Tyrlis, E.; Lelieveld, J. Climatology and Dynamics of the Summer Etesian Winds over the Eastern Mediterranean. J. Atmos. Sci. 2013, 70, 3374–3396. [Google Scholar] [CrossRef]
  61. Dafka, S.; Xoplaki, E.; Toreti, A.; Zanis, P.; Tyrlis, E.; Zerefos, C.; Luterbacher, J. The Etesians: From observations to reanalysis. Clim. Dynam. 2016, 47, 1569–1585. [Google Scholar] [CrossRef]
  62. Fox-Kemper, B.; Hewitt, H.T.; Xiao, C.; Aðalgeirsdóttir, G.; Drijfhout, S.S.; Edwards, T.L.; Golledge, N.R.; Hemer, M.; Kopp, R.E.; Krinner, G.; et al. Ocean, Cryosphere and Sea Level Change. In Climate Change 2021: The Physical Science Basis. Contribution of Working Group I to the Sixth Assessment Report of the Intergovernmental Panel on Climate Change; Masson-Delmotte, V., Zhai, P., Pirani, A., Connors, S.L., Péan, C., Berger, S., Caud, N., Chen, Y., Goldfarb, L., Gomis, M.I., et al., Eds.; Cambridge University Press: Cambridge, UK, 2021; in press. [Google Scholar]
  63. Loucks, D.P. Developed river deltas: Are they sustainable? Environ. Res. Lett. 2019, 14, 113004. [Google Scholar] [CrossRef]
  64. UNECE. Strategies for Monitoring and Assessment of Transboundary Rivers, Lakes and Groundwaters; United Nations Economic Commission for Europe: New York, NY, USA, 2006; p. 34. [Google Scholar]
  65. GWO/INBO. The Handbook for Integrated Water Resources Management in Transboundary Basins of Rivers, Lakes and Aquifiers; International Network of Basin Organizations (INBO) and the Global Water Partnership (GWP): Paris, France, 2012; ISBN 978-91-85321-85-8. [Google Scholar]
Figure 1. (a) The Mediterranean region—the black rectangle indicates the Evros river basin; (b) the Evros river basin terrain model—the black rectangle indicates the delta of Evros river; and (c) the Evros river deltaic area land cover.
Water 14 00497 g001
Figure 2. (a) Surface weather chart and (b) the respective precipitation map at a time close to the reported onset of the 2012 flood event; the red squares indicate the broader study area. (c) The flooded area of the Evros river deltaic plain at a time associated with the flood event. The dates corresponding to each map are given in Table 1 (see Meteorological Event Date and Satellite Image Acquisition Date, respectively).
Water 14 00497 g002
Figure 3. (a) Box plots of the sea level for each wind cardinal direction and (b) the respective wind rose.
Water 14 00497 g003
Figure 4. Temporal evolution of the sea-level anomalies, the daily basin and delta precipitation, the wind vector, and the river discharge for the examined period 2005–2018. The shaded areas indicate the periods characterized by delta flooding according to the civil protection records (see Table 1). The black arrows indicate the onset day of each event.
Water 14 00497 g004aWater 14 00497 g004b
Figure 5. Classification of spatial flooding based on flooding frequency.
Water 14 00497 g005
Table 1. Reported historical floods in the lower part of the Evros river. For each flood event, the recorded flood period, the acquisition date of the respective satellite image, the derived flooded area, and the date of the meteorological event associated with the onset of the flood are provided.
Flood Event (FE)YearFlood Period (Civil Protection Directorate)Image TypeSatellite Image Acquisition Date (USGS)Meteorological Event Date (UK Met Office/Deutscher Wetterdienst)
FE-1200516 February 2005–18 March 2005L516 March 200515 February 2005 06UTC
FE-220064 January 2006–4 April 2006L515 February 20064 January 2006 00UTC
FE-320109 February 2010–25 February 2010L723 April 20108 February 2010 00UTC
FE-420126 January 2012–6 February 2012L723 January 20126 January 2012 18UTC
FE-520144 December 2014–31 December 2014L822 December 20143 December 2014 06UTC
FE-620152 February 2015–7 February 2015L823 January 20152 February 2015 00UTC
FE-720156 March 2015–31 March 2015L813 April 20156 March 2015 00UTC
FE-820186 March 2018–20 April 2018L820 March 20186 March 2018 00UTC
Background Image2015 L84 September 2015
Table 2. Flooded area covered for the frequency of occurrence of each event.
CategoryArea (km2)Area Percentage
0–12.5%0.000.0%
12.5–25%0.600.3%
25–37.5%53.2524.5%
37.5–50%35.4716.3%
50–62.5%20.239.3%
62.5–75%41.2418.9%
75–87.5%42.3319.4%
87.5–100%24.5411.3%
Publisher’s Note: MDPI stays neutral with regard to jurisdictional claims in published maps and institutional affiliations.

