Abstract
This study aimed at investigating the applicability of a SWAT (Soil and Water Assessment Tool) model in understanding the effects of drought on winter wheat. This study is based on the water requirement of the crop and addresses the absence of a SWAT model with real-time irrigation simulation. A real-time irrigation module was developed for the downstream irrigation area of the Yellow River to estimate the real-time irrigation of crops. By further simulating the dynamic evolution process of soil moisture content, a dynamic drought evaluation model of winter wheat was established, and the relative soil moisture was set as the evaluation index to assess and analyze the dynamic variation of drought evolution during the growth of winter wheat. The results showed that the improved SWAT model has strong applicability. During the growth of winter wheat, the variation trend of droughts is consistent with that of natural precipitation. For winter wheat, drought is quite normal during all growth stages, and the average frequency is 93.5%, 89.1%, 84.8%, 89.1% and 95.7%. Severe drought and extra-severe drought usually occur during the sowing–tillering stage and the tillering–greening stage, and the frequency of occurrence is 30.4% and 19.6%, respectively. This paper provides a novel approach for the study of agricultural drought in the downstream irrigation area of the Yellow River.
1. Introduction
Drought is a recurring natural phenomenon that has plagued civilization throughout its history [1]. The concept of drought is usually divided into meteorological drought, hydrological drought and agricultural drought. It represents the water shortage caused by the co-demand imbalance of meteorological, runoff and crops, respectively [2]. Agricultural drought is defined as the phenomenon of reduction in the crop yield or even total crop failure due to the decrease in the soil moisture content during the crop growth period [3,4], and it is caused by meteorological drought and hydrological drought [5]. At present, agricultural drought is one of the most serious natural disasters causing agricultural economic losses in China [6]. Agricultural dynamic drought refers to the process of the dynamic change of agricultural drought based on real-time dynamic monitoring data of drought occurrence and development. Agricultural drought research based on real-time dynamic monitoring data can improve the accuracy of drought assessment [7,8]. Consequently, the exploration of the drought process and its dynamic evolution during the crop growth period has great significance in preventing disastrous drought events and ensuring regional food security.
The dynamic evaluation of agricultural drought is often completed through the evaluation of relative soil moisture, crop water deficit index and other indicators [9]. Presently, most of the real-time dynamic monitoring data for the research on agricultural drought are selected from various meteorological stations to build a crop drought evaluation index. Using a combination of methods such as long-term data analysis, mathematical model construction and comprehensive evaluation, the susceptibility of different crops to drought has been studied and analyzed on temporal or spatial scales [10,11,12,13,14]. However, the meteorological stations in China are limited in number and uneven in geographic distribution. Therefore, the agricultural drought evaluation model, which adopts meteorological data as source data, often lacks space-time representativeness and shows unfavorable and unqualified accuracy in the regional agricultural drought research [15,16,17]. However, the Soil and Water Assessment Tool (SWAT)-distributed hydrological model can make up for this limitation [18]. By simulating the hydrological process of the watershed, the SWAT model can obtain continuous and large-scale hydrological and meteorological data of the studied area. Based on this rationale, researchers have explored the application of the SWAT model in the crop water cycle process and irrigation water resource management since the early 21st century [19,20]. As the research progressed, the SWAT model was employed in studies that evaluated agricultural drought and determined the dynamic changes of drought during the crop growth period, and it was widely used in various climatic zones. For instance, McDaniel, R. et al. [21] adopted the SWAT model to simulate three drought indices, namely crop production, soil water consumption and transpiration during the growth season of cotton in the Upper Colorado River Basin (UCRB) and predicted the variation of agricultural drought for the next cropping season. By utilizing an improved SWAT model, Chen, Y. et al. [22] simulated the impact exerted by agricultural production practices on water saving and crop yield in the high plains of Texas. The results of their study indicated that a deep irrigation depth is favorable for maintaining the crop yield and reducing the occurrence of drought events. Sun, L. et al. [23] developed a SWAT model for the Qingjiang basin and used it to simulate potential evapotranspiration and precipitation, which overcame the limitation of insufficient data from few meteorological stations located in complex terrain areas and enabled agricultural drought monitoring at the watershed scale. Li, Y. [24] and Wang, F. [25] employed the SWAT model to simulate soil moisture content, from which they calculated relative soil moisture and used it as an agricultural drought evaluation index. This allowed for the evaluation of agricultural drought in areas where the soil moisture content data are absent.
However, in many of these previous studies, the impact exerted by real-time irrigation on the precision of the SWAT model was not considered. Similarly, the dynamic changes in the extent of drought during the crop growth period under the combined effect of precipitation and irrigation were not included in the simulation. Additionally, there are very few studies on the dynamic characteristics of drought during the growth of winter wheat in the downstream irrigation area of the Yellow River. Therefore, a real-time irrigation module for the crop was developed in the SWAT model. Further, both precipitation and irrigation levels were adopted as the sources of soil water during the growth of winter wheat, which improved the soil water balance formula. The purpose is to allow the simulation of the dynamic variation in the soil moisture during the growth of winter wheat by constructing a drought evaluation model with relative soil moisture as the evaluation index. Furthermore, the dynamic variation of drought evolution during the whole growth period of winter wheat was evaluated and analyzed to provide a theoretical background for the agricultural drought. This can aid in the decision-making for the irrigation of downstream areas of the Yellow River.
2. Materials and Methods
2.1. Study Area
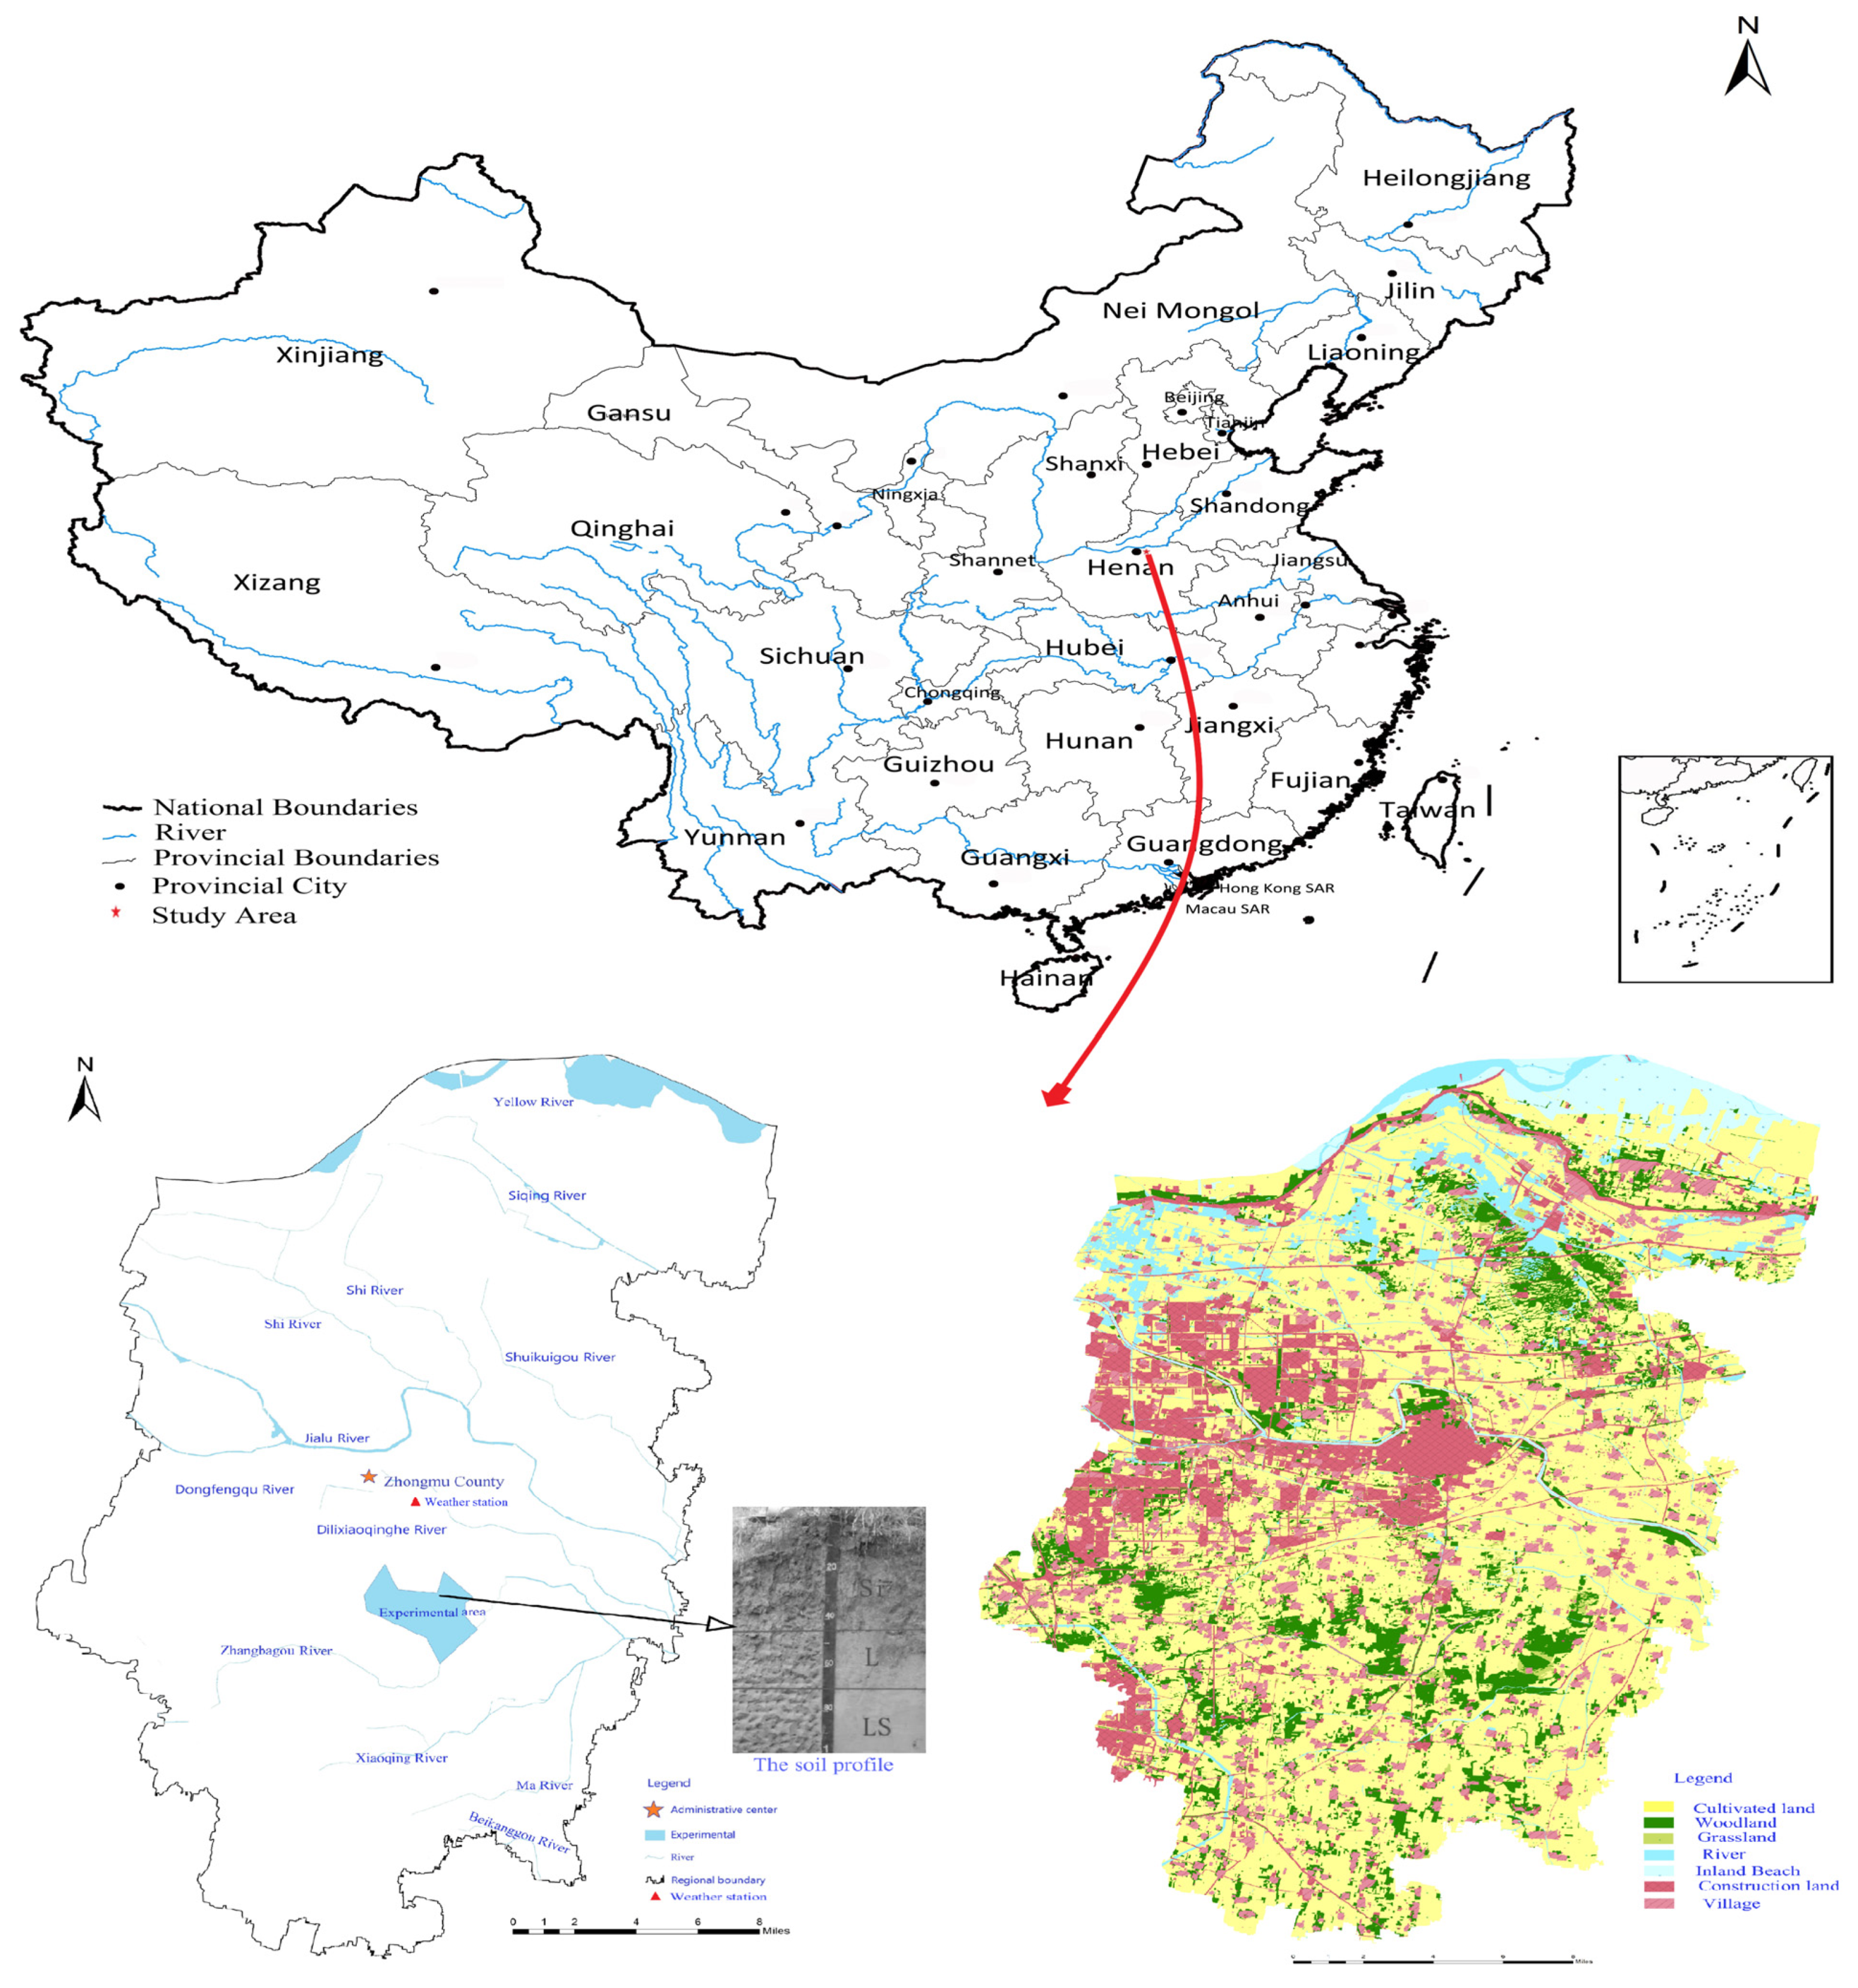
The Sanliuzhai Yellow River diversion irrigation area is located in Zhongmu County, Henan Province. It is situated downstream of the Yellow River, which belongs to the warm temperate continental monsoon climate. The annual average temperature is 14.2 °C, and the annual average precipitation is 597.7 mm, which is mainly concentrated in summer, with seasonal drought. The annual farming period of the irrigation area is 309 days, the active growth period of crops is 217 days and the frost-free period is 240 days. It is an important grain and cotton production area and is suitable for the growth of various crops in Henan Province. The irrigation water in the irrigation area is mainly from the Yellow River. The irrigation area is 7000 km2 and belongs to a typical Yellow River Diversion Irrigation Area. Within one meter of the surface, the soil types from top to bottom are silty soil, loamy soil and loam sandy soil [26,27].
In this study, the Sanliuzhai Yellow River irrigation area was taken as the research area, and the experiments were carried out in high standard farmland, including soil moisture content and winter wheat growth index monitoring, etc. (The geographical location was shown in Figure 1).

Figure 1.
Location map of the study area.
2.2. Data Source
The digital elevation model (DEM), land use status data and soil type data of the Sanliuzhai Yellow River diversion irrigation area were established based on the data coming from the Resources and Environment Data Center of the Chinese Academy of Sciences. The DEM data used were derived from 1:250,000 elevation data from the Resource and Environment Data Center of the Chinese Academy of Sciences, and the resolution was 100 m. However, the soil hydraulic parameters were calculated and obtained from soil water characteristic software SPAW [28].
The data on parameters such as precipitation, temperature and solar radiation were selected from the daily meteorological data of the Zhongmu national meteorological station from 1961 to 2017. The missing data were compensated by the built-in weather generator in the SWAT model. The crop growth parameters were determined and revised based on the built-in database in the SWAT model and also coordinating the actual growth pattern of the winter wheat in the research area. The farmland management data were obtained from the literature review and field survey.
2.3. Improvement of the SWAT Model
The SWAT model is a drainage basin distributed hydrological model featuring strong physical mechanisms and is widely employed in agricultural water resource management, simulation of basin hydrological process and identifying agricultural non-point source pollution. The model is also flexible and can be easily expanded. It is computationally very efficient for doing continuous daily simulations for a long period. However, the accuracy of irrigation simulation is often not enough in a short time [29,30,31,32]. Therefore, in this study, the following modifications were made to the SWAT model:
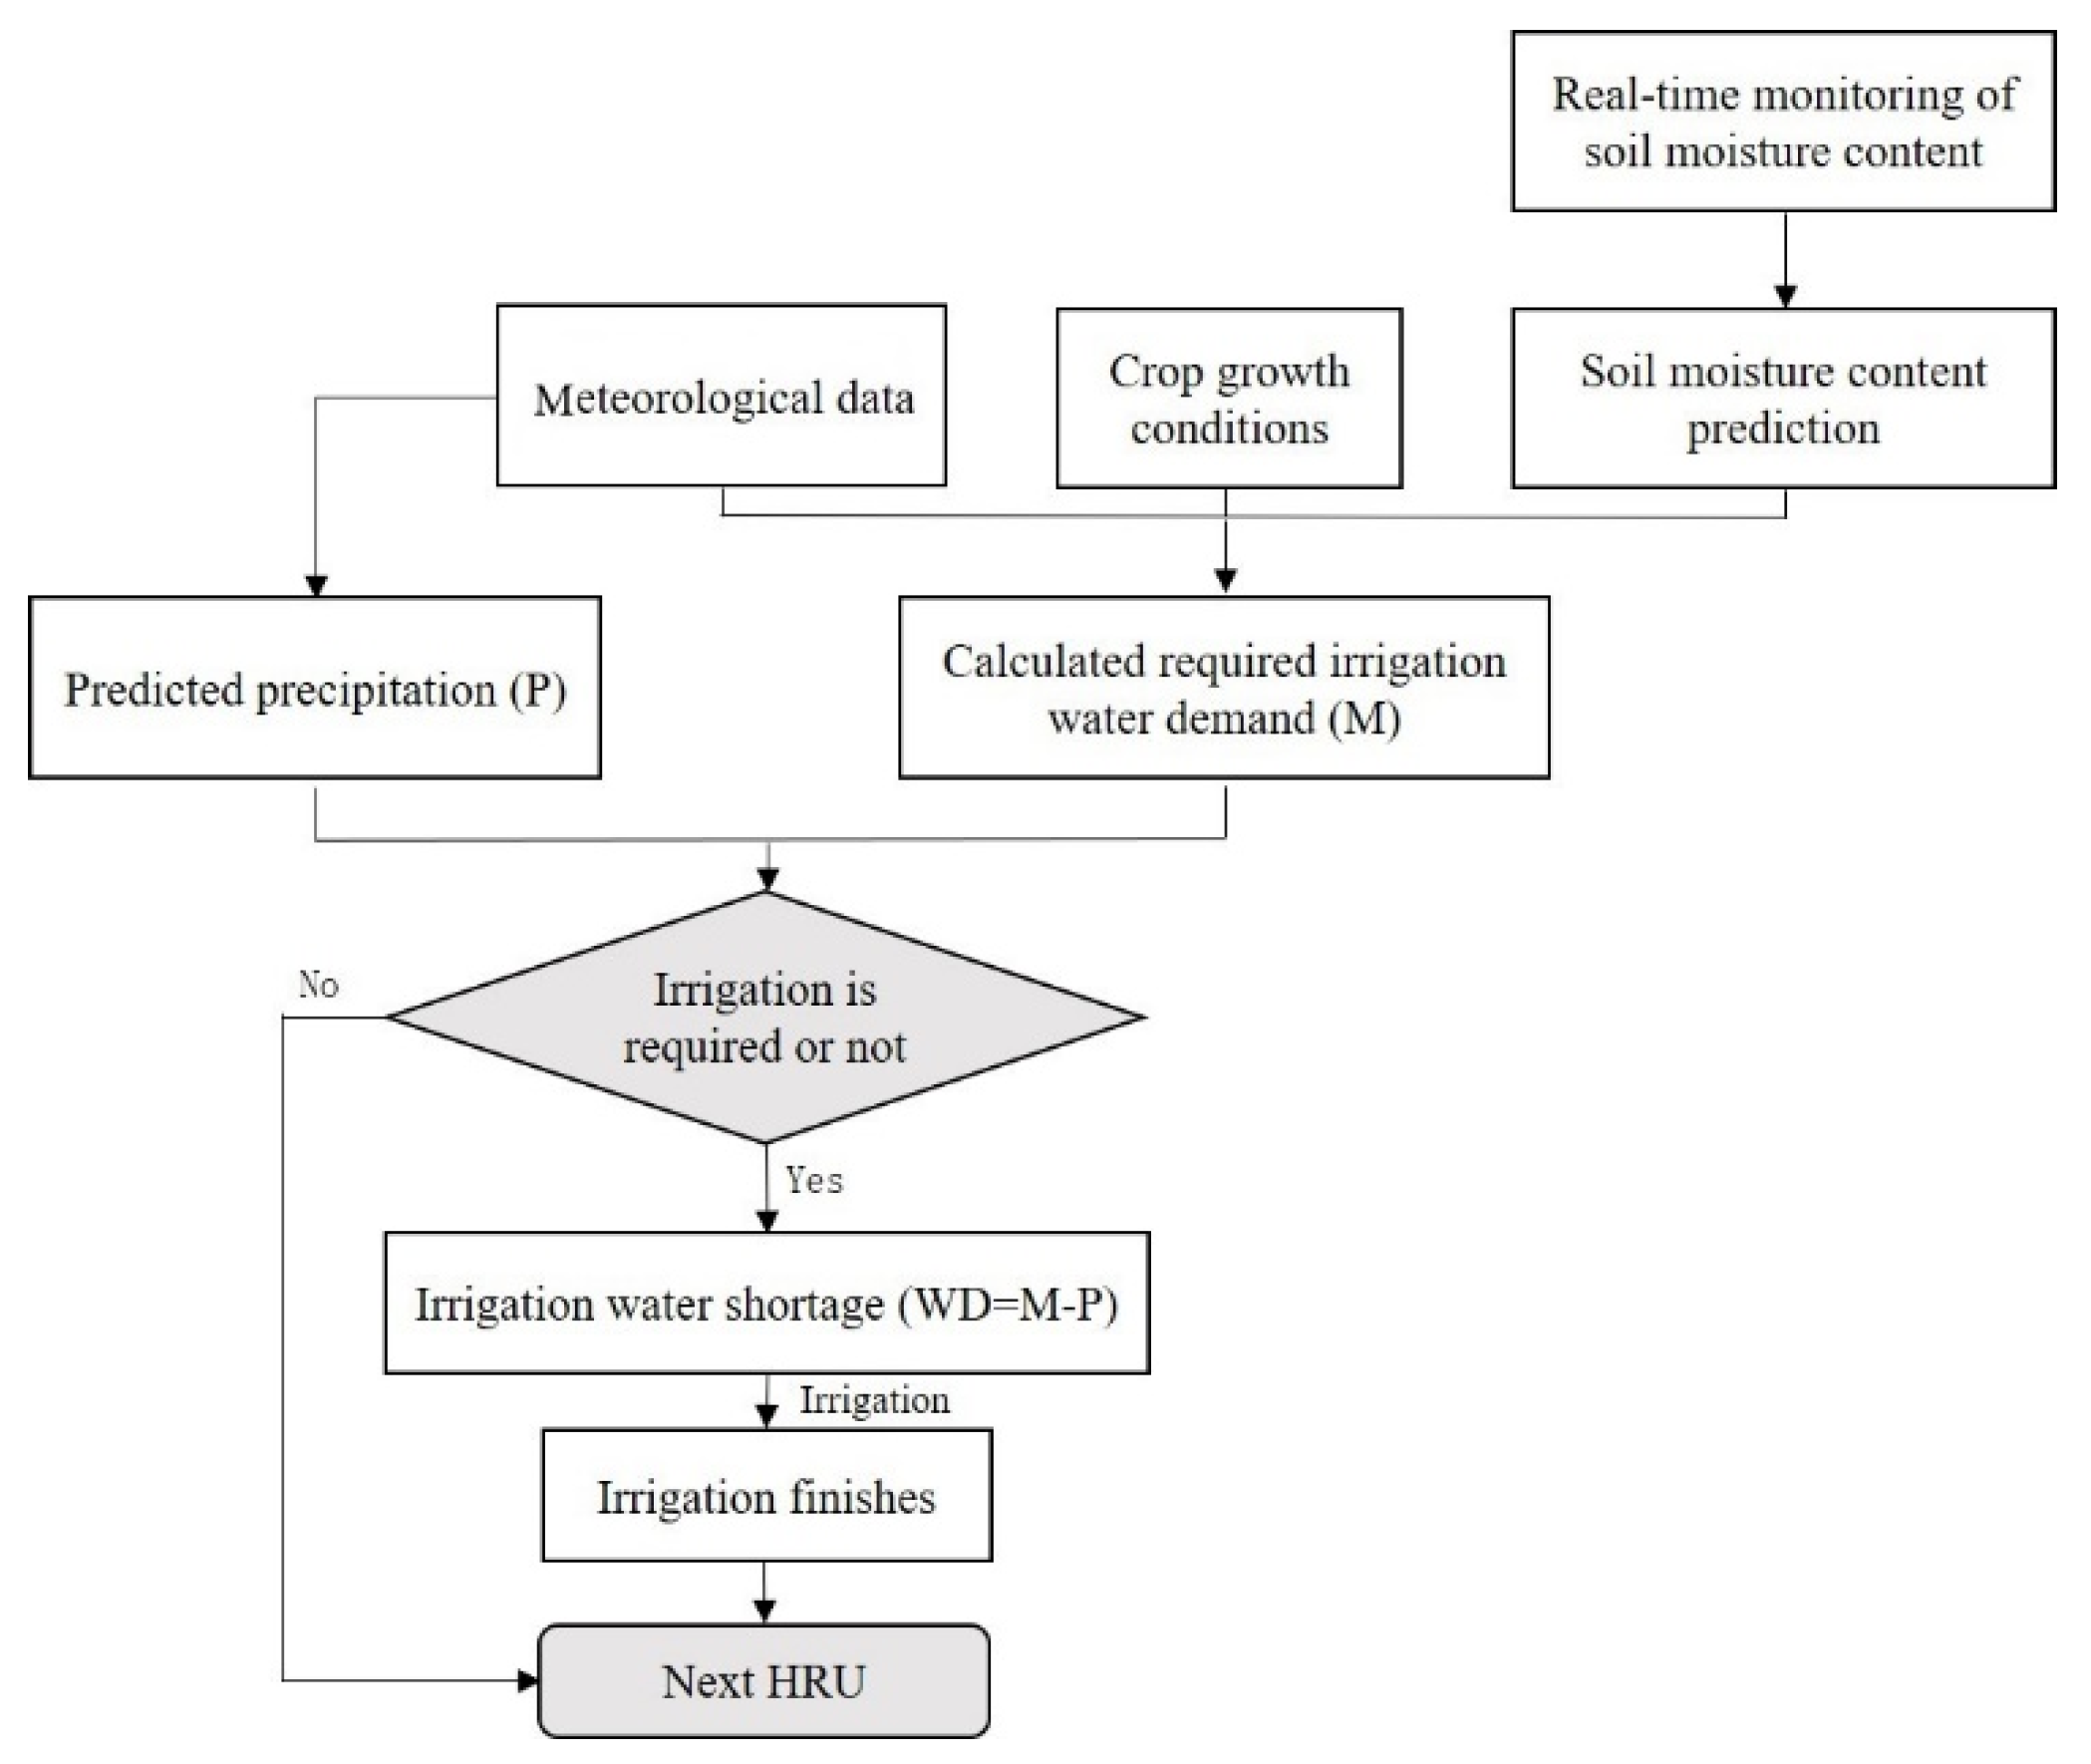
- The occurrence of drought events during the growth of winter wheat is affected more by irrigation activities. Therefore, a real-time crop irrigation module was developed in the SWAT model to simulate the real-time and dynamic impact exerted by irrigation activities on the irrigation district (Figure 2). Based on the real-time monitoring data of the soil moisture content, this module calculates the real-time soil moisture in the irrigation area and deduces the real-time water demand (M) of the crop according to current hydrological and meteorological data and crop growth conditions. Next, the model compares the predicted precipitation (P) and the real-time water demand (M) and suggests if irrigation is required in the experimental region. If irrigation is required, the irrigation water shortage (WD) is calculated by subtracting the real-time water demand (M) from predicted precipitation (P). If irrigation is not required, then the next HRU (Hydrologic Research Unit) is activated. This module can accurately simulate the relative soil moisture and irrigate in the real-time during the crop growth period, thus improving the accuracy of the simulation and making the results of this paper more accurate [33].
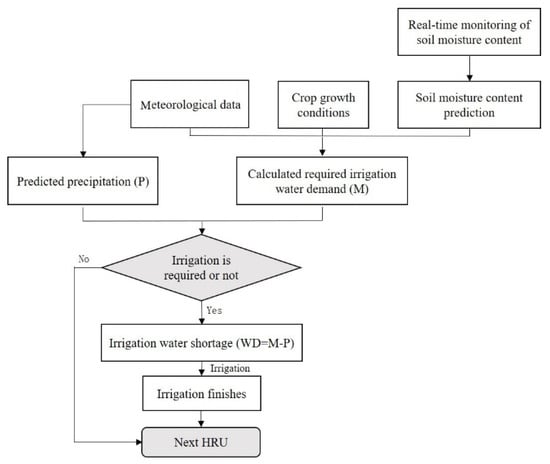 Figure 2. Structure of the real-time irrigation module.
 - The soil water balance formula in the SWAT model was improved based on the real-time prediction of irrigated water shortage (WD), and the real-time irrigation amount was introduced as an index that can influence soil moisture content (Formula (1)). As the sources of water in the soil, both precipitation and irrigation levels were taken into consideration to study the dynamic simulation of soil moisture content in the experimental area (Formula (2)).
The improved formula for water balance in the soil is as follows:
where SWt represents the final soil moisture content and the unit is (mm). SW0 represents the initial soil moisture content, and the unit is (mm). t represents the research period, and the unit is (s). Precip represents the effective precipitation levels during the research period, and the unit is (mm). Irr represents the irrigation levels during the research period, and the unit is (mm). WD represents the irrigation shortage quantity, and its unit is (mm). Revap is the potential transpiration capacity during the research period, and its unit is (mm). ETa represents the actual transpiration capacity during the research period, and the unit is (mm). SURQ is the surface runoff amount during the research period, and the unit is (mm). PERC represents the infiltration quantity during the research period, and the unit is (mm). LATQ indicates the soil water flow during the research period, and its unit is (mm). TILEQ represents the drainage capacity of buried pipes during the research period, and the unit is (mm).
2.4. Rationality Verification of the Model
2.4.1. Parameter Calibration and Verification of Measured Data
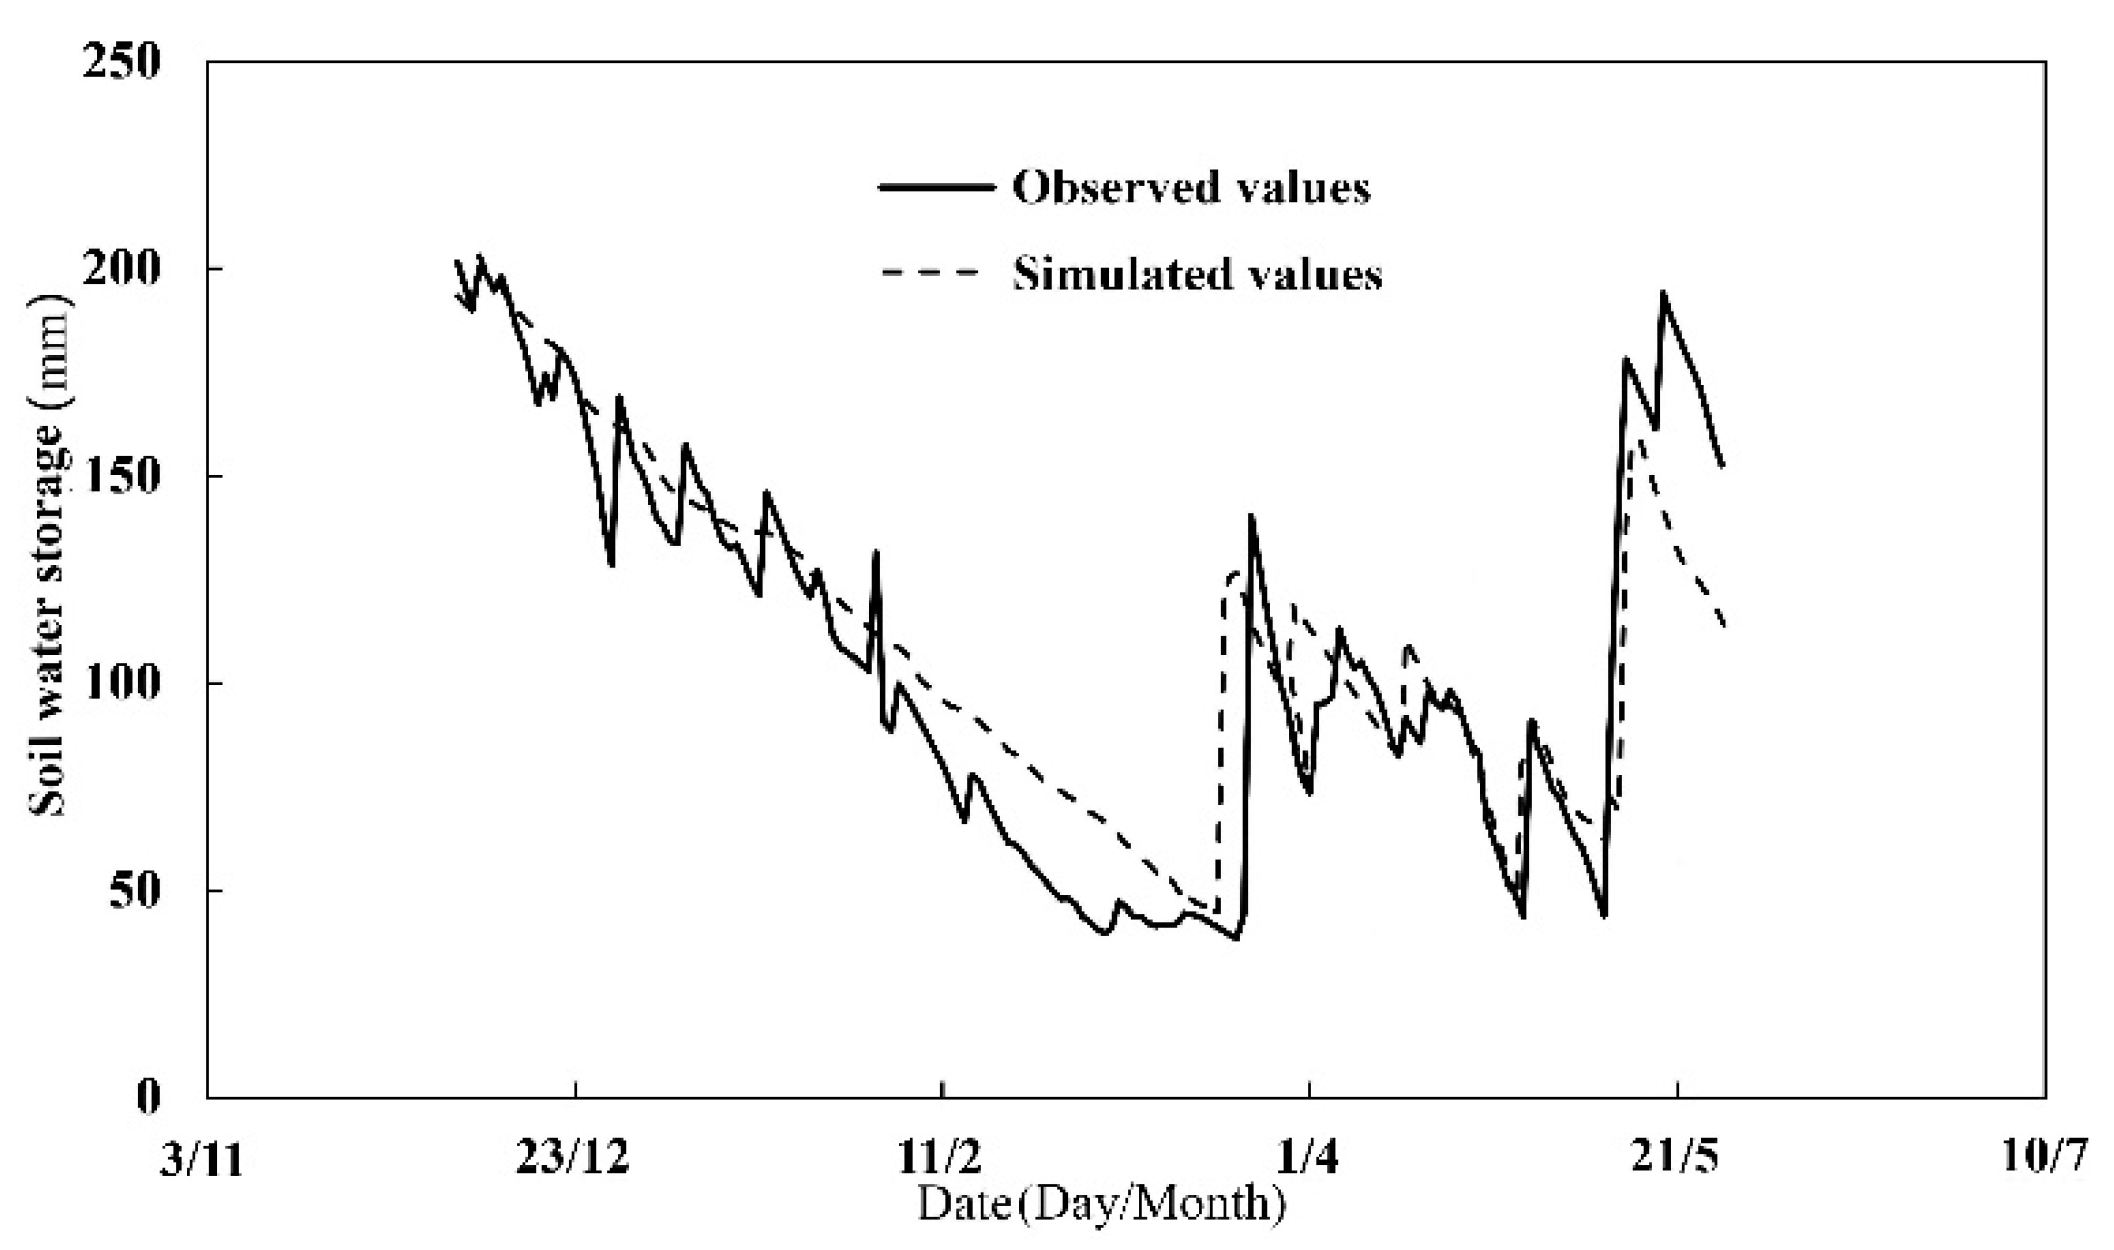
The SWAT-CUP was used for sensitivity analysis and verification based on the growth parameters and soil parameters of winter wheat obtained from the field experiment in the middle and lower reaches of the Yellow River [34,35]. These parameters were used in the SWAT model to carry out calibration and verification with the help of the field test data of the study area: actual measured output, soil moisture, leaf area index, etc. Following this, a verification experiment was carried out (Figure 3). The results indicate that the simulated soil moisture content was consistent with the measured value, and the actual dynamic change of soil moisture content could be reflected objectively by the simulated value of soil moisture content.
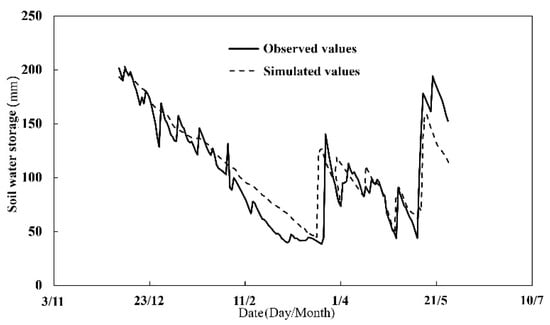
Figure 3.
Comparison of measured and simulated soil water storage during the field experimentation from 10 December 2015 to 27 May 2016.
2.4.2. Validation of Typical Events
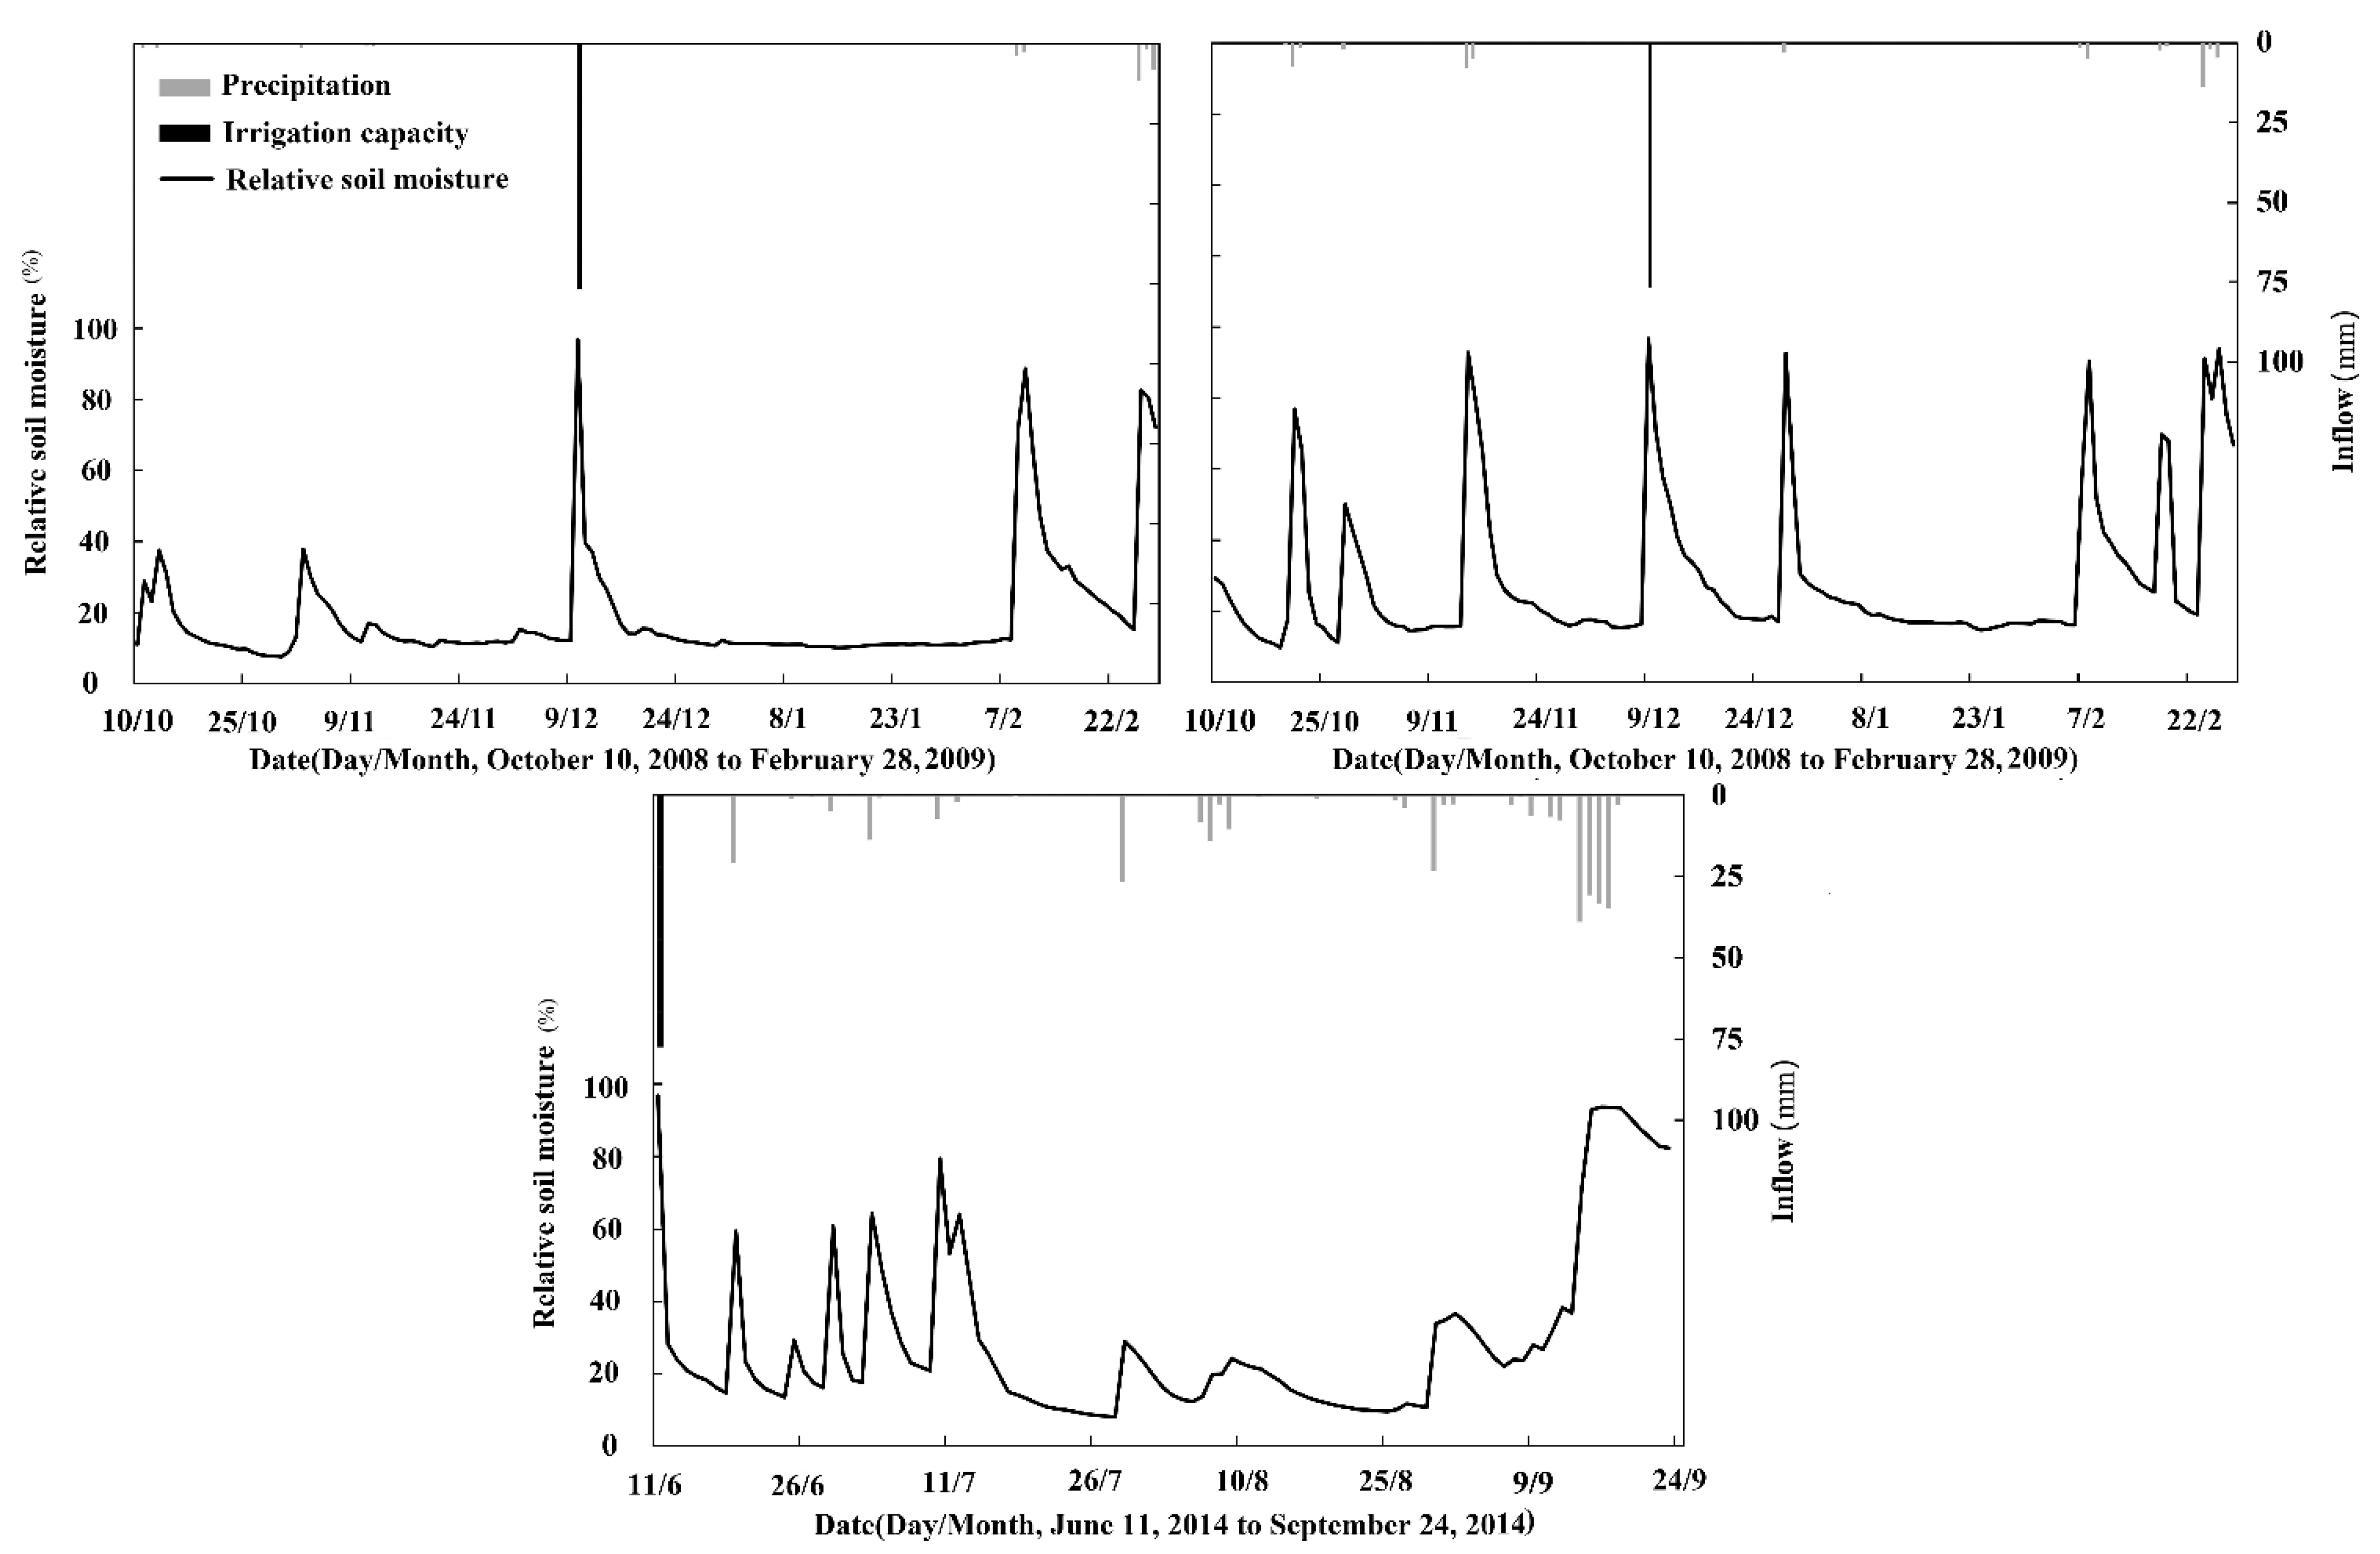
To ensure the feasibility of the improved SWAT model in drought research during the growth of winter wheat, typical drought events, as well as their development process in the experimental area, were used to verify the constructed model.
According to available information, a continuous drought during autumn and winter in 2008–2009 and in 2010–2011 and a summer drought in 2014 were observed and marked as severe drought events in recent years. As shown by the experimental monitoring data during the above-mentioned drought events, it is clear that the precipitation in the experimental area was significantly lower than in previous years. From the experimental monitoring data, it is also apparent that the transpiration and evaporation were greater than the precipitation, and a large fluctuation in the soil moisture content was observed. The average values of relative soil moisture were 37.4%, 21.9% and 33% during the above-mentioned drought events, and these events were graded as severe, extra-severe, and extra-severe, respectively. Even though extra irrigation water was supplied during these drought events, the drought state was often restored within 3–5 days of irrigation, particularly during the summer drought of 2014. This was because higher transpiration and evaporation rates were usually observed in the summer, and the variation in drought features was obvious despite intermittent precipitation [36,37,38].
The SWAT model was utilized to assess and analyze the process of typical agricultural drought events, from the occurrence and development to termination (Figure 4). Compared with the actual experimental testing data, hydrometeorological data and drought data, the simulation results were consistent with the actual development process of drought events.
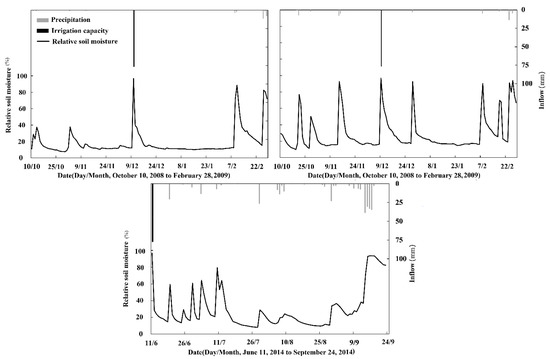
Figure 4.
Variation of the daily relative soil moisture during typical drought events in the experimental area.
Based on the research described above, the accuracy of the method was verified by measured data and typical drought events. This means that the model can accomplish the drought event assessment in the experimental area and can also grade the drought event as well as provide the time scale for when the drought occurs, develops and finishes.
2.5. Assessment Index and Grading of Agricultural Drought
Usually, the soil water storage simulated by the SWAT model is represented in mm. Therefore, it is required that the soil water storage be converted into average soil weight moisture content [24] (Equation (3)), which is used to calculate the relative soil moisture (Equation (4)).
where W represents relative soil moisture and its unit is (%). θ is the average soil moisture content (by weight), and its unit is (%). Fc is the field moisture capacity, and the unit is (%). SW is the water storage of a certain deep soil layer simulated by the hydrological model, and the unit is (mm). dzsoil is the thickness of the soil layer, and the unit is (cm). ρsoil is the soil bulk density, and the unit is (g/cm3).
During the growth of winter wheat, the occurrence of drought events is mainly influenced by the relative humidity of the soil layer at a depth of 0–30 cm. Therefore, the thickness of the soil layer used in this study was 30 cm [33], and the soil bulk density was measured by the cutting ring method.
The grading of the extent of drought during the growth of winter wheat was determined using the drought grade classification standard in (SL424–2008 (Table 1)) [39].

Table 1.
Classification of relative soil moisture.
3. Results and Discussions
3.1. Dynamic Characteristics of Drought Events during the Growth of Winter Wheat
3.1.1. Variation Characteristics of Relative Soil Moisture during Different Growth Stages of Winter Wheat
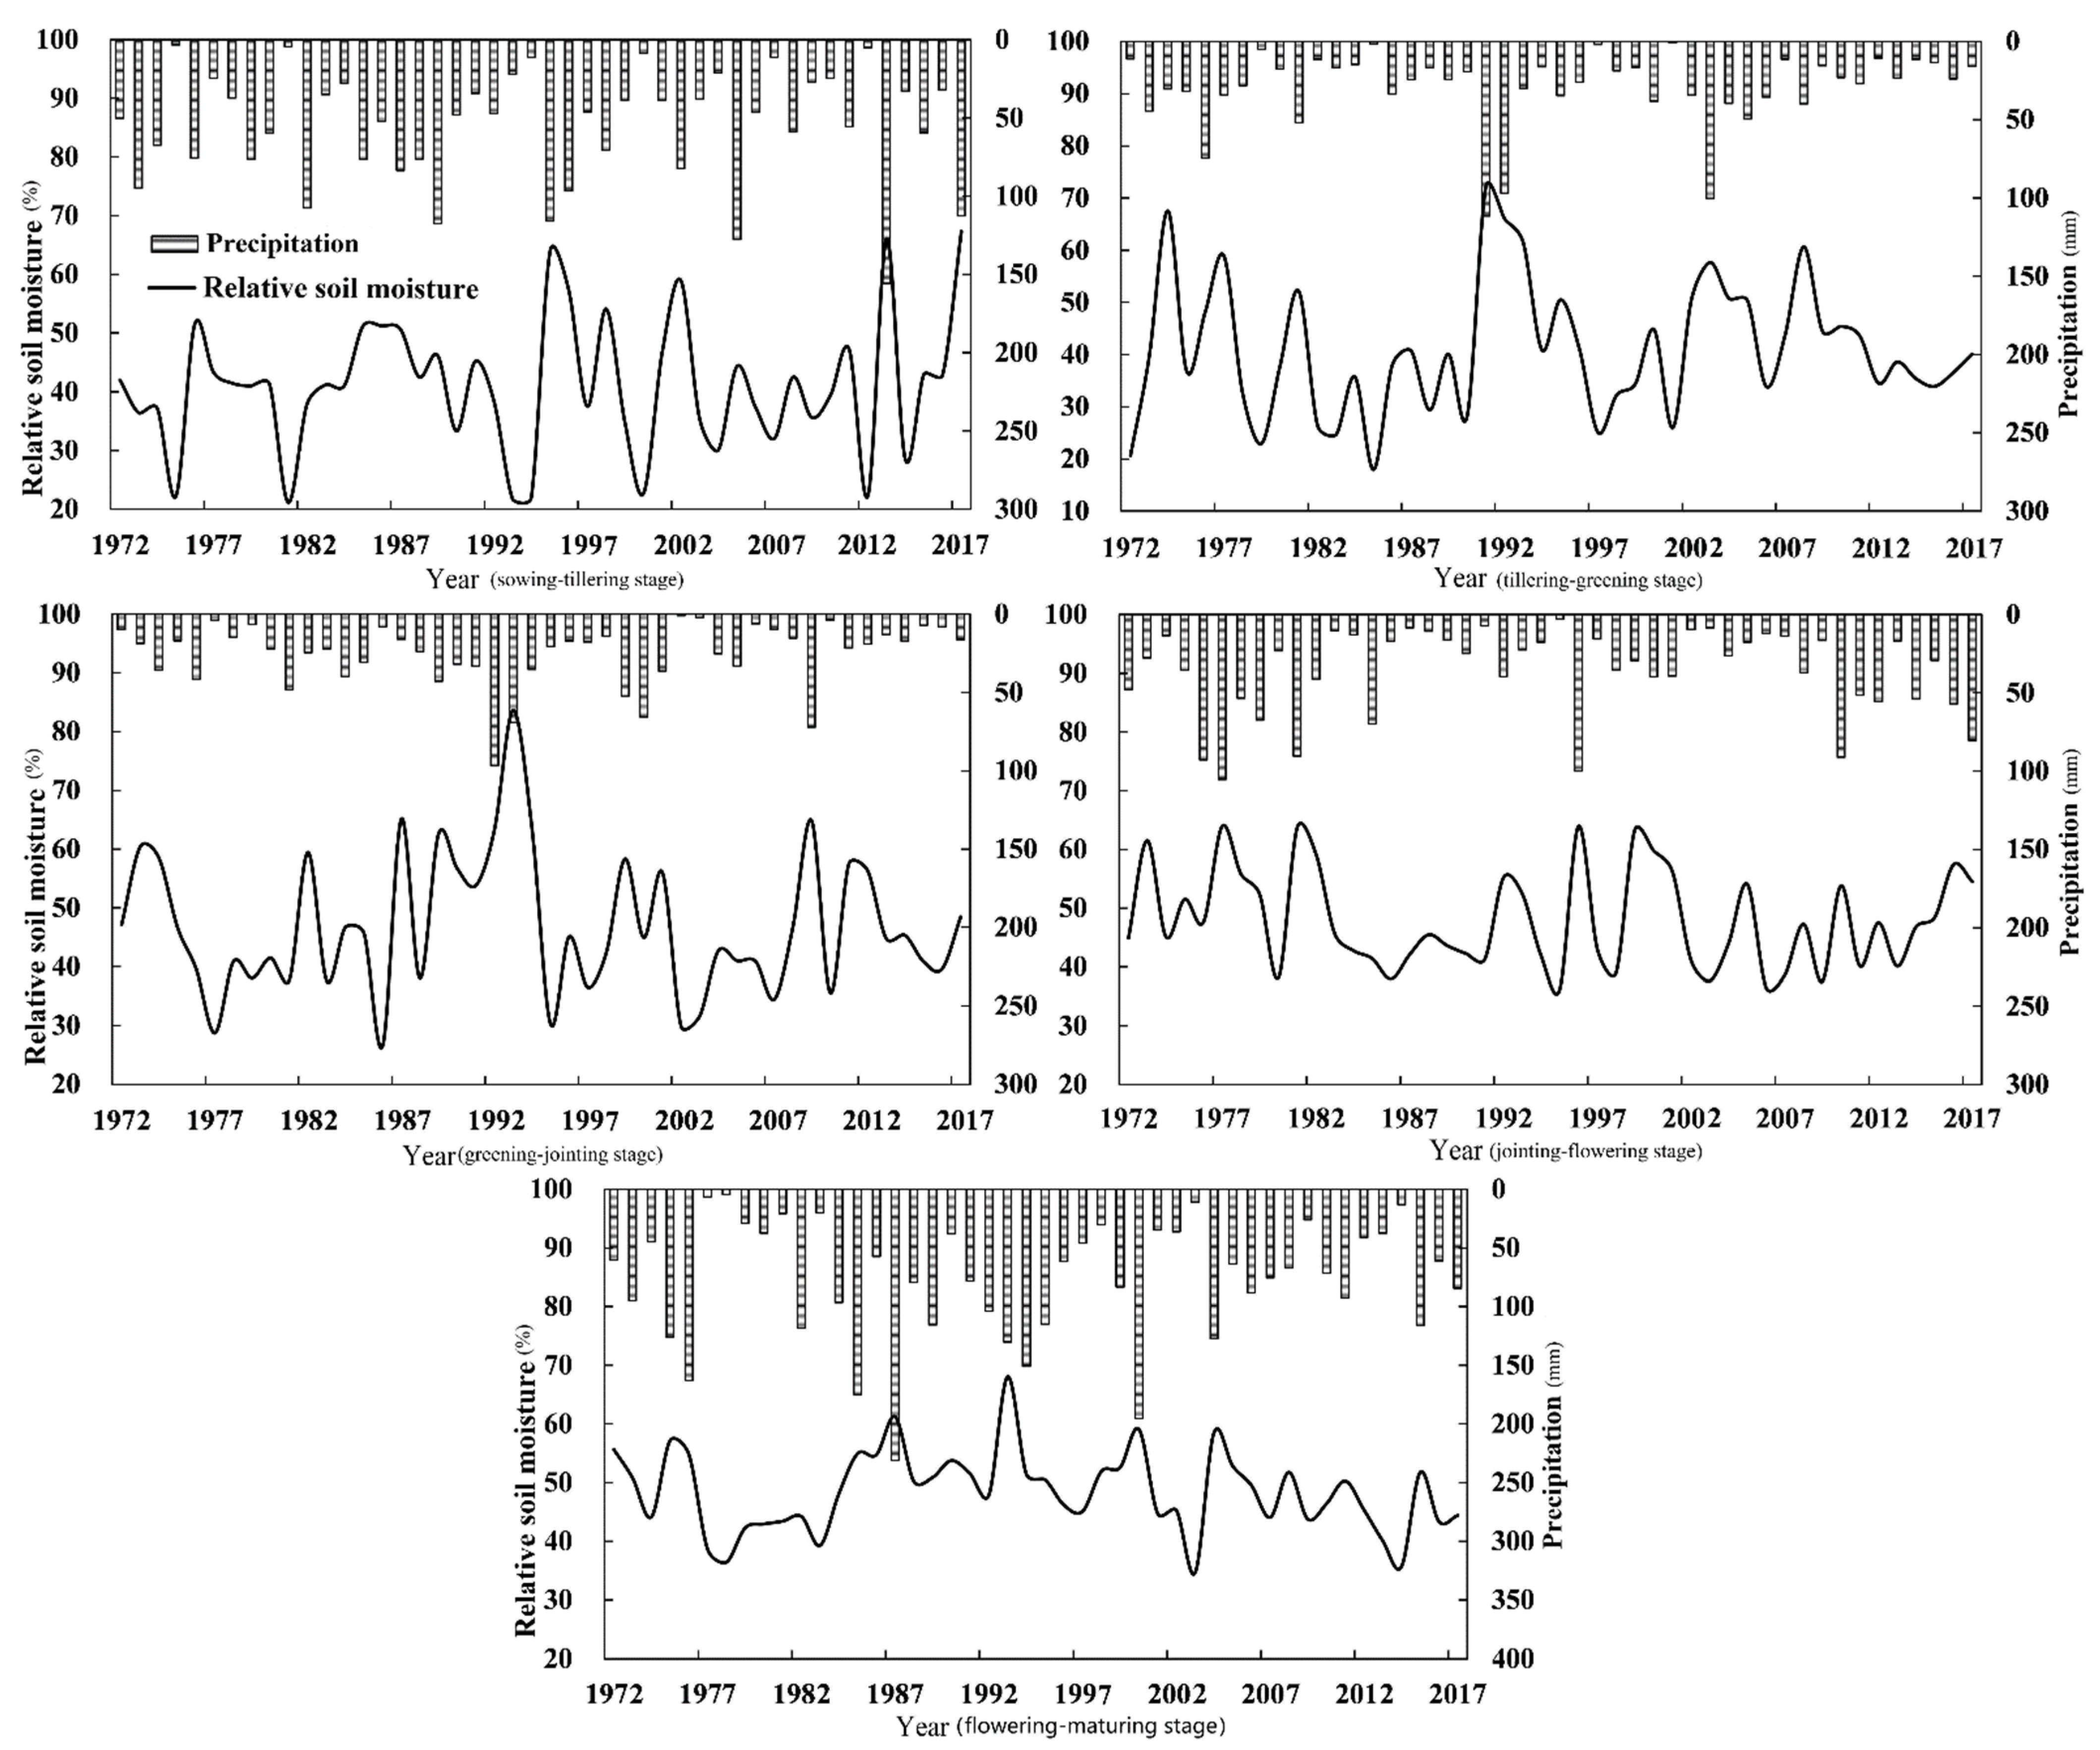
The improved SWAT model was employed to simulate the relative soil moisture during the whole growth period of winter wheat from 1972 to 2017, and the results were used to compare with the corresponding precipitation (Figure 5). During the sowing–tillering stage, the average relative soil moisture was 41.1%, with a maximum value of 67.4% and a minimum value of 21.2%. The corresponding precipitation during this stage was 112.4 mm and 5.4 mm, and the precipitation frequency was 10.6% and 95.7%, respectively. The interannual variation coefficient of precipitation was 0.28. The average annual precipitation during the same period was 55.3 mm and varied from 3.3 mm to 155.7 mm, with an inter-annual variation coefficient of 0.65.
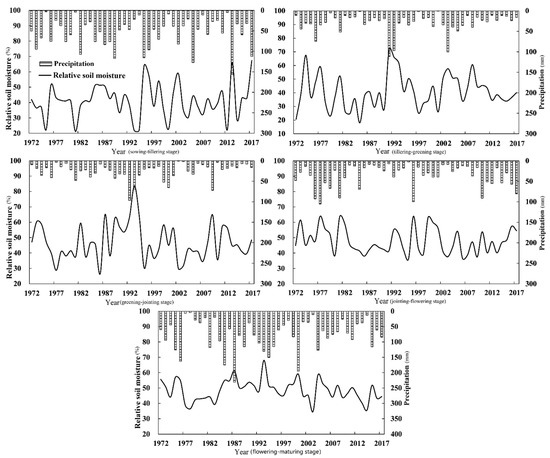
Figure 5.
Change in annual precipitation and average relative humidity in winter wheat.
During the tillering–greening stage, the average relative soil moisture was 41.2%, with a maximum value of 72.1% and a minimum value of 18.0%. The corresponding precipitation during this stage was 111.6 mm and 1.3 mm, and the precipitation frequency was 2.1% and 95.7%, respectively. The interannual variation coefficient of precipitation was 0.31. The average annual precipitation during the same period was 29.5 mm and varied from 0.8 mm to 111.6 mm, with an inter-annual variation coefficient of 0.82.
During the greening–jointing stage, the average relative soil moisture was 46.9%, with a maximum value of 83.6% and a minimum value of 26.5%. The corresponding precipitation during this stage was 69 mm and 8.0 mm, and the precipitation frequency was 6.4% and 80.9%, respectively. The interannual variation coefficient was 0.26. The average annual precipitation during the same period was 25.8 mm and varied from 0.8 mm to 96.6 mm, with an inter-annual variation coefficient of 0.79.
During the jointing–flowering stage, the average relative soil moisture was 47.9%, with a maximum value of 64.0% and a minimum value of 36.2%. The corresponding precipitation during this stage was 105.3 mm and 3.0 mm, and the precipitation frequency was 2.1% and 97.9%, respectively. The interannual variation coefficient was 0.18. The average annual precipitation in the same period was 36.8 mm and varied from 3.0 mm to 105.3 mm, with an inter-annual variation coefficient of 0.76.
During the flowering–maturing stage, the average relative soil moisture was 48.5%, with a maximum value of 68.0% and a minimum value of 34.7%. The precipitation corresponding during this stage was 130.2 mm and 11.0 mm, and the precipitation frequency was 12.8% and 93.6%, respectively. The interannual variation coefficient was 0.14. The average annual precipitation in the same period was 77.4 mm and varied from 3.0 mm to 225.3 mm, with an inter-annual variation coefficient of 0.67.
Consequently, during the growth of winter wheat from 1972 to 2017, the average relative soil moisture was largely influenced by precipitation. The variation trend of relative soil moisture corresponded well with the dynamic variation trend of precipitation. Then, Pearson’s correlation analysis was carried out for each growth period. Results indicate that the correlation coefficient was between 0.612 and 0.761, and both passed the significance test in which α = 0.01 [40]. This suggests that rainfall was the main source that replenishes soil moisture during the growth of winter wheat in the experimental area. However, relatively small correlation coefficients were observed during the greening–jointing and jointing–flowering stages, namely 0.615 and 0.612, respectively. The probable cause could be that during these two growth stages winter wheat displays an exponential growth while the precipitation is relatively limited. As a result, supplementary irrigation is required to meet the water demand of wheat grown in winter.
3.1.2. Interannual Variation and Frequency of Drought during Different Growth Stages of Winter Wheat
The interannual variation, linear variation and 5-year moving average trend of relative soil moisture at each growth stage of winter wheat in the experimental area from 1972 to 2016 are shown in Figure 6. The relative soil moisture at different growth stages of winter wheat followed a cyclic fluctuation pattern of ascend–descend–ascend. Based on an analysis of the total variation trend of relative soil moisture during each growth stage, it was noted that the relative soil moisture was the highest from 2012 to 2017, followed by the period from 1982 to 1991, and was the lowest from 1972 to 1981 during the sowing–tillering stage of winter wheat. During the tillering–greening stage, the observed humidity was highest from 2002 to 2011, followed by the period from 1992 to 2001, and was the lowest from 1982 to 1991. During the greening– jointing stage, the observed humidity was the highest from 1992 to 2001, followed by the period from 1972 to 1981, and was the lowest after 2012. During the jointing–flowering stage, the observed humidity was the highest during 1972 to 1981, followed by the period from 1992 to 1981, and the lowest level occurred from 2002 to 2011. During flowering–maturing stage, the humidity was observed at the highest level from 1992 to 2001, followed by the period from 1982 to 1991, and was the lowest after 2012. These results indicate that winter wheat suffered drought at different times during different growth stages, and the development of drought did not occur throughout the complete growth process of winter wheat.
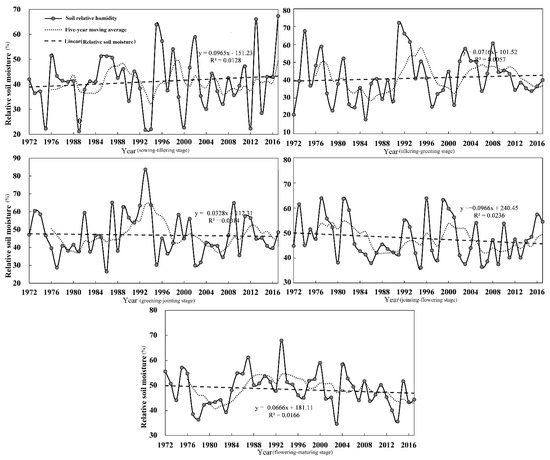
Figure 6.
Variation tendency of annual relative humidity in winter wheat.
By conducting the linear trend analysis of relative soil moisture, it was observed that the average relative soil moisture increased at the rate of 0.965 every 10 years and 0.716 every 10 years during the sowing–tillering stage and tillering–greening stage, respectively. This indicates that the degree of drought in the experimental area showed an ameliorating trend during these two growth stages. Though the average relative soil moisture stayed was relatively higher level during the greening–jointing stage, jointing–flowering stage, and flowering–maturing stage, the overall relative soil moisture decreased at the rate of 0.328 every 10 years, 0.966 every 10 years and 0.67 every 10 years, respectively. This implied that the degree of drought in the experimental area showed an aggravating trend during these growth stages. Employing the M-K trend analysis of relative soil moisture at each growth stage showed that all stages failed the significance test where α = 0.05 [41]. This indicates that in the long term, the variation in relative soil moisture during the growth of winter wheat became more stable, or in other words, the variation of extent of the degree of drought remained steady during the growth period of winter wheat in the experimental area.
Correlation analysis showed a positive correlation between the five-year moving average curve and the variation trend of relative soil moisture during each growth stage of winter wheat. Moreover, the variation trend of relative soil moisture changed significantly during the sowing–tillering stage and tillering–greening stage, while a relatively small fluctuation was observed during the greening–jointing stage, jointing–flowering stage, and flowering–maturing stage. This indicated that during the experimental period, the drought severity on winter wheat was relatively significant during the sowing–tillering and tillering-greening stages.
To further understand the drought characteristics of winter wheat, the frequency of drought during different growth stages of winter wheat from 1972 to 2017 was calculated. The average frequency of drought in each growth stage of winter wheat was 93.5%, 89.1%, 84.8%, 89.1% and 95.7%, respectively. Similarly, the frequency of light drought in each growth stage of winter wheat was 15.2%, 15.2%, 17.4%, 26.1% and 43.5%, respectively. At the same time, the frequency of moderate drought during these stages was 34.8%, 23.9%, 37.0%, 45.7% and 41.3%, respectively. Additionally, the frequency of severe drought during the five growth stages of winter wheat was 28.3%, 30.4%, 23.9%, 17.4% and 10.9%, respectively. Extra-severe drought was observed only during three stages (sowing–tillering, tillering–greening, and greening–jointing) and the frequency of the extra-severe drought during these three stages was 15.2%, 19.6% and 6.52%, respectively.
These observations indicate that winter wheat is susceptible to drought during the whole growth period, and the frequency of moderate drought is relatively high. From the perspective of growth stages, light drought is mostly seen during the flowering–maturing stage. Moderate drought is most likely to occur during the jointing-flowering stage. Severe drought is most likely to occur during the tillering–greening stage. Extra-severe drought is most likely to occur during the tillering–greening stage and sowing–tillering stage, and it occasionally occurs during the greening–jointing stage.
3.2. Spatial Distribution Characteristics of Drought in Winter Wheat
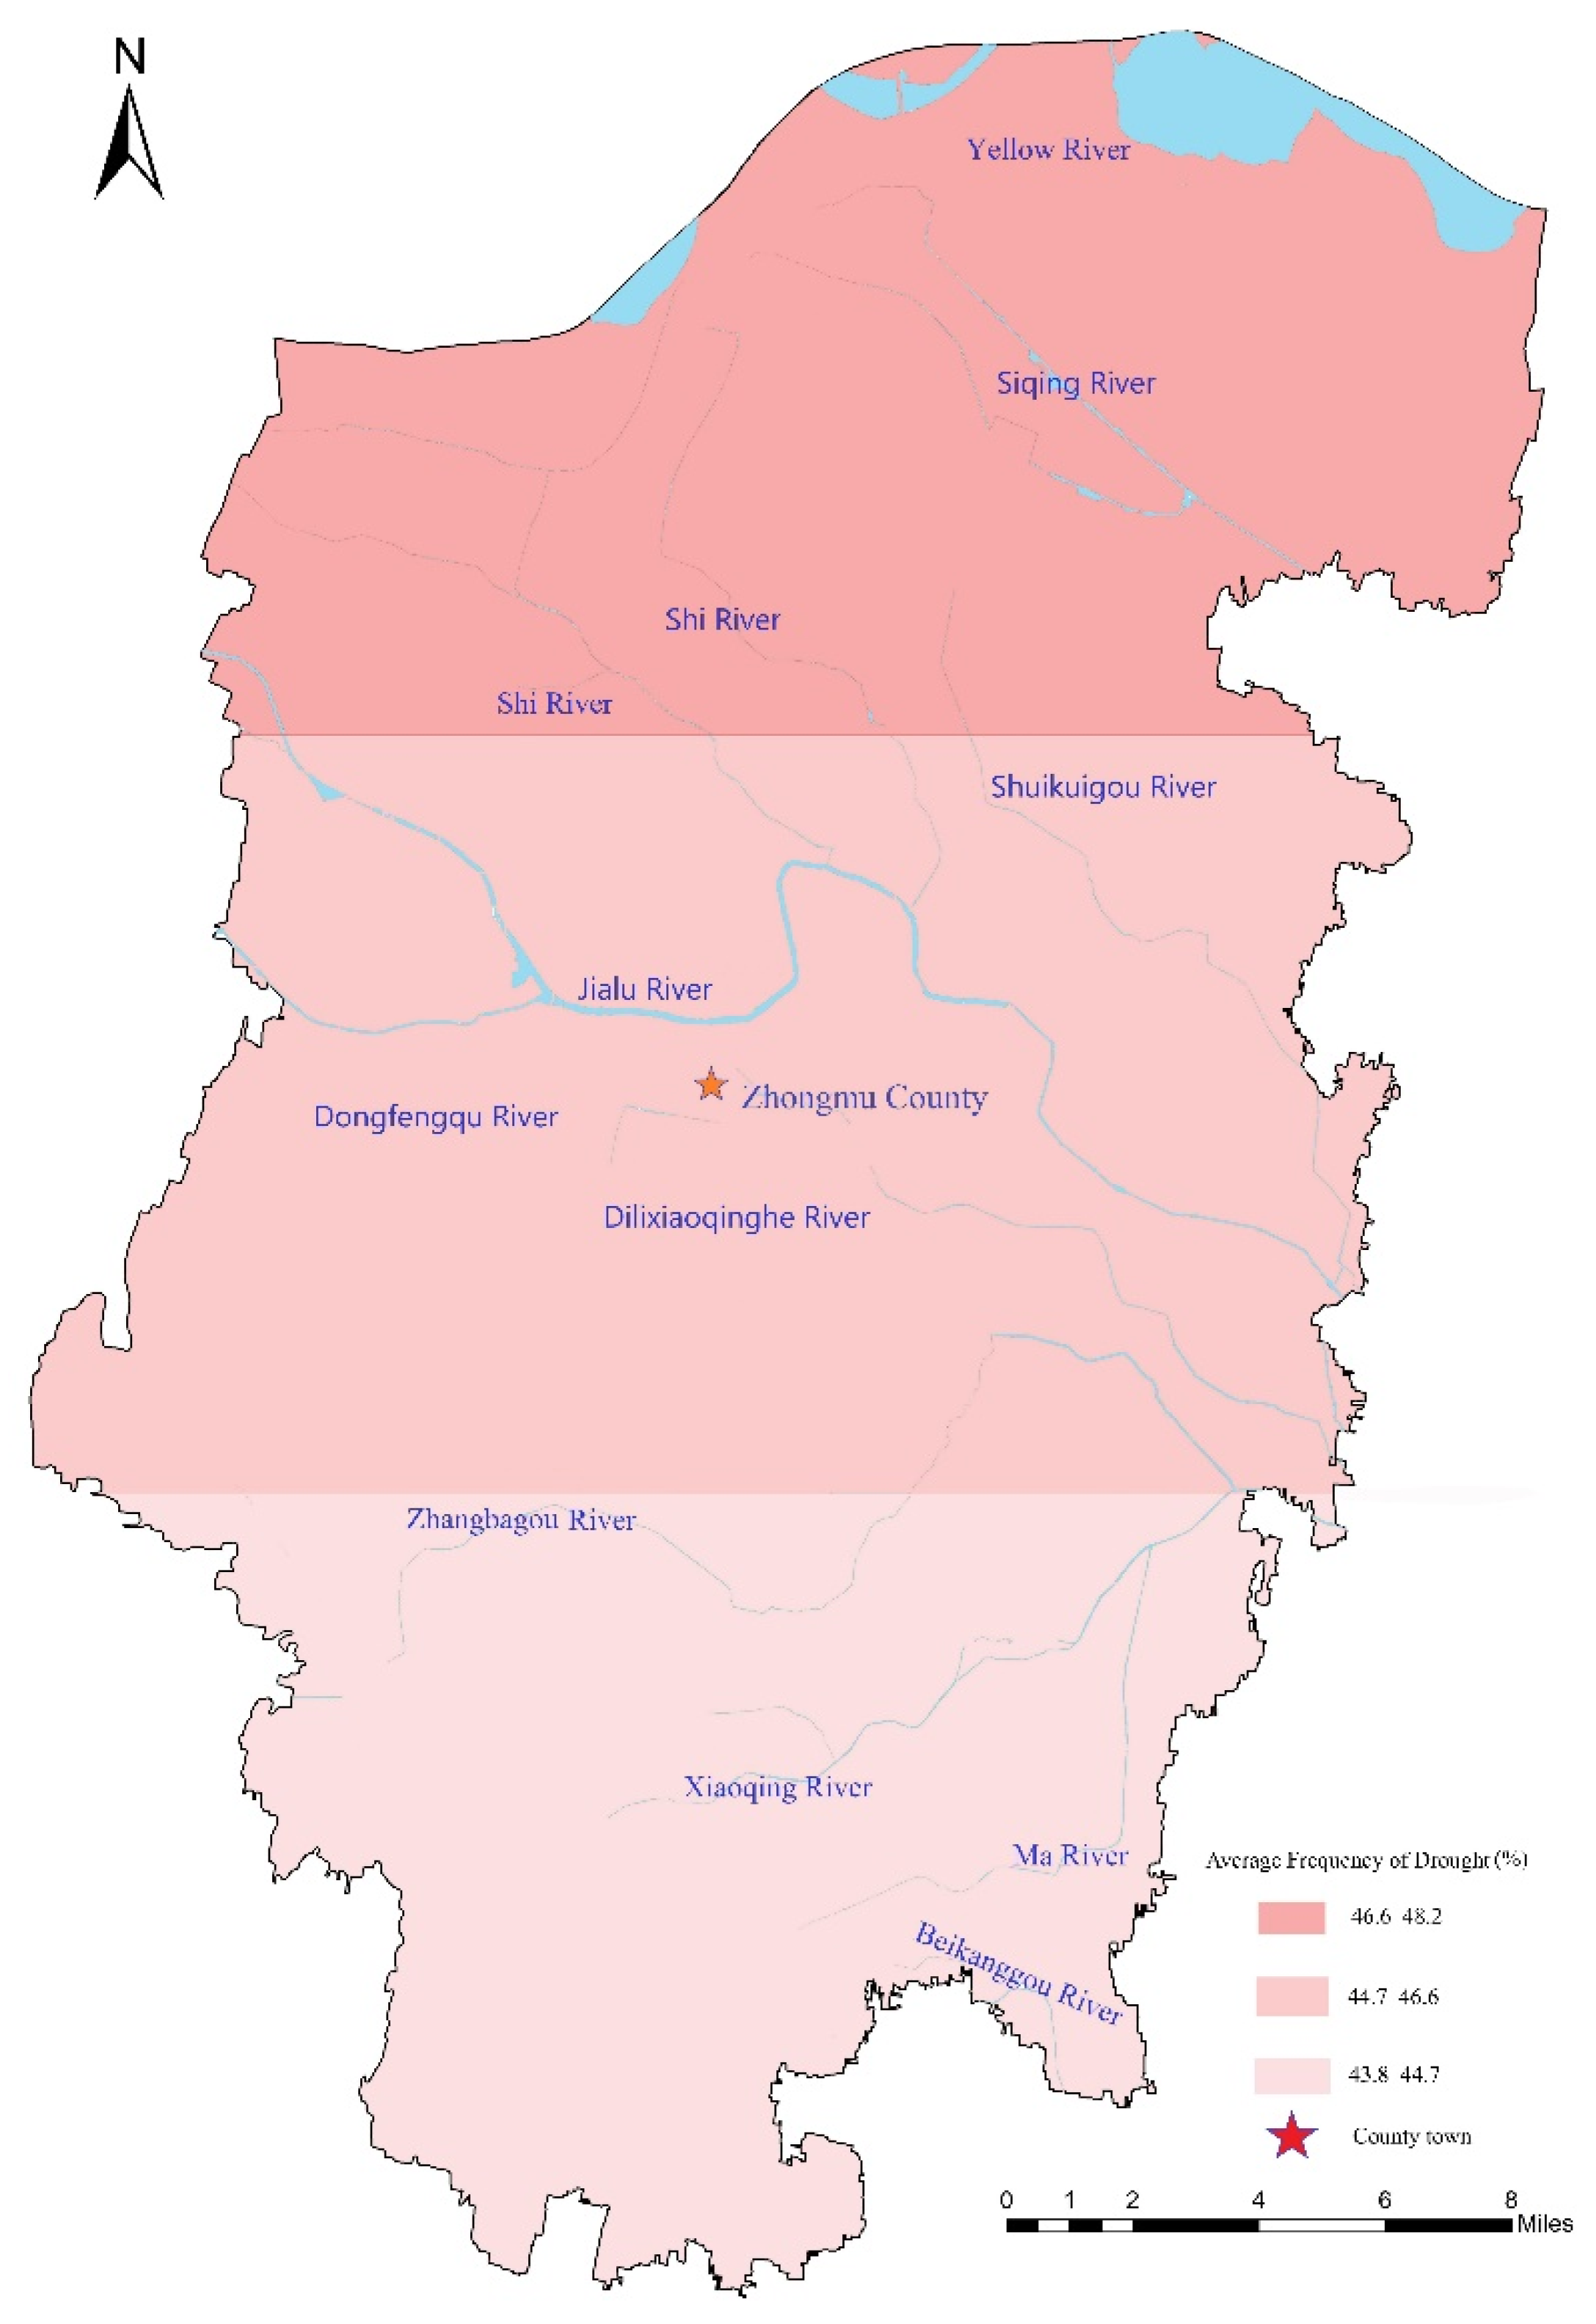
Spatially, the drought status of winter wheat in the study area has little change, and the annual average drought frequency is between 43.8 and 48.3%. As the study area is north–south, the study is divided into three regions: north, central and south. The drought frequency of winter wheat is 46.6–48.2%, 44.7–46.6% and 43.8–44.7%, respectively (Figure 7). The agricultural drought trend weakens from north to south because the rivers in the study area mainly flow through the southern region, and the largest river Jialu river flows through the middle and south.

Figure 7.
Annual drought frequency distribution of winter wheat.
4. Conclusions
A real-time irrigation module was developed using the SWAT model, and thus the soil water balance formula was improved. By simulating the soil moisture content in the experimental area, the relative soil moisture during the growth period of winter wheat was calculated. Then, the results were adopted as the assessment indices and were utilized to evaluate and analyze the dynamic characteristics of drought during different growth stages of winter wheat. The following conclusions were made from this study.
The drought conditions during the growth of winter wheat are greatly affected by precipitation. During each growth period, the dynamic variation trend of average relative soil moisture keeps consistent with corresponding precipitation. Their correlation coefficients ranged between 0.612 and 0.761, and they all passed the significance test where α = 0.01.
The drought occurrence during the growth period of winter wheat shows a dynamic variation that corresponds to the amount of precipitation, and the variation trend of drought remains stable in the long term, while the interannual variation is significant. During each growth stage of winter wheat, drought could be easily observed, mainly moderate drought and light drought. In the flowering–maturing stage, the frequency of drought could reach as high as 95.7%. Nevertheless, severe drought and extra-severe drought were mostly observed during the sowing–tillering stage and tillering–greening stage. Spatially, the annual average drought frequency of winter wheat was found to be between 43.8 and 48.3%, and the drought gradually weakened from north to south.
The improved SWAT model has demonstrated strong applicability in the study of drought conditions during the growth of winter wheat. This improved model can provide a novel approach for researching the dynamic characteristics of winter wheat drought conditions. It can also offer a scientific basis for preventing agricultural drought downstream of the Yellow River where the irrigation district resides.
Author Contributions
Conceptualization, J.M. and B.C.; methodology, J.M.; software, L.L.; validation, J.M., X.H. and B.C.; data curation, F.L., J.Y. and Z.J.; writing—original draft preparation, B.C.; writing—review and editing, J.M. and B.C. All authors have read and agreed to the published version of the manuscript.
Funding
This research was funded by National Natural Science Foundation of China (Grant No. 41601019) Lei Liu, Scientific and technological innovation talents in colleges and universities in Henan Province (Grant No. 15HASTIT046) Jianqin Ma.
Institutional Review Board Statement
Not applicable.
Informed Consent Statement
Not applicable.
Data Availability Statement
The data presented in this study are available on request from the corresponding author. The data are not publicly available due to privacy.
Conflicts of Interest
The authors declare no conflict of interest.
References
- Sai, M.V.R.S.; Murthy, C.S.; Chandrasekar, K.; Jeyaseelan, A.T.; Diwakar, P.G.; Dadhwal, V.K. Agricultural drought: Assessment & monitoring. Mausam 2021, 67, 131–142. [Google Scholar] [CrossRef]
- Liu, Y.; Huang, S.; Fang, W. Propagation and dynamic change of meteorological drought to hydrological drought in different seasons. J. Hydraul. Eng. 2021, 52, 93–102. [Google Scholar]
- Yonas, T. Perception of agricultural drought resilience in South Africa: A case of smallholder livestock farmers. J. Disaster Risk Stud. 2021, 13, e1–e11. [Google Scholar]
- Shashikant, V.; Shariff, A.M.; Wayayok, A.; Kamal, R.; Lee, Y.; Takeuchi, W. Utilizing TVDI and NDWI to Classify Severity of Agricultural Drought in Chuping, Malaysia. Agronomy 2021, 11, 1243. [Google Scholar] [CrossRef]
- Du, C.; Chen, J.; Nie, T. Spatial–temporal changes in meteorological and agricultural droughts in Northeast China: Change patterns, response relationships and causes. Nat. Hazards 2021, 110, 155–173. [Google Scholar] [CrossRef]
- Cui, Y.; Zhang, B.; Huang, H.; Wang, X.; Zeng, J.; Jiao, W.; Yao, R. Identification of Seasonal Sub-Regions of the Drought in the North China Plain. Water 2020, 12, 3447. [Google Scholar] [CrossRef]
- Chen, L.; Yang, X.; Ba, D.; Xue, S. Determination and application of the dynamic drought-monitoring indexes for agriculture in Gansu province. Agric. Res. Arid. Areas 2005, 01, 144–148+156. [Google Scholar]
- Ma, X.; Yao, Y.; Xu, Y. A Model for Dynamic Assessment of Crop Yield Losses from Drought and Its Tryout in Anhui Province. J. Catastrophol. 2010, 25, 13–17. [Google Scholar]
- Prodhan, F.; Zhang, J.; Yao, F.; Shi, L.; Sharma, T.P.; Zhang, D.; Cao, D.; Zheng, M.; Ahmed, N.; Mohana, H. Deep Learning for Monitoring Agricultural Drought in South Asia Using Remote Sensing Data. Remote Sens. 2021, 13, 1715. [Google Scholar] [CrossRef]
- Mishra, A.K.; Singh, V.P. A review of drought concepts. J. Hydrol. 2010, 391, 202–216. [Google Scholar] [CrossRef]
- Li, F.; Li, H.; Lu, W.; Zhang, G.; Kim, J.-C. Meteorological Drought Monitoring in Northeastern China Using Multiple Indices. Water 2019, 11, 72. [Google Scholar] [CrossRef] [Green Version]
- Chen, S.; Thian, Y.; Tan, X. Assessment of CFSR, ERA-Interim, JRA-55, MERRA-2, NCEP-2 reanalysis data for drought analysis over China. Clim. Dyn. 2019, 53, 737–757. [Google Scholar] [CrossRef]
- Zhang, R.; Chen, Z.; Xu, L.-J.; Ou, C.-Q. Meteorological drought forecasting based on a statistical model with machine learning techniques in Shaanxi province, China. Sci. Total Environ. 2019, 665, 338–346. [Google Scholar] [CrossRef] [PubMed]
- Xia, L.; Zhao, F.; Mao, K.; Yuan, Z.; Zuo, Z.; Xu, T. SPI-Based Analyses of Drought Changes over the Past 60 Years in China’s Major Crop-Growing Areas. Remote Sens. 2018, 10, 171. [Google Scholar] [CrossRef] [Green Version]
- Liu, Y.; Hwang, Y. Improving drought predictability in Arkansas using the ensemble PDSI forecast technique. Stoch. Hydrol. Hydraul. 2014, 29, 79–91. [Google Scholar] [CrossRef]
- Wang, W.; Huang, J.; Cui, W. Comparison of drought indices for remote sensing drought monitoring in Yunnan-Guizhou Plateau region. Trans. Chin. Soc. Agric. Eng. 2018, 34, 131–139+309. [Google Scholar]
- Du, L.; Tian, Q.; Wang, L. A synthesized drought monitoring model based on multi-source remote sensing data. Trans. Chin. Soc. Agric. Eng. 2014, 30, 126–132. [Google Scholar]
- Choudhary, R.; Athira, P. Effect of root zone soil moisture on the SWAT model simulation of surface and subsurface hydrological fluxes. Environ. Earth Sci. 2021, 80, 1–16. [Google Scholar] [CrossRef]
- Sun, F.; Mejia, A.; Zeng, P.; Che, Y. Projecting meteorological, hydrological and agricultural droughts for the Yangtze River basin. Sci. Total Environ. 2019, 696, 134076. [Google Scholar] [CrossRef]
- Arnold, J.G.; Srinivasan, R.; Muttiah, R.S.; Williams, J.R. large area hydrologic modeling and assessment part I: Model development. JAWRA J. Am. Water Resour. Assoc. 1998, 34, 73–89. [Google Scholar] [CrossRef]
- McDaniel, R.L.; Munster, C.; Nielsen-Gammon, J. Crop and Location Specific Agricultural Drought Quantification: Part III. Forecasting Water Stress and Yield Trends. Trans. ASABE 2017, 60, 741–752. [Google Scholar] [CrossRef]
- Chen, Y.; Marek, G.; Marek, T.; Brauer, D.; Srinivasan, R. Improving SWAT auto-irrigation functions for simulating agricultural irrigation management using long-term lysimeter field data. Environ. Model. Softw. 2018, 99, 25–38. [Google Scholar] [CrossRef]
- Sun, L.; Chen, X.; Pei, Z. Drought monitoring of upper and middle reaches of Qingjiang Basin based on SWAT model. Trans. Chin. Soc. Agric. Eng. 2014, 30, 129–137. [Google Scholar]
- Li, Y.; Liang, Z.; Zhao, W. Evaluation Method and Its Application of Agricultural Drought Based on SWAT Model. South-North Water Transf. Water Sci. Technol. 2014, 12, 7–11. [Google Scholar]
- Wang, F.; Wang, J.; Shi, J. Study on Simulation of Agricultural Drought in a Region Based on SWAT Model. J. North China Univ. Water Resour. Electr. Power 2019, 40, 64–70. [Google Scholar]
- Bian, Y.; Huang, F.; Cao, H. Analysis of Diversion Capacity of Sanliuzhai Irrigation Area on the Lower Yellow River. Yellow River 2019, 41, 152–156. [Google Scholar]
- Henan Jiuzheng Engineering Consulting Co., Ltd. Preliminary Design Text of 666.7 Hectares High Standard Farmland Construction Project in Yaojia Town, Zhongmou County in 2021; Henan Jiuzheng Engineering Consulting Co., Ltd.: Zhengzhou, China, 2021; pp. 17–25. [Google Scholar]
- Sachin, N.; Ashwini, K.; Sangita, S. Soil Erodibility Estimation for Soil Conservation in Dapoli Region of Maharashtra. Trends Biosci. 2014, 7, 486–490. [Google Scholar]
- Navideh, N.; Latif, K.; Sabahattin, I. Water quality prediction using SWAT-ANN coupled approach. J. Hydrol. 2020, 590, 125220. [Google Scholar]
- Harikrishna, S.; Sanat, N. A Methodological Framework for Identification of Baseline Scenario and Assessing the Impact of DEM Scenarios on SWAT Model Outputs. Water Resour. Manag. 2020, 34, 4795–4814. [Google Scholar]
- Hanna, K.; Paul, M.; Negahban-Azar, M.; Shirmohammadi, A. Developing a Decision Support System for Economic Analysis of Irrigation Applications in Temperate Zones. Water 2021, 13, 2044. [Google Scholar] [CrossRef]
- Ferreira, A.; de Almeida, A.; Koide, S.; Minoti, R.; Siqueira, M. Evaluation of Evapotranspiration in Brazilian Cerrado Biome Simulated with the SWAT Model. Water 2021, 13, 2037. [Google Scholar] [CrossRef]
- Zhang, Z.; Ma, J. Research and application of real—Time online irrigation management system for winter wheat in North China based on B/S mode. J. Arid. Land Resour. Environ. 2015, 29, 120–125. [Google Scholar]
- Liu, L.; Luo, Y. Effects of Different Irrigation Systems on the Relationship between Crops and Water in the Irrigation Districts along the Lower Reaches of the Yellow River. J. Irrig. Drain. 2011, 30, 5–10. [Google Scholar]
- Luo, Y.; He, C.; Sophocleous, M.; Yin, Z.; Hongrui, R.; Ouyang, Z. Assessment of crop growth and soil water modules in SWAT2000 using extensive field experiment data in an irrigation district of the Yellow River Basin. J. Hydrol. 2008, 352, 139–156. [Google Scholar] [CrossRef]
- Li, Z. Nearly 35% of Small Reservoirs in Henan Suffered the Worst Drought in 63 Years [EB/OL]. 2014. Available online: http://news.youth.cn/gn/201407/t20140728_5568520.htm (accessed on 5 November 2021).
- Duan, H.; Wang, S.; Feng, J. National drought situation in 2010 and its influence and causes. J. Arid. Meteorol. 2011, 29, 126–132. [Google Scholar]
- Ma, J. Zhengzhou Suffered the Worst Drought in 50 Years, 1.67 Million mu of Farmland and 130000 People were Affected [EB/OL]. 2009. Available online: http://finance.ifeng.com/a/20090205/352190_0.shtml (accessed on 5 November 2021).
- Ministry of Water Resources of the People’s Republic of China. Standard of Drought Grade for Water Conservancy Industry of the People’s Republic of China: SL424-008; China Water & Power Press: Beijing, China, 2009. [Google Scholar]
- Gong, Y.; Ji, X.; Hong, X.; Cheng, S. Correlation Analysis of Landscape Structure and Water Quality in Suzhou National Wetland Park, China. Water 2021, 13, 2075. [Google Scholar] [CrossRef]
- Perz, A.; Sobkowiak, L.; Wrzesiński, D. Spatial Differentiation of the Maximum River Runoff Synchronicity in the Warta River Catchment, Poland. Water 2020, 12, 1782. [Google Scholar] [CrossRef]

Publisher’s Note: MDPI stays neutral with regard to jurisdictional claims in published maps and institutional affiliations. |
© 2022 by the authors. Licensee MDPI, Basel, Switzerland. This article is an open access article distributed under the terms and conditions of the Creative Commons Attribution (CC BY) license (https://creativecommons.org/licenses/by/4.0/).