Article

Recent Hydrological Droughts in Brazil and Their Impact on Hydropower Generation

by
Luz Adriana Cuartas
1,2,*,
Ana Paula Martins do Amaral Cunha
1,2,
Jessica Anastácia Alves
2,
Larissa Milena Pinto Parra
2,
Karinne Deusdará-Leal
1,
Lidiane Cristina Oliveira Costa
1,
Ruben Dario Molina
3,
Diogo Amore
1,
Elisangela Broedel
1,
Marcelo Enrique Seluchi
1,
Christopher Cunningham
1,
Regina Célia dos Santos Alvalá
1,2 and
José Antonio Marengo
1,2
1
National Center for Monitoring and Early Warning of Natural Disasters (CEMADEN), São José dos Campos 12247-016, Brazil
2
Graduate Program in Natural Disasters, UNESP/CEMADEN, State University of São Paulo, São José dos Campos 12247-016, Brazil
3
Environmental School, Faculty of Engineering, University of Antioquia, Medellín 050010, Colombia
*
Author to whom correspondence should be addressed.
Water 2022, 14(4), 601; https://doi.org/10.3390/w14040601
Submission received: 22 December 2021 / Revised: 28 January 2022 / Accepted: 9 February 2022 / Published: 16 February 2022

Abstract

:
Brazil has endured the worst droughts in recorded history over the last decade, resulting in severe socioeconomic and environmental impacts. The country is heavily reliant on water resources, with 77.7% of water consumed for agriculture (irrigation and livestock), 9.7% for the industry, and 11.4% for human supply. Hydropower plants generate about 64% of all electricity consumed. The aim of this study was to improve the current state of knowledge regarding hydrological drought patterns in Brazil, hydrometeorological factors, and their effects on the country’s hydroelectric power plants. The results show that since the drought occurred in 2014/2015 over the Southeast region of Brazil, several basins were sharply impacted and remain in a critical condition until now. Following that event, other regions have experienced droughts, with critical rainfall deficit and high temperatures, causing a pronounced impact on water availability in many of the studied basins. Most of the hydropower plants end the 2020–2021 rainy season by operating at a fraction of their total capacity, and thus the country’s hydropower generation was under critical regime.

1. Introduction

Heat waves, heavy rain, drought and associated wildfires, and coastal flooding are examples of extreme weather events that pose risks to human health, livelihood, assets, and ecosystems. The 21st century begins with a considerable record of natural disasters associated with hydrometeorological and climatic extremes. These occurrences resulted in significant economic and environmental losses worldwide. Over 4.4 billion people were injured, homeless, displaced or in need of emergency assistance from 1998 to 2017. Floods, storms, droughts, heat waves, and other extreme weather events caused 91% of all disasters, according to the UNISDR and CRED report [1]. However, droughts can seriously harm a country’s economic performance, causing widespread problems in various sectors. According to GAR [2], climate change increases the frequency, severity, and duration of droughts globally, requiring efforts to effectively respond to the significant risks posed by droughts. Future climate change scenarios are expected to cause considerably more deaths, as well as ecological and economic damage [3]. Climate models project significant regional climate differences between current and 1.5 °C warming scenarios, and even further variations between 1.5 and 2 °C warming. For example, hot extremes are likely to increase in most of the land and ocean regions (high confidence), heavy precipitation is likely in several regions (medium confidence), and drought and precipitation deficits are likely in others (medium confidence) [4]. High temperatures will exacerbate drought conditions by increasing evapotranspiration, and thus water demand [5].
Drought is a multifaceted phenomenon with no consensus definition [6]. According to Wilhite and Glantz [7], drought has conceptual and operational definitions. The first one defines droughts in relative terms, e.g., a drought is a prolonged dry period. Another way is to define the onset and the end of drought periods that can be used to analyze the frequency, severity, and duration of droughts over a given historical period. As the period between the water inputs (precipitation) into the system and the availability of the “usable” water differs significantly, the time scale over which water deficits (precipitation deficits) accumulate becomes extremely important and determines the types of droughts [8]: (1) Meteorological drought: A prolonged lack of precipitation over a large area. (2) Vegetative/Agricultural drought: A deficit of soil moisture limiting crop and forage growth. (3) Hydrological drought: Refers to negative anomalies in river discharge, groundwater levels or lake levels or a loss of wetland area. The causes of hydrological drought are complex, involving both atmospheric and hydrological processes at different time scales. The last one provides humidity to the atmosphere, storage water on the surface and subsurface, and flow to the streams. (4) Socioeconomic drought: Refers to water shortages and drought-related ecological or health impacts [9,10]. The last one is linked to the first three types of impacts. More recently, new types of droughts have also been considered, such as groundwater and ecological droughts. Droughts in groundwater typically last from months to years. Initially, droughts reduce the groundwater recharge, then its levels and discharge [10,11]. Ecological drought is an episodic deficit of water that pushes ecosystems to their vulnerability limits, impacts ecosystem services, and stresses natural and human systems [12].
Drought management requires an understanding of the timing, duration, severity, and spatial extent of drought events [10]. Numerous drought indices have been developed to characterize drought events quantitatively [13]. The standardized precipitation index (SPI), standardized precipitation and evapotranspiration index (SPEI), and standardized streamflow index (SSFI), at long time scales (greater than 6 months), are used to identify and characterize hydrological droughts [13,14,15]. The SPI index [16] uses the desired period’s long-term precipitation record, while the SPEI index [8,17] uses the climatic water balance (precipitation minus potential evapotranspiration). SPI and SPEI both fit a probability distribution, then a normal distribution. SSFI is analogous to SPI, but the input data is streamflow rather than precipitation [18]. According to Vicente-Serrano et al. [8], “drought indices must be associated with a specific time scale to be useful for monitoring and managing different usable water resources”.
Climate change will increase drought risk and severity depending on the regions, seasons, and drought indicators used [19], and may exacerbate food, water, and energy insecurity. This presents real challenges to Brazilian agricultural production [20,21], water supply, and hydropower generation due to the rising temperatures; changing rainfall patterns; and deficit of water. Climate extremes have been reported in Brazil in recent decades. Notable droughts include 2005, 2010, 2015–2016 Amazon droughts [22,23,24,25], the 2012–2018 drought in Northeast Brazil [26,27,28,29], the 2001 and 2013–2014 droughts in Southeast Brazil [30,31,32,33], the 2019 and 2020 droughts in Pantanal [34,35], and the 2012–2013, 2019–2020 droughts in southern Brazil [36,37]. Northeast Brazil, the Amazon region, central and southern Brazil experienced their worst droughts in the first two decades of the 21st century. During the last decade, other country areas have suffered severe and prolonged droughts [36]. For instance, in Southeast Brazil, rainfall has decreased [38] and air temperature has increased [39], resulting in an increase of the intensity and duration of droughts [30,32], with severe consequences for the regions’ water reserves. Drought in the Northeast (2012–2018) impacted Sobradinho’s hydropower plant (HPP), reducing mean generation. The plant’s functional volume was 60% in 2014 and 20% in December 2015 (http://www.ons.org.br/paginas/resultados-da-operacao/boletins-da-operacao, accessed on 18 October 2021). Drought conditions prevailed in 2017, and the reservoir reached a critical volume of 15%. Sobradinho’s minimum generation value fell from 356 MWmed in 2013 to 105 MWmed in November 2017 [40].
Despite the fact that Brazil has 14% of the world’s freshwater, its spatial distribution is very heterogeneous: Residents of Amazonas have access to 700,000 m3 of water per year, while residents of the Metropolitan Region of São Paulo have only 280 m3 [41]. Intense urbanization has exacerbated the distribution issue, increasing demand while decreasing water quality [42]. Approximately 77.7% of the water consumed is for agriculture (irrigation and livestock), 9.7% for the industry, and 11.4% for human supply [43]. According to the national energy balance (BEN) [44], hydroelectric power accounts for approximately 11% of primary energy and 64% of total electricity generation in Brazil. The national energy plan (PNE) projects that the hydroelectric sector will remain dominant until 2050, although the impact of climate change on hydroelectric generation are currently under discussion [45]. Based on PNE studies, the average and critical energy reduction of plants in the North and Northeast subsystems is estimated to be 15% for the existing park and 25% for the future park. Moreover, results show that part of the hydroelectric potential will lose economic viability if energy production falls below the levels indicated in terms of the installed power by the end of 2050 [45]. Therefore, the PNE suggests that to achieve a 100% renewable energy matrix, the hydroelectric sector should be utilized to its full potential, with participation from other renewable energy sources, such as wind, solar, and biomass.
As a result, characterizing and understanding the potential impact of droughts on water resources availability is essential for future mitigation and adaptation actions in all of the productive sectors in Brazil. However, most of the research on Brazilian drought focuses on meteorological and agricultural droughts [36], and only a few studies focus on hydrological drought in basins [46,47,48,49] and reservoirs in the Northeast region [50,51]. In this research, we studied the hydrological drought patterns in 20 priority basins for hydropower across the country, as well as the impact on hydroelectricity generation. The interannual variability of three drought indicators was described in detail, highlighting the current hydrological surface conditions affecting hydropower generation in Brazil. We characterized hydrological drought conditions using climate, hydrology, and land use data.

2. Materials and Methods
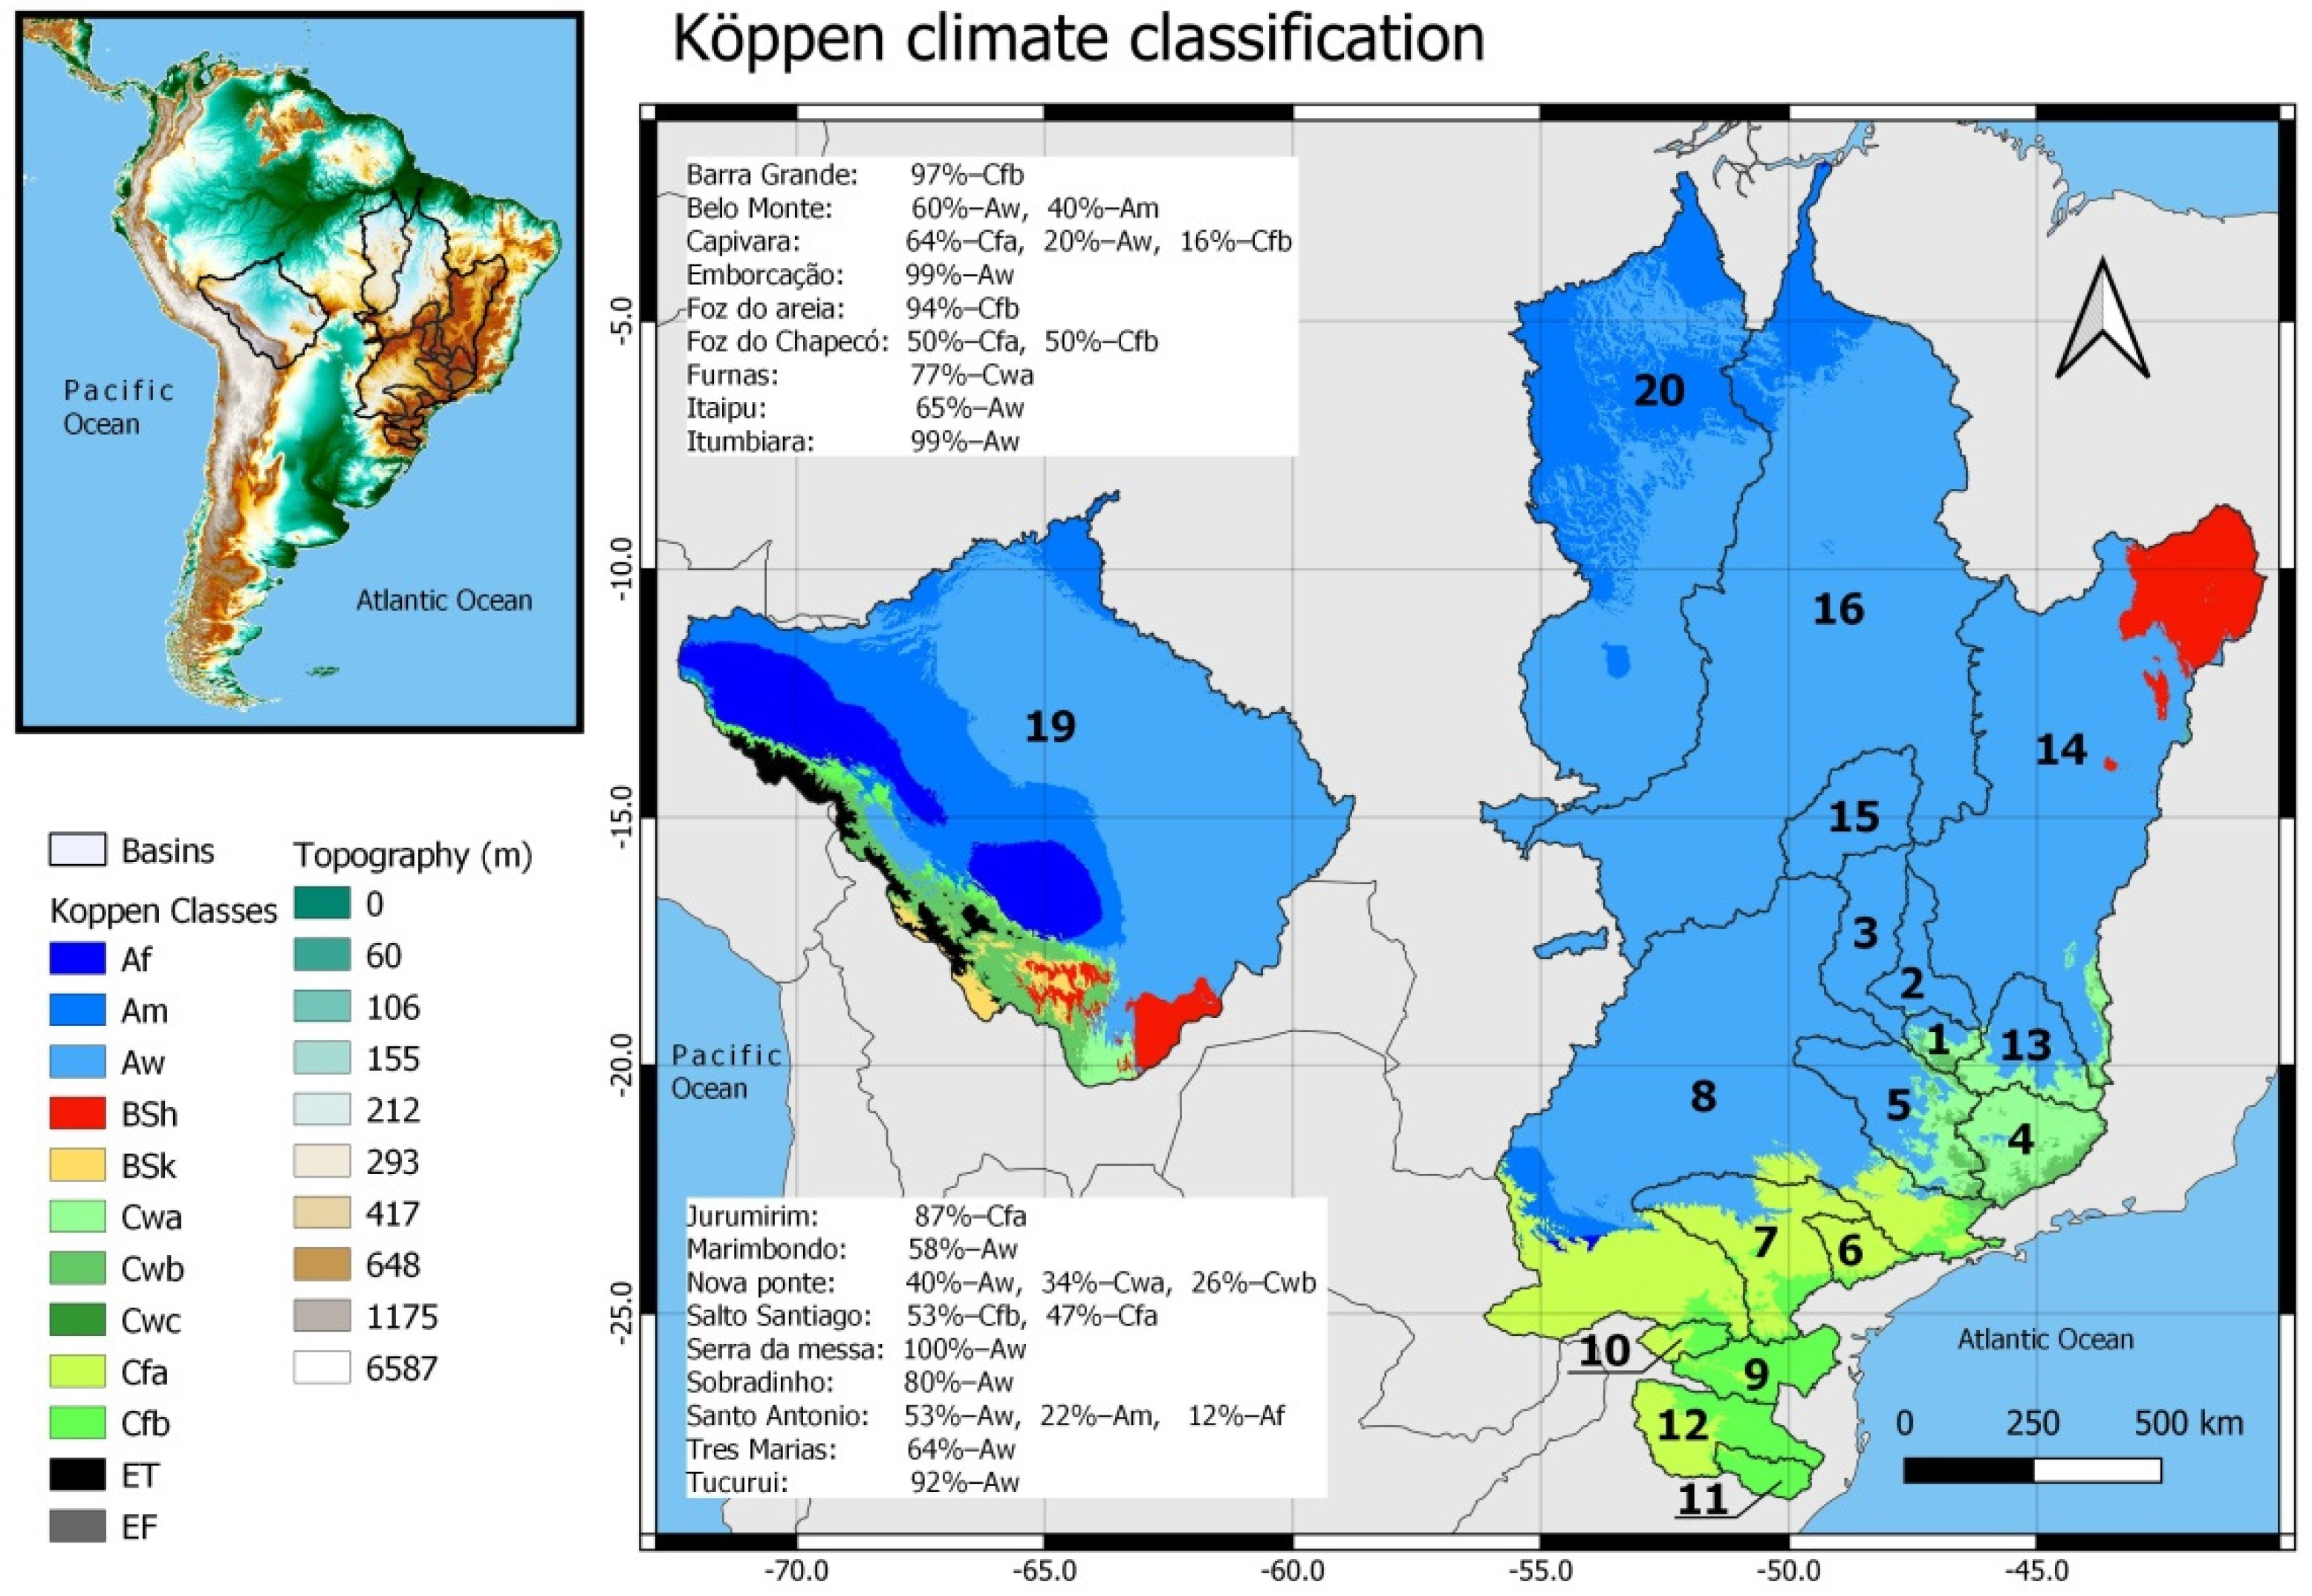
2.1. Study Area

The installed generation capacity of Brazil’s production and transmission energy system (SIN) is mostly composed of hydropower plants (HPP) distributed over 16 hydrographic basins in diverse regions of the country. The power grid is divided into four subsystems: South (S), Southeast/Mid-West (SE/MW), Northeast (NE), and North (N). The largest installed capacity for hydroelectric generation is in the SE/MW subsystem, with about 54%, followed by the N subsystem with 20%, 16% in the S, and 10% in the NE. Energy is transferred among all of the subsystems via an interconnected transmission grid, which improves the subsystems’ synergy and seizes the heterogeneity of the basins’ year-long hydrological regimes (http://www.ons.org.br/paginas/sobre-o-sin/o-que-e-o-sin, accessed on 9 December 2021).
In this study, droughts were assessed in 20 priority basins and sub-basins upstream of HPP reservoirs across Brazil (Figure 1). The basins and their HPPs are described in Table 1.
The climate types in the study basins (Figure 1) are primarily tropical (A) and temperate (C), according to the Köppen–Geiger climate classification [52]. Tropical Savannah (Aw) with Tcold ≥ 18 °C (temperature of the coldest month) and Pdry < 100 mm—MAP/25 (Pdry: Precipitation of the driest month, MAP: Mean annual precipitation) is prevalent in 13 basins, ranging from 40% to 100%: Nova Ponte (B1)—40%; Santo Antonio (B19)—53%; Marimbondo (B5)—58%; Belo Monte (B20)—60%; Três Marias (B13)—64%; Itaipu (B8)—65%; Sobradinho (B14)—80%; Tucurui (B16)—92%; Emborcação (B2) and Itumbiara (B3)—99%; Serra da Mesa (B15), Manso (B17), and Ponte de Pedra (B18)—100% (Figure 1). The prevalent climate of Furnas basin (B4) is Cwa—77% (temperate dry winter and hot summer), with Pwdry < Pswet/10 (Pwdry: Precipitation of the driest month in winter and Pswet: Precipitation of the wettest month in summer) and Thot ≥ 22 °C (temperature of the hottest month). These basins are located in the SE, MW, N, and NE regions of Brazil. The rainy season in these basins occurs throughout November to March (NDJFM), and the largest volumes of rainfall occur during the December, January, and February (DJF) trimester (Figure 2), accounting for approximately 49% of annual precipitation. The month of October is considered a transition between the dry and rainy seasons, but for many purposes, it is included among the rainy months. The Jurumirim (B6) and Capivara (B7) climate is Cfa (temperate without a dry season and hot summer). However, these basins are located in the SE region of Brazil and have the same rainy season as the previously described basins, but the dry season is not as severe. In the South region, the Foz do Areia (B9) and Barra Grande (B11) prevailing climate is Cfb (temperate without the dry season and warm summer), with Tmon10 ≥ 4 (Tmon10: Number of months where the temperature is above 10 °C). Salto Santiago (B10) and Foz do Chapecó (B12) have Cfa and Cfb climates (53–47% and 50–50%, respectively). There is no dry season in the southern basins. However, the DJF trimester accounts for approximately 30% of annual precipitation (Figure 2). The Sobradinho (B14) basin is primarily located in the Northeast region, with about 20% of the area as the BSh climate (arid steppe hot), with MAP ≥ 5x P-threshold (P-threshold = 2 × MAT + 28) and MAT ≥ 18 °C (MAT: mean annual temperature), indicating a strong dry season (Figure 2).

2.2. Datasets

In this study, we used both the in situ and gridded data to characterize hydrological droughts in 20 basins affluent to hydropower plants. Additionally, we used land use land cover (LULC) data to assess changes in the basins. The study period was from January 1981 to April 2021.

2.2.1. Precipitation Data

Due to the lack of in situ precipitation data from some study basins, the daily rainfall dataset from the climate hazards group infrared precipitation with stations, CHIRPS-2.0 was used (0.05° spatial resolution; https://data.chc.ucsb.edu/products/CHIRPS-2.0/, accessed on 20 May 2021). Studies to validate the dataset for some Brazilian regions [24,53,54,55] concluded that the dataset performed well in most of the regions. Nonetheless, the performance of CHIRPS-2.0 monthly data was evaluated across three of the 20 examined basins. We used data from 14 (7 from INMET and 7 from ANA), 66 (8 from INMET, 11 from ANA, and 46 from CEMADEN), and 32 (12 from INMET and 20 from CEMADEN) rainfall stations over the basins of the HPPs Serra da Mesa, Furnas, and Três Marias, respectively. Data from CHIRPS-2.0 explain over 98% of the monthly average rainfall station data (Figure 3).

2.2.2. Standardized Precipitation Evapotranspiration Index (SPEI) Data

In some of the studied basins, there is a lack of extensive and consistent meteorological data to estimate the potential evapotranspiration. To overcome this lack of data, the SPEI global drought monitor dataset was used [14]. The dataset has a monthly temporal resolution and 1° spatial resolution. The SPEI time scales range from 1 to 48 months and are available at https://spei.csic.es/database.html (accessed on 23 May 2021).

2.2.3. Streamflow Data

The streamflow data were obtained from the national electrical system operator (ONS) and the national water and sanitation agency (ANA) (https://www.ana.gov.br/sar/sin, accessed on 11 April 2021). We used the naturalized streamflow from 20 sub-basins for each HPP (Figure 1). There is no standard definition of naturalized streamflow [56]. However, according to Wubs [57]: “Naturalized streamflow refers to an estimation of the natural flow under specified conditions of river basin development that include either no human impact or some defined low level of development”.
Due to the complexity of considering water use changes and climate change [56], the “natural streamflow” has become a baseline for water resources studies.

2.2.4. Reservoir and Power Generation Data

Hydropower reservoir storage data were obtained from the Brazilian electricity grid operator (ONS) and the national water and sanitation agency (ANA) (available at https://www.ana.gov.br/sar/sin, accessed on 11 April 2021). Particularly for these data, the period available was from 1993 to 2021. Electricity generation data were obtained from the Brazilian electricity grid operator and the available period was from 2000 to 2021.

2.2.5. Land Use Land Cover Data

Although we considered natural flows in this study, an estimation of land use changes was conducted, to assess the impact on water availability in the studied basins. Since the MapBiomas collection (MapBiomas Project, 2021—available at https://mapbiomas.org, accessed on 11 April 2021) has the longest time-series available and has been widely used in various researches [58,59,60,61], it was chosen as the LULC data. This dataset includes annual data for Brazil (1985–2019), PanAmazônia (1985–2018), and Chaco (1900–2019) in a 30-m spatial resolution.

2.3. Hydrometeorological Drought Indices

Hydrological droughts are related to the water deficit in the hydrological system, which is perceived through considerable negative anomalies in the flow of rivers, levels of lakes and reservoirs, and groundwater [9]. Although the SPI is the widely used drought indicator, additional information is required when the goal consists of water resources [9]. Therefore, precipitation, evapotranspiration, and streamflow are crucial variables in monitoring and assessing droughts. In this context, we used three hydrometeorological indices to assess and identify the most severe hydrological drought events in 20 priority basins for hydropower generation in Brazil: SPI, SPEI, and SSFI, at time scales of 12, 24, 36, and 48 months. These temporal scales are significant in the context of hydrological droughts [13].

2.3.1. Standardized Precipitation Index (SPI)

The standardized precipitation index identifies and quantifies dry and wet events [16]. Due to the fact that it is a standardized index, it can be used for any climate region in the world [62]. The long-term precipitation record is fitted to a probability distribution, and then transformed to a normal distribution. Positive values indicate wet conditions, while negative values indicate dry conditions. The fact that SPI can be calculated for different time scales (e.g., 1, 3, 12, 24 months, etc.) allows for the tracking of the temporal dynamics of these events, i.e., the increase and decrease of the water deficit [63]. Therefore, the longer multiscale time-series of SPI (12, 24, 36, 48 months) have been used to quantify the accumulated precipitation deficit in the study basins from January 1981 to March 2021. The chosen time scale can indicate the response time of meteorological to hydrological drought. SPI was calculated using monthly rainfall data.

2.3.2. Standardized Precipitation Evapotranspiration Index (SPEI)

The SPI is the widely used drought indicator, due to its relatively easy application. However, for water resources management, additional information is required [9]. Since heat stress increases the amount of water lost through evapotranspiration, this aggravates drought conditions [17,64]. Vicente-Serrano et al. [8] proposed the standardized precipitation evapotranspiration index (SPEI) to include the role of temperature on drought conditions in a region. The SPEI is calculated similar to the SPI, using the difference between precipitation and potential evapotranspiration, which is a simple climatic water balance [65].

2.3.3. Standardized Streamflow Index (SSFI)

The SSFI, proposed by Modarres [18], is used to detect hydrological drought at various time scales, similar to the SPI. It is the standard deviation of the observation from the climatological average. Therefore, the negative values represent the streamflow below the climatological average, and the positive values indicate the streamflow above the historical average. The SSFI was estimated at time scales of 12, 24, 36, and 48 months.
Both the SPI and SSFI were estimated using the climate indices software developed at the national integrated drought information system and the NOAA national center for environmental information. Adams (2017) provided the most recent version at (https://climate-indices.readthedocs.io/en/latest/#download-the-code, accessed on 1 September 2020).

2.3.4. Drought Characterization

In this study, we consider the same drought categories for the SPI used by Cunha et al. [36]. The same drought categories were also used for SPEI and SSFI. To define the drought events, the methodology proposed by Spinoni et al. [66] was adapted. We used SPI, SPEI, and SSFI values of less than −1.3 (from severe to exceptional drought) for two consecutive months to define severe drought events. Thereafter, the drought event ends with two successive positive values of SPI, SPEI, and SSFI. The monthly values for each indicator were accumulated from the onset to the end month of the drought event by the sum of the indices values to determine the drought severity.
Frequency analysis was performed to assess the temporal patterns and intensity of droughts in the four decades of the study period. The SPI, SPEI, and SSFI values of less than −1.3, severe to exceptional drought, were considered for each decade (1981–1990, 1991–2000, 2001–2010, and 2011–2021). Moreover, correlations were calculated to assess the linear relationship between the indices and their scales and interdependencies. The Mann–Kendall test is a widely used non-parametric trend analysis method that requires uncorrelated time-series (Mann, 1945 and Kendall, 1975 cited by [67]). Using these methods, we looked for positive (upward) or negative (downward) indicators of time-series trends with a significance level of 0.05.

3. Results and Discussion

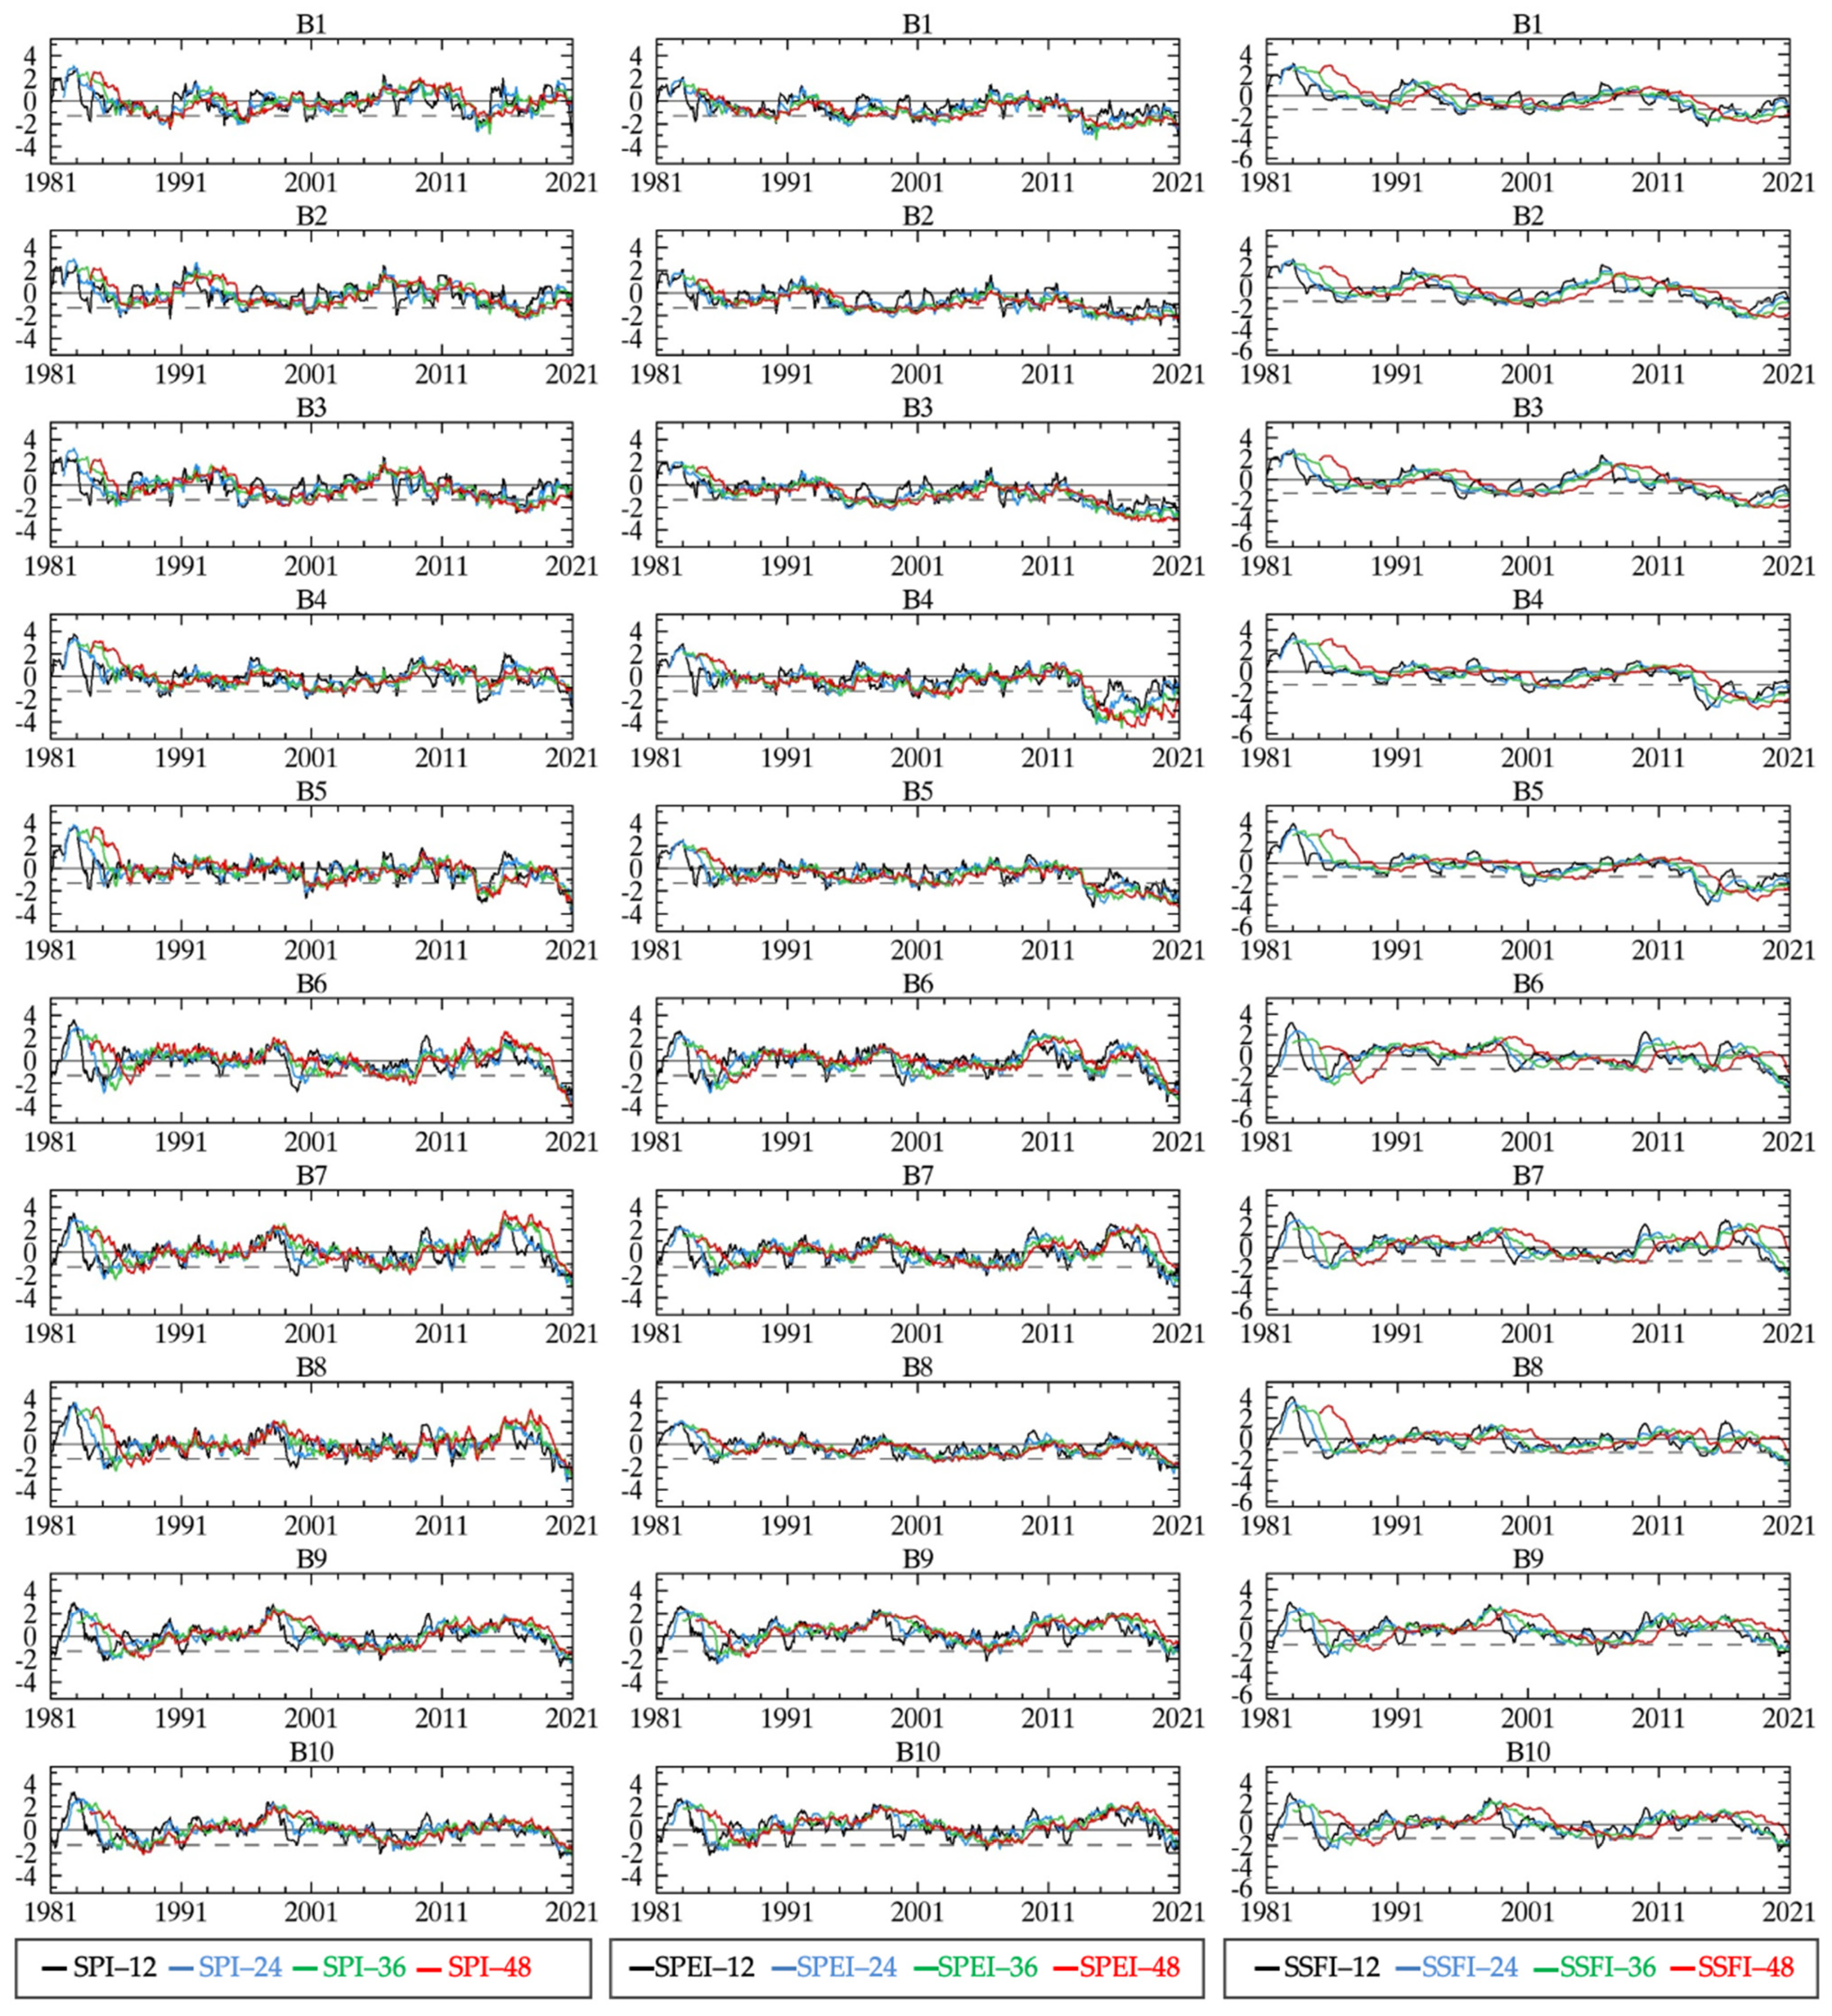
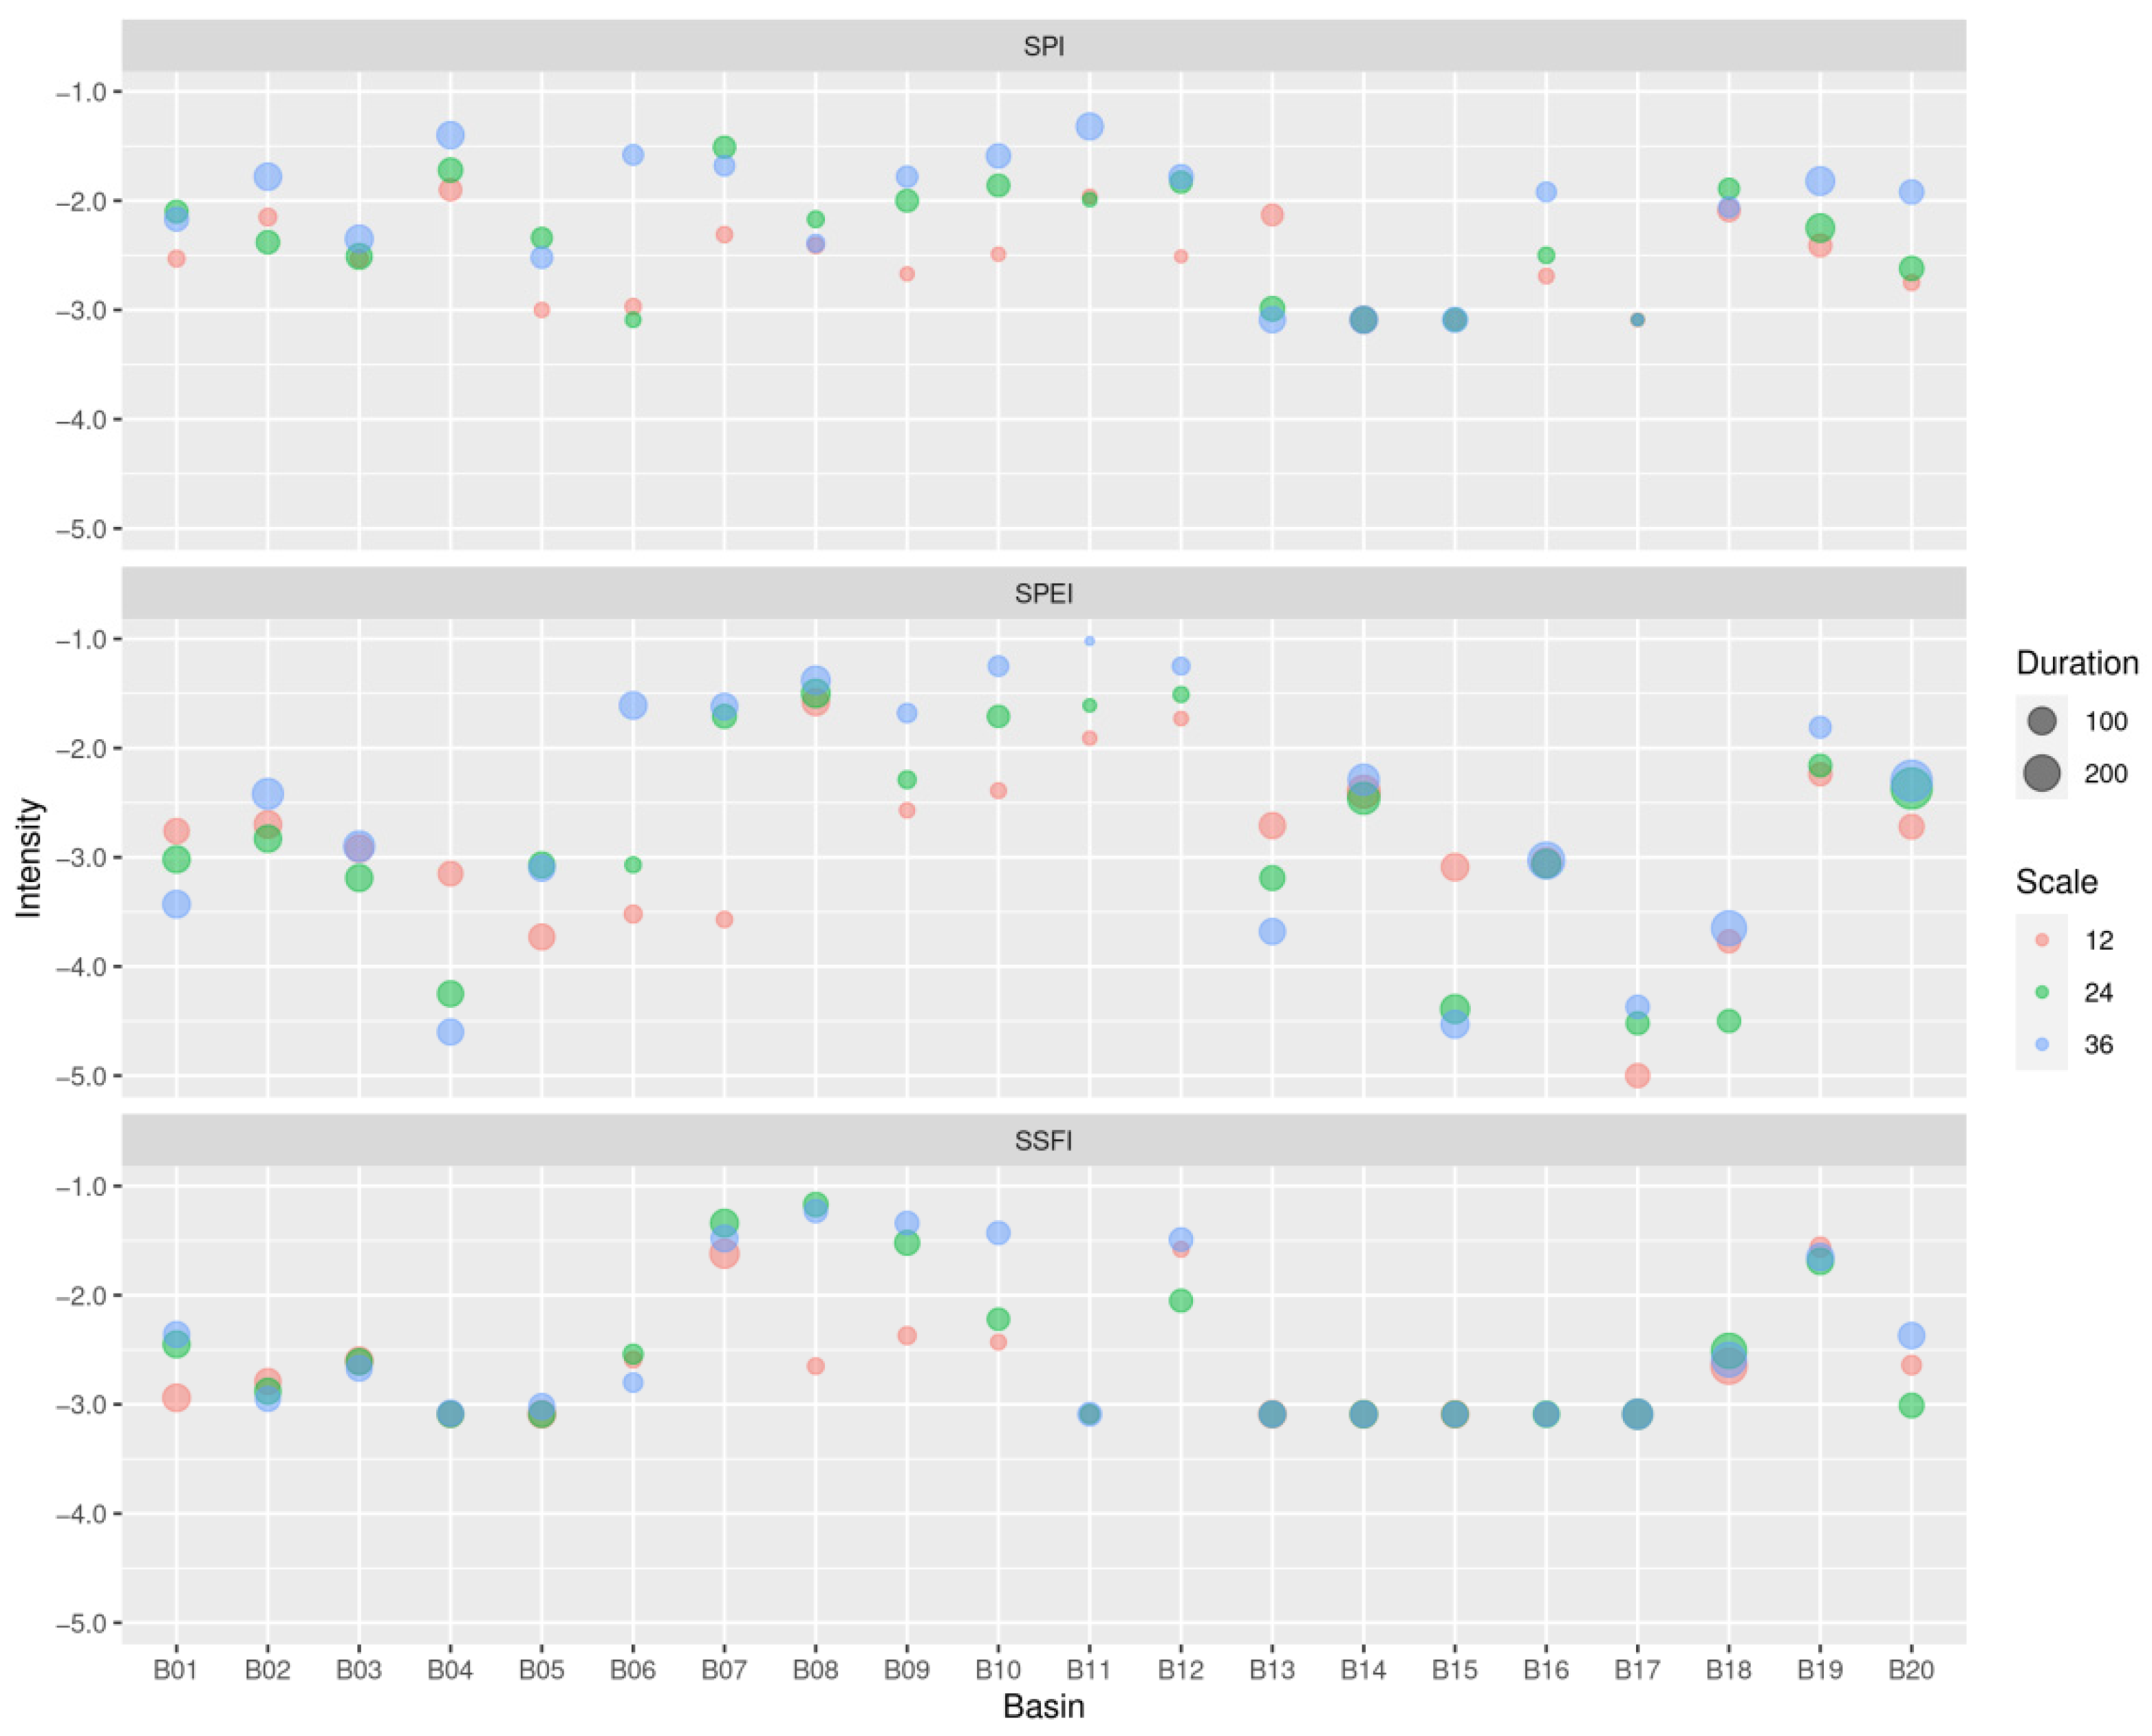
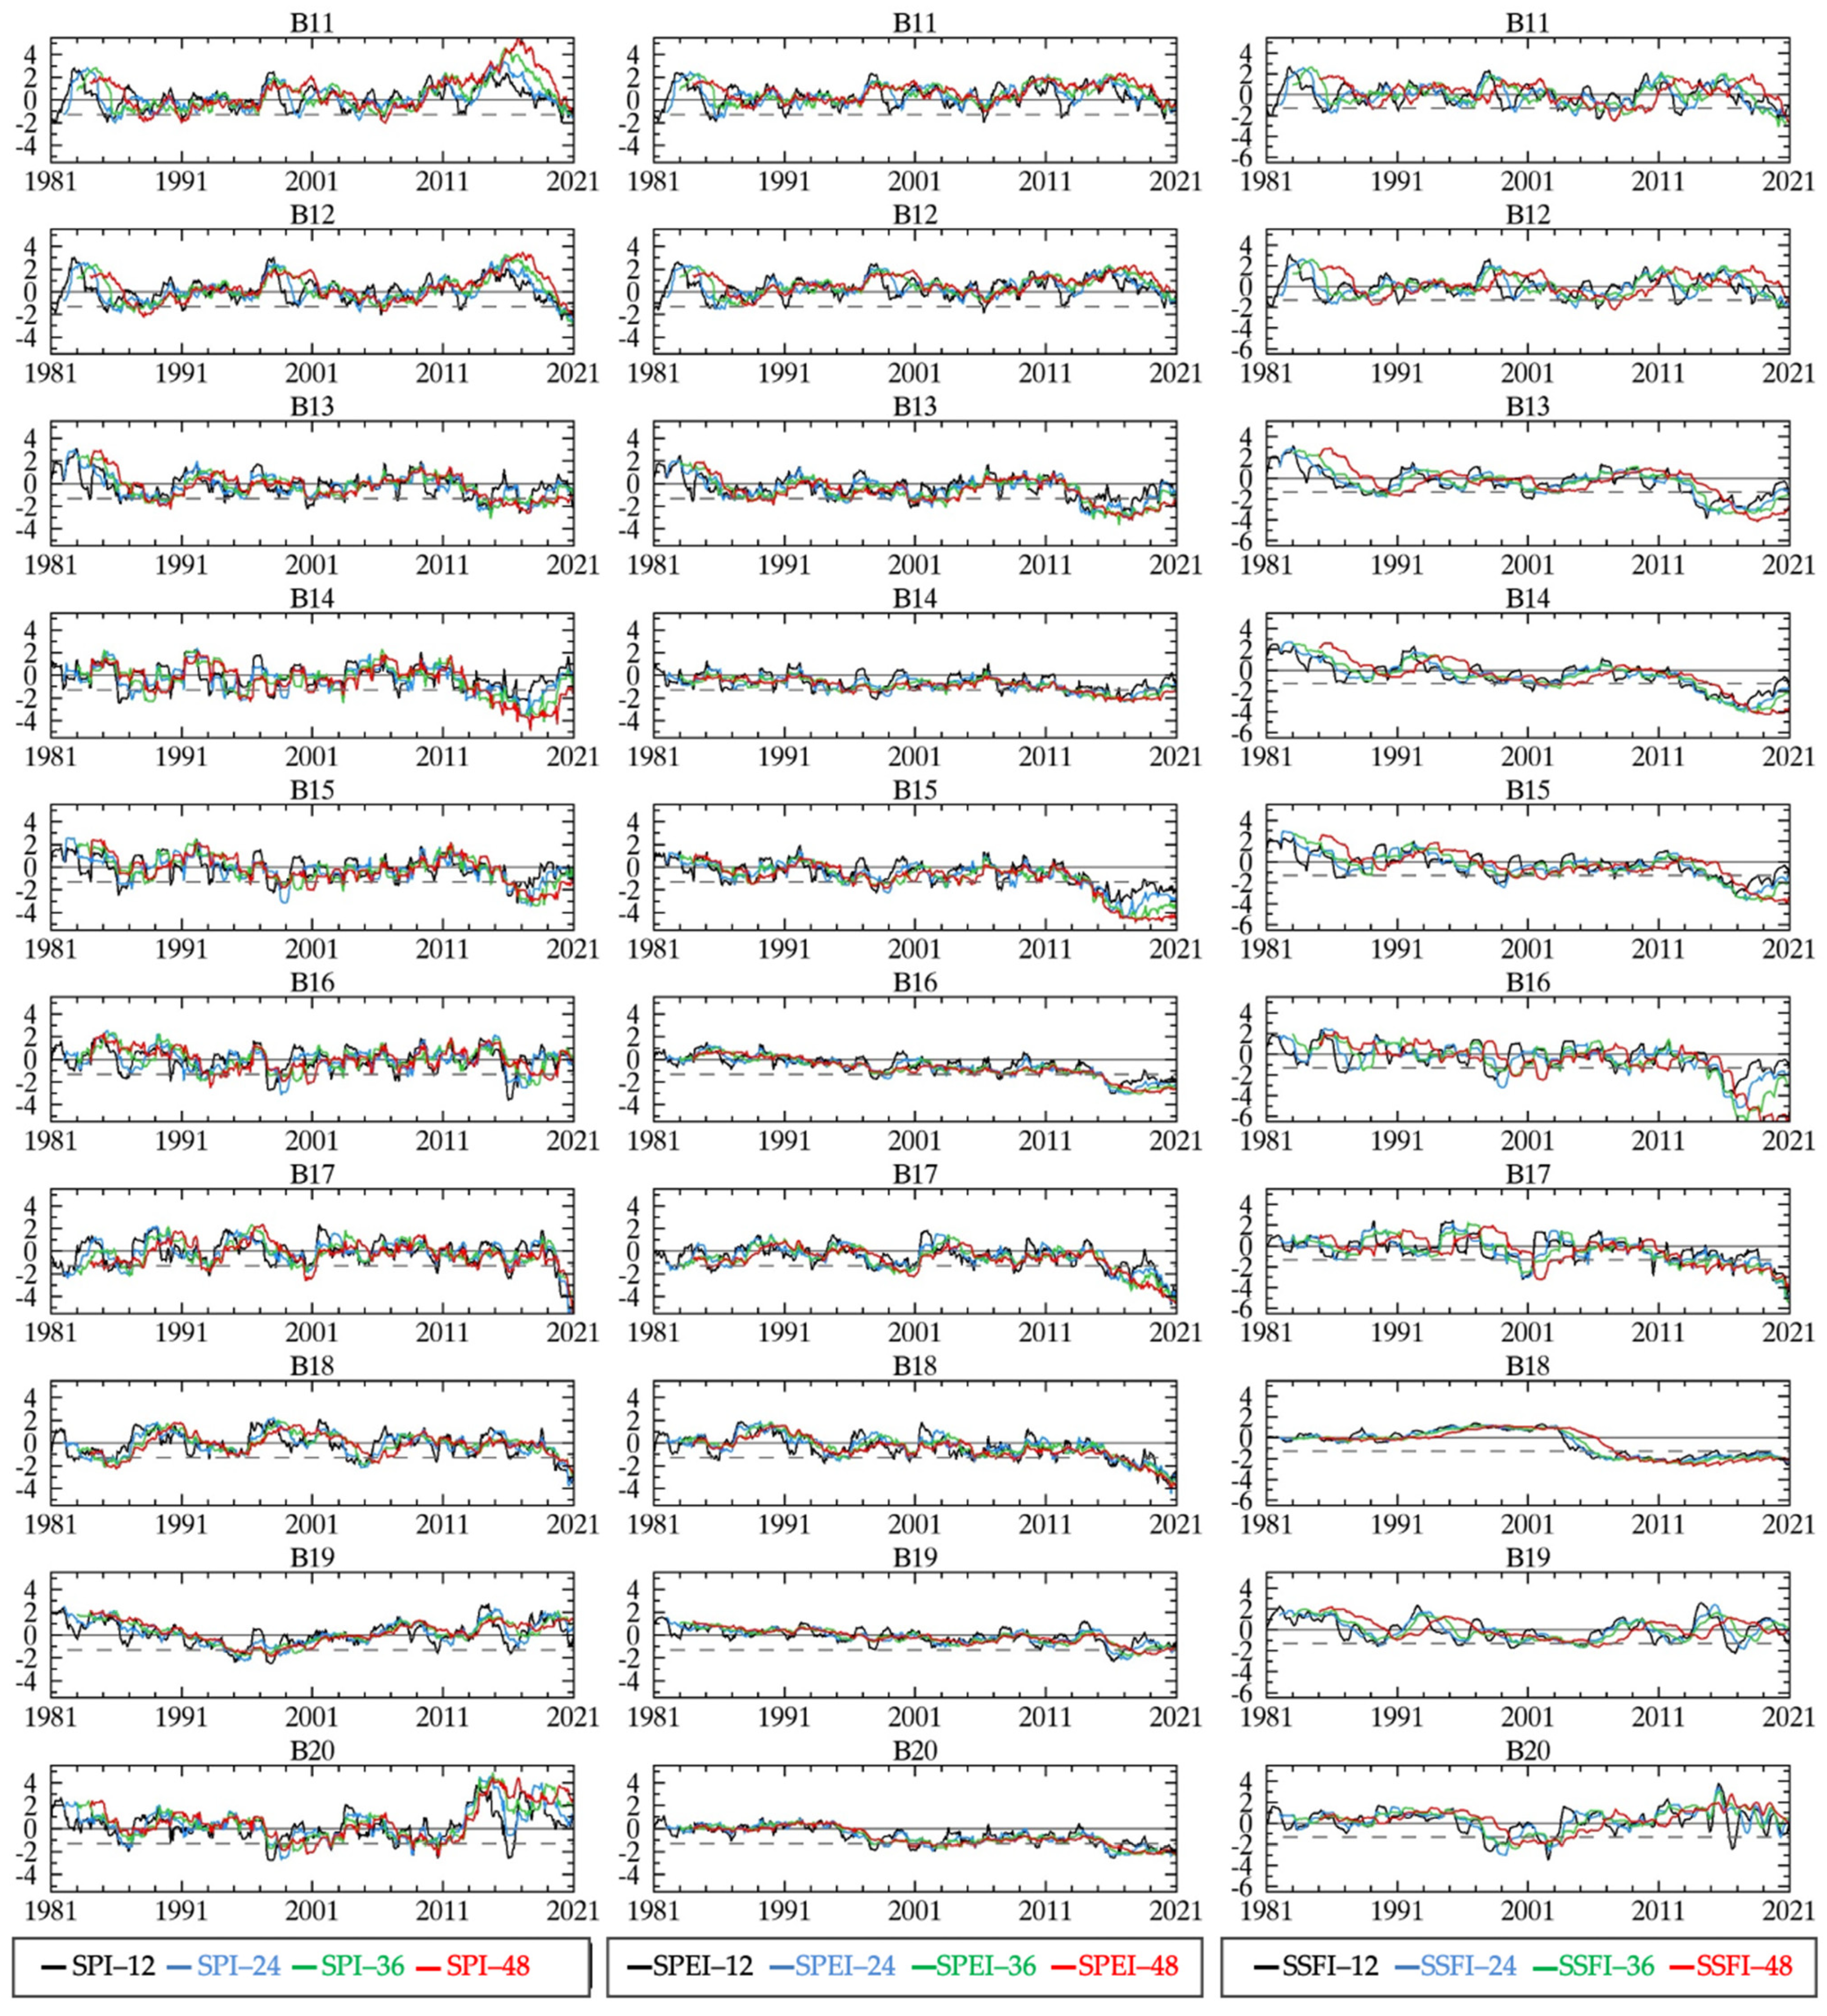
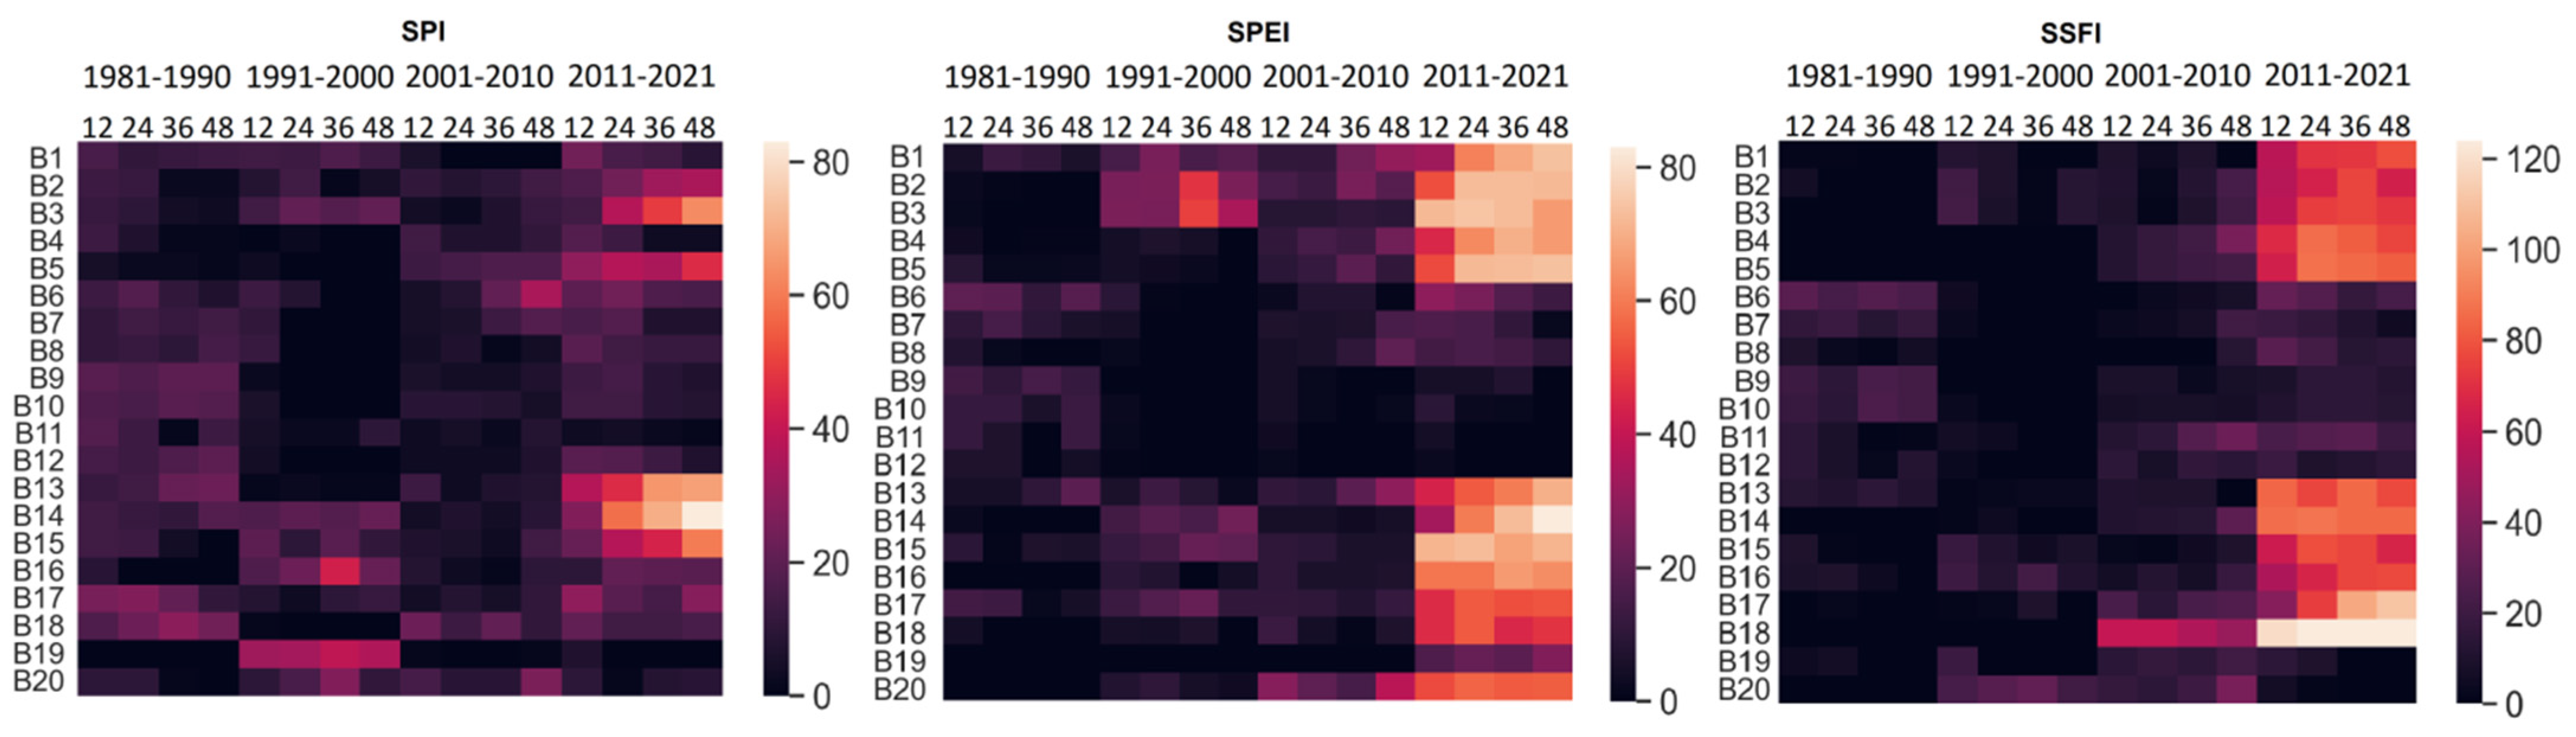
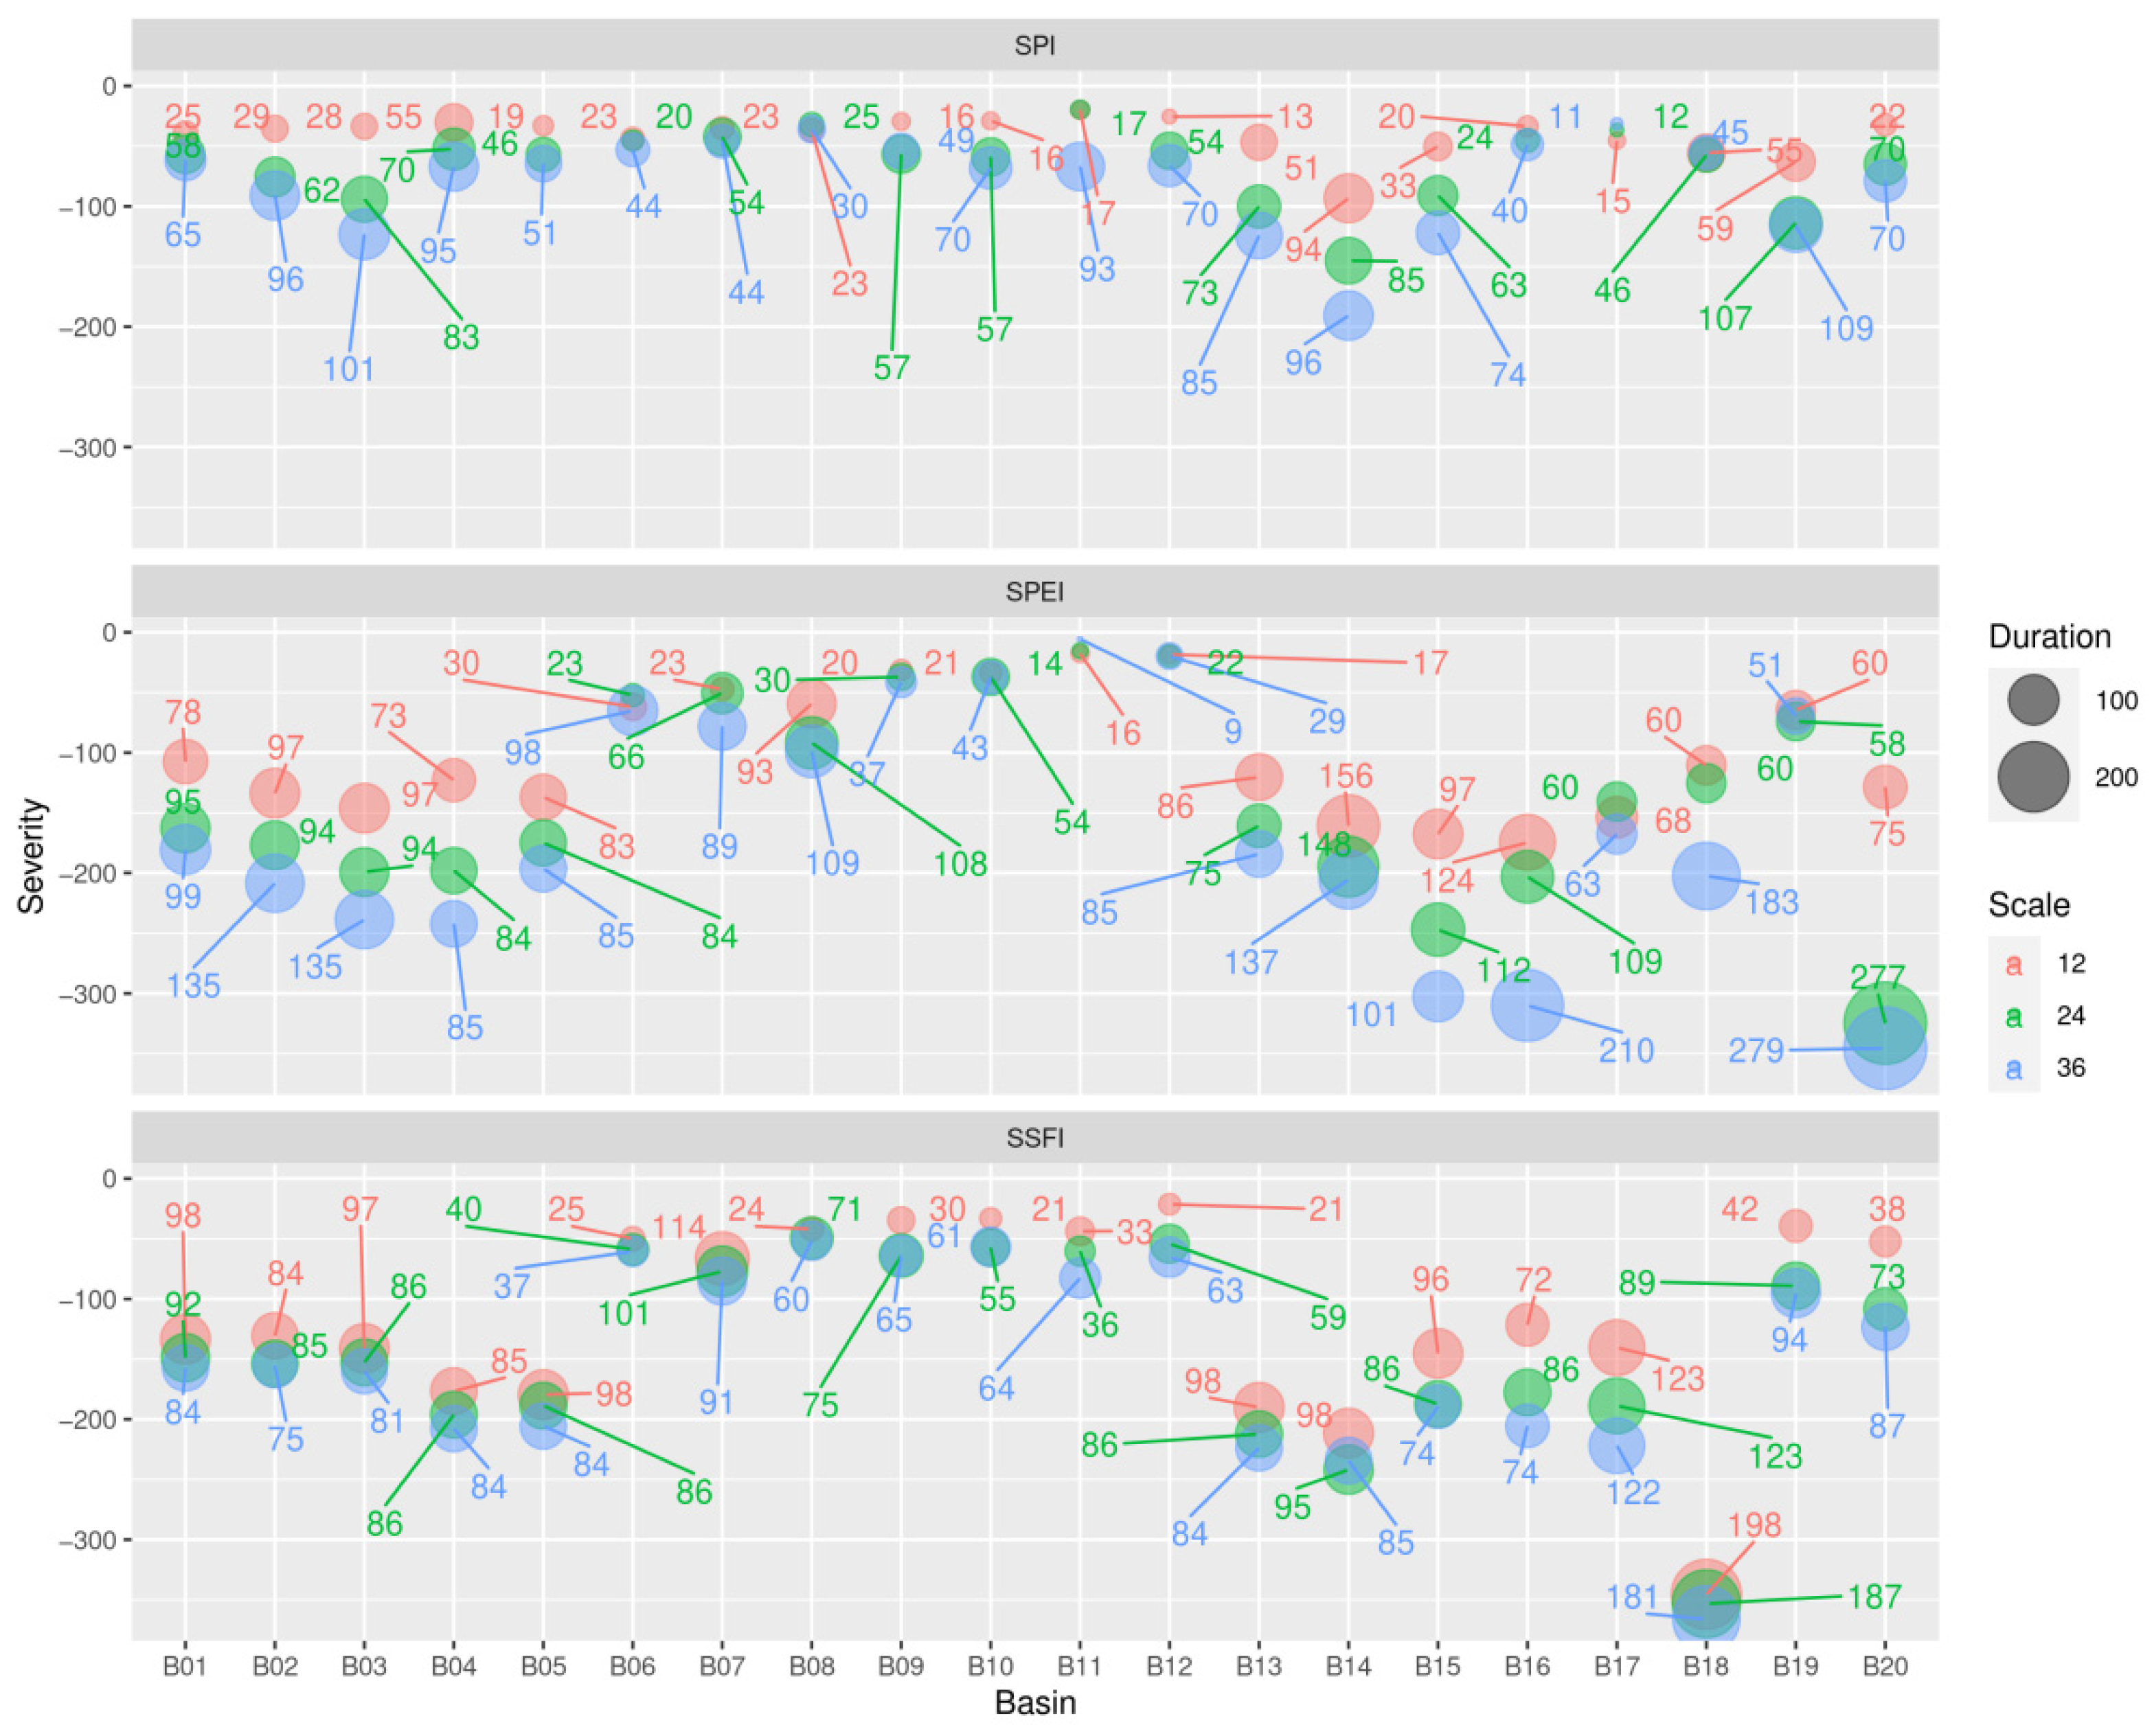
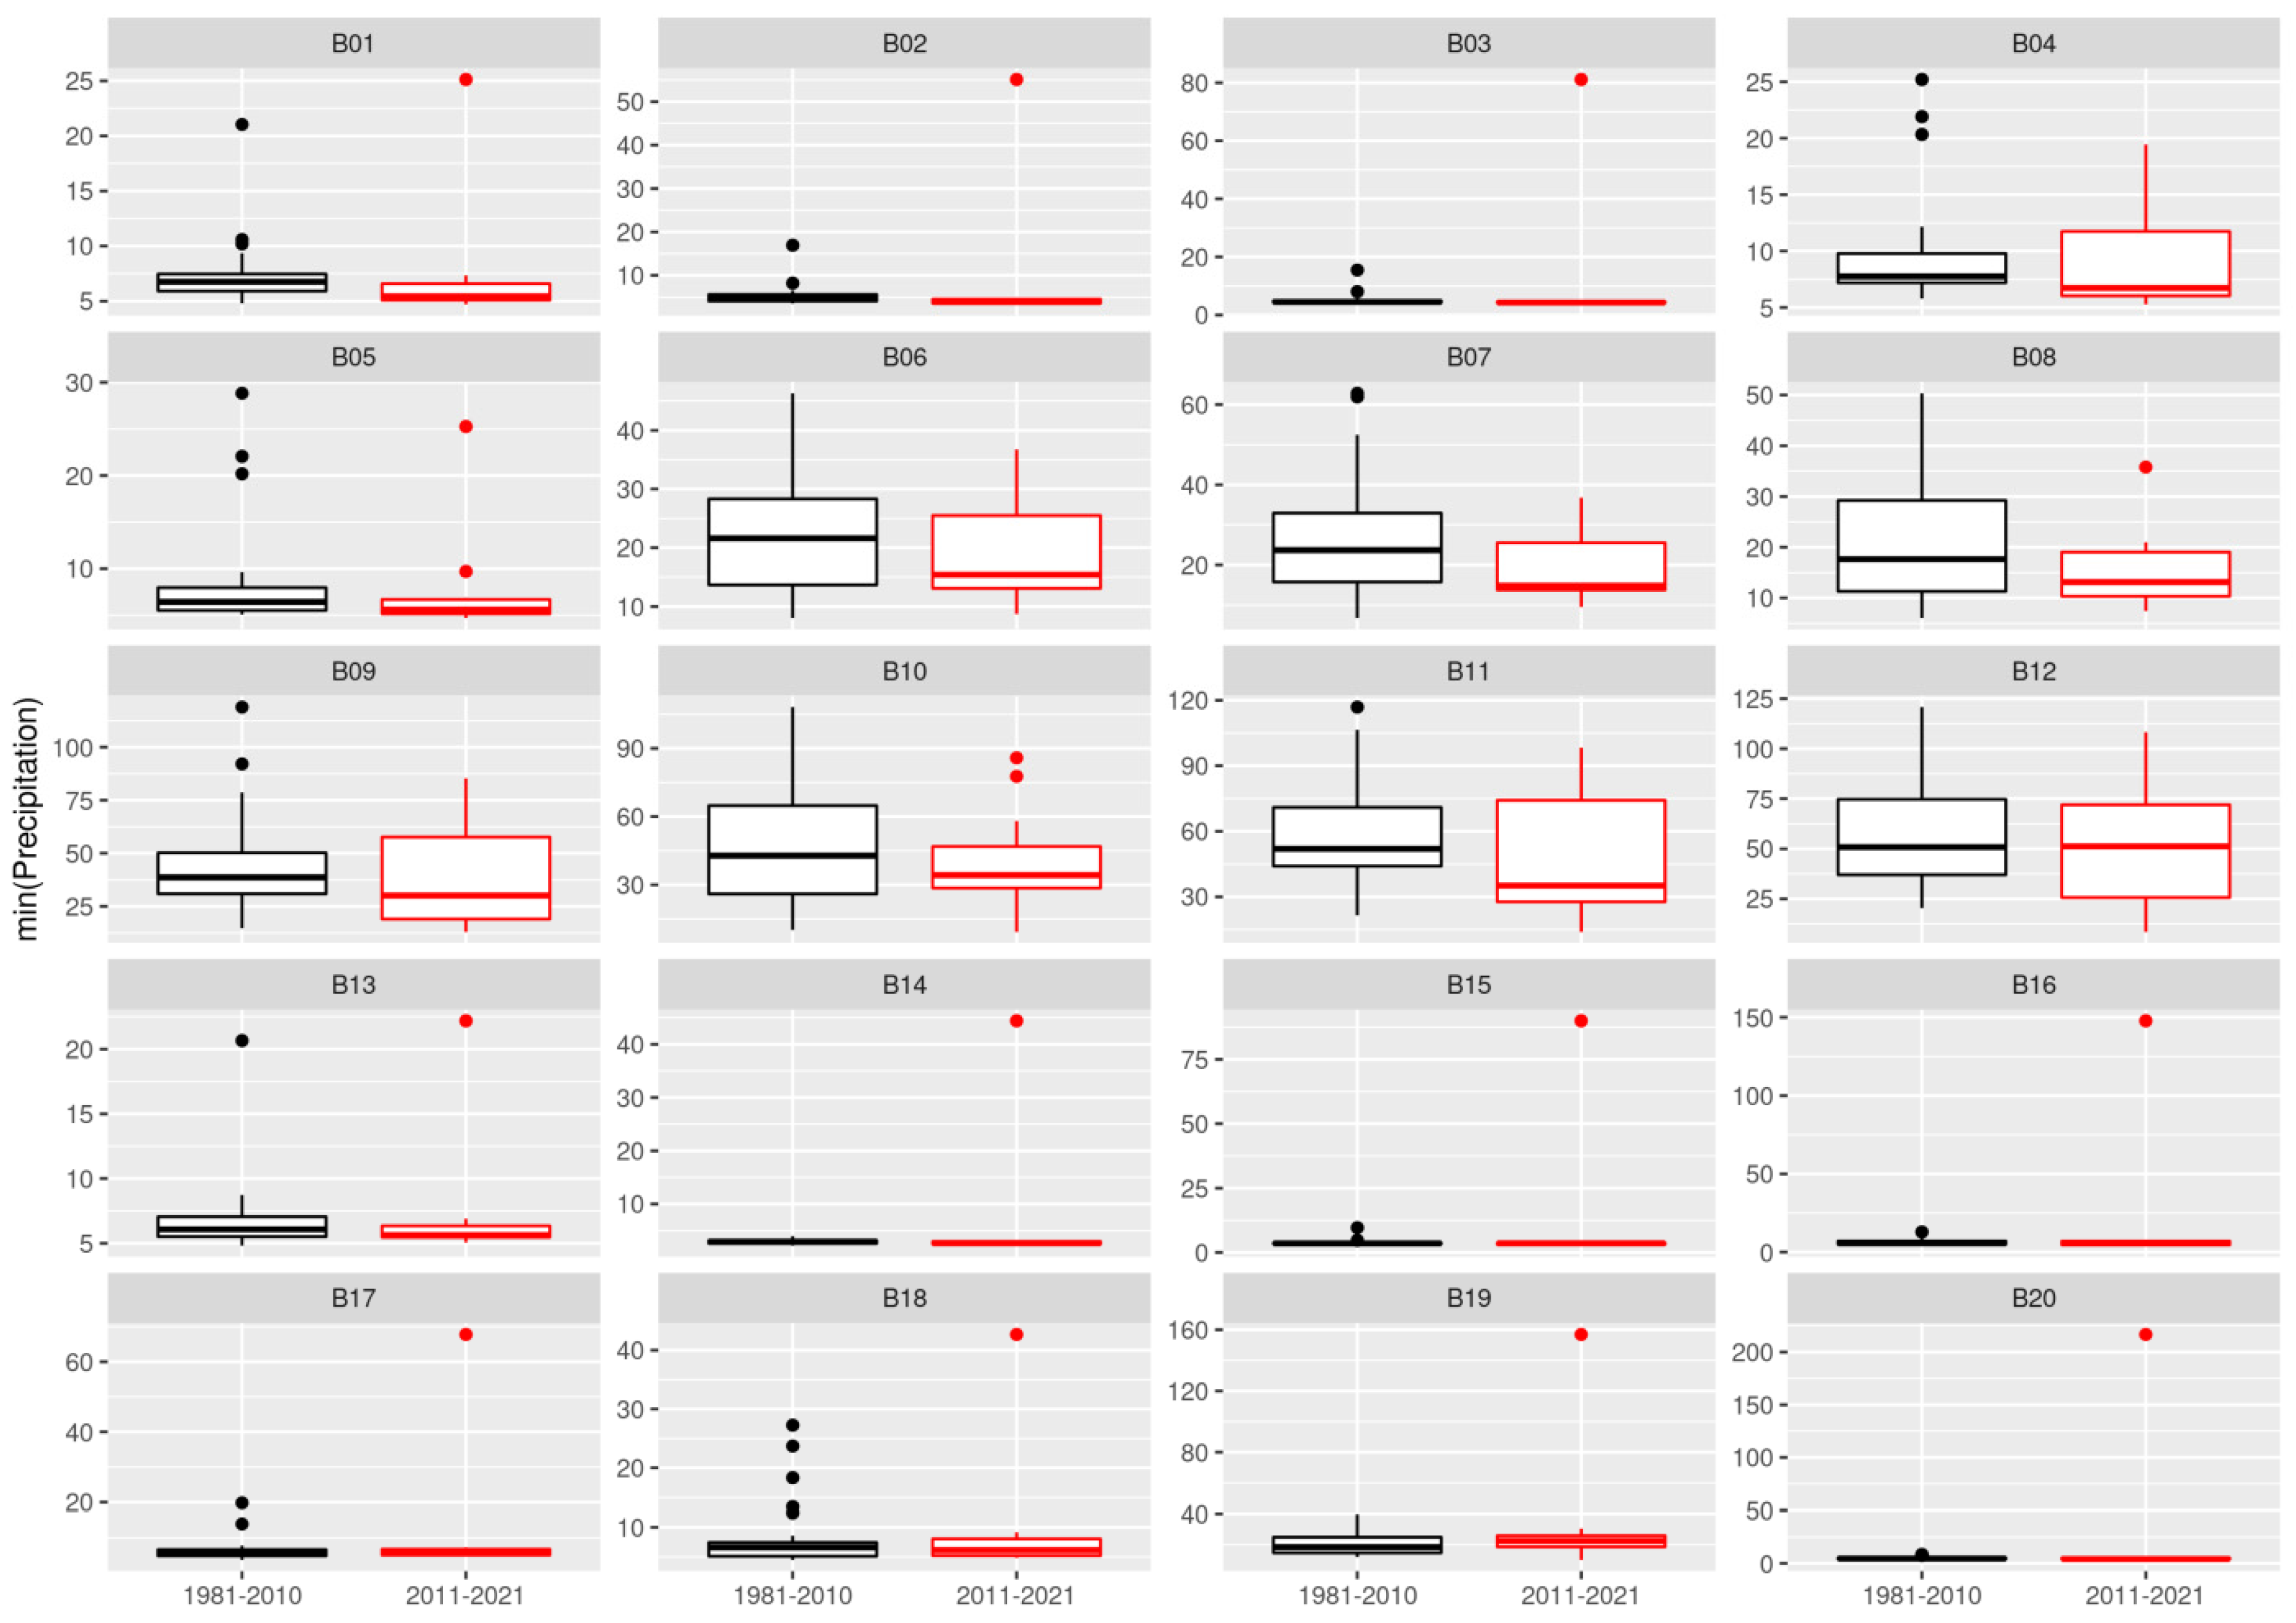
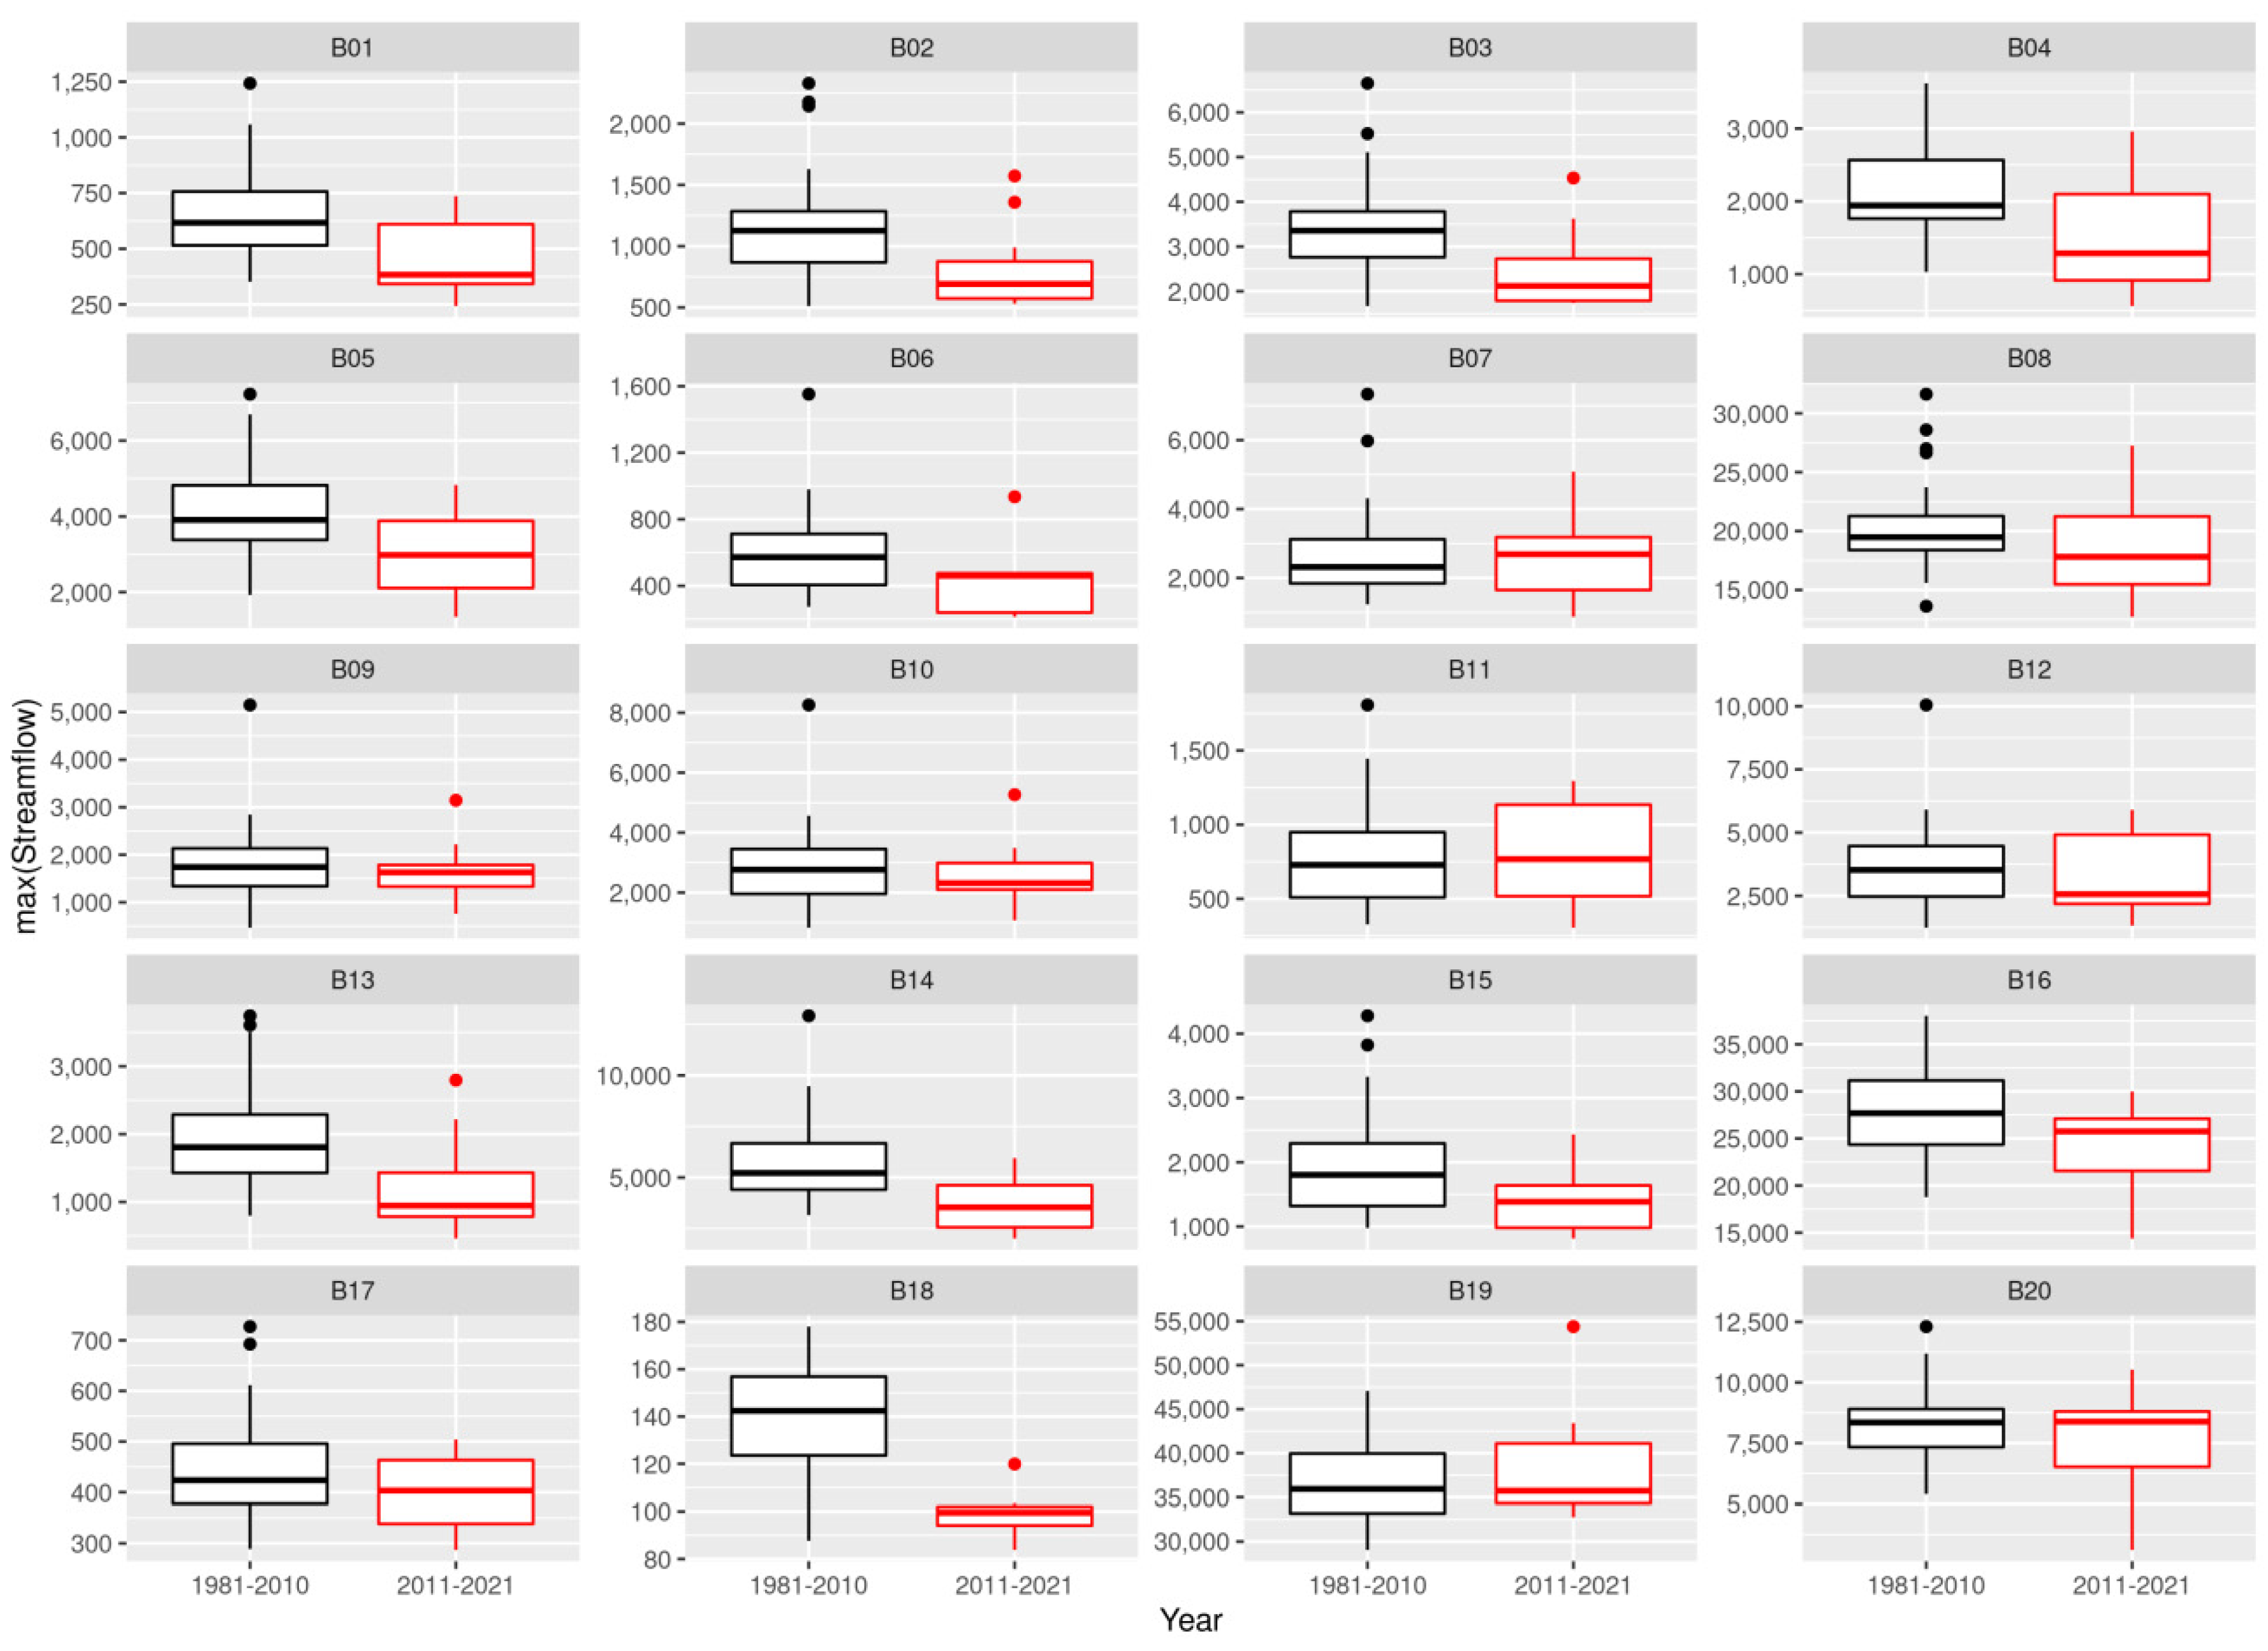
3.1. Temporal Evaluation and Drought Characterization

Figure 4 illustrates the variability of the SPI, SPEI, and SSFI at four scales by basins from 1981 to 2021. The SPI time-series (1981–2021) show the abnormally low precipitations since 2014, for all of the scales, in the basins located in the Southeast and Mid-West regions of Brazil (Figure 4): Nova Ponte (B1), Emborcação (B2), Itumbiara (B3), Furnas (B4), Marimbondo (B5), Três Marias (B13), and Serra da Mesa (B15). HPPs Tucuri (Mid-West and North) and Sobradinho (Northeast) have also been impacted since 2014 (Figure 4). Since late 2019, the basins in the southern of Mid-West and South regions have been facing low precipitation, as well: Manso (B17), Ponte de Pedra (B18), Jurumirim (B6), Capivara (B7), Foz do Areia (B9), and Salto Santiago (B10). These results are corroborated by the studies of Cunha et al. (2019) and Valesca et al. (2021). Cunha et al. (2019) reported meteorological droughts that occurred in all of the Brazilian regions over the last decades (until 2019), with varying intensities. Conversely, basins located in the southern of the Brazilian North region: Santo Antonio (B19—Madeira River) and Belo Monte (B20—Xingu River) show a wet period since 2014. This was not evident in Cunha et al. (2019) since they analyzed the North region as a whole.
The SPEI combines precipitation and potential evapotranspiration to include the temperature variability effects on drought assessment [8]. The effect of temperature was evident in most of the basins studied (B1–B8 and B13–B20), where the SPEI showed more severe and intense (SPEI ≤ −1.3) drought conditions in the last decade in the Southeast and Mid-West regions, compared with the SPI, and since 2019 in the South region. Vicente-Serrano et al. [8] showed that for a gauge station in Sao Paulo, Brazil, for the period 1910–2007, the SPI could not identify all of the drought events, while the SPEI could. The SSFI time-series show the same behavior as SPEI, except for basins B19 and B20 (Figure 4), for which it seems that precipitation has a more decisive influence than temperature.
Furthermore, since the SPEI considers the role of temperature in drought conditions and severity is the most suitable index for evaluating the impact of climate change [8,13,14,17], then calculating the SSFI from naturalized streamflow allows for the assessment of the change in the hydrological system due to both the climate regime and natural components. Recent work found significant increases in heatwave frequency, intensity, and duration in 2020 in the major cities of central South Brazil [68]. The authors argue that these heatwaves were part of a compound drought-heat detected in central Brazil.
The frequency analysis by decades showed that the last decade (2011–2021) recorded the highest recurrence of severe droughts (indices values ≤ −1.3) since 1981 (Figure 5) for all of the time scales (12, 24, 36, and 48 months). SPEI and SSFI detected higher frequencies of severe drought events than SPI, which is also supported by the analysis of severity and intensity shown in Figure 6 and Figure 7. Figure 6 illustrates the most severe events and their durations (labels next to the dots), and Figure 7 depicts the maximum intensity of the events indicated in Figure 6. Most of the severe droughts have occurred in the last decade, since 2011, including the most recent rainy season (October 2020–March 2021). For all of the indices, 36 and 48 month scales showed greater drought severity in all of the basins (Figure 6). This pattern is expected since longer time scales accumulate the water deficit effect over time. SPEI and SSFI detected more extreme drought severity than SPI. In comparison, severity peaks varied among the basins, according to the evaluated index. According to the SPI, basin B14 faced the most severe events at all of the scales (−88.2 from October 2012 to January 2020, −148.6 from March 2013 to 2020, −198.1 from October 2012 to September 2020, and −239.1 from October 2013 to March 2021, respectively), followed by B13 at 24-, 36-, and 48-month scales (−100.2 from January 2014 to 2020, −123.5 from March 2014 to 2021, and −130.0 from October 2014 to March 2021, respectively). According to SPEI, the most severe droughts occurred in basins B2, B14, B15, B16, and B20 on the 48 month scale (less than −300), with event durations of over 266 months. For SSFI, basin B18 had the most severe drought event (less than −300) for all of the scales, followed by basins B4, B5, B13, B14, B16, and B17 (severity between −200 and −300). Except for basin B20, the largest intensities are associated with the most severe drought events when SPEI and SSFI are considered (Figure 7).
We performed a cross-correlation analysis between the indices: SPI vs. SPEI; SPI vs. SSFI; and SPEI vs. SSFI, for all of the time scales. The indices correlations between the same scales (SPI12—SPEI12, SPI24—SPEI24, SPI36—SPEI36, etc.) were higher than for the cross-scales (SPI12—SPEI12, SPI12—SPEI24, SPI12—SPEI36, etc.). The results show a strong positive correlation (p ≥ 0.75) for SPI vs. SPEI, SPI vs. SSFI, and SPEI vs. SSFI for most of the basins at all of the time scales (Table S1). At all of the time scales, basins B1–13 and B15 showed the highest positive correlation between SPEI and SSFI, indicating the link between changes in water balance (P—PET) and discharge. As an illustration of one of these basins, consider the Capivara HPP (B7) results with correlations between SPEI and SSFI equal to 0.89, 0.94, 0.94, and 0.95 for the time scale of 12, 24, 36, and 48 months, respectively. For basins B4, B16, B17, and B19, a moderate positive correlation (0.50 < p < 0.75) was predominant. For B20, there was no correlation for all of the combinations (−0.30 < p < 0.30), except for SPI and SSFI at 36- and 48-month scales that show a moderate correlation.
The Mann−Kendall (MK) statistics for the time-series of SPI, SPEI, and SSFI represent the trends of dryness/wetness. For all of the indicators and time scales considered, the MK test revealed a statistically significant (p-value < 0.05) downward trend in basins B2, B3, B4, B5, B13, B14, and B15 (Table 2). The time-series of SPI36 and SPI48 have an upward trend in basins B7, B8, B9, B11, B12, B19, and B20. Basins B8 and B19 have a downward trend for both SPEI and SSFI, and B7 and B11 have a downward trend for SSFI. In 15 of the 20 basins studied, the SPEI time-series showed a significant downward trend in all of the time scales, possibly indicating an increase in temperatures, exacerbating drought conditions. Only basins B11 and B12 showed an upward trend, correlating with the SPI time-series. Most of the basins (15 of 20) had downward trends of the SSFI time-series across all of the time scales. Only the B20 has a statistically significant upward trend for SPI36 and SPI48 and SSFI over 24 to 48 months.
Based on the above results, the more intense and severe droughts occurred during the last decade. In this context, Figure 8 depicts the results of the months with minimum and maximum precipitation and streamflow values for each year (observations) for all of the basins (boxplots) investigated over two different periods: 1981–2010 and 2010–2021. Both the minimum and maximum precipitation and streamflow values show a decline trend over the time period for most of the basins. The median minimum precipitation values decreased towards the second period for all of the basins except for B12, B15, B17, and B19. The median maximum precipitation values decreased over the period 2011–2021 for all of the basins except for B01, B10, B11, B12, B16, B19, and B20 (Table S2 in the Supplementary Materials). The median minimum streamflow values decreased over the period 2011–2021 for all of the basins except for B07, B08, and B20. The median maximum streamflow values decreased over both time periods for all of the basins except for B07, B11, and B20 (Table S3 in the Supplementary Materials).
The largest increase of the minimum and maximum median precipitation occurred in B19 and B20, respectively, within the Amazon River basin. The largest increase of the minimum and maximum median streamflow occurred in B20 and B07, respectively, within the Amazon and Parana River basin. Instead, the largest decrease of the minimum and maximum median precipitation occurred in B07 and B18, respectively, within the Amazon River basin. The largest decrease of the minimum and maximum median streamflow occurred in B14 and B13, respectively, within the Amazon and Parana River basin. These results indicate that not a single spatial pattern of increase or decrease in both the precipitation and streamflow can be identified. However, the maximum decrease for both variables was larger than the maximum increase, supporting an overall decreasing trend.

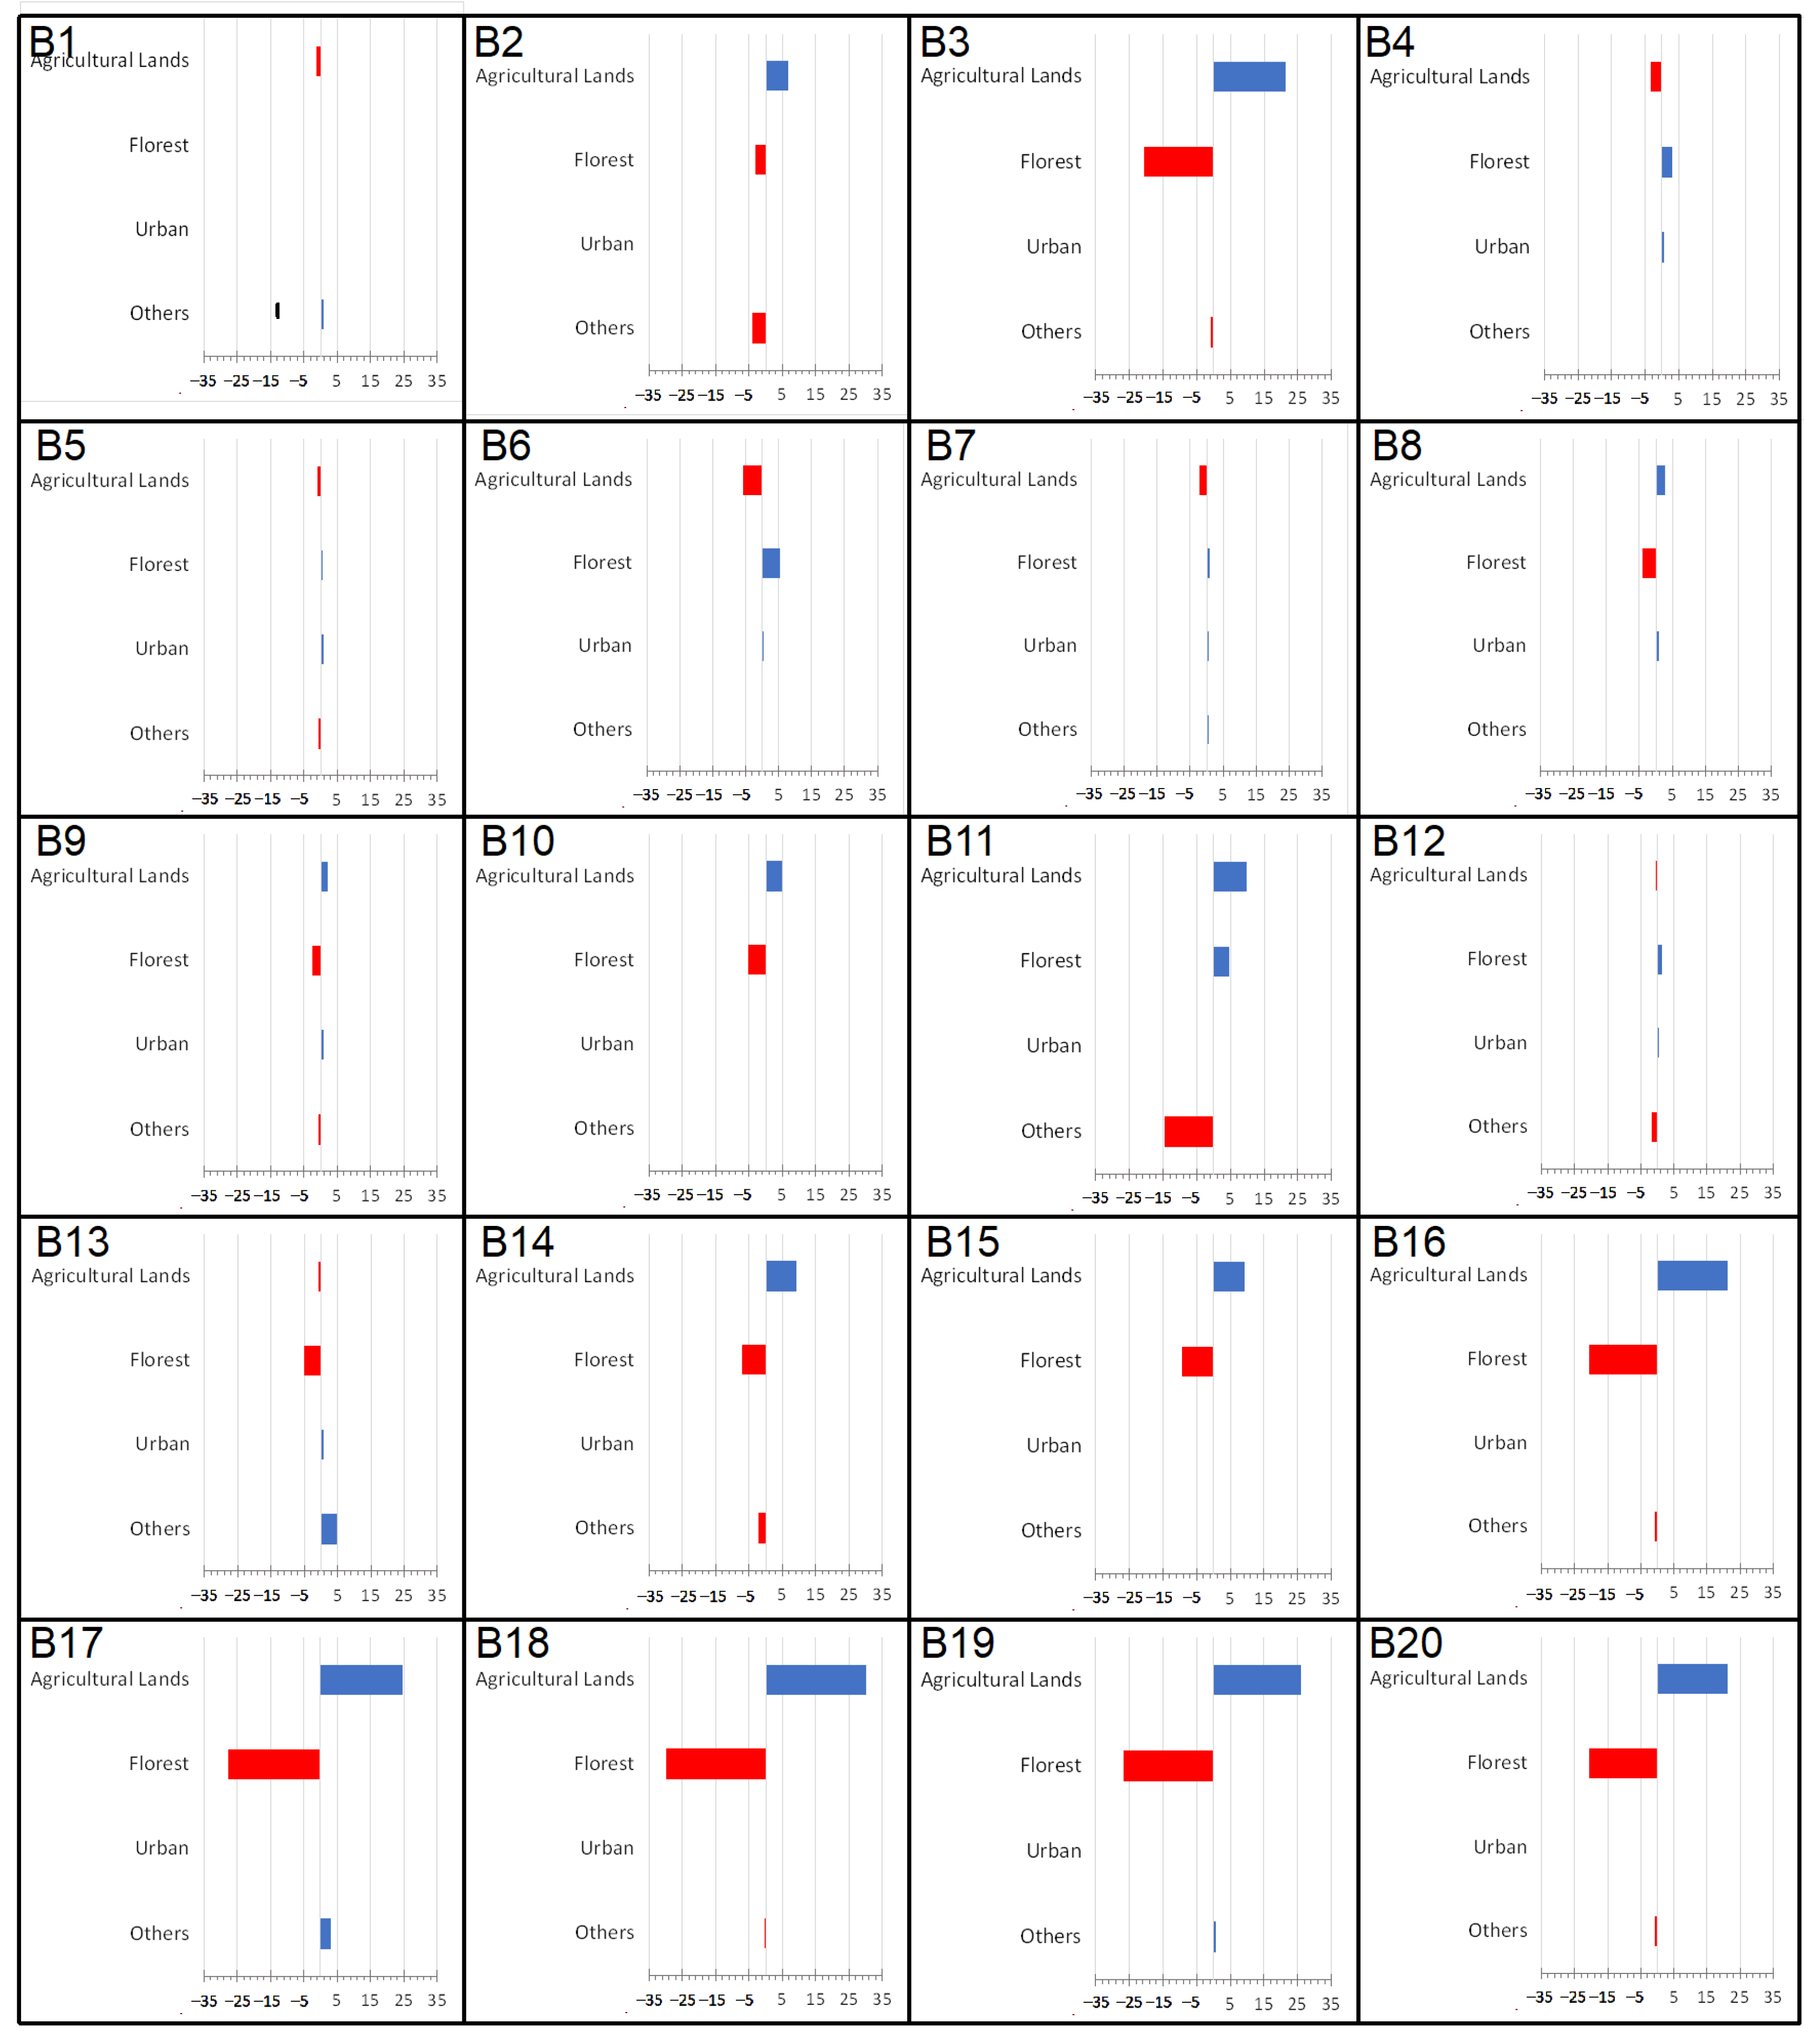
3.2. Land Use Changes

From land use and land cover changes, the modified patterns detected in the basins over time may be related to changes in the flow, since the removal of vegetation cover can interfere with the infiltration capacity, causing increased runoff, decreased real evapotranspiration [69,70], reduced soil moisture, and reduced aquifer recharge [71,72]. Furthermore, the vegetation was associated with temperature trends by Nayak and Mandal [73], an increase in temperature by the conversion of forest to agricultural land, and a decrease in temperature by the increased vegetation cover (shrubs to forest).
The variations in LULC in the last three decades (1985 to 2019) are heterogeneous across all of the basins (Figure 9). The agricultural land class increased by over 20% in basins B3 and B16–B20, with a peak of 30% in basin B18. Moreover, 10 basins have the current agricultural land area over 50%: B1 (69.1%), B2 (69.7%), B3 (63.9%), B4 (73.6%), B5 (77.5%), B7 (71.5%), B8 (77.1%), B10 (60.2%), B12 (53.1%), and B18 (65.0%). Nowadays, the agribusiness and cattle production that spread over all of these basins, in six Brazilian Federal states (GO, MG, MS, PR, SC, SP), account for 48% of Brazil’s agriculture (PAM, 2021—https://sidra.ibge.gov.br/pesquisa/pam/tabelas, accessed on 29 June 2021) and 41% of its livestock production (PPM, 2021—https://sidra.ibge.gov.br/pesquisa/ppm/tabelas, accessed on 29 June 2021). According to Rápalo et al. [74], the drought tends to intensify by agriculture expansion. On the other hand, natural vegetation increases water availability during the dry season.
The forest class has a slightly increased area in basins B1 (0.17%), B4 (2.95%), B5 (0.44%), B6 (5.26%), B7 (0.86%), B11 (4.7%), and B12 (1.6%), although, the forest class has a lost area in most of the studied basins. The largest percentage of forest loss occurred in basins B16–B20 (Figure 8), despite the fact that three basins have the highest current forest area: B17 (56.04%), B19 (58.87%), and B20 (68.99%) [74]. Coincidentally, these are some of the basins that are experiencing severe and prolonged droughts (Figure 6 and Figure 7). Moreover, basins B9 (58.19%) and B14 (53.07%) have more than half of their land covered in forest. Finally, across the basins, the urban class has grown by only 1.5%.
For example, the B11 basin, Barra Grande HPP, located between the Santa Catarina and the Rio Grande do Sul states, showed a significant change (−14%) of other uses. In this case, it is mainly represented by non-forest natural formation [74] to forest (4.7%) and agricultural lands (9.71%). The hydroelectric power generation company that manages the Barra Grande HPP (BAESA) launched a reforestation plan in 2014. As a result, over 4645.74 hectares have been restored with 1,015,610 native trees [75]. The increase in agricultural areas began in 2001 with the company BAESA resettling families, which fueled the market for rural properties for agricultural practices. To find arable land, most of the families bought land in Pinhal da Serra and Anita Garibaldi [76]. This scenario is likely to grow due to partnerships with other agricultural companies, providing technical assistance to families, and expanding cultivation areas [77].
Except for basins B3, B11, and B16–B20, the land use remained the same from 1985 to 2019. Therefore, for these basins, the negative trends detected in the indices time-series are associated with the climate, with a decrease in precipitation and an increase in temperature, impacting the hydrological cycle, and not related to land use changes. Leite-Filho et al. [78] established a strong correlation between deforestation and decreased rainfall in the southern Amazon (B20), potentially jeopardizing the local HPP operation. Similarly, Maeda et al. [79] evaluated the impact of large-scales commodity farming and rural settlements on rainfall and energy balance in the Amazon. They showed that the change of large-scale forest to commodity agriculture is more likely to reduce convective rainfall and increase land surface temperature. While Collischon et al. [80] demonstrated that LULC has a negligible effect on hydrological patterns in the B17 area, our results show that 30% of forest was converted to agricultural areas. This possibly results in an increase in potential evapotranspiration, associated with an increase in temperature (a downward trend for SPEI (all scales)) and streamflow decrease (a downward trend for SSFI, all scales). The boxplot analysis for streamflow shows that the median decreases for the minimum and maximum values by 25% and 30% from 1981–2010 to 2011–2021, respectively (Figure 8, Table S3). Miranda et al. [81] projected that by 2030, vegetation cover would deteriorate, negatively affecting the area’s hydrological regime, and thus negatively affecting the local HPP operation.

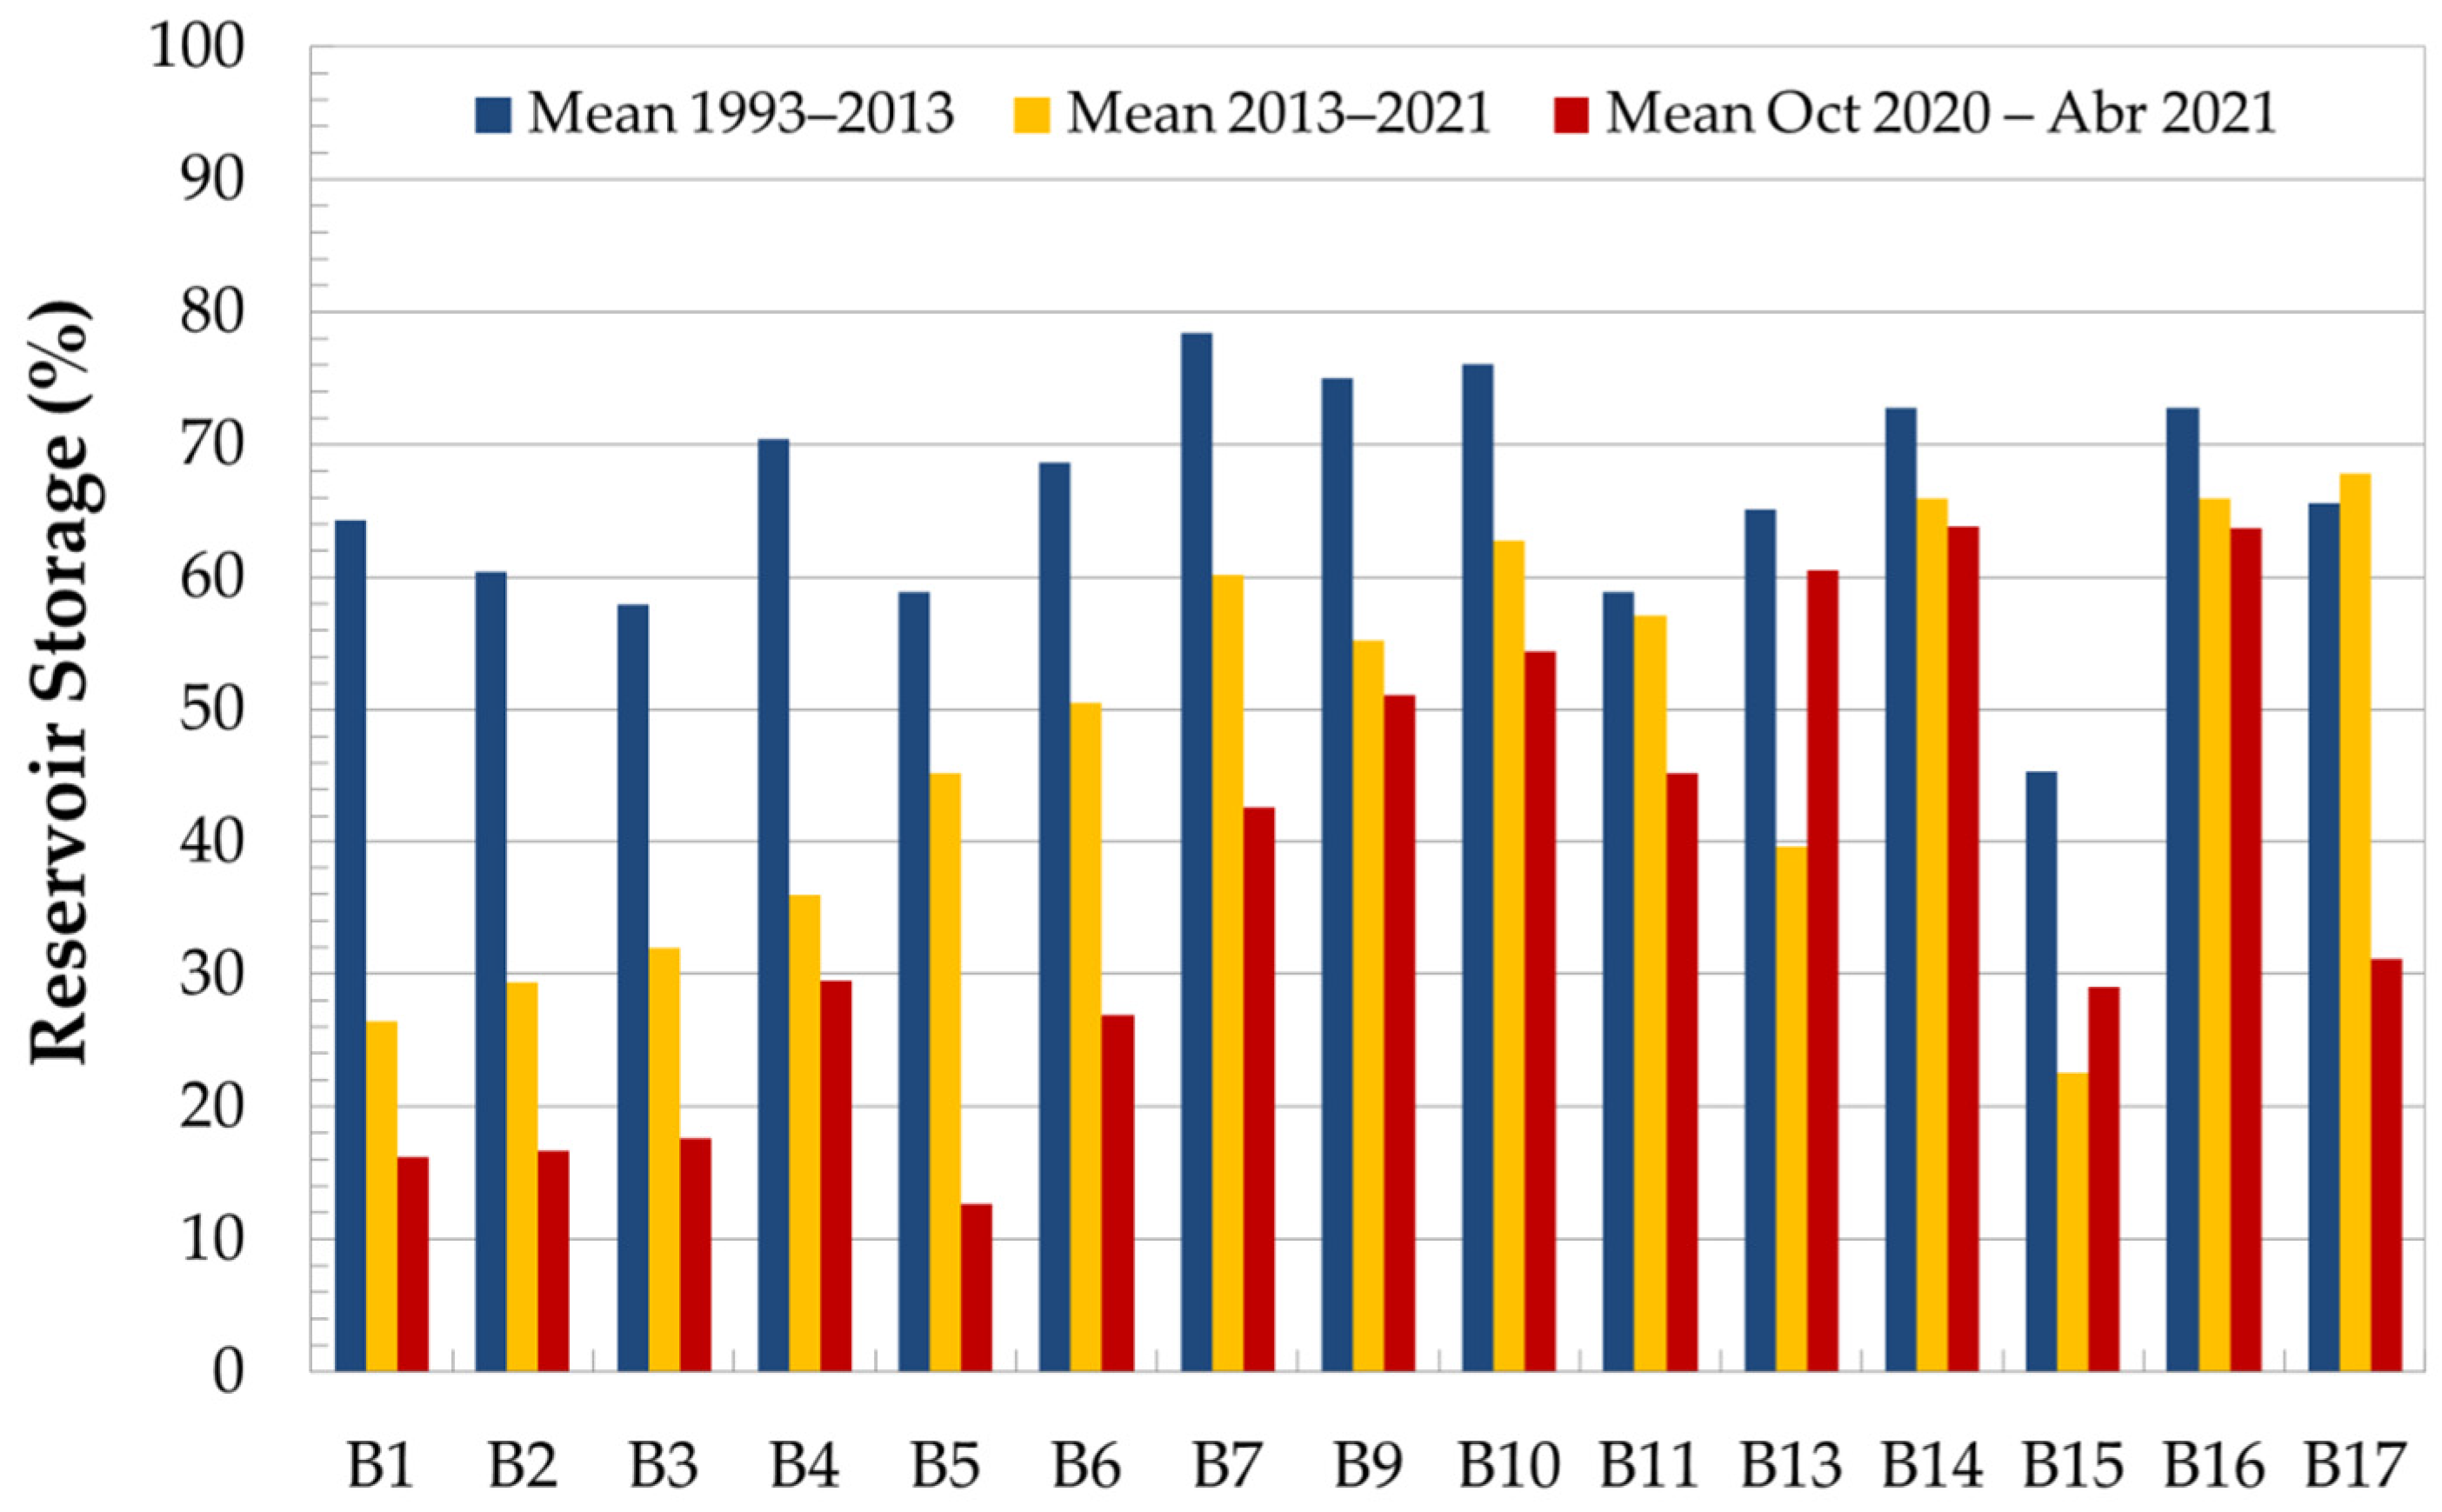
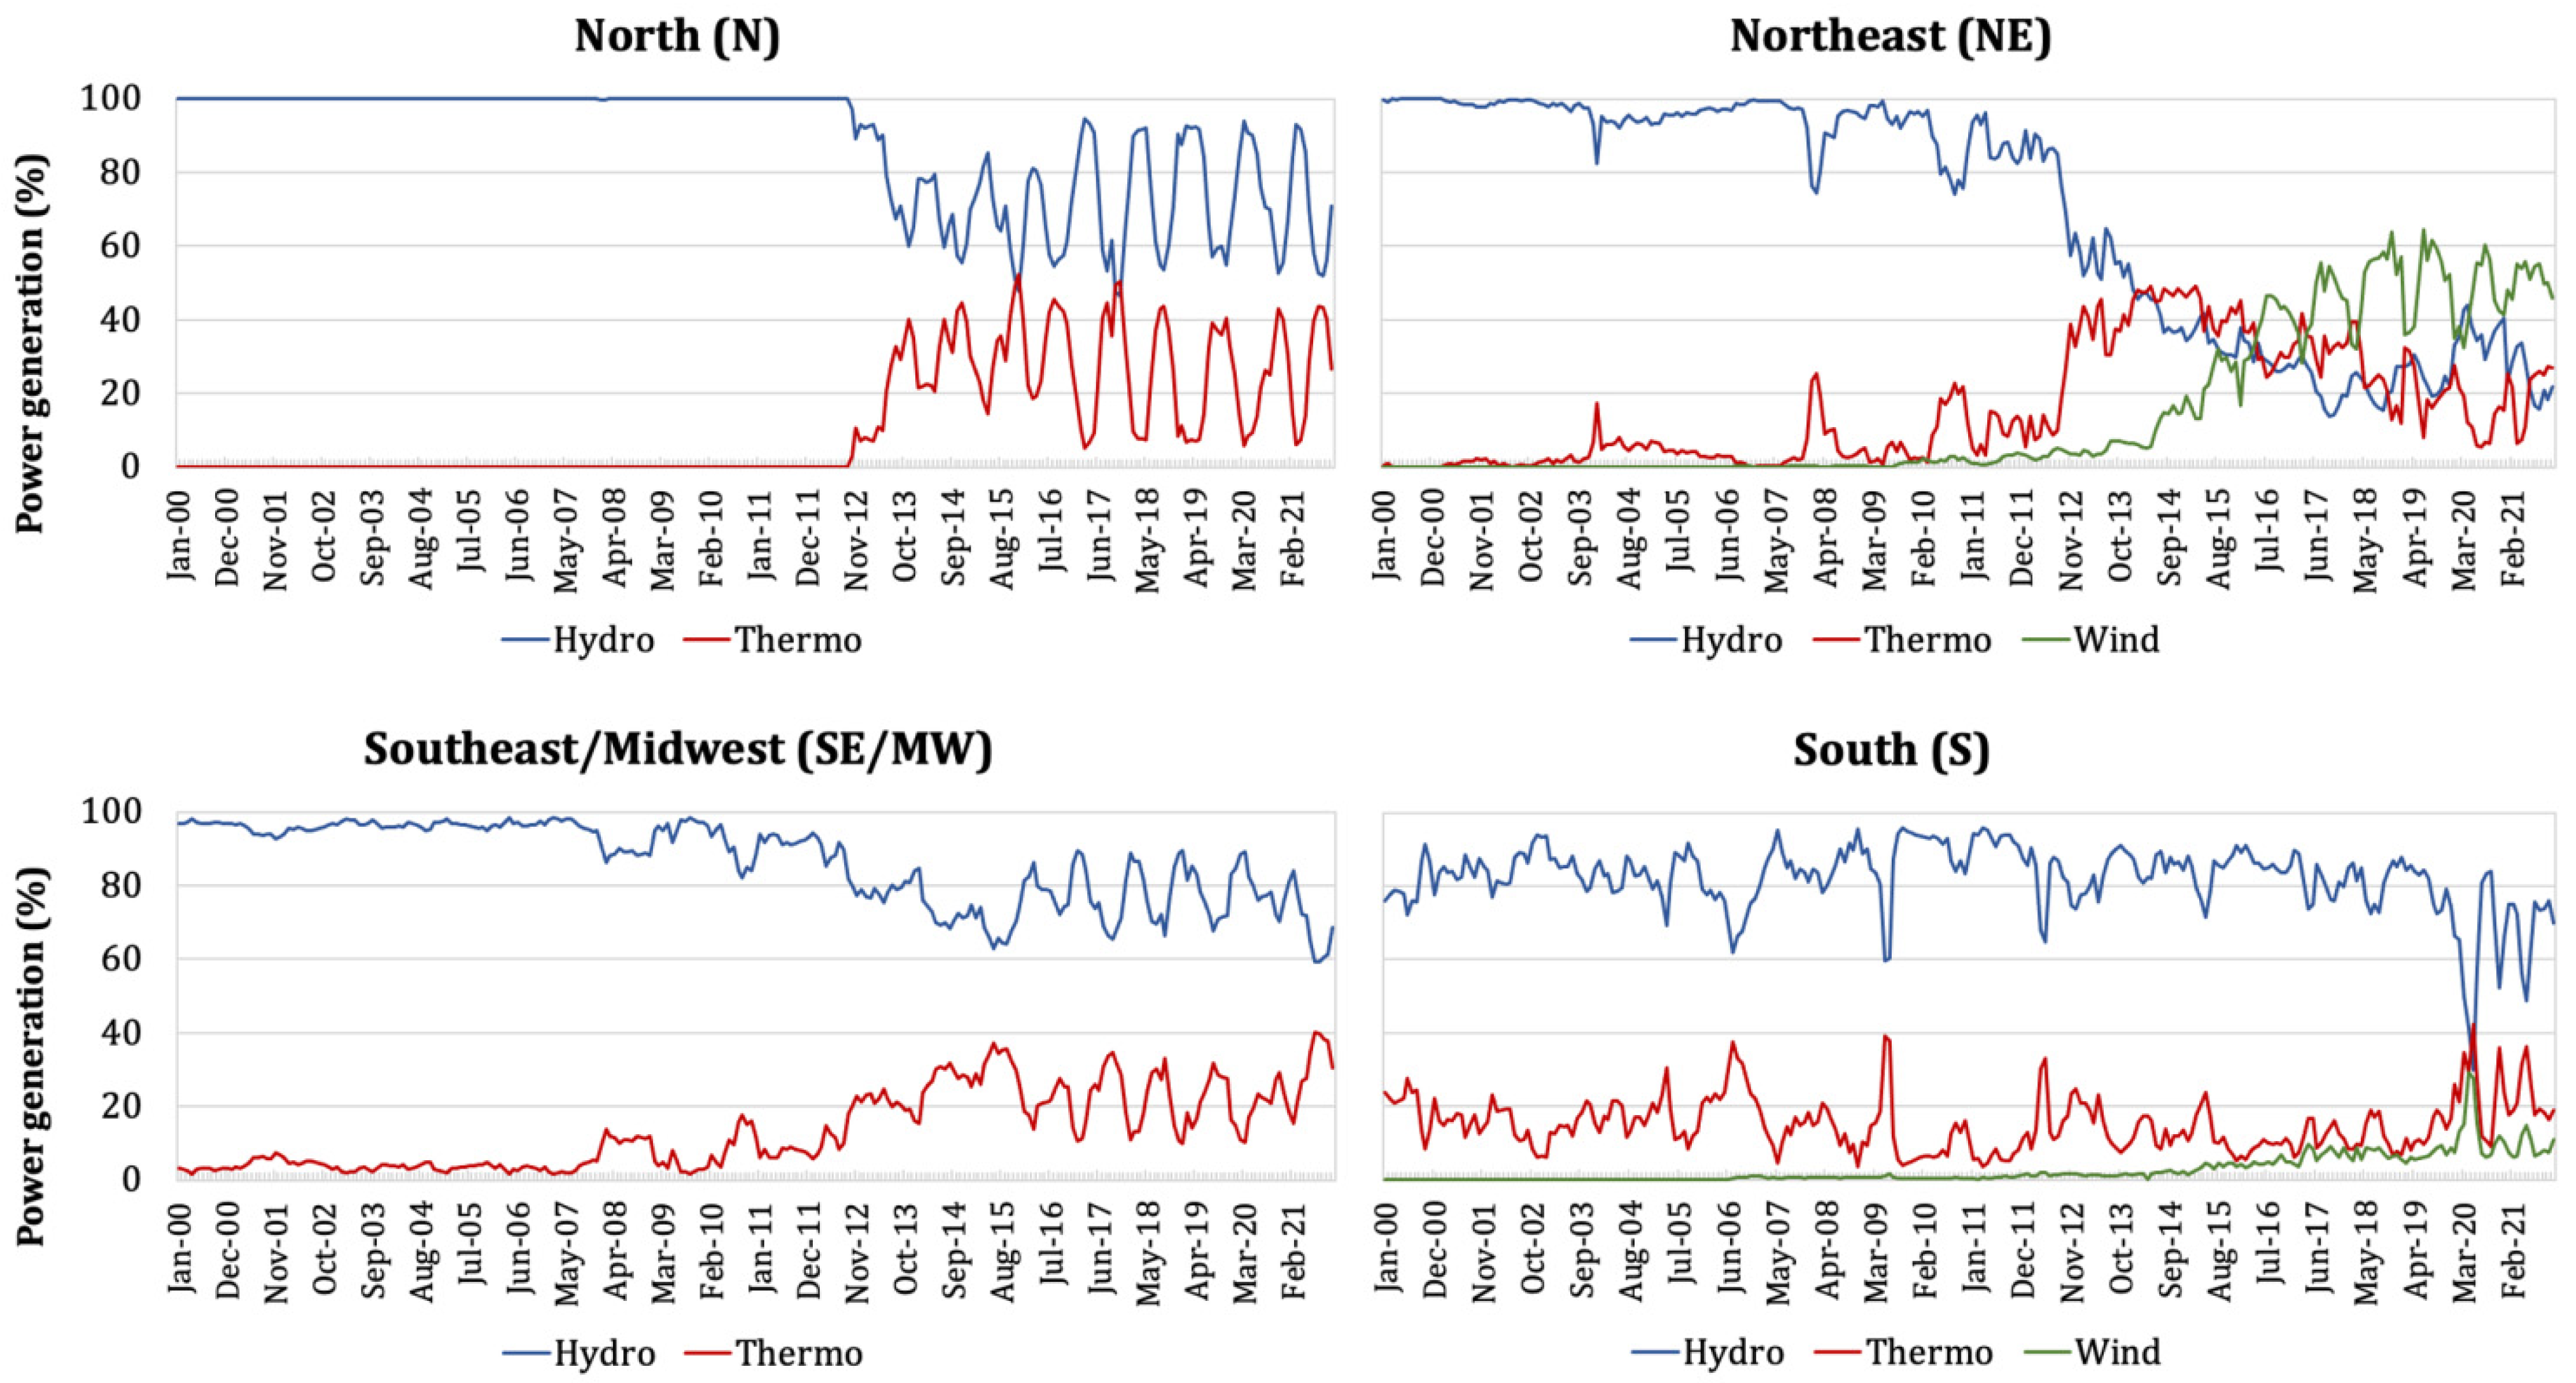
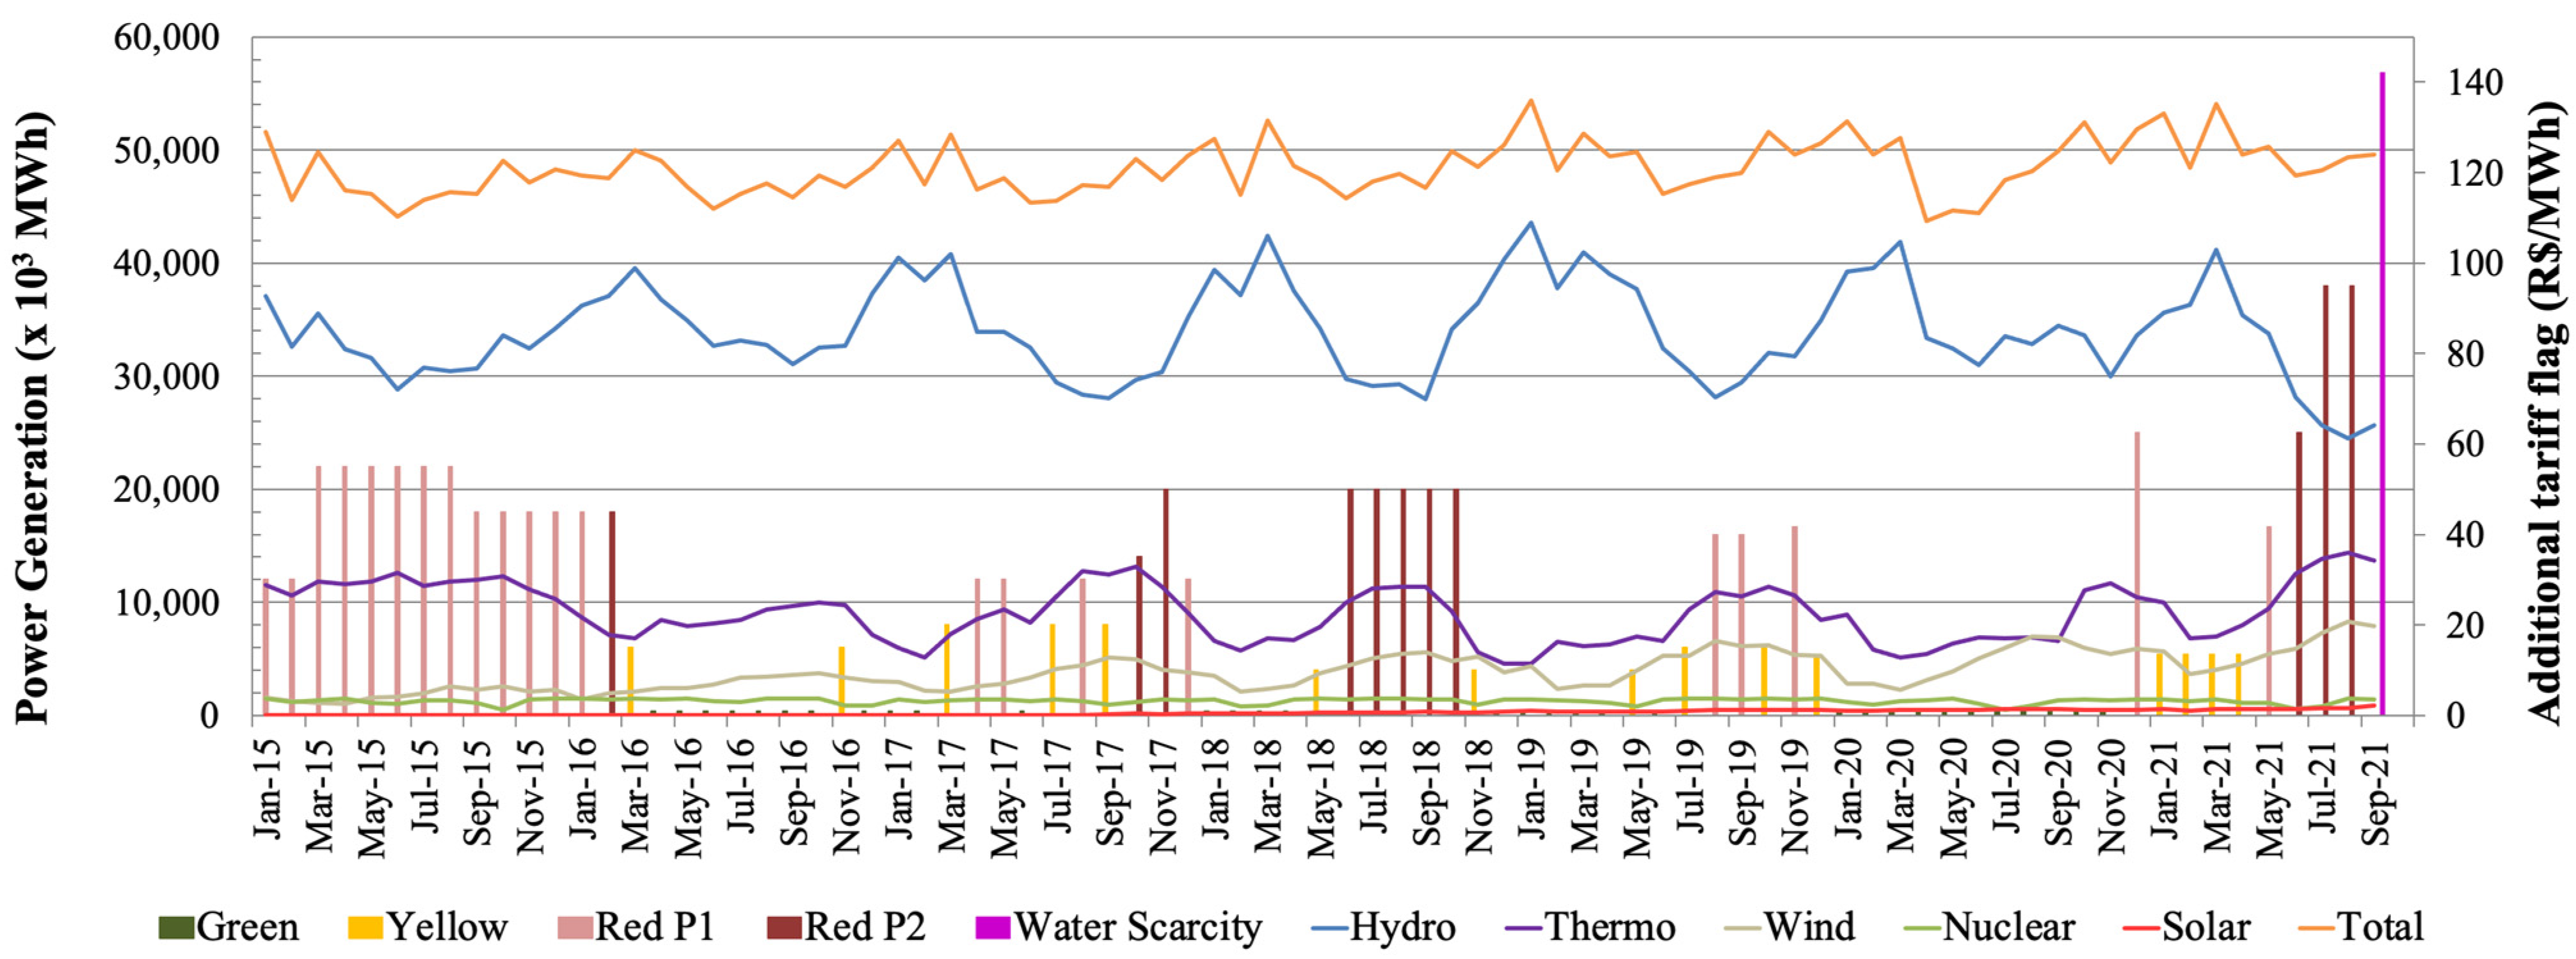
3.3. Impacts on Hydropower Generation and Climate Change Issues

In 2001, Brazil faced its worst energy crisis due to its geographic extension (countrywide) and duration [82]. This crisis occurred for several reasons, such as: (i) 52.3% increase in electricity consumption in the previous decade, against 41.2% increase in total generation capacity [82], (ii) periods of poor rainfall since 1999, with a more critical period in the summer of 2001 [83], and (iii) the lack of nationally connected transmission lines prevented the energy generated in the South and North to be transferred to the Southeast and Northeast regions of the country [82]. Nowadays, the situation is different. Transmission lines were installed, allowing for the transfer of electricity between regions, and the generation capacity was also increased. After the 2001 energy crisis, Cavaliero and da Silva [84] proposed the reduction of the share of hydroelectric energy by increasing other renewable energy sources due to the high risk of hydroelectricity shortage.
In recent years, wind power plants have been installed, mainly in the Northeast and South regions, and thermoelectric plants were generally located close to the main load centers. These plants play a relevant strategic role, contributing to the security of the Brazilian interconnected electric system (SIN). These plants are dispatched based on the current hydrological conditions, allowing for the management of the stocks of water stored in the hydroelectric plant’s reservoirs to ensure future service (http://www.ons.org.br/, accessed on 12 May 2021). However, the dependence on hydroelectric generation is still high. Many of the country’s hydroelectric power plants ended the last rainy season (November 2020 to March 2021) operating at less than half of the capacity (http://www.ons.org.br/paginas/energia-agora/reservatorios, accessed on 12 May 2021).
Water reserves for hydroelectricity generation have been suffering a decrease since 2014 when compared to the period 1993–2013 (storage reservoir data are available from 1993 for most of the HPPs), as illustrated in Figure 10. The difference between periods 1993–2013 and 2014–2021 can be seen in most of the basins, except for B11 and B17, which remained almost stable. The largest difference occurred for basins B1–B4 and B13 (more than 25%). Moreover, during the period October 2020–July 2021 (red columns), a strong decrease in reservoir storage is observed in all of the basins, with differences larger than 35% for basins B1–B7 and B17.
A decrease in precipitation had become more pronounced and widespread in recent years, mainly after 2014, when drought led to a water crisis in São Paulo metropolitan region [30,31,32]. An intense and persistent high-pressure system dominated the central Southeast region of Brazil (B1–B5 and B13). This “blocking” caused the absence of precipitation for more than 40 days during January and February [32], the peak of the rainy season in the region (DJF). The cascade effects of this extended dry period were temperatures exceeding the average and increased soil moisture depletion. Recent studies unveil that the high-pressure systems’ dominance over central Southeast Brazil is a recurrent feature of the rainy season, predominantly during January and February [85,86]. However, the critical standpoint is to realize that climate warming can aggravate this natural feature [68]. Abatan et al. [87] showed that the most significant droughts that impacted central Southeast Brazil since 1961 presented an amplified version of this high-pressure system.
After the anomalous 2013–2014 season there has not been a single rainy season within normal ranges until the current one (2020–2021). Figure 11 illustrated this fact, in which it shows the precipitation difference between 1981–2013 and 2014–2021 for the whole rainy season (NDJFM) and the peak (DJF). Except for southern Brazil (B9–B11), which has a different rainfall regime (no dry season), most of Brazil has seen a precipitation decrease in the last 8 years, during NDJFM, with the greatest differences in the basins located in the Southeast and Northeast regions of Brazil (Figure 11a). This reduction is more accentuated for DJF (Figure 11b) and affects most of the basins examined in this study (except for basins B9, B10, B11, B12, and B19). Moreover, except for some areas in the northern region, the period from November 2020 to March 2021 (last rainy season) was one of the worst in recent years in the precipitation deficit. According to the world meteorological organization (2021), 2020 was one of the three warmest years on record, with a global mean temperature of 1.2 ± 0.1 °C above the 1850–1900 baseline [88]. The past 6 years, 2015–2020, were the six warmest on record. The 2016–2020 and 2011–2020 averages were also the warmest on record, with the land areas warmer than the long-term average (1981–2010). Some of these areas were the northern and western parts of South America [88]. The monthly averages of the 2011–2021 surface temperature increased compared to the 1981–2010 averages. The tendency analysis of the surface temperature (Figure S1) shows that all of the basins demonstrate an increasing trend. This trend is stronger from September to November, which is the austral spring season, and in some basins (e.g., B9–B12) this trend is limited to this period. However, in most of the basins, the trend is visible for most of the year. Similarly, the monthly averages of potential evapotranspiration have also increased from 1981–2020 to 2011–2021. This trend is visible for all of the basins (Figure S2), especially during the months of August to October, and for some basins in November. These results are corroborated by the analyzed hydrometeorological drought indices. The recent and prolonged drought significantly impacts Brazil’s reservoirs as shown in Figure 10, despite the contribution of other energy sources, which are mainly thermoelectric in the power generation (Figure 12).
Figure 12 depicts the temporal tradeoff of the energy grid power generation since 2000. Each subsystem presents a characteristic temporal feature. The northern subsystem has a strong sinusoidal pattern due to the rainy and dry season throughout the year that has emerged in the last decade, coinciding with the beginning of thermoelectricity generation. Thermoelectricity generation ranges between 5% to 52% of the total subsystem generation, with monthly maximum values from July to December. This subsystem experienced the largest increase in hydropower capacity, from 6959 MW in January 2006 to 22,251 MW in December 2020. Moreover, the thermopower capacity increased from 8 MW in January 2006 to 3631 MW in December 2020. The wind, solar and thermoelectric grid infrastructure has increased in the last 10 years in the Northeast subsystem, reducing the dependence on the hydroelectric source whose flow (B13 and B14, Figure 8) had the biggest drop. The wind power capacity increased from 722 MW in January 2011 through 14,204 MW in December 2020 to 17,099 MW in November 2021. The solar power increased from 2 MW in January 2015 through 2128 MW in December 2020 to 3278 MW in November 2021. Finally, the thermopower capacity increased from 13,087 MW in January 2006 through 35,744 MW in December 2020 to 39,703 MW in November 2021. Since 2013, 1 year after the onset of the longest drought in recent decades in the Northeast region [27,28,29], the hydropower generation has decreased by 60% from around the first studied decade (January 2000–December 2012) to the second (January 2013–April 2021). The increase in the thermoelectric and wind electricity generation (25% and 33%, respectively) compensated the hydroelectric power loss. The hydroelectricity generation has also been affected in the SE/MW subsystem, forcing its temporal pattern to be similar to the North subsystem, as the annual seasons oscillate from wettest to driest. This pattern was not noted prior to 2014/15. The hydropower generation has decreased by 18% from around the first studied decade (January 2000–December 2014) to the second (January 2015–April 2021), which is compensated by thermoelectricity (+18%). The SE/MW subsystem also experienced an increase in hydro- and thermopower capacity. The hydropower increased from 45,053 MW in January 2006 to 58,113 MW in December 2020 and thermoelectric from 7865 to 19,358 MW, for the same time period. Notably, 48% of the installed capacity in Brazil is in this subsystem, with 54% of hydroelectric plants. Finally, the southern subsystem has had a more random tradeoff between the hydro- and thermoelectricity generation over the entire time period studied. However, the past 2 years indicate a decrease in hydroelectric power (−20% from January 2000–December 2019 to January 2020–April 2021) and an increase in wind electric (+12%) and thermoelectric power usage (+9%). The power capacity also increased: Hydropower went from 11,664 MW in January 2006 to 17,148 MW in December 2020, thermopower from 2522 to 4227 MW, and wind power from 50 to 2022 MW. The major impact of this change is the increase in thermoelectric power usage, which directly influences the energy cost at the consumer end.
Due to the above, in January 2015, the tariff flag regime began with the publication of Normative Resolution No. 547, of 16 April 2013, which establishes the commercial procedures for the application of tariffs related to different flags, as well as the immediate transfer to the consumer of any increase of costs in electricity generation (ANEEL, 2013). The activation and values associated with the tariff flags were established through categories by the national electric energy agency (ANEEL) through Ratifying Resolution No. 1859/15, of 3 March 2015. The flags are divided as follows: (i) Green—when conditions for power generation are favorable without the need of additional charges; (ii) yellow—when conditions become less favorable and the tariff increases for each kilowatt-hour (kWh) consumed (R USD 0.01874 kWh−1); and (iii) red—when energy production is more costly and the tariff suffers a greater increase. This last flag is divided into two levels according to the generation costs: (a) P1: Increase of R USD 0.03971 kWh−1, and (b) P2: Increase of R USD 0.09492 kWh−1. Figure 13 shows the activation of the tariff flag due to the increase in thermoelectric energy generation. Throughout 2015, the tariff flag Red-P1 was activated, followed by the year 2018, in which the tariff flag Red-P2 was activated for 5 months. Since September 2021, ANEEL has established and is applying a new tariff flag, called the “water scarcity flag”, whose value is almost 50% more than the flag Red-P2 (https://www.poder360.com.br/energia/governo-anuncia-bandeira-tarifaria-de-r-1420-quase-50-maior-que-a-atual/, accessed on 16 December 2021). During the 2001 energy crisis, electricity consumption rationing and penalties for excessive consumption were applied. In the current energy crisis, tariff flags have been applied for the first time with negative consequences in different socioeconomic sectors.
Notably, many of the reservoirs used for hydroelectric power generation have multiple uses: Irrigation, human supply, and livestock. The last two are a priority for water use by law No. 9433 [89]. Nevertheless, the severity of the recent droughts in Brazil also impacted agriculture and livestock production [36], water availability for consumption [30,31], hydropower generation [82,90], the navigation of some important rivers [34,91], and fire incidence [34,92].
It is estimated that the global surface temperature increased by 0.99 (0.84–1.10) °C between 1850 and 2000 [93], with more significant increases over land than ocean. Between 1850–1900 and 2011–2020, land warming is approximately 45% (1.61 (1.34–1.83) °C) greater than the global surface temperature warming and, approximately, 80% greater than the ocean surface warming. Additionally, warming over land increases the atmospheric evaporative demand and the severity of drought events. Larger warming over the land than over the ocean alters the atmospheric circulation patterns and reduces the continental near-surface relative humidity, contributing to regional drying, according to the IPCC [94]. Therefore, the recent rise in temperature, coupled with the accumulated rainfall deficit, as observed by the SPEI, has resulted in a significant decrease in the basin’s streamflow, as shown by the SSFI. As the SSFI was estimated from naturalized streamflow, the downward trend observed in most of the studied basins can be associated with the observed climate change.
As stated above, the recent temperature rise (Figure S1), coupled with the accumulated rainfall deficit, as observed by the SPEI, has resulted in a significant decrease in basin discharge, as shown by the SSFI. As a result, there was a reduction in water inflow to hydroelectric plants’ reservoirs. The heatwave exacerbated the drought [68], affecting natural and human systems and also contributing to the recent low reservoir levels. Our results are corroborated by other studies. The lack of precipitation and rising surface temperatures reduce water inflows to both the run-of-river and reservoir plants [90], reducing hydropower generation [40]. Moreover, drought impacts the hydropower in the North and Northeast [90,95,96]. Vasquez-Arrojo et al. [40] found that water availability for hydropower generation decreased by 2 and 4 °C using the downscaled climate models Eta HadGEM2-ES and Eta MIROC5. It is clear that the high risk of hydroelectricity shortage demands investments in a new electricity generation capacity from other renewed sources.

4. Conclusions

This study analyzed different drought indicators to assess hydrological drought in several regions of Brazil, and its impact on hydropower generation. Our results show that hydrological drought events have been more frequent and intense in the last decades in Brazil. Particularly in the last decade (2010–2021), droughts also occurred concomitantly in several country regions, with noticeable impacts in different socio-economic sectors, which are currently still being experienced.
The results demonstrated that the droughts in the last decade of the 1981–2021 period, were the most severe and intense, in terms of precipitation, temperature, and consequently, streamflow. Moreover, the three indices (SPI, SPEI, and SSFI) used in this study clearly showed the critical situation of water reserves. Among the three indices, SPEI and SSFI, for all of the scales, presented the strongest evidence. In most of the basins, the Mann–Kendall trend test showed a downward trend in the SPI, SPEI, and SSFI time-series from 1981 to 2021, indicating an increased frequency of drought events. The strong correlation found between the SPEI and SSFI in most of the basins, indicates that the SPEI could be used to assess hydrological drought events in basins with few or no discharge measurement stations, a reality that is compatible with Brazil’s continental scale.
Our results suggest that droughts are more intense and frequent due to the compound effect of decreased precipitation, and increased in temperature in a possible global warming scenario. This correlates with the recent climate changes observed [94]. According to the IPCC, the decreased precipitation and increased surface temperature result in the increased evapotranspiration and decreased soil moisture, leading to negative feedback processes that exacerbate drought events.
Forest cover loss was most significant in basins located in the Central West region of Brazil, and agriculture was observed to be expanding in these regions. There was no evidence of an increasing trend in the frequency of droughts in these basins, as measured by the SPI using only rainfall data. In comparison, decreasing trends in the SPEI (increased frequency of water deficit conditions) were observed in these basins, particularly in basin B16, which experienced the greatest absolute loss of forest area. Several studies indicate that removing natural vegetation can contribute to local warming [97,98,99] and reduce rainfall [35,99]. This study’s findings indicate a link between deforestation in some areas and a trend towards increasing water deficit due to the rising surface temperatures, although in other areas no trend was found. Notably, additional research is required to establish causalities and understand the changes in hydrometeorological processes, and their impact on hydrological regimes.
Although Brazil has increased its hydropower capacity after the 2001 energy crises, from 75,570 MW in January 2006 to 108,739 MW in November 2021, the intense and severe drought events in the past decade have substantially impacted the hydroelectricity generation in all of the Brazilian regions, except for the northern region. The Mid-West, Southeast, and Northeast regions have been most affected. This is of particular concern since the maximum storage capacity (MW month) is concentrated in these regions, with 71% of all the installed capacity in Brazil (http://www.ons.org.br/Paginas/resultados-da-operacao/historico-da-operacao/capacidade_instalada.aspx, accessed on 20 January 2022). The thermoelectricity generation increased to avoid electricity rationing. The major impact of this change is the increase in energy cost cascading towards the consumer end. Furthermore, Brazil thermoelectric plants work by burning fossil fuels, diesel, and natural gas. Therefore, the increase in thermoelectric power usage increases Brazilian greenhouse gases emissions, contributing to global warming. This situation highlights the urgent need to establish a preparation plan to mitigate the effects of drought in the country, in a sustainable manner.

Supplementary Materials

The following are available online at https://www.mdpi.com/article/10.3390/w14040601/s1, Figure S1: Innovative Polygon Trend Analysis—IPTA of 2m temperature (surface) ERA5 Land monthly data (1:1 No trend-line—red line), for 1981–2010 (horizontal axis) and 2011–2021 (vertical axis) periods, for the studied basins. Figure S2: Innovative Polygon Trend Analysis—IPTA [100] of potential evapotranspiration ERA5 Land monthly data (1:1 No trend-line—red line), for 1981–2010 (horizontal axis) and 2011–2021 (vertical axis) periods, for the studied basins. Table S1: Correlations of hydrometeorological indices for all time scales. Table S2: Boxplot´s five-number summary for minimum and maximum precipitation monthly values, for 1981–2010 and 2011–2021 periods. Table S3: Boxplot´s five-number summary for minimum and maximum streamflow monthly values, for 1981–2010 and 2011–2021 periods.

Author Contributions

Conceptualization, L.A.C. and A.P.M.d.A.C.; methodology, L.A.C., A.P.M.d.A.C., J.A.A. and L.M.P.P.; software, L.A.C., L.C.O.C. and R.D.M.; validation, L.A.C., A.P.M.d.A.C., K.D.-L., L.C.O.C. and E.B.; formal analysis, L.A.C., A.P.M.d.A.C., J.A.A., L.M.P.P., L.C.O.C., D.A., K.D.-L., E.B., C.C., R.D.M. and M.E.S.; investigation, L.A.C., A.P.M.d.A.C., J.A.A., L.M.P.P., L.C.O.C., D.A., K.D.-L., E.B. and M.E.S.; resources, L.A.C. and A.P.M.d.A.C.; data curation, L.A.C., A.P.M.d.A.C., J.A.A., L.M.P.P., L.C.O.C., K.D.-L. and E.B.; writing—original draft preparation, L.A.C., A.P.M.d.A.C., J.A.A., L.M.P.P., L.C.O.C., R.D.M., D.A., M.E.S., R.C.d.S.A. and J.A.M.; writing—review and editing, L.A.C., A.P.M.d.A.C., R.D.M., D.A. and C.C.; visualization, L.A.C., A.P.M.d.A.C., L.C.O.C., D.A. and R.D.M.; supervision, L.A.C.; project administration, L.A.C., A.P.M.d.A.C., C.C., R.C.d.S.A. and J.A.M.; funding acquisition, J.A.M. and R.C.d.S.A. All authors have read and agreed to the published version of the manuscript.

Funding

This research was funded by the National Institute of Science and Technology for Climate Change Phase 2, under CNPq grant 465501/2014-1/Public call MCTI/CNPQ/CAPES/FAPESP No. 16/2014 and the Brazilian Research Network on Global Climate Change FINEP/Rede CLIMA, grant 01.13.0353-00. The fellowships of L.C., K.D., E.B., and D.A. were supported by Project Research and Technological Developments in Natural Disasters—PCI, under CNPq grant 444321/2018-7.

Institutional Review Board Statement

Not applicable.

Informed Consent Statement

Not applicable.

Data Availability Statement

The data that support the findings of this study are available on: https://data.chc.ucsb.edu/products/CHIRPS-2.0/, https://spei.csic.es/database.html, https://mapbiomas.org, https://www.ana.gov.br/sar/sin, http://www.ons.org.br/ accessed on 11 April 2021.

Acknowledgments

The authors acknowledge the CNPq, FAPESP, and CEMADEN/MCTI for funding the research that supports this work. The authors thank CEMADEN/MCTI and Graduate Program in Natural Disasters, UNESP/CEMADEN for the institutional support. We also thank the anonymous reviewers for constructive and excellent critiques, and suggestions.

Conflicts of Interest

The authors declare no conflict of interest.

References

  1. Wallamecq, P.; Below, R.; McLean, D. Economic Losses, Poverty & Disasters (1998–2017); United Nations Office for Disaster Risk Reduction: Brussels, Belgium, 2018; Available online: https://www.undrr.org/publication/economic-losses-poverty-disasters-1998-2017#:~:text=The%20report%20finds%20that%20between,in%20need%20of%20emergency%20assistance (accessed on 11 April 2021).
  2. UNDRR. Special Report on Drought 2021; United Nations Office for Disaster Risk Reduction: Geneva, Switzerland, 2021; ISBN 9789212320274. [Google Scholar]
  3. IPCC. Climate Change 2014: Synthesis Report. Contribution of Working Groups I, II and III to the Fifth Assessment Report of Theintergovernmental Panel on Climate Change; Core Writing Team, Pachauri, R.K., Meyer, L.A., Eds.; IPCC: Geneva, Switzerland, 2014; p. 151. [Google Scholar]
  4. IPCC. Global Warming of 1.5 °C: Summary for Policymakers; Cambridge University Press: Geneva, Switzerland, 2018; ISBN 9789291691531. [Google Scholar]
  5. Sheffield, J.; Wood, E.F. Projected changes in drought occurrence under future global warming from multi-model, multi-scenario, IPCC AR4 simulations. Clim. Dyn. 2008, 31, 79–105. [Google Scholar] [CrossRef]
  6. Lloyd-Hughes, B. The impracticality of a universal drought definition. Theor. Appl. Climatol. 2014, 117, 607–611. [Google Scholar] [CrossRef] [Green Version]
  7. Wilhite, D.A.; Glantz, M.H. Understanding the drought phenomenon: The role of definitions. In Planning for Drought toward a Reduction of Societal Vulnerability; Routledge: New York, NY, USA, 2019; pp. 11–27. [Google Scholar] [CrossRef] [Green Version]
  8. Vicente-Serrano, S.M.; Beguería, S.; López-Moreno, J.I. A multiscalar drought index sensitive to global warming: The standardized precipitation evapotranspiration index. J. Clim. 2010, 23, 1696–1718. [Google Scholar] [CrossRef] [Green Version]
  9. Van Loon, A.F. Hydrological drought explained. Wiley Interdiscip. Rev. Water 2015, 2, 359–392. [Google Scholar] [CrossRef]
  10. Mishra, A.K.; Singh, V.P. A review of drought concepts. J. Hydrol. 2010, 391, 202–216. [Google Scholar] [CrossRef]
  11. Peters, E.; Torfs, P.J.J.F.; van Lanen, H.A.J.; Bier, G. Propagation of drought through groundwater—A new approach using linear reservoir theory. Hydrol. Process. 2003, 17, 3023–3040. [Google Scholar] [CrossRef]
  12. Crausbay, S.D.; Ramirez, A.R.; Carter, S.L.; Cross, M.S.; Hall, K.R.; Bathke, D.J.; Betancourt, J.L.; Colt, S.; Cravens, A.E.; Dalton, M.S.; et al. Defining ecological drought for the twenty-first century. Bull. Am. Meteorol. Soc. 2017, 98, 2543–2550. [Google Scholar] [CrossRef]
  13. WMO; GWP. Handbook of Drought Indicators and Indices; 2016; ISBN 9789263111739. Available online: https://www.droughtmanagement.info/literature/GWP_Handbook_of_Drought_Indicators_and_Indices_2016.pdf (accessed on 11 April 2021).
  14. Beguería, S.; Vicente-Serrano, S.M.; Reig, F.; Latorre, B. Standardized precipitation evapotranspiration index (SPEI) revisited: Parameter fitting, evapotranspiration models, tools, datasets and drought monitoring. Int. J. Climatol. 2014, 34, 3001–3023. [Google Scholar] [CrossRef] [Green Version]
  15. World Meteorological Organization Standardized Precipitation Index User Guide. J. Appl. Bacteriol. 1987, 63, 197–200.
  16. McKee, T.B.; Nolan, J.; Kleist, J. The relationship of drought frequency and duration to time scales. In Proceedings of the 8th Conference on Applied Climatology, Anaheim, CA, USA, 17–22 January 1993; pp. 179–184. [Google Scholar]
  17. Vicente-Serrano, S.M.; López-Moreno, J.I.; Beguería, S.; Lorenzo-Lacruz, J.; Azorin-Molina, C.; Morán-Tejeda, E. Accurate Computation of a Streamflow Drought Index. J. Hydrol. Eng. 2012, 17, 318–332. [Google Scholar] [CrossRef] [Green Version]
  18. Modarres, R. Streamflow drought time series forecasting. Stoch. Environ. Res. Risk Assess. 2007, 21, 223–233. [Google Scholar] [CrossRef]
  19. Cook, B.I.; Mankin, J.S.; Anchukaitis, K.J. Climate Change and Drought: From Past to Future. Curr. Clim. Chang. Rep. 2018, 4, 164–179. [Google Scholar] [CrossRef]
  20. Rossato, L.; Alvalá, R.C.d.S.; Marengo, J.A.; Zeri, M.; Cunha, A.P.M.d.A.; Pires, L.B.M.; Barbosa, H.A. Impact of soil moisture on crop yields over Brazilian semiarid. Front. Environ. Sci. 2017, 5, 1–16. [Google Scholar] [CrossRef] [Green Version]
  21. Assad, E.; Pinto, H.S.; Pellegrino, G.Q. Aquecimento Global e a Nova Geografia da Produção Agrícola no Brasil Mudanças Climáticas e a Produção de Grãos No Brasil: Avaliação Dos Possíveis Impactos; Assad, E.D., Pinto, H.S., Zullo, J., Jr., Marin, F., Pellegrino, G., Eds.; Embaixada Britânica; 2008; Available online: https://www.researchgate.net/publication/264715238_Aquecimento_Global_e_a_Nova_Geografia_da_Producao_Agricola_no_Brasil (accessed on 11 April 2021).
  22. Tomasella, J.; Borma, L.S.; Marengo, J.A.; Rodriguez, D.A.; Cuartas, L.A.; Nobre, C.A.; Prado, M.C.R. The droughts of 1996–1997 and 2004–2005 in Amazonia: Hydrological response in the river main-stem. Hydrol. Process. 2011, 25, 1228–1242. [Google Scholar] [CrossRef]
  23. Marengo, J.A.; Nobre, C.A.; Tomasella, J.; Cardoso, M.F.; Oyama, M.D. Hydro-climatic and ecological behaviour of the drought of Amazonia in 2005. Philos. Trans. R. Soc. B Biol. Sci. 2008, 363, 1773–1778. [Google Scholar] [CrossRef] [PubMed] [Green Version]
  24. Anderson, L.O.; Neto, G.R.; Cunha, A.P.; Fonseca, M.G.; De Moura, Y.M.; Dalagnol, R.; Wagner, F.H.; De Aragão, L.E.O.E.C. Vulnerability of Amazonian forests to repeated droughts. Philos. Trans. R. Soc. B Biol. Sci. 2018, 373, 20170411. [Google Scholar] [CrossRef]
  25. Jiménez-Muñoz, J.C.; Mattar, C.; Barichivich, J.; Santamaría-Artigas, A.; Takahashi, K.; Malhi, Y.; Sobrino, J.A.; Schrier, G. Van Der Record-breaking warming and extreme drought in the Amazon rainforest during the course of El Niño 2015–2016. Sci. Rep. 2016, 6, 33130. [Google Scholar] [CrossRef] [Green Version]
  26. Marengo, J.A.; Cunha, A.P.M.A.; Nobre, C.A.; Ribeiro Neto, G.G.; Magalhaes, A.R.; Torres, R.R.; Sampaio, G.; Alexandre, F.; Alves, L.M.; Cuartas, L.A.; et al. Assessing drought in the drylands of northeast Brazil under regional warming exceeding 4 °C. Nat. Hazards 2020, 103, 2589–2611. [Google Scholar] [CrossRef]
  27. Alvalá, R.C.D.S.; Cunha, A.P.M.A.; Brito, S.S.B.; Seluchi, M.E.; Marengo, J.A.; Moraes, O.L.L.; Carvalho, M.A. Drought monitoring in the Brazilian semiarid region. An. Acad. Bras. Cienc. 2019, 91, 1–15. [Google Scholar] [CrossRef] [Green Version]
  28. Brito, S.S.B.; Cunha, A.P.M.A.; Cunningham, C.C.; Alvalá, R.C.; Marengo, J.A.; Carvalho, M.A. Frequency, duration and severity of drought in the Semiarid Northeast Brazil region. Int. J. Climatol. 2018, 38, 517–529. [Google Scholar] [CrossRef]
  29. Cunha, A.P.M.A.; Tomasella, J.; Ribeiro-Neto, G.G.; Brown, M.; Garcia, S.R.; Brito, S.B.; Carvalho, M.A. Changes in the spatial–temporal patterns of droughts in the Brazilian Northeast. Atmos. Sci. Lett. 2018, 19, 1–8. [Google Scholar] [CrossRef] [Green Version]
  30. Nobre, C.A.; Marengo, J.A.; Seluchi, M.E.; Cuartas, L.A.; Alves, L.M. Some Characteristics and Impacts of the Drought and Water Crisis in Southeastern Brazil during 2014 and 2015. J. Water Resour. Prot. 2016, 8, 252–262. [Google Scholar] [CrossRef] [Green Version]
  31. Deusdará-Leal, K.R.; Cuartas, L.A.; Zhang, R.; Mohor, G.S.; de Castro Carvalho, L.V.; Nobre, C.A.; Mendiondo, E.M.; Broedel, E.; Seluchi, M.E.; dos Santos Alvalá, R.C. Implications of the New Operational Rules for Cantareira Water System: Re-Reading the 2014–2016 Water Crisis. J. Water Resour. Prot. 2020, 12, 261–274. [Google Scholar] [CrossRef] [Green Version]
  32. Coelho, C.A.S.; de Oliveira, C.P.; Ambrizzi, T.; Reboita, M.S.; Carpenedo, C.B.; Campos, J.L.P.S.; Tomaziello, A.C.N.; Pampuch, L.A.; de Souza Custódio, M.; Dutra, L.M.M.; et al. The 2014 southeast Brazil austral summer drought: Regional scale mechanisms and teleconnections. Clim. Dyn. 2016, 46, 3737–3752. [Google Scholar] [CrossRef]
  33. de Abreu, R.C.; Tett, S.F.B.; Schurer, A.; Rocha, H.R. Attribution of Detected Temperature Trends in Southeast Brazil. Geophys. Res. Lett. 2019, 46, 8407–8414. [Google Scholar] [CrossRef] [Green Version]
  34. Marengo, J.A.; Cunha, A.P.; Cuartas, L.A.; Deusdará Leal, K.R.; Broedel, E.; Seluchi, M.E.; Michelin, C.M.; De Praga Baião, C.F.; Chuchón Ângulo, E.; Almeida, E.K.; et al. Extreme Drought in the Brazilian Pantanal in 2019–2020: Characterization, Causes, and Impacts. Front. Water 2021, 3, 639204. [Google Scholar] [CrossRef]
  35. Leal Filho, W.; Azeiteiro, U.M.; Salvia, A.L.; Fritzen, B.; Libonati, R. Fire in Paradise: Why the Pantanal is burning. Environ. Sci. Policy 2021, 123, 31–34. [Google Scholar] [CrossRef]
  36. Cunha, A.P.M.A.; Zeri, M.; Leal, K.D.; Costa, L.; Cuartas, L.A.; Marengo, J.A.; Tomasella, J.; Vieira, R.M.; Barbosa, A.A.; Cunningham, C.; et al. Extreme drought events over Brazil from 2011 to 2019. Atmosphere 2019, 10, 642. [Google Scholar] [CrossRef] [Green Version]
  37. Fernandes, V.R.; Cunha, A.P.M.d.A.; Pineda, L.A.C.; Karinne, R.; Deusdará, L.; Lidiane, C.O.; Broedel, E.; de Azeredo França, D.; dos Santos Alvalá, R.C.; Seluchi, M.E.; et al. Secas e os Impactos na Região Sul Do Brasil. Rev. Bras. Climatol. 2021, 28, 561–584. [Google Scholar] [CrossRef]
  38. Rao, V.B.; Franchito, S.H.; Santo, C.M.E.; Gan, M.A. An update on the rainfall characteristics of Brazil: Seasonal variations and trends in 1979–2011. Int. J. Climatol. 2016, 36, 291–302. [Google Scholar] [CrossRef]
  39. Geirinhas, J.L.; Trigo, R.M.; Libonati, R.; Peres, L. Climatic characterization of heat waves in Brazil. Anu. Do Inst. De Geocienc. 2018, 41, 333–350. [Google Scholar] [CrossRef]
  40. Vasquez-Arroyo, E.; Gandelman, D.A.; da Silva, F.; Magalar, L.; Santos, D.V.; Lucena, A.F.P. Implications of climate change impacts for the Brazilian electricity mix. Sustentabilidade Em Debate 2020, 11, 122–138. [Google Scholar] [CrossRef]
  41. Tundisi, J.G. Recursos hídricos no futuro: Problemas e soluções. Estud. Avançados 2008, 22, 7–16. [Google Scholar] [CrossRef] [Green Version]
  42. Tucci, C.E. Urban Waters Initiative. Estud. Avançados 2008, 22, 97–112. [Google Scholar] [CrossRef]
  43. ANA. Conjuntura de Recursos Hídricos 2020: Informe Anual; ANA: Brasília, Brazil, 2020. Available online: https://www.snirh.gov.br/portal/centrais-de-conteudos/conjuntura-dos-recursos-hidricos (accessed on 11 April 2021).
  44. EPE. Balanço Energético Nacional 2020. Empresa De Pesqui. Energética 2020, 7–295. Available online: https://www.epe.gov.br/pt/publicacoes-dados-abertos/publicacoes/balanco-energetico-nacional-2020 (accessed on 11 April 2021).
  45. Ministério de Minas e Energia; Empresa de Pesquisa Energética Plano Nacional de Energia-PNE 2050. Afr. Potential Ecol. Intensif. Agric. 2020, 53, 1689–1699.
  46. Junqueira, R.; Viola, M.R.; de Mello, C.R.; Vieira-Filho, M.; Alves, M.V.G.; da Silva Amorim, J. Drought severity indexes for the Tocantins River Basin, Brazil. Theor. Appl. Climatol. 2020, 141, 465–481. [Google Scholar] [CrossRef]
  47. de Jesus, E.T.; da Silva Amorim, J.; Junqueira, R.; Viola, M.R.; de Mello, C.R. Meteorological and hydrological drought from 1987 to 2017 in doce river basin, Southeastern Brazil. Rev. Bras. Recur. Hidricos 2020, 25, 1–10. [Google Scholar] [CrossRef]
  48. Melo, D.D.C.D.; Scanlon, B.R.; Zhang, Z.; Wendland, E.; Yin, L. Reservoir storage and hydrologic responses to droughts in the Paraná River basin, south-eastern Brazil. Hydrol. Earth Syst. Sci. 2016, 20, 4673–4688. [Google Scholar] [CrossRef] [Green Version]
  49. Airton, M.; Freitas, D.S.; Freitas, G.B. Hydrological Drought Assessment: The Use of the ARRF Model for Monthly Streamflow Generation on Intermittent Rivers of the Northeast Brazil. J. Res. Environ. Earth Sci. 2019, 5, 29–37. [Google Scholar]
  50. de Medeiros, G.C.S.; Maia, A.G.; de Medeiros, J.D.F. Assessment of Two Different Methods in Predicting Hydrological Drought from the Perspective of Water Demand. Water Resour. Manag. 2019, 33, 1851–1865. [Google Scholar] [CrossRef]
  51. de Araújo, J.C.; Bronstert, A. A method to assess hydrological drought in semi-arid environments and its application to the Jaguaribe River basin, Brazil. Water Int. 2016, 41, 213–230. [Google Scholar] [CrossRef]
  52. Peel, M.C.; Finlayson, B.L.; McMahon, T.A. Updated world map of the Köppen-Geiger climate classification. Hydrol. Earth Syst. Sci. 2007, 11, 1633–1644. [Google Scholar] [CrossRef] [Green Version]
  53. Baez-Villanueva, O.M.; Zambrano-Bigiarini, M.; Ribbe, L.; Nauditt, A.; Giraldo-Osorio, J.D.; Thinh, N.X. Temporal and spatial evaluation of satellite rainfall estimates over different regions in Latin-America. Atmos. Res. 2018, 213, 34–50. [Google Scholar] [CrossRef]
  54. Beck, H.E.; Vergopolan, N.; Pan, M.; Levizzani, V.; van Dijk, A.I.J.M.; Weedon, G.P.; Brocca, L.; Pappenberger, F.; Huffman, G.J.; Wood, E.F. Global-scale evaluation of 22 precipitation datasets using gauge observations and hydrological modeling. Adv. Glob. Chang. Res. 2020, 69, 625–653. [Google Scholar] [CrossRef]
  55. Cavalcante, R.B.L.; Ferreira, D.; Pontes, P.R.M.; Tedeschi, R.G.; da Costa, C.P.W.; de Souza, E.B. Evaluation of extreme rainfall indices from CHIRPS precipitation estimates over the Brazilian Amazonia. Atmos. Res. 2020, 238, 104879. [Google Scholar] [CrossRef]
  56. Terrier, M.; Perrin, C.; de Lavenne, A.; Andréassian, V.; Lerat, J.; Vaze, J. Streamflow naturalization methods: A review. Hydrol. Sci. J. 2021, 66, 12–36. [Google Scholar] [CrossRef]
  57. Wurbs, R.A. Methods for Developing Naturalized Monthly Flows at Gaged and Ungaged Sites. J. Hydrol. Eng. 2006, 11, 55–64. [Google Scholar] [CrossRef]
  58. Nali, R.C.; Becker, C.G.; Zamudio, K.R.; Prado, C.P.A. Topography, more than land cover, explains genetic diversity in a Neotropical savanna tree frog. Divers. Distrib. 2020, 26, 1798–1812. [Google Scholar] [CrossRef]
  59. Nunes, S.; Oliveira, L.; Siqueira, J.; Morton, D.C.; Souza, C.M. Unmasking secondary vegetation dynamics in the Brazilian Amazon. Environ. Res. Lett. 2020, 15, 034057. [Google Scholar] [CrossRef]
  60. Silva Junior, C.H.L.; Heinrich, V.H.A.; Freire, A.T.G.; Broggio, I.S.; Rosan, T.M.; Doblas, J.; Anderson, L.O.; Rousseau, G.X.; Shimabukuro, Y.E.; Silva, C.A.; et al. Benchmark maps of 33 years of secondary forest age for Brazil. Sci. Data 2020, 7, 1–9. [Google Scholar] [CrossRef] [PubMed]
  61. Crouzeilles, R.; Feltran-Barbieri, R.; Ferreira, M.S.; Strassburg, B.B.N. Hard times for the Brazilian environment. Nat. Ecol. Evol. 2017, 1, 1213. [Google Scholar] [CrossRef] [PubMed]
  62. Hayes, M.J. Revisiting the SPI: Clarifying the Process DigitalCommons @ University of Nebraska—Lincoln Revisiting the SPI: Clarifying the Process; University of Nebraska: Lincoln, CA, USA, 2015. [Google Scholar]
  63. Guttman, N.B. Accepting the standardized precipitation index: A calculation algorithm. J. Am. Water Resour. Assoc. 1999, 35, 311–322. [Google Scholar] [CrossRef]
  64. Tirivarombo, S.; Osupile, D.; Eliasson, P. Drought monitoring and analysis: Standardised Precipitation Evapotranspiration Index (SPEI) and Standardised Precipitation Index (SPI). Phys. Chem. Earth 2018, 106, 1–10. [Google Scholar] [CrossRef]
  65. Thornthwaite, C.W. An Approach toward a Rational. Geogr. Rev. 1948, 38, 55–94. [Google Scholar] [CrossRef]
  66. Spinoni, J.; Antofie, T.; Barbosa, P.; Bihari, Z.; Lakatos, M.; Szalai, S.; Szentimrey, T.; Vogt, J. An overview of drought events in the Carpathian Region in 1961–2010. Adv. Sci. Res. 2013, 10, 21–32. [Google Scholar] [CrossRef] [Green Version]
  67. Gocic, M.; Trajkovic, S. Analysis of changes in meteorological variables using Mann-Kendall and Sen’s slope estimator statistical tests in Serbia. Glob. Planet. Chang. 2013, 100, 172–182. [Google Scholar] [CrossRef]
  68. Marengo, J.A.; Ambrizzi, T.; Barreto, N.; Cunha, A.P.; Ramos, A.M.; Skansi, M.; Molina Carpio, J.; Salinas, R. The heat wave of October 2020 in central South America. Int. J. Climatol. 2021. [Google Scholar] [CrossRef]
  69. Costa, M.H.; Botta, A.; Cardille, J.A. Effects of large-scale changes in land cover on the discharge of the Tocantins River, Southeastern Amazonia. J. Hydrol. 2003, 283, 206–217. [Google Scholar] [CrossRef]
  70. Dwarakish, G.S.; Ganasri, B.P. Impact of land use change on hydrological systems: A review of current modeling approaches. Cogent Geosci. 2015, 1, 1115691. [Google Scholar] [CrossRef]
  71. Brandão, A.S.P.; de Rezende, G.C.; da Costa Marques, R.W. Crescimento agrícola no período 1999/2004: A explosão da soja e da pecuária bovina e seu impacto sobre o meio ambiente. Econ. Apl. 2006, 10, 249–266. [Google Scholar] [CrossRef] [Green Version]
  72. Panday, P.K.; Coe, M.T.; Macedo, M.N.; Lefebvre, P.; de Almeida Castanho, A.D. Deforestation offsets water balance changes due to climate variability in the Xingu River in eastern Amazonia. J. Hydrol. 2015, 523, 822–829. [Google Scholar] [CrossRef]
  73. Nayak, S.; Mandal, M. Impact of land use and land cover changes on temperature trends over India. Land Use Policy 2019, 89, 104238. [Google Scholar] [CrossRef]
  74. Rápalo, L.M.C.; Uliana, E.M.; Moreira, M.C.; da Silva, D.D.; de Melo Ribeiro, C.B.; da Cruz, I.F.; dos Reis Pereira, D. Effects of land-use and -cover changes on streamflow regime in the Brazilian Savannah. J. Hydrol. Reg. Stud. 2021, 38, 100934. [Google Scholar] [CrossRef]
  75. BAESA. Relatório de Sustentabilidade 2017/2018. 2019. Available online: https://assets.kpmg/content/dam/kpmg/br/pdf/2018/04/br-relatorio-sustentabilidade-res-2017-2018.pdf (accessed on 11 April 2021).
  76. Ruppenthal, E.L. Reterritorialização dos Atingigos Pela Barragem Barra Grande—RS/SC. Master’s Thesis, UFRGS, Porto Alegre, Brazil, 2013. [Google Scholar]
  77. Roquetti, D. Empreendimentos Hidrelétricos e a Complexidade de Sistemas Socioecológicos Locais: O Caso da Usina Hidrelétrica de Barra Grande. 2013. Available online: https://teses.usp.br/teses/disponiveis/18/18139/tde-14102013-095904/en.php (accessed on 11 April 2021).
  78. Leite-Filho, A.T.; Soares-Filho, B.S.; Davis, J.L.; Abrahão, G.M.; Börner, J. Deforestation reduces rainfall and agricultural revenues in the Brazilian Amazon. Nat. Commun. 2021, 12, 1–7. [Google Scholar] [CrossRef] [PubMed]
  79. Maeda, E.E.; Abera, T.A.; Siljander, M.; Aragão, L.E.O.C.; de Moura, Y.M.; Heiskanen, J. Large-scale commodity agriculture exacerbates the climatic impacts of Amazonian deforestation. Proc. Natl. Acad. Sci. USA 2021, 118, e2023787118. [Google Scholar] [CrossRef] [PubMed]
  80. Collischonn, W.; Tucci, C.E.M.; Clarke, R.T. Further evidence of changes in the hydrological regime of the River Paraguay: Part of a wider phenomenon of climate change? J. Hydrol. 2001, 245, 218–238. [Google Scholar] [CrossRef]
  81. Miranda, C.D.S.; Paranho Filho, A.C.; Pott, A. Mudanças na cobertura da vegetação do pantanal dectadas por índice de vegetação: Uma estratégia de conservação. Biota Neotrop. 2018, 18, 1–6. [Google Scholar] [CrossRef] [Green Version]
  82. Hunt, J.D.; Stilpen, D.; de Freitas, M.A.V. A review of the causes, impacts and solutions for electricity supply crises in Brazil. Renew. Sustain. Energy Rev. 2018, 88, 208–222. [Google Scholar] [CrossRef]
  83. Franchito, S.H.; Rao, V.B.; Barbieri, P.R.B.; Santo, C.M.E. Rainy-season duration estimated from OLR versus rain gauge data and the 2001 drought in Southeast Brazil. J. Appl. Meteorol. Climatol. 2008, 47, 1493–1499. [Google Scholar] [CrossRef] [Green Version]
  84. Cavaliero, C.K.N.; Da Silva, E.P. Electricity generation: Regulatory mechanisms to incentive renewable alternative energy sources in Brazil. Energy Policy 2005, 33, 1745–1752. [Google Scholar] [CrossRef]
  85. Cunningham, C. Characterization of dry spells in Southeastern Brazil during the monsoon season. Int. J. Climatol. 2020, 40, 4609–4621. [Google Scholar] [CrossRef]
  86. Kelly, P.; Mapes, B. February drying in Southeastern Brazil and the Australian Monsoon: Global mechanism for a regional rainfall feature. J. Clim. 2016, 29, 7529–7546. [Google Scholar] [CrossRef]
  87. Abatan, A.A.; Tett, S.F.B.; Dong, B.; Cunningham, C.; Rudorff, C.M.; Klingaman, N.P.; de Abreu, R.C. Drivers and physical processes of drought events over the State of São Paulo, Brazil. Clim. Dyn. 2021, 1–37. [Google Scholar] [CrossRef]
  88. World Meteorological Organization. State of the Global Climate 2020 (WMO-No. 1264); WMO: Geneva, Switzerland, 2021; ISBN 9789263112644. [Google Scholar]
  89. BRASIL LEI No 9.433, DE 8 DE JANEIRO DE 1997—Política Nacional de Recursos Hidricos. n. Pdr 2020. 1997; pp. 3901–3902. Available online: https://www.gov.br/ana/pt-br/assuntos/gestao-das-aguas/politica-nacional-de-recursos-hidricos (accessed on 11 April 2021).
  90. Vasquez-Arroyo, E.; da Silva, F.; Santos, A.; Cordeiro, D.; Marengo, J.A.; Lucena, A.F.P. Climate impacts in the Brazilian energy security: Analysis of observed events and adaptation options. Sustain. Debate 2020, 11, 157–176. [Google Scholar] [CrossRef]
  91. Espinoza, J.C.; Ronchail, J.; Guyot, J.L.; Junquas, C.; Vauchel, P.; Lavado, W.; Drapeau, G.; Pombosa, R. Climate variability and extreme drought in the upper Solimões River (western Amazon Basin): Understanding the exceptional 2010 drought. Geophys. Res. Lett. 2011, 38, 1–6. [Google Scholar] [CrossRef]
  92. Aragão, L.E.O.C.; Anderson, L.O.; Fonseca, M.G.; Rosan, T.M.; Vedovato, L.B.; Wagner, F.H.; Silva, C.V.J.; Silva Junior, C.H.L.; Arai, E.; Aguiar, A.P.; et al. 21st Century drought-related fires counteract the decline of Amazon deforestation carbon emissions. Nat. Commun. 2018, 9, 1–12. [Google Scholar] [CrossRef]
  93. IPCC. Climate Change 2021: The Physical Science Basis Summary for Policymakers; IPCC: Geneva, Switzerland, 2021. [Google Scholar]
  94. IPCC. Climate Change 2021: The Physical Science Basis. Contribution of Working Group I to the Sixth Assessment Report of the Intergovernmental Panel on Climate Change; Masson-Delmotte, V., Zhai, P., Pirani, A., Connors, S.L., Péan, C., Berger, S., Caud, N., Chen, Y., Eds.; 2021; Available online: https://www.ipcc.ch/report/ar6/wg1/ (accessed on 11 April 2021).
  95. Arias, M.E.; Farinosi, F.; Lee, E.; Livino, A.; Briscoe, J.; Moorcroft, P.R. Impacts of climate change and deforestation on hydropower planning in the Brazilian Amazon. Nat. Sustain. 2020, 3, 430–436. [Google Scholar] [CrossRef]
  96. Lucena, A.F.P.; Szklo, A.S.; Schaeffer, R.; de Souza, R.R.; Borba, B.S.M.C.; da Costa, I.V.L.; Júnior, A.O.P.; da Cunha, S.H.F. The vulnerability of renewable energy to climate change in Brazil. Energy Policy 2009, 37, 879–889. [Google Scholar] [CrossRef]
  97. Cunha, A.P.M.A.; Alvalá, R.C.S.; Kubota, P.Y.; Vieira, R.M.S.P. Impacts of land use and land cover changes on the climate over Northeast Brazil. Atmos. Sci. Lett. 2015, 16, 219–227. [Google Scholar] [CrossRef]
  98. Findell, K.L.; Berg, A.; Gentine, P.; Krasting, J.P.; Lintner, B.R.; Malyshev, S.; Santanello, J.A.; Shevliakova, E. The impact of anthropogenic land use and land cover change on regional climate extremes. Nat. Commun. 2017, 8, 1–9. [Google Scholar] [CrossRef] [PubMed]
  99. Spracklen, D.V.; Arnold, S.R.; Taylor, C.M. Observations of increased tropical rainfall preceded by air passage over forests. Nature 2012, 489, 282–285. [Google Scholar] [CrossRef]
  100. Şen, Z.; Şişman, E.; Dabanli, I. Innovative Polygon Trend Analysis (IPTA) and applications. J. Hydrol. 2019, 575, 202–210. [Google Scholar] [CrossRef]
Figure 1. Köppen climate classification of the tributary basins at the 20 HPPs evaluated in this study.
Water 14 00601 g001
Figure 2. Mean monthly precipitation (1981–2021). The average of: (i) B1–B5, B13, and B15–B20 (green bars); (ii) B6–B8 (sky blue bars); (iii) B9–B12 (blue bars); and (iv) B14 (orange bars).
Water 14 00601 g002
Figure 3. Regression between the average rainfall of the stations and CHIRPS-2.0 data over Serra da Mesa, Furnas, and Três Marias basins.
Water 14 00601 g003
Figure 4. Time-series of: SPI (left), SPEI (center), and SSFI (right) for scales of 12, 24, 36, and 48 months, for all of the basins.
Water 14 00601 g004aWater 14 00601 g004b
Figure 5. Frequency of severe droughts (indices values ≤ −1.3) by decades.
Water 14 00601 g005
Figure 6. Maximum severity drought events according to SPI, SPEI, and SSFI, for scales of 12 (red circles), 24 (green circles), 36 (blue circles), and 48 months (magenta circles), and the duration (label and circle sizes) for each basin.
Water 14 00601 g006
Figure 7. Maximum intensity for the droughts of maximum severity events shown in Figure 6. Circle sizes are scaled with severity (positive values).
Water 14 00601 g007
Figure 8. Boxplots for the months with minimum and maximum precipitation and streamflow values for each year, for all of the basins (boxplots) investigated over two different periods: 1981–2010 (black) and 2010–2021 (red).
Water 14 00601 g008aWater 14 00601 g008bWater 14 00601 g008c
Figure 9. LULC changes from 1985 to 2019 for the studied basins.
Water 14 00601 g009
Figure 10. Mean reservoir storages (in %) in the periods: October 1993–September 2013 (blue column), October 2013–July 2021 (yellow column), and October 2020–July 2021 (red column). The hydrological year from October to September is considered.
Water 14 00601 g010
Figure 11. The difference in the average rainfall (in mm) between the 1981–2013 and 2014–2021 periods for: (a) Rainy season, November to March (left panel), and (b) the peak rainy season, December–January–February (right panel).
Water 14 00601 g011
Figure 12. Monthly electricity generation (%) by energy source, for the four subsystems, from 2000 to 2021.
Water 14 00601 g012
Figure 13. Power generation (MWh) vs. activation and additional tariff flags (R USD/MWh) since January 2015.
Water 14 00601 g013
Table 1. Basins and the corresponding HPPs description.
Basin IDHPPBasinSub-BasinRiverOperation StartTypeUseful Volume (hm³)Power (MW)Power Generation SubsystemImportance for Power Generation by Subsystem (%)Qnat Mean (m³/s)
B1Nova PonteParanáParanaíbaAraguari1994R *10,380510SE/MW11.13293
B2EmborcaçãoParanáParanaíbaParanaíba1982R *13,0561192SE/MW10.72473
B3ItumbiaraParanáParanaíbaParanaíba1980R *12,4542082SE/MW7.681511
B4FurnasParanáGrandeGrande1983R *17,2171312SE/MW17.21922
B5MarimbondoParanáGrandeGrande1975R *52601488SE/MW2.631849
B6JurumirimParanáParanapanemaParanapanema1962R *3165101SE/MW2.02225
B7CapivaraParanáParanapanemaParanapanema1977R *5725635SE/MW1.911098
B8ItaipuParaná-Paraná1984R-of-R **19,0007000 (Brazil) 14,000 (total)SE/MW-10,284
B9Foz do AreiaParanáIguaçuIguaçu1980R *56001676S29.8726
B10Salto SantiagoParanáIguaçuIguaçu1980R *40941420S17.1-
B11Barra GrandeUruguai-Pelotas2005R *2193690S15.03307
B12Foz ChapecóUruguai-Uruguai2010R *74855S-1470
B13Três MariasSão Francisco-São Francisco1962R *15,278396SE/MW and NE1.15623
B14SobradinhoSão Francisco-São Francisco1982R-of-R **28,6691050NE58.232060
B15Serra da MesaTocantins-AraguaiaTocantinsTocantins1998R *43,2501275SE/MW and N17.09 e 43.06660
B16TucuruíTocantins-AraguaiaTocantinsTocantins1984R *32,0008535N50.6911,000
B17MansoParaguai-Manso1999R *210212SE/MW-173
B18Ponte de PedraParaguai-Correntes2005R-of-R **176176SE/MW-100
B19Santo AntônioAmazonasMadeiraMadeira2012R*2733568SE/MW and N-18,624
B20Belo MonteAmazonasXinguXingu1998R-of-R **43911,000SE/MW and N-3676
* R: Reservoir; ** R-of-R: Run-of-river HPP with reservoir.
Table 2. Tau statistic values from the Mann−Kendall (MK) test values. The highlighted lines indicate a significance level of 0.05.
BasinSPI12SPI24SPI36SPI48SPEI12SPEI24SPEI36SPEI48SSFI12SSFI24SSFI36SSFI48
B10.000.040.070.10−0.24−0.26−0.28−0.32−0.35−0.38−0.40−0.45
B2−0.13−0.14−0.17−0.19−0.34−0.40−0.41−0.44−0.32−0.34−0.34−0.33
B3−0.17−0.22−0.24−0.27−0.39−0.43−0.43−0.42−0.34−0.36−0.35−0.34
B4−0.12−0.12−0.08−0.05−0.28−0.30−0.30−0.28−0.43−0.45−0.45−0.45
B5−0.20−0.24−0.25−0.28−0.32−0.29−0.29−0.33−0.42−0.43−0.43−0.44
B6−0.13−0.14−0.12−0.11−0.08−0.10−0.06−0.01−0.14−0.19−0.21−0.19
B70.000.040.110.13−0.03−0.06−0.010.08−0.04−0.05−0.020.05
B8−0.050.000.060.10−0.21−0.23−0.23−0.22−0.19−0.16−0.13−0.15
B90.020.040.070.110.040.020.050.15−0.04−0.04−0.030.02
B10−0.05−0.06−0.05−0.040.000.040.070.08−0.04−0.04−0.020.01
B110.120.180.240.320.050.090.150.21−0.09−0.17−0.17−0.14
B120.050.070.130.190.080.110.140.20−0.02−0.06−0.040.01
B13−0.14−0.19−0.24−0.23−0.20−0.23−0.23−0.25−0.32−0.34−0.34−0.32
B14−0.15−0.21−0.26−0.31−0.27−0.39−0.47−0.55−0.48−0.51−0.54−0.55
B15−0.19−0.28−0.29−0.30−0.38−0.43−0.45−0.45−0.40−0.48−0.49−0.49
B16−0.03−0.03−0.08−0.14−0.54−0.65−0.70−0.75−0.30−0.40−0.47−0.55
B17−0.02−0.04−0.07−0.12−0.22−0.22−0.25−0.30−0.34−0.44−0.46−0.51
B18−0.06−0.06−0.07−0.09−0.38−0.44−0.50−0.56−0.34−0.32−0.32−0.33
B190.020.070.110.15−0.43−0.55−0.61−0.67−0.16−0.17−0.16−0.17
B200.030.040.120.12−0.49−0.52−0.50−0.500.030.110.150.18
Publisher’s Note: MDPI stays neutral with regard to jurisdictional claims in published maps and institutional affiliations.

