Article

Assessment of Groundwater Flow Dynamics Using MODFLOW in Shallow Aquifer System of Mahanadi Delta (East Coast), India

by
Ajit Kumar Behera
1,2,*,
Rudra Mohan Pradhan
3,
Sudhir Kumar
4,
Govind Joseph Chakrapani
1 and
Pankaj Kumar
5,*
1
Department of Earth Sciences, Indian Institute of Technology Roorkee, Roorkee 247 667, India
2
Marine Geoscience Group, National Centre for Earth Science Studies, Thiruvananthapuram 695 011, India
3
Department of Earth Sciences, Indian Institute of Technology Bombay, Powai 400 076, India
4
Hydrological Investigations Division, National Institute of Hydrology Roorkee, Roorkee 247 667, India
5
Institute for Global Environmental Strategies, Kamiyamaguchi, Hayama 2108-11, Kanagawa, Japan
*
Authors to whom correspondence should be addressed.
Water 2022, 14(4), 611; https://doi.org/10.3390/w14040611
Submission received: 20 December 2021 / Revised: 11 February 2022 / Accepted: 15 February 2022 / Published: 17 February 2022

Abstract

:
Despite being a biodiversity hotspot, the Mahanadi delta is facing groundwater salinization as one of the main environmental threats in the recent past. Hence, this study attempts to understand the dynamics of groundwater and its sustainable management options through numerical simulation in the Jagatsinghpur deltaic region. The result shows that groundwater in the study area is extensively abstracted for agricultural activities, which also causes the depletion of groundwater levels. The hydraulic head value varies from 0.7 to 15 m above mean sea level (MSL) with an average head of 6 m in this low-lying coastal region. The horizontal hydraulic conductivity and the specific yield values in the area are found to vary from 40 to 45 m/day and 0.05 to 0.07, respectively. The study area has been calibrated for two years (2004–2005) by using these parameters, followed by the validation of four years (2006–2009). The calibrated numerical model is used to evaluate the net recharge and groundwater balance in this study area. The interaction between the river and coastal unconfined aquifer system responds differently in different seasons. The net groundwater recharge to the coastal aquifer has been estimated and varies from 247.89 to 262.63 million cubic meters (MCM) in the year 2006–2007. The model further indicates a net outflow of 8.92–9.64 MCM of groundwater into the Bay of Bengal. Further, the outflow to the sea is preventing the seawater ingress into the shallow coastal aquifer system.

1. Introduction

The coastal aquifer is one of the most important water resources in coastal regions that supplies water to more than a billion people worldwide [1,2,3] and connects the world’s oceanic and hydrologic systems [4]. The general hydrogeological characteristics of the coastal aquifers are influenced by geologic environments, mixing zones, long and short-term sea fluctuations, and the density gradients due to differences in salinity [1]. In general, groundwater is an attractive source of water (15,300 × 103 km3) as it is fresh and readily available [5,6]. However, the groundwater of coastal regions is more susceptible to deterioration due to several factors, such as rapid urbanization, intensified agricultural development, economic development, climate change, sea-level rise, and lack of sufficient surface water resources [7,8,9]. The effect of groundwater withdrawal on coastal aquifer systems with the smallest topographic gradient is more pronounced than the impact of sea-level rise and variation in groundwater recharge due to the dynamic nature of surface water–groundwater interaction [3]. Consequently, the coastal aquifer will become more saline due to saltwater intrusion and make this precious water resource unfit for consumption without any sophisticated treatment [10]. Therefore, it is essential to set up a diligent monitoring system, e.g., using numerical models for evaluating the maximum viable pumping rates to protect from seawater intrusion in the coastal aquifers [11].
Various tools and techniques viz. statistical analysis, water quality index development, hydrochemical analysis, hydrological modeling, etc. are being used to assess and monitor water resources in the coastal aquifers. The groundwater models are the conceptual description that describes the physical systems through mathematical equations [12,13]. Groundwater modeling is based on three techniques i.e., finite element method [14,15,16], analytical element method [17], and the finite difference method [18,19,20]. Essink 2001 [21] established a density-dependent groundwater flow model to examine the effect of seawater intrusion in the coastal aquifer system of the Netherlands. Similarly, the numerical model (MOCDENS3D) study helped to calculate the fluctuations in coastal groundwater flow [10,22,23]. Numerical models have been used by several researchers to estimate the regional groundwater budget in different aquifer systems [24,25,26,27], to predict the consequences of proposed development actions, to link any connection between locations and aquifer boundaries, and to assess the groundwater quality within the aquifer system and the amount of natural recharge to a particular aquifer [12]. A visual MODFLOW software package has been used worldwide for groundwater flow simulation as it is user-friendly and robust [28,29]. A SEAWAT model is a transport and density-dependent groundwater flow model generally used to understand the saltwater intrusion processes [30]. However, a 3D finite element model is more advanced technology and can be used to simulate the saltwater intrusion for single as well as multiple complex coastal aquifer systems [31]. The development of groundwater models along with management models is useful to make proper decisions in optimal usage and management of groundwater resources [32]. The advantages of applying these models or codes lie in simplification of the aquifer system with certain limitations. Accordingly, we can make future plans or decisions on the usage of groundwater resources and predict the groundwater condition. In the case of a complex aquifer system, execution of the model takes a lot of time, which is one of the major disadvantages of using the modeling technique.
Odisha state on the East coast of India is home to a rich ecosystem and biodiversity but is very vulnerable to rapid global changes due to poor adaptive capacity [33]. Jagatsinghpur is considered to be a disaster-prone region as it experiences floods and cyclones almost every year. Despite this, the local habitants of this region still depend on agriculture for their survival and use groundwater for drinking water and irrigation purposes. Further, the heavy abstraction of groundwater from the deep aquifer system leads to groundwater salinity in some parts of this region. Again, this situation forces the villagers to depend on shallow fresh groundwater for daily usage. Freshwater resources act as a limiting factor for human well-being and sound environmental development. Data scarcity is one of the biggest challenges here to design any robust management plans. Among a few, one of the studies focuses on participatory coastal land-use management (PCLM) that was introduced in the coastal aquifers of the Brahmani River basin of Odisha for the sustainable management of water resources based on simulated water quality [33]. Further, one study reported numerous ecosystem services this area provides and highlights the need for preservation of the mangroves of Bhitarkanika and Mahanadi delta, which reduces the coastal degradation and protects the coastal aquifers from salinity [34].
So far, no such numerical simulation has been conducted on groundwater flow dynamics in this area. Therefore, this study has been attempted for the first time using a modeling technique to understand the groundwater flow pattern and behavior of the shallow aquifer of this coastal region influenced by hydrological components based on calculated water flux. We have also used MODFLOW software packages for this study because of their flexible modular units to represent hydrogeological conditions. Besides, MODFLOW is an easily available software package in the public domain, which can be used to calculate water balance for small-scale aquifer systems. This will help to estimate the optimal use of shallow groundwater to prevent seawater inflow. Considering this first of its kind of study, the result will prove to be a milestone for the decision-makers in designing better water management plans.

2. Study Area

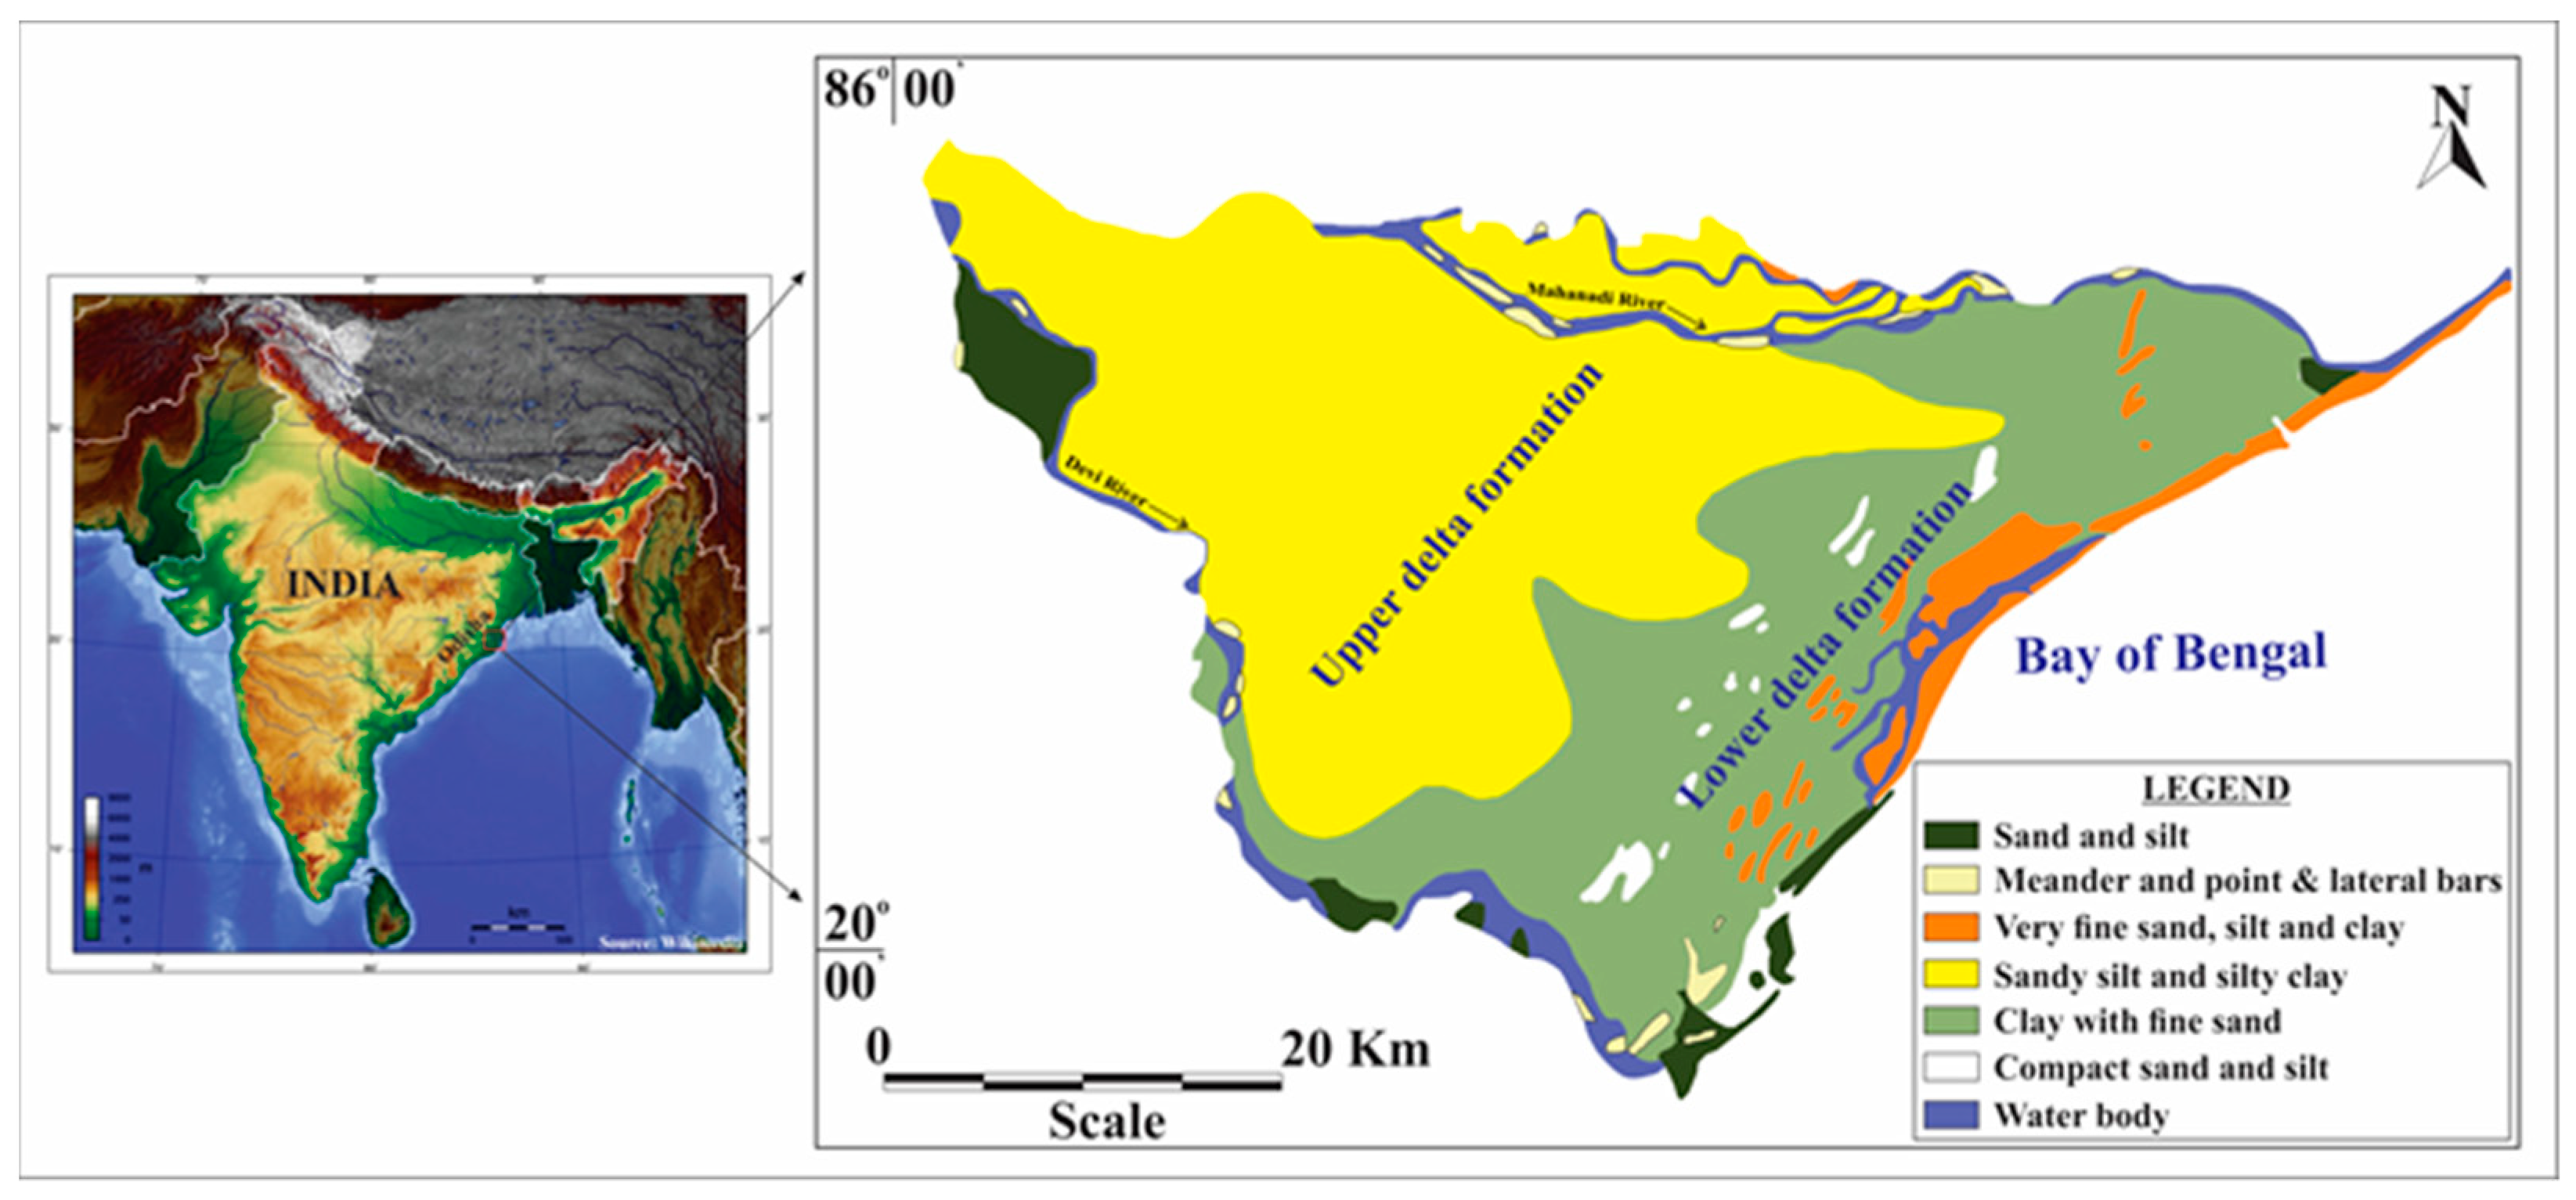
The coastal aspects of Odisha, consisting of alluvial formation for agricultural activities and fresh water in the coastal aquifer system, are the key factors that attract the people to live in these regions. There are six coastal districts along the coastal tract (480 km) of Odisha [35]. Jagatsinghpur district is one of the districts in the coastal belts with a geographical area of 1668 km2 and nearly 1.1 million population residing in these regions [35]. Geographically, the Jagatsinghpur area is located between longitude 86°03′ to 86°45′ E and latitude 19°53′ to 20°23′ N (Figure 1). This coastal region is a part of the Mahanadi delta, surrounded by two rivers i.e., the Mahanadi River (flowing from west to east) and the Devi River (flowing from north-northwest to south-southeast) forming the northern boundary, and the southern and western boundary of the district, respectively, and Bay of Bengal in the eastern part [36]. The study area comprises the central and middle part of the Mahanadi delta with a thick deposition of quaternary sediments. As it belongs to the coastal region, possible vulnerabilities, e.g., sea-level rise, saltwater intrusion, and frequent climate variations, may affect the study region. The average annual rainfall in this region is 1436 mm and is received mainly from the southwest monsoon. As the study area is a part of a deltaic region, it mainly consists of thick sediments supplied by the rivers, such as Mahanadi, Birupa, Kathjodi, Devi, and Kuakhai. Moreover, it has a gentle slope towards the Bay of Bengal [37,38].
Agricultural sectors are the major activities in these regions, and the key crops of the district are paddy, turmeric, sugarcane, cotton, and jute. The population of the district is largely dependent on the monsoon for irrigation, which is very erratic. Due to its geographical situation, the regions face acute natural calamities, e.g., floods, cyclones, and droughts. Almost all blocks of the Jagatsinghpur coastal district were severely affected by the super cyclone, with a wind speed of above 200 km/h on 29 October 1999 [39]. The places like Ersama, Kujang, and Balikuda were submerged due to the tidal wave (Height > 7 m) of the Bay of Bengal and this super cyclonic storm brought destruction to homes, human life, livestock, and other property [39,40]. The incidence of drought has been predicted due to the increase of surface air temperature at the rate of 1.1 °C per century over the Mahanadi Basin and reduced effective rainfall [41]. Hence, agricultural production is affected by soil salinity, waterlogging, and natural disasters. Further, different industries, such as fisheries, manufacturing, and processing, also contribute to economic development and the Jagatsinghpur district is one of the leading districts in the state in terms of industrialization, housing many industries related to fertilizers and petroleum products.
Figure 1. Location map of Jagatsinghpur coastal area, Odisha, India [36,42].
Water 14 00611 g001

3. Hydrogeology

The deltaic region of Jagatsinghpur belongs to the quaternary formation that covers recent sediments of flood plain deposits of the Mahanadi River and the Devi River. These are mainly comprised of gravel, sand (fine to coarse grain), silt, and clay (black, red, and yellow) materials [42]. These unconsolidated to semi-consolidated materials act as a good repository of groundwater resources. The lower part of this study area lying close to the coast is characterized by low lying wet plains, fine-grained sediments, tidal infected rivers, tidal creeks, swamps, ill drainage of land, and non-development of levees [37]. This coastal tract acts as a favorable zone of groundwater availability due to the large thickness of sediments of varying sizes deposited in this part of the study area. The aquifer system of the Jagatsinghpur area is divided mainly into two zones, i.e., a shallow aquifer zone (<50 m thickness) and deeper aquifer zone (50–300 m thickness) below ground level [35].

4. Methodology

The groundwater flow simulation can be performed through Visual MODFLOW, which integrates the modular 3D finite-difference groundwater flow code [20]. Several numerical codes are used to simulate groundwater flow both in local and regional groundwater systems [43]. The groundwater flow equation (Equation (1)) is used in MODFLOW to know the groundwater flow in three different directions for this study [12].
x   ( K x h x ) + y   ( K y h y ) + z   ( K z h z ) =   S s h t R
where Kx, Ky, and Kz refer to hydraulic conductivity in three different directions; Ss, h, and R represent specific storage, hydraulic head, and sink or source, respectively. Visual MODFLOW is based on the finite-difference mathematical equation (Equation (2)) with assumptions of constant density and viscosity of groundwater flow under transient state conditions [44].
K x   2 h x 2 + K y 2 h y 2 + K z 2 h z 2   ± W = S s h t
Hydraulic head value does not change with time under steady-state conditions. This condition expresses as (Equation (3)).
K x   2 h x 2 + K y 2 h y 2 + K z 2 h z 2 = 0
Visual MODFLOW has several solvers, such as Preconditioned Conjugate Gradient (PCG), Strongly Implicit Procedure (SIP) package, WHS solver for Visual MODFLOW package (WHS), Slice Successive Over Relaxation (SOR) package, and Geometric Multigrid solver (GMG) package, are used to solve the numerical equation for groundwater flow simulation purposes. For this study, the WHS solver package with Bi-Conjugate Gradient Stabilized (Bi-CGSTAB) accelerator us used to resolve the partial differential equations through iterative procedures.

4.1. Development of the Model

The groundwater model starts with the development of a groundwater flow model for a particular study area, which represents its physical condition. Similarly, for this study, a model consisting of a single layer has been conceptualized based on geology, lithologs, river boundary conditions, and groundwater level data sets [45]. The shallow unconfined aquifer composed of unconsolidated formation up to 50 m depth has been considered as the modeled single layer. After preparing a conceptual model, it is translated into a numerical model with the help of the Visual MODFLOW software package. The numerical model is developed through several steps. The input parameters in the conceptual model are presented in Table 1.

4.1.1. Discretization of the Study Area

The model study area covers 1668 km2 and is gridded into 9394 cells with 77 rows (I = 77) and 122 columns (J = 122) and each cell consists of 600 m × 600 m blocks (Figure 2). The modeled layer thickness varies approximately from 30 to 50 m in the study area. The layer elevation and ground elevation data are imported in Visual MODFLOW through an ASCII file.

4.1.2. Hydraulic Head Data

Hydraulic head data of eleven (11) different observation wells were collected from the Central Ground Water Board (CGWB) in the Jagatsinghpur coastal aquifer system for this study. The hydraulic head varies from 0.7 m near the sea coast to 15 m away from the shoreline. For groundwater flow simulation, 1 January 2004 has been taken as the initial time. Annually, four different periods of head data (from the year 2004 to 2009) have been used for both calibration and validation of the model. These head data have been categorized as post-monsoon (Rabi), pre-monsoon, monsoon, and post-monsoon (Kharif).

4.1.3. Boundary Conditions

The Visual MODFLOW simulates the groundwater flow followed by different types of boundary conditions. In the Jagatsinghpur coastal aquifer system, two types of boundaries have been used (Figure 2). The Bay of Bengal is considered as a constant head boundary or Dirichlet boundary [46]. Two large perennial rivers, i.e., the Mahanadi River and its distributary the Devi River, flowing along the two flanks of the study area are considered as the Cauchy boundary or head-dependent flux boundary. The river conductance value can be determined from Equation (4) [29].
C RIVER   = K r ×   L   ×   W r B
where Kr = hydraulic conductivity of the river bed (m/day), L = length of the reach/grid size (m) Wr = width of the river (m), and B = thickness of the river bed (m). The river bed conductance of two rivers is approximately the same, i.e., 30,000–35,000 m2/day [35].

4.2. Hydrological Parameters

The model domain is classified into three hydraulic conductivities and specific yield zones for this single unconfined aquifer system (Figure 2), which also belongs to the alluvial formation of the Mahanadi delta. The horizontal hydraulic conductivities (Kh) are 40 m/day, 42 m/day, and 45 m/day for ZONE I, ZONE II, and ZONE III, respectively, whereas the corresponding vertical conductivity (Kv) of the three zones is 4, 4.2, and 4.5 m/day. The different specific yield values of 0.05, 0.06, and 0.07 for three respective zones I–III were taken during the calibration of the groundwater model (Table 2). As the water table is very close to the ground surface, some groundwater is extracted through the evapotranspiration process. Hence the evapotranspiration data have been taken into consideration for the groundwater simulation model. Further, the study area has been divided into eleven different recharge zones, in which monthly rainfall recharge values have been assigned.

4.3. Calibration and Validation of Model

Calibration is the process through which the calculated head value is subjected to match with the observed head value. The head values from the year 2004 to the year 2005 are taken for calibrating the model for this study. In the present study, the calibration of the model is done through trial and error in which the unknown hydrogeologic parameters are set to be fixed to minimize the head difference between the calculated head and observed head at steady-state conditions. Then, the model is run for 2 years from January 2004 to December 2005 under transient state conditions. The groundwater simulation is said to be a good fit when the computed head value is very close to the observed head value and this good match can be analyzed through calibration criteria, e.g., the mean error (ME) (Equation (5)), the mean absolute error (MAE) (Equation (6)), and the root mean squared error (RMSE) (Equation (7)) [12,47,48]. After calibration, the validation of the model is performed by taking the hydraulic head values from January 2006 to December 2009.
Mean   Error   ( ME ) = 1 / n i = 1 n ( h o h c ) i
Mean   Absolute   Error   ( MAE ) = 1 / n i = 1 n [ ( h o h c ) i ]
Root   Mean   Squared   Error   ( RMSE ) = [ 1 / n i = 1 n ( h o h c ) i 2 ]
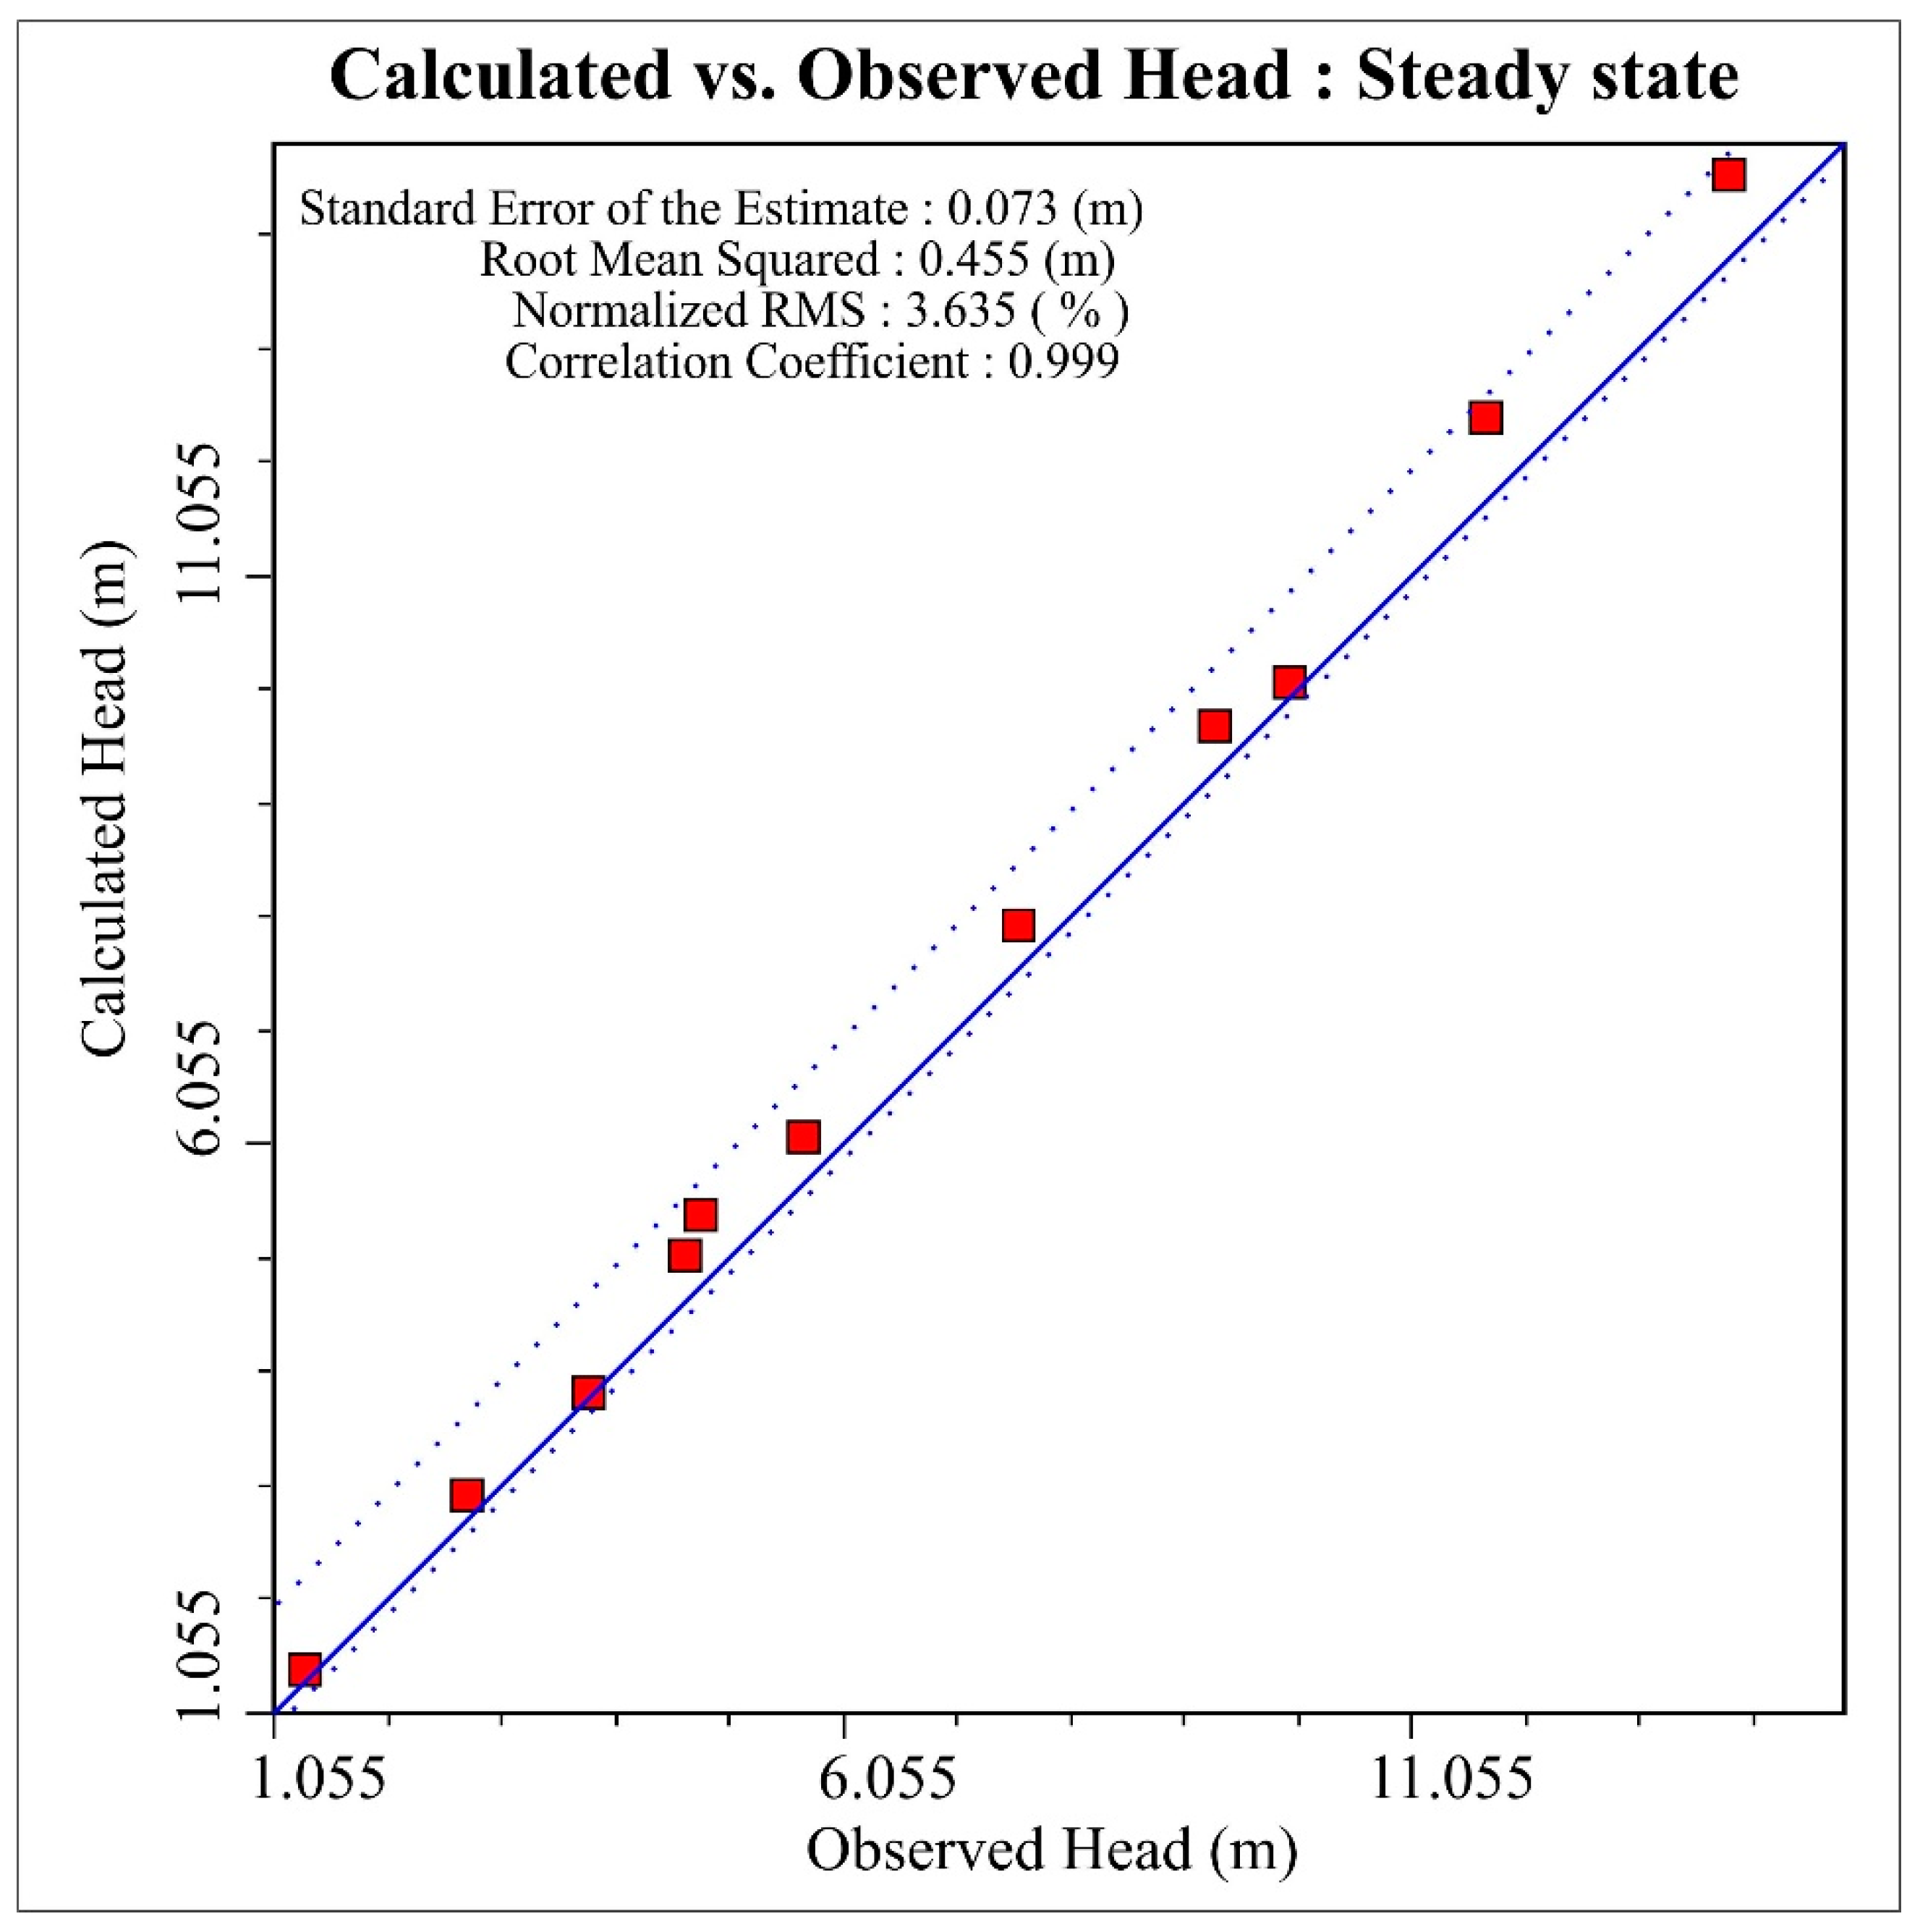
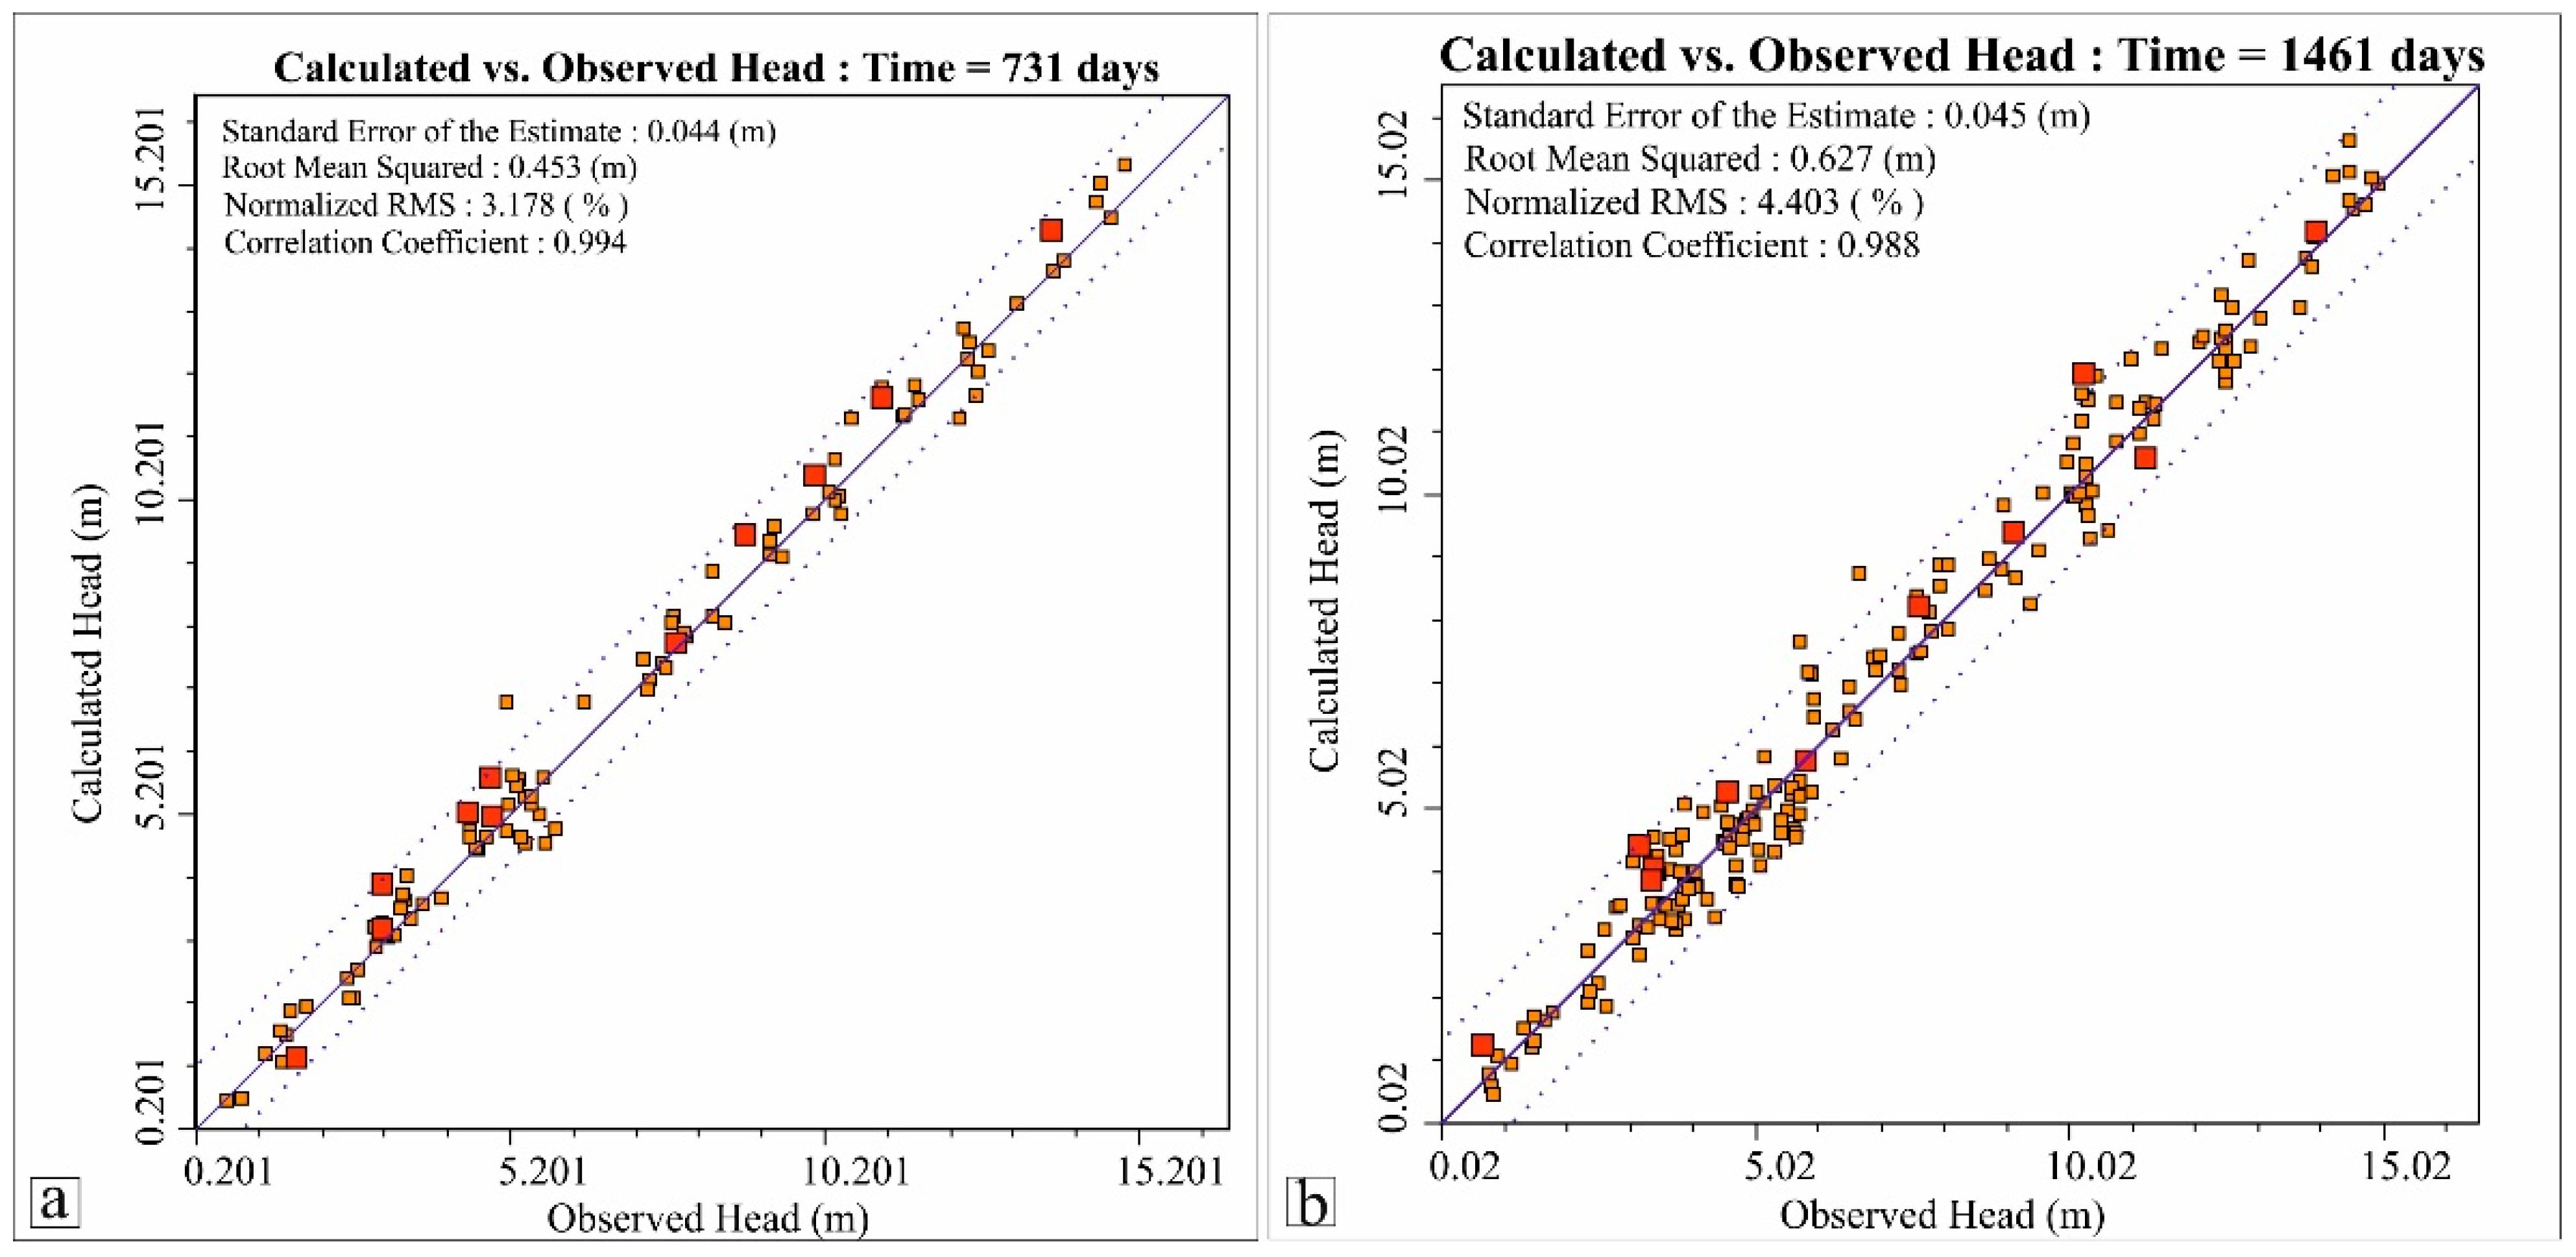
where ho refers to the observed head value, hc the calculated head value, and n the total number of observed data. A statistical analysis of calibrated model under steady-state conditions has been given (Figure 3). Under transient state conditions, the calibrated and validated model indicates a good correlation between the observed head and calculated head in the study area (Figure 4a,b). The correlation coefficient values for calibrated and validated models are 0.994 and 0.988 respectively.

4.4. Parameter Estimation (PEST) Model

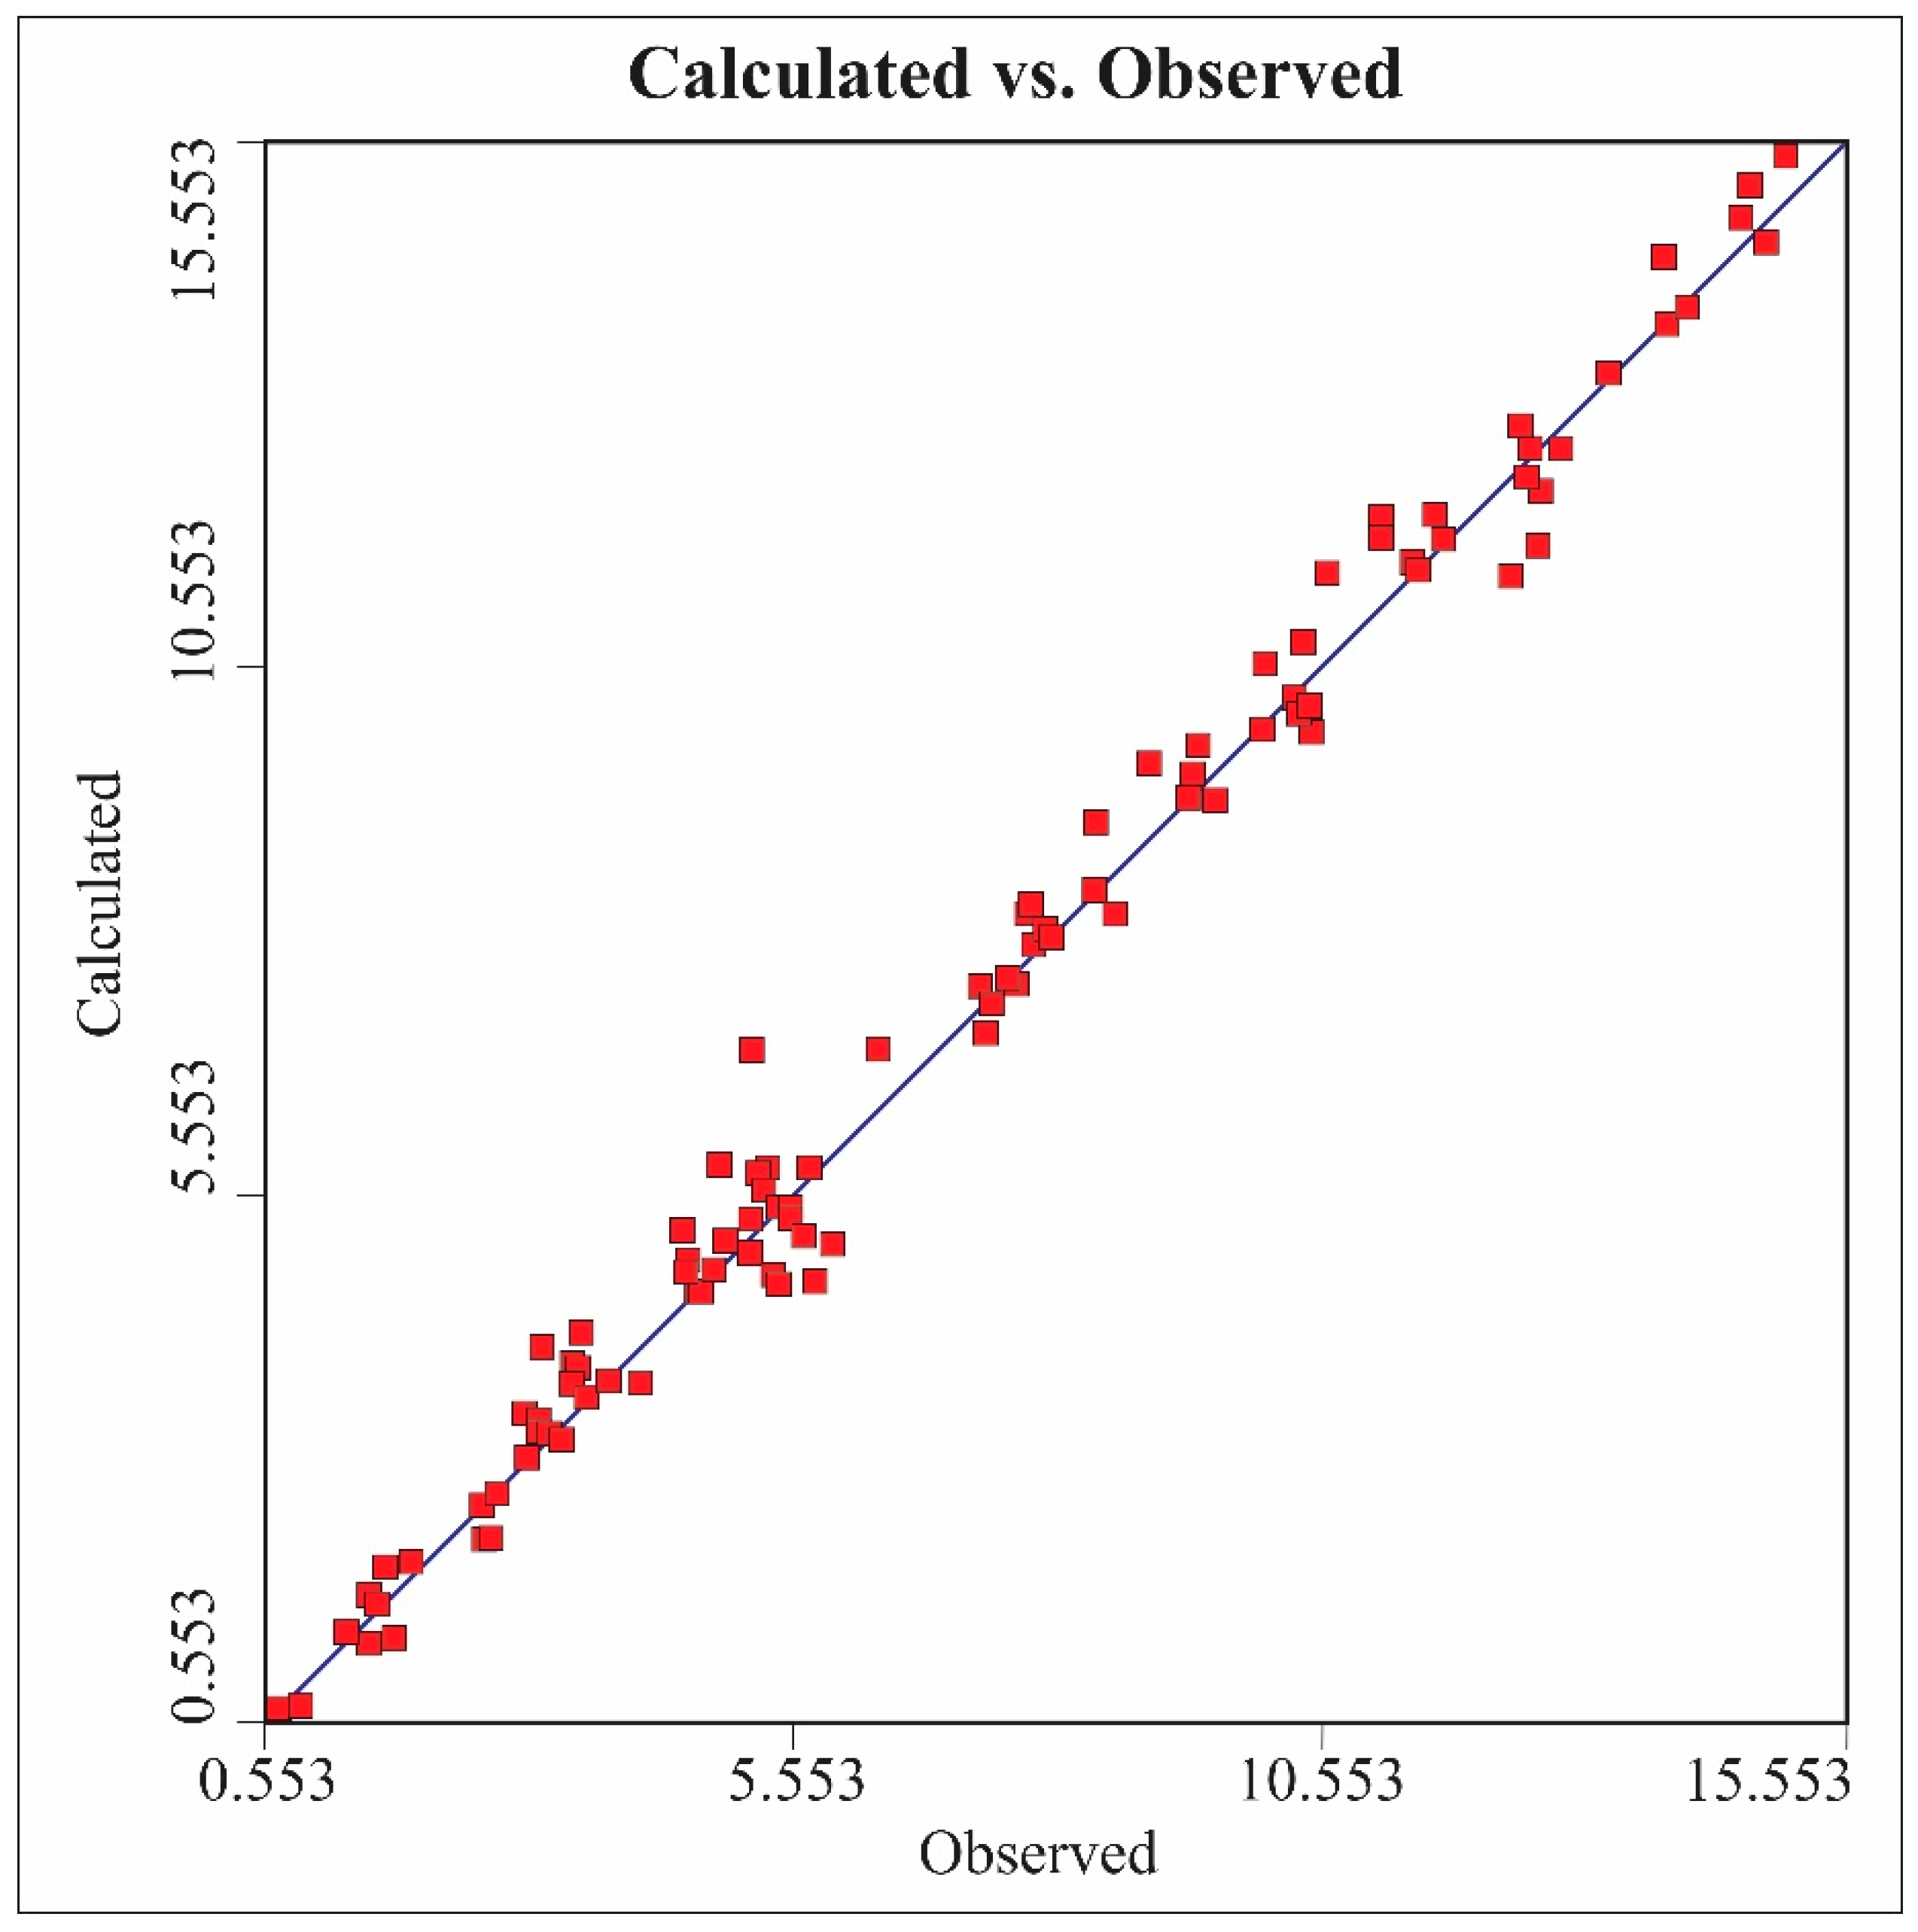
The groundwater model parameters are also estimated by using PEST [49]. Knowling and Adrian (2016) used PEST to minimalize the weighted least squares objective function based on Tikhonov regularization [50]. In this study, the groundwater model has been auto-calibrated with the help of the PEST module of MODFLOW to optimize the aquifer parameters (hydraulic conductivity and specific yield). The calibrated model shows a good correlation between the observed head value and calculated head value with a correlation coefficient value of 0.993 (Figure 5). The automated calibrated (PEST) aquifer parameters (conductivity and specific yield) have been compared to the manually calibrated aquifer parameters, as shown in Table 3. The uncertainty is the process through which the uncertainty on the estimated parameters is quantified to understand the risk associated with different groundwater management models [51].
The estimated parameters viz. specific yield and hydraulic conductivity by the PEST tool have been subjected to uncertainty analysis, which shows a 95% confidence interval between 40.19 and 44.96 m/day (Table 4).

5. Results and Discussion

5.1. Interaction between Aquifer and River

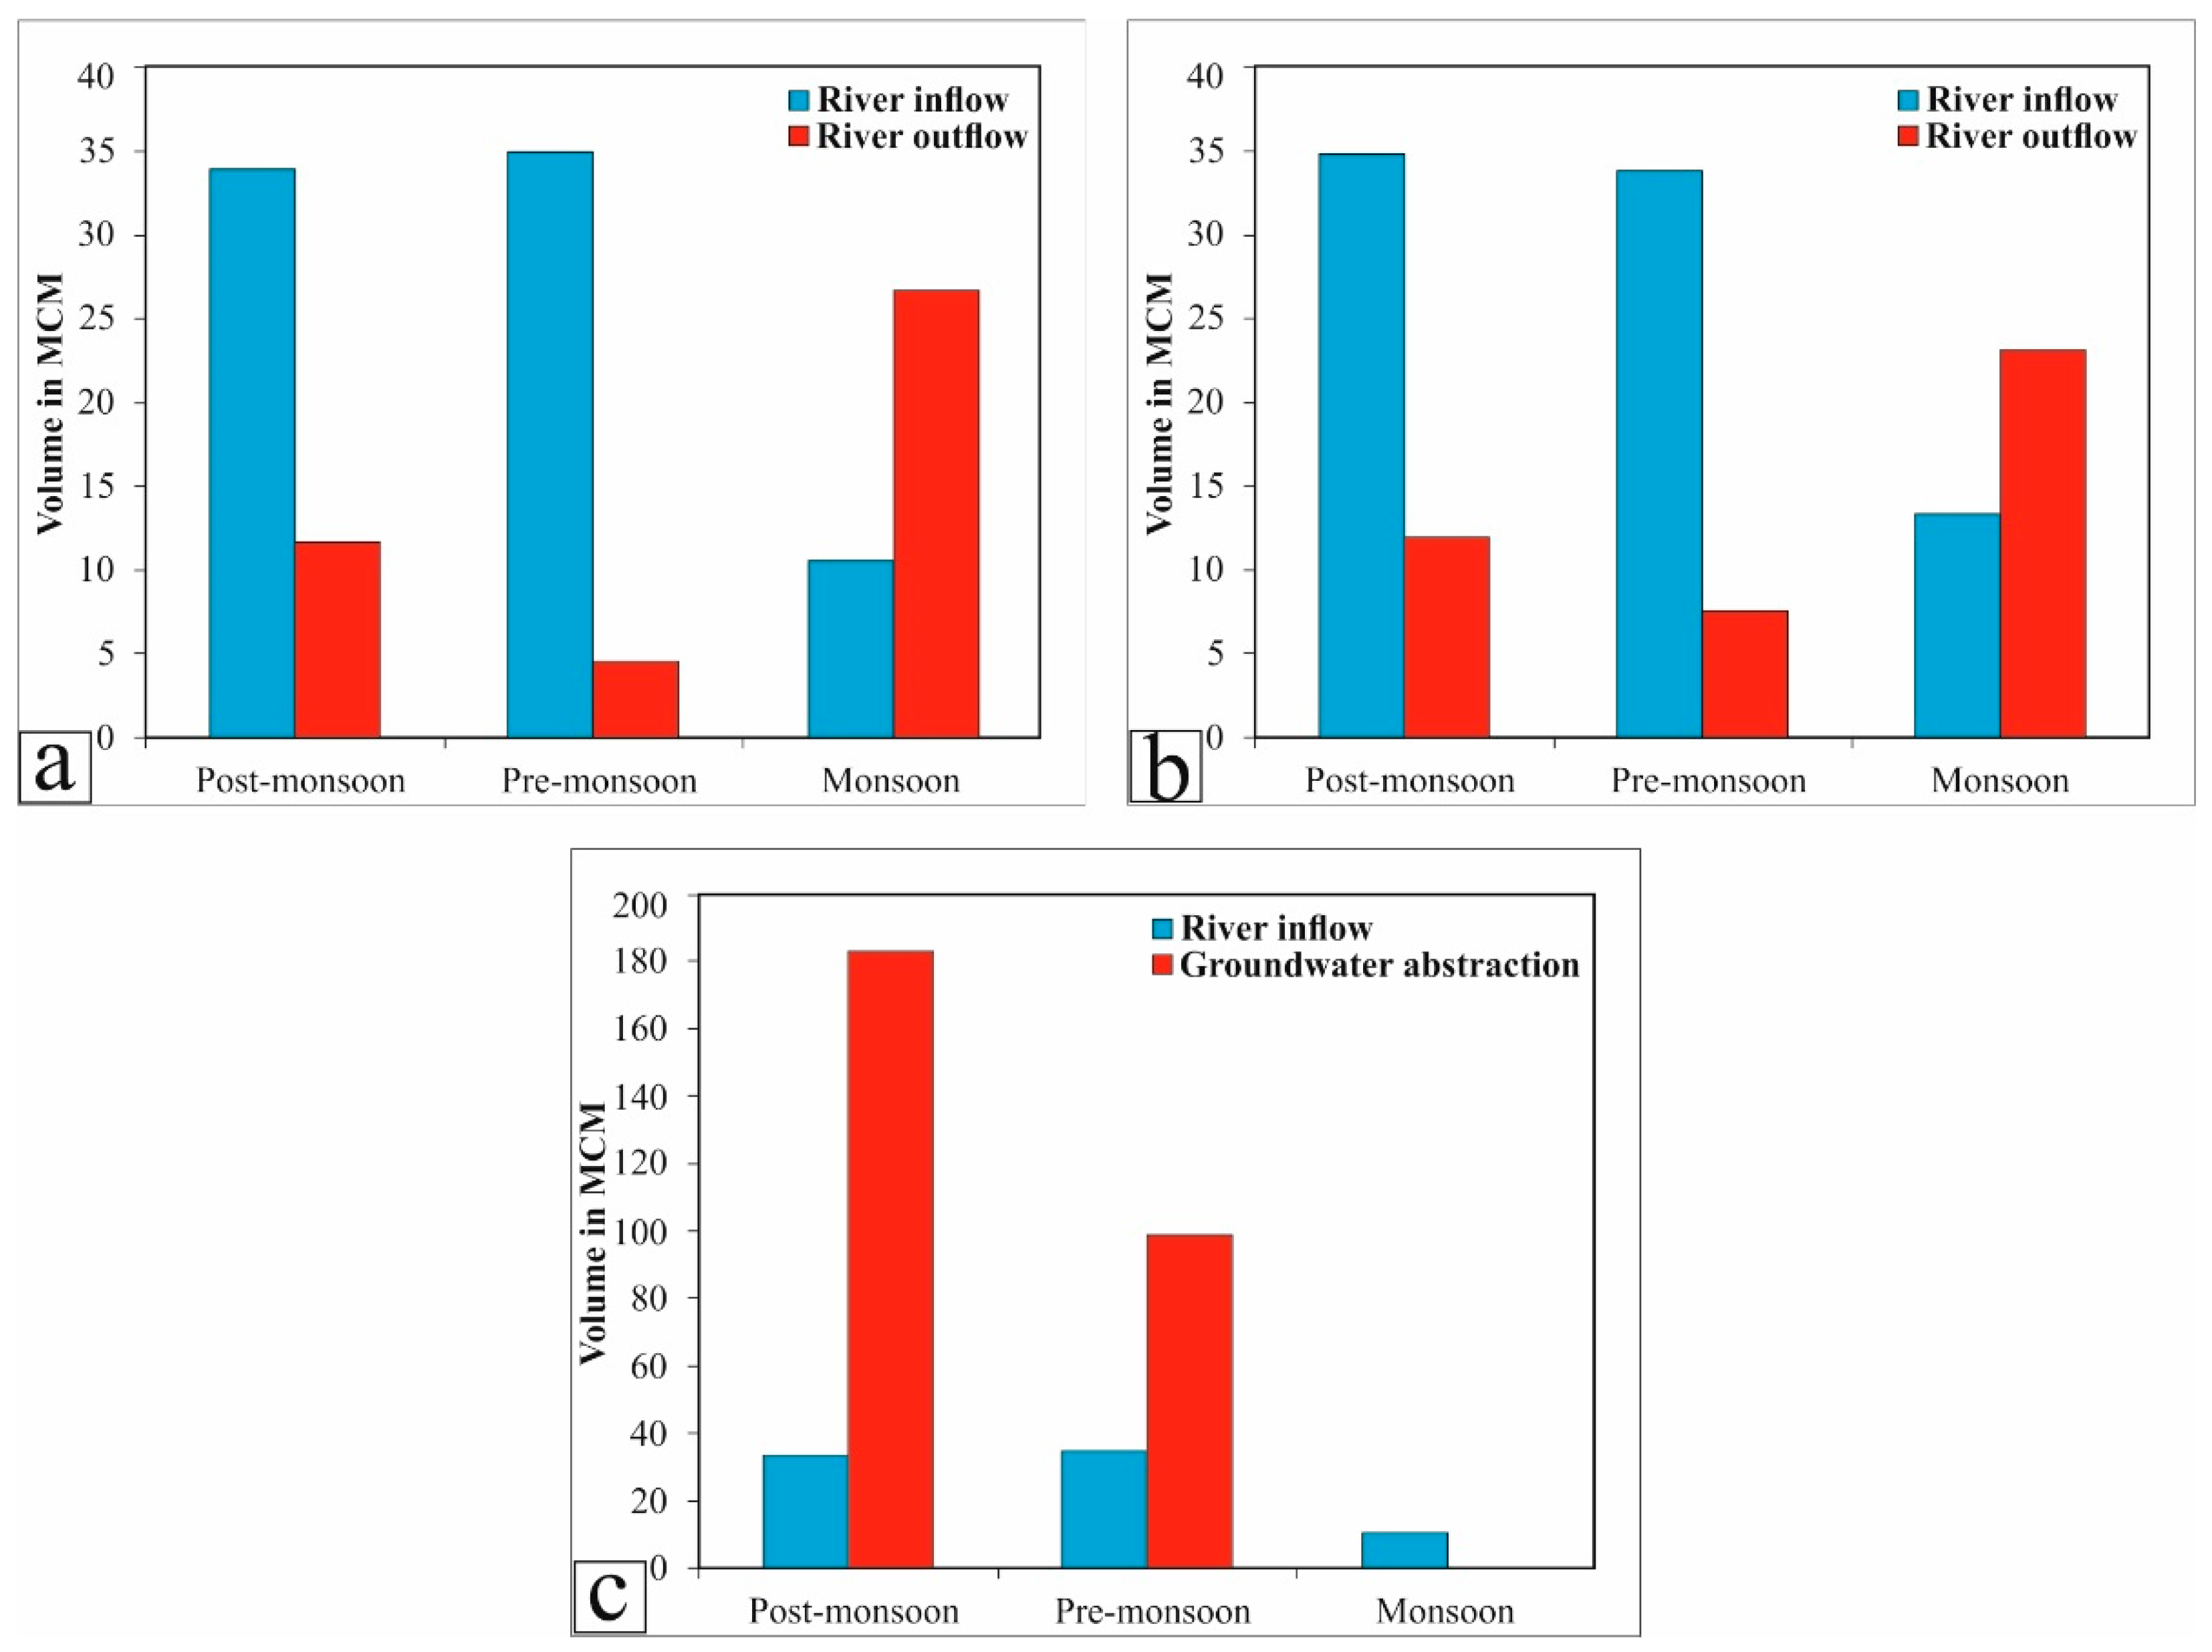
Both inflow from the rivers into the aquifer system and outflow from the aquifer system to the rivers have been observed in a different time period. This unconfined coastal aquifer receives water from rivers in the pre-monsoon and post-monsoon period, whereas the excess amount of groundwater in the form of base flow discharges to the rivers during monsoon season, as shown in Figure 6a,b. The inflow from the river boundary has been estimated as 34 MCM in the post-monsoon and pre-monsoon period in the year 2006–2007. In the monsoon period, the unconfined coastal aquifer system supplies around 23 to 27 MCM of groundwater to the river system after irrigation (Figure 6a,b). This deltaic aquifer system is mostly recharged by rainfall during wet days. Figure 6c shows that the extraction of groundwater is different in different time periods. In the post-monsoon time period, withdrawal of groundwater is more than that of the pre-monsoon period to provide water for post-monsoon crop, though there is available of adequate amount of water in coastal areas to meet the monsoon period Kharif crop [52]. The extracted groundwater for the sustainability of agricultural productivity and livelihoods in the post-monsoon season has been estimated at around 180 MCM in the year 2006–2007 (Figure 6c). This implies that the heavy abstraction of groundwater for agriculture activity and other domestic uses declines the groundwater level of the aquifer system, which is also a respondent of river inflow into the aquifer system. The resultant river inflow of 33.92 MCM of water entering into this coastal aquifer is due to the pumping of groundwater. Similarly, during the pre-monsoon time, the groundwater is extracted to fulfill the water demand for Rabi crops, but the amount of water required is less than that of the post-monsoon season. It is calculated that about 100 MCM of groundwater is pumped out for agricultural activity and other needs, which also causes the inflow of water through the river boundary. When there is groundwater stress, whether less or more, it also affects the river system.
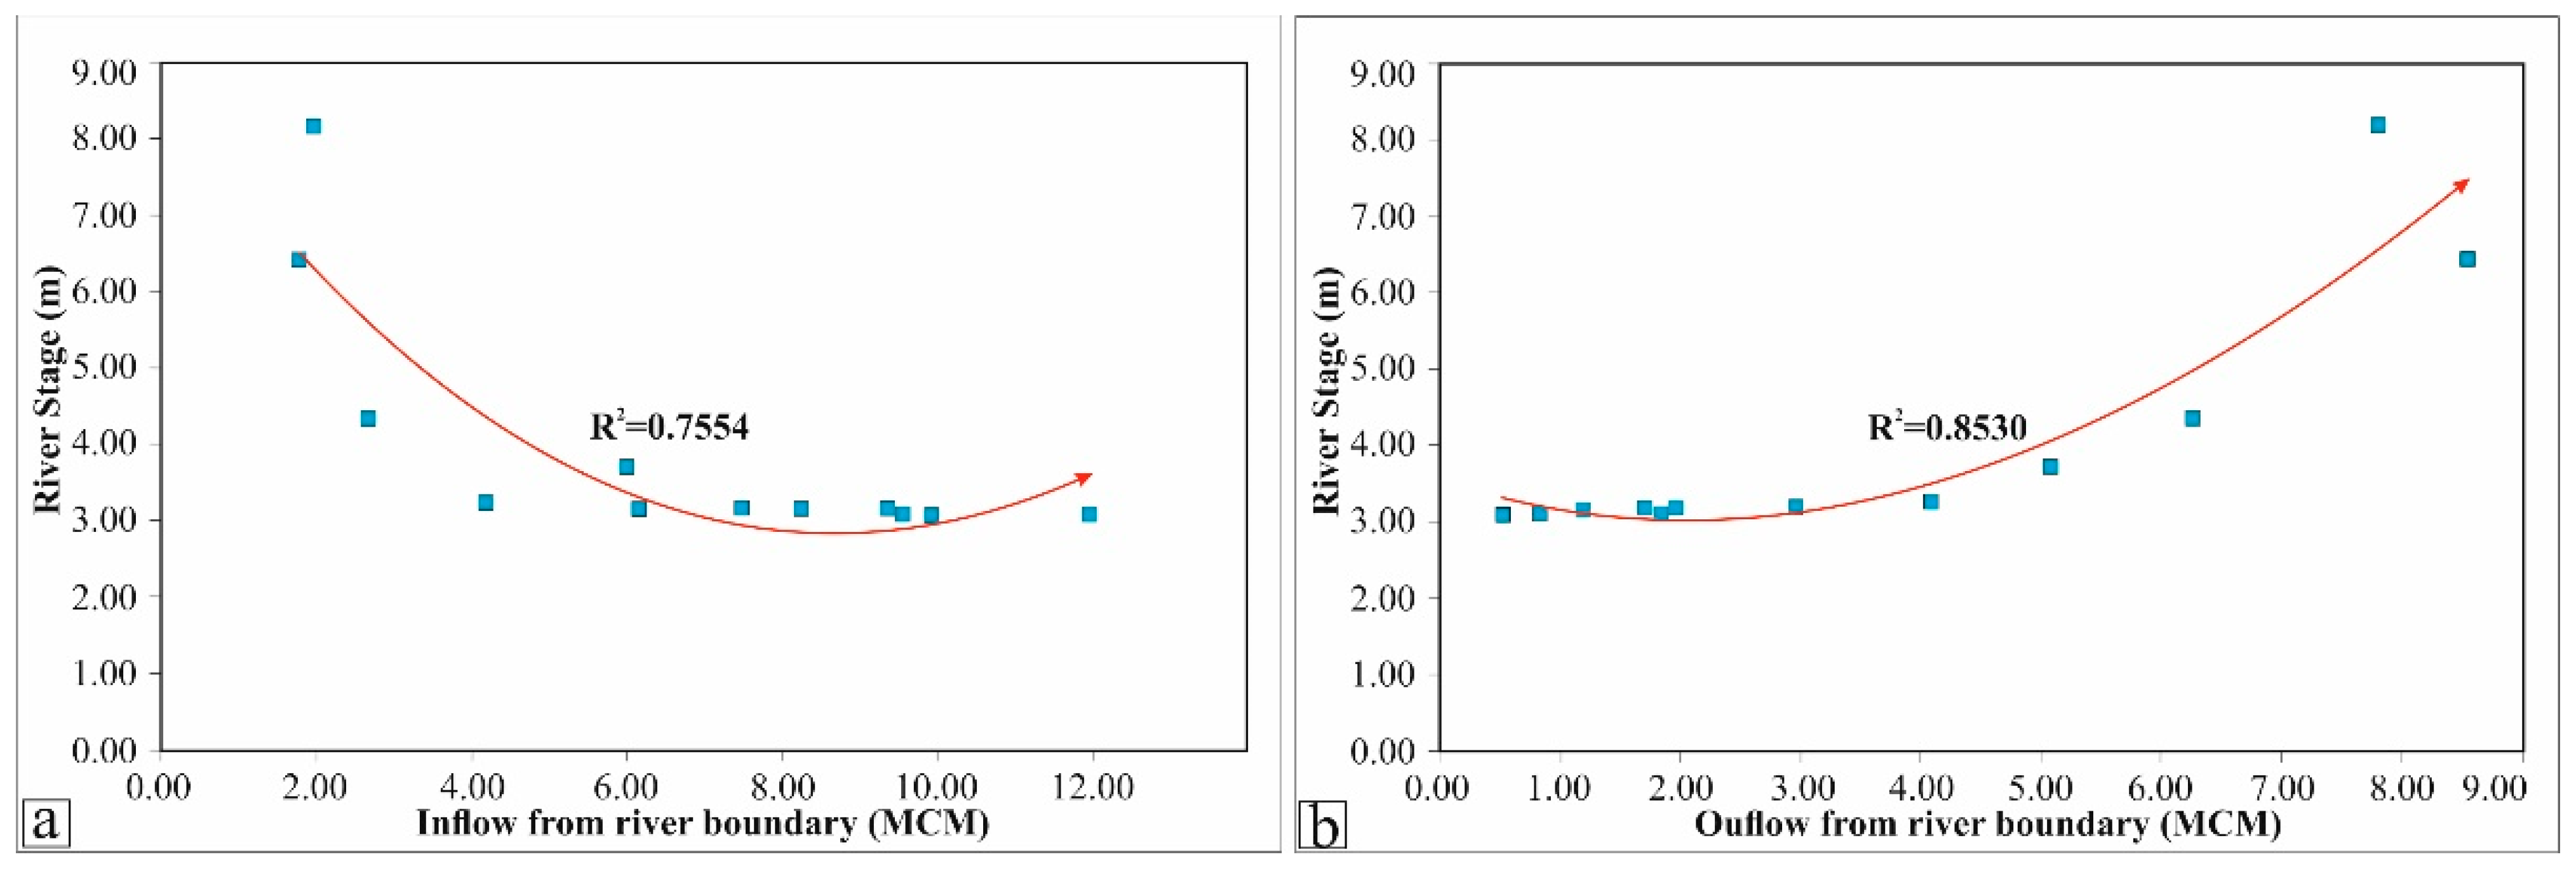
The river–aquifer interaction indicates a good relationship between the river stage and the outflow/inflow from the river boundary (Figure 7a,b).
As the outflow from the river boundary increases, the river stage also increases. The estimated base flow (7.81 MCM) to the river could be one of the factors contributing to the highest river stage value of 8 m in August of the monsoon period. In contrast, the inflow from river boundary to aquifer system during pre- and post-monsoon time causes declination of river stage from 8 to 3 m. According to the estimation, about 10 MCM of water from the river system enter into the aquifer systems during this season. The interpreted result shows the influence of groundwater flux on the river stage and also suggests a good interaction between the river and the coastal aquifer system [52].

5.2. Fluctuation in Groundwater Level

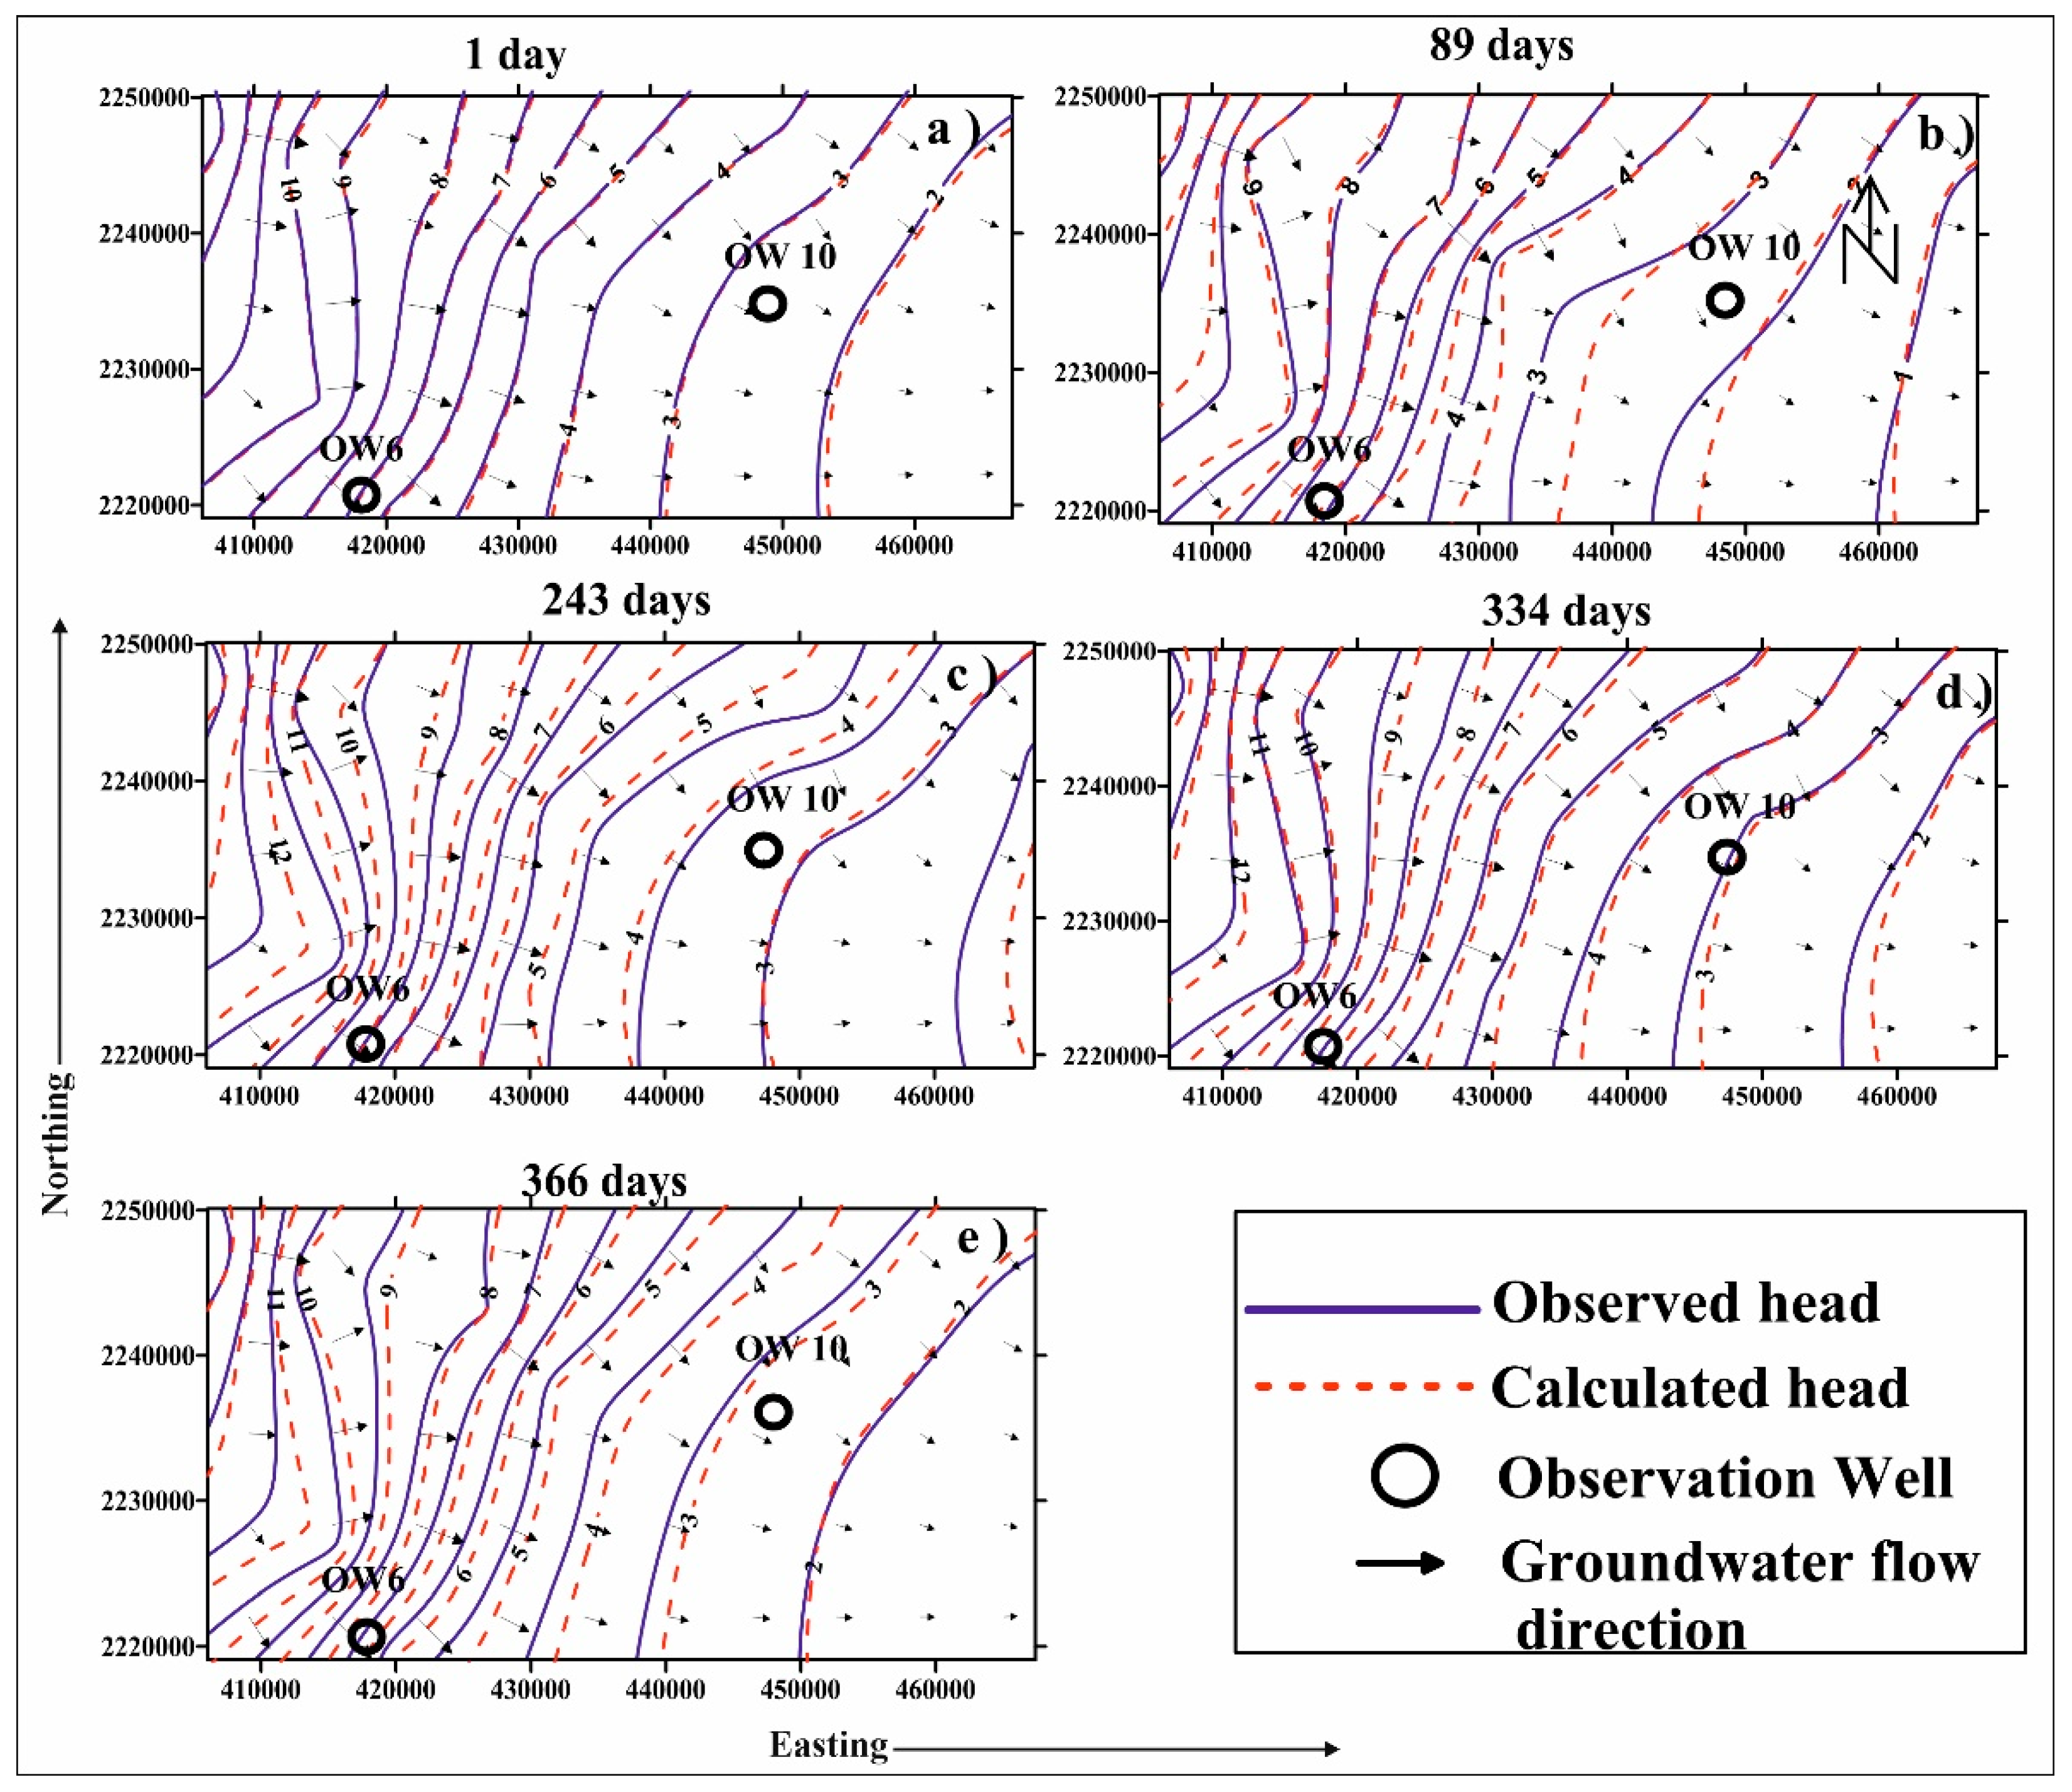
The spatiotemporal variation in groundwater level has been identified in this coastal aquifer system (Figure 8).
The observation well (OW 6) is showing the highest hydraulic head rise of 3.07 m, situated away from the coastal tract of the study area. The lowest hydraulic head rise of 0.75 m has been observed in the observation well (OW 10), which is close to the Bay of Bengal. This spatial variation in hydraulic head rise depends on the topography, rainfall intensity, type of soil, and land-use patterns. Groundwater stress has been observed during the pre-monsoon period. This also results in a decline in groundwater levels due to the absence of rainfall events in between days 1 and 89, as shown in Figure 8. In the case of monsoon and post-monsoon periods (243 and 334 days), the hydraulic head increases from place to place, suggesting that the groundwater is being mostly recharged by rainfall and regained the groundwater potentiality in the study area. The contour lines in the upper part of the study area are very close, which reveals the presence of a high hydraulic gradient and encounters high groundwater movement [53]. Gradually, large spacing between two equipotential lines has been observed close to the sea shoreline, indicating the sluggish movement of groundwater as the presence of a low hydraulic gradient (Figure 8). However, there is an average rise of 1.84 m of hydraulic head in the monsoon period as compared to the pre-monsoon period, which implies that the shallow aquifer of this coastal region is recharged quickly due to rainfall events. This suggests that sustainable management of coastal aquifers is required during dry periods as there is an absence of a primary recharge source (i.e., rainfall).

5.3. Groundwater Recharge Estimation

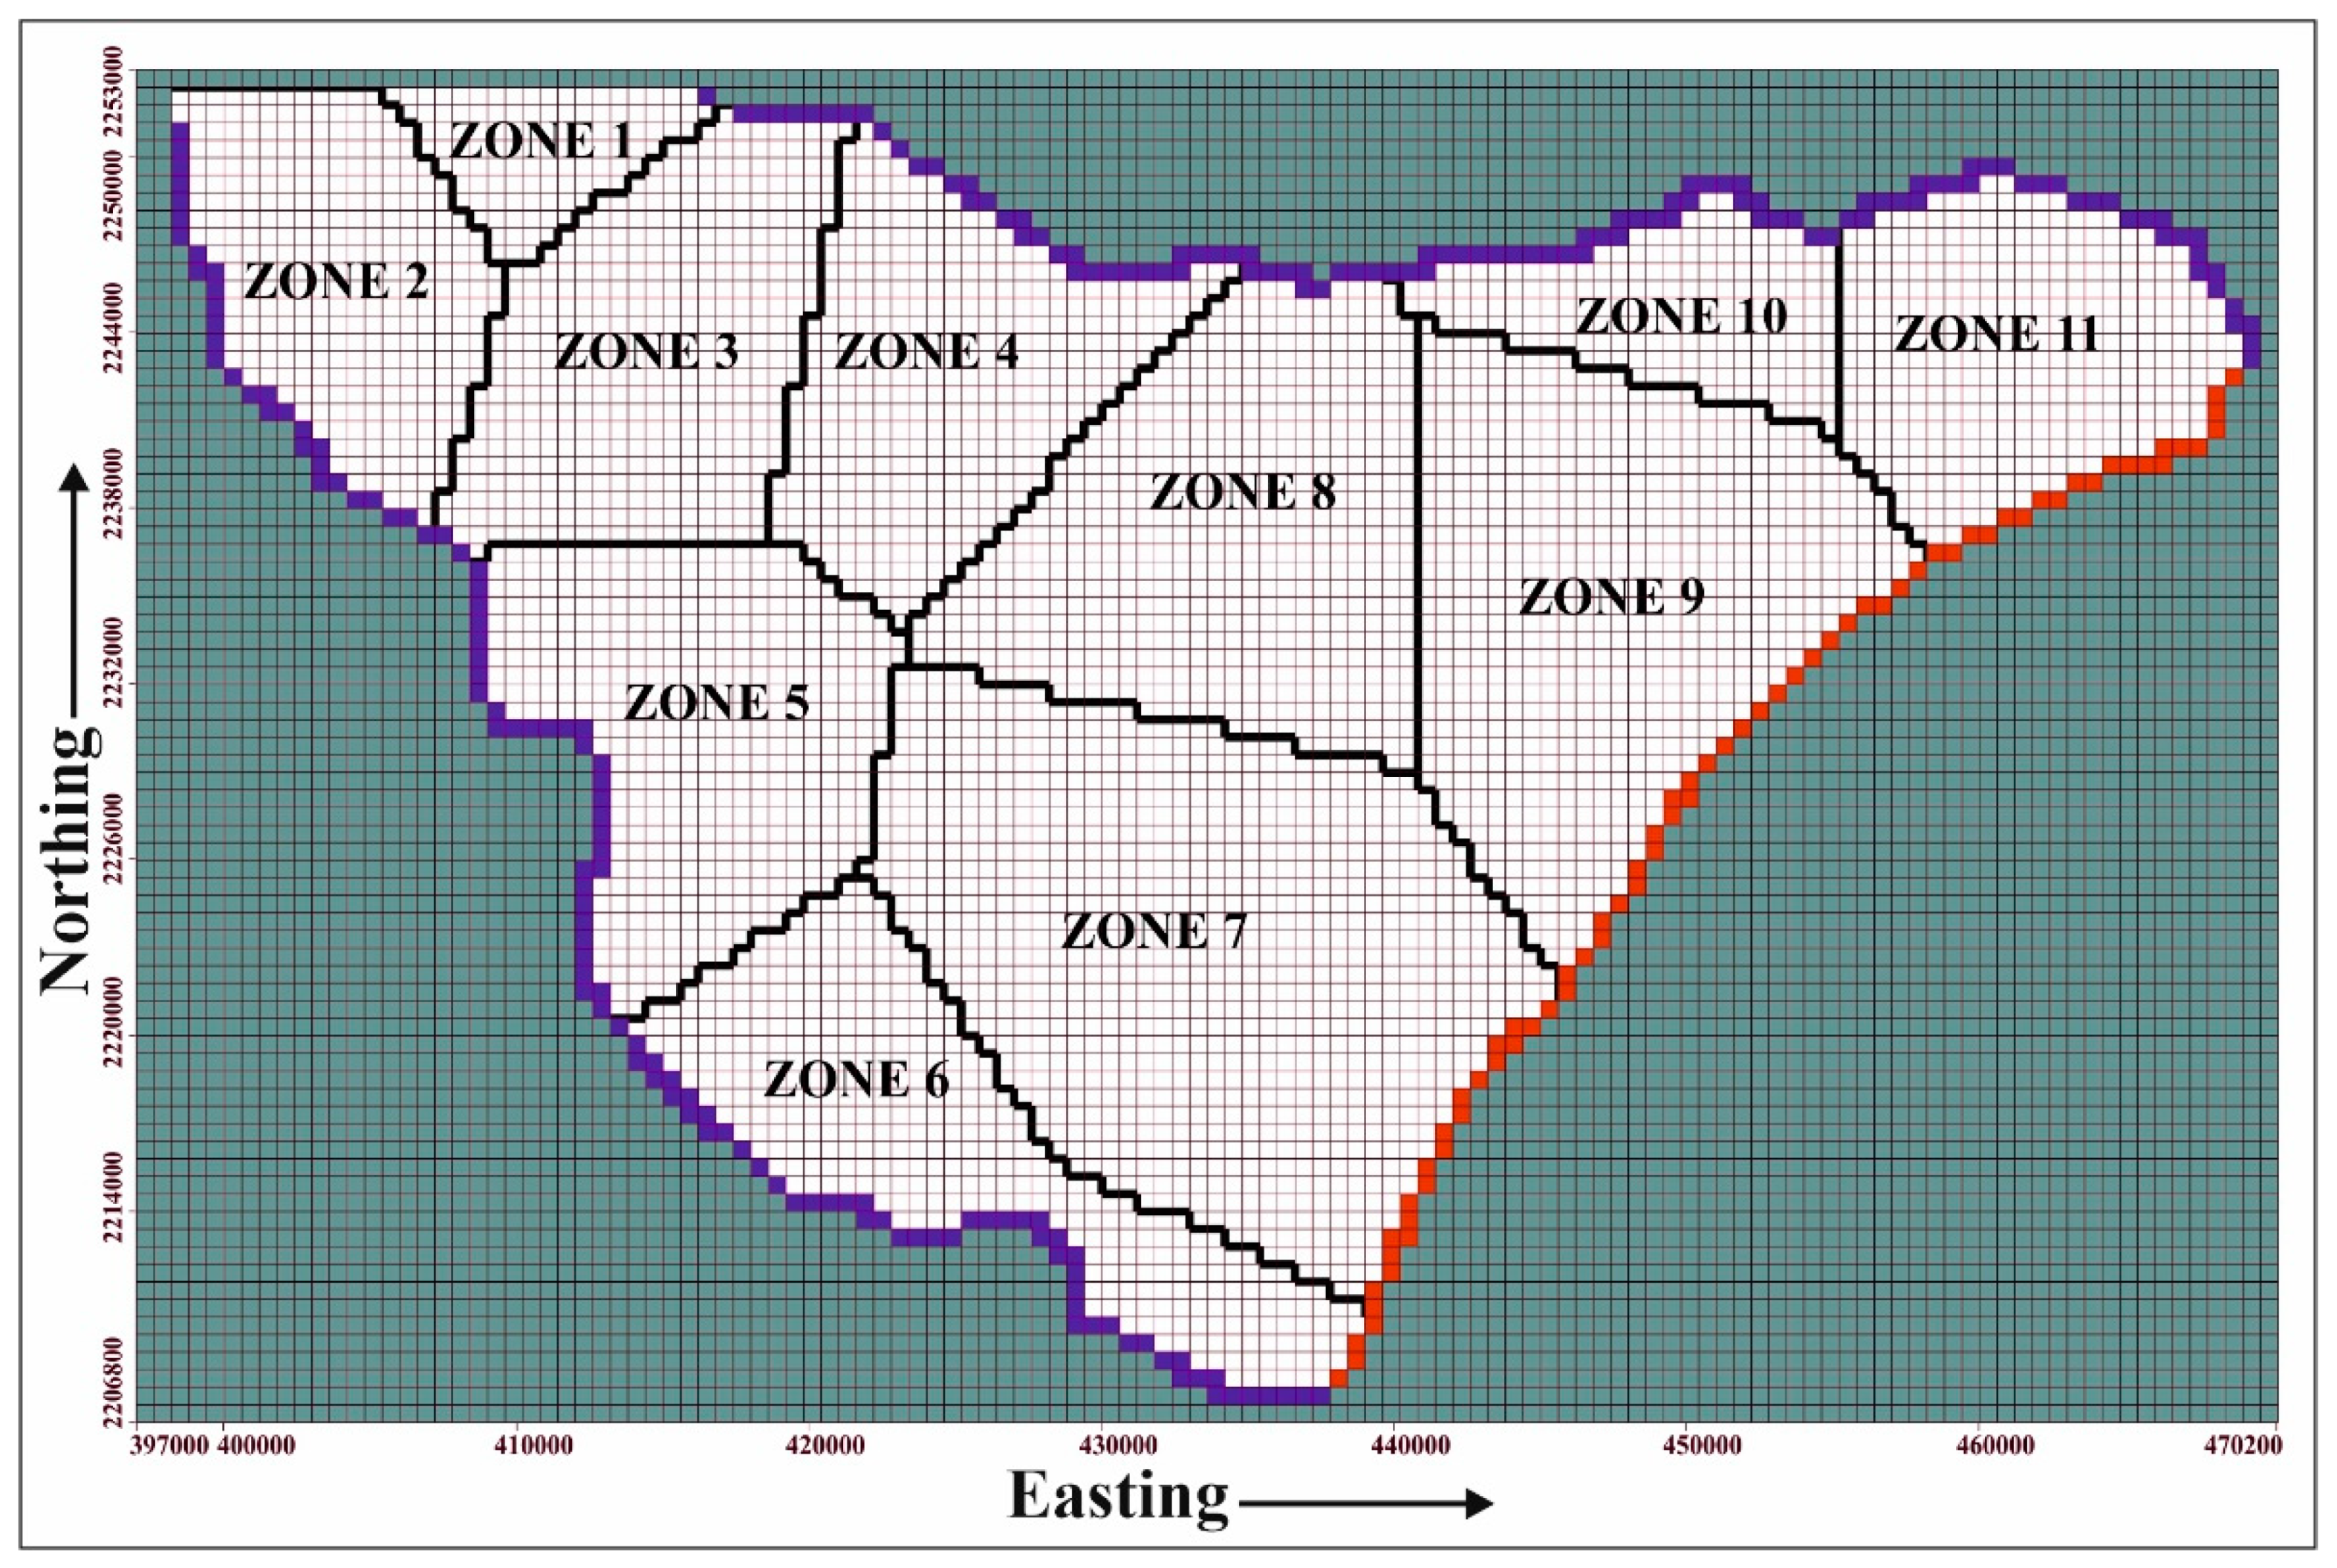
In this area, rainfall, seepage from the riverbed, and irrigation return flow are the major sources of groundwater recharge. Groundwater recharge estimation plays a vital role in the optimal development and efficient management of fresh groundwater resources in coastal areas. The study area of the Jagatsinghpur district is divided into eleven recharge zones (Figure 9) in the form of Thiesen polygons to estimate the groundwater recharge [43].
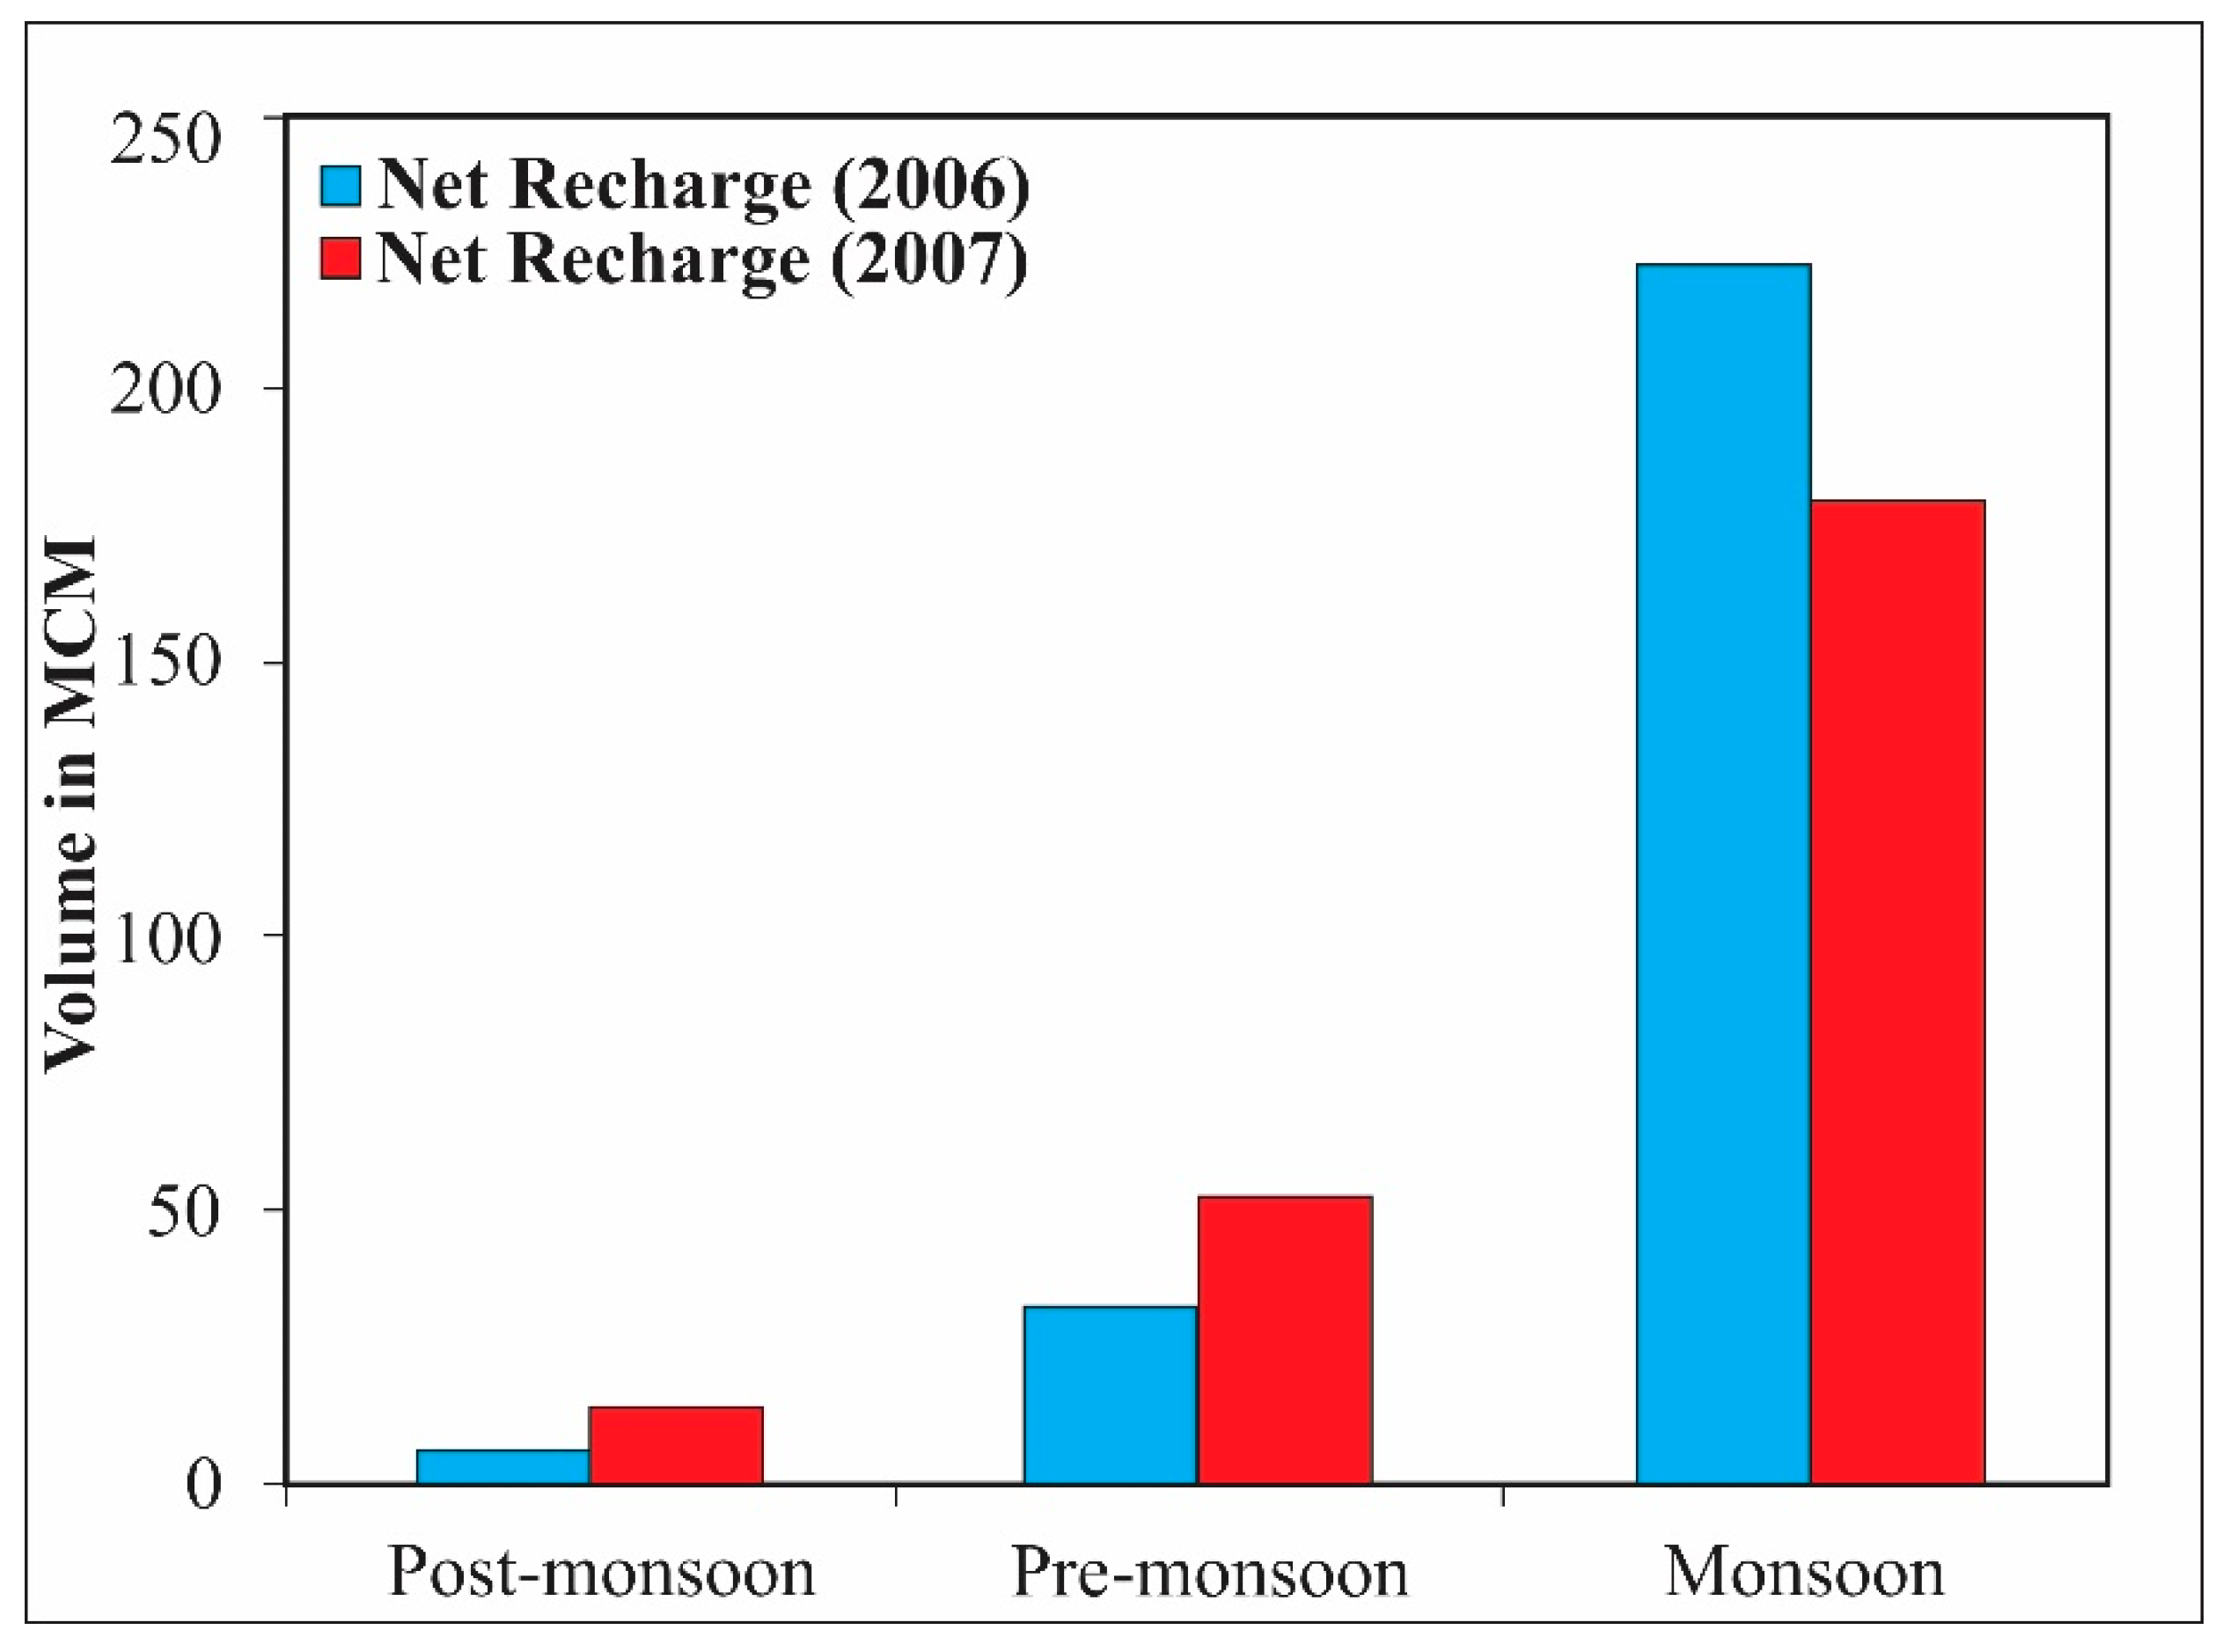
In the groundwater simulation model, the recharge was manually optimized to minimize the head difference between the observed head and calculated head [46]. Modeled recharge rates vary across the recharge zones and also from year to year due to large variations of rainfall over the simulation period. The temporal and spatial distribution of annual rainfall from the year 2004 to 2009 varies from 875 to 1229 mm. The average net recharge (rainfall recharge–groundwater draft) in the area varies from 247.89 to 262.63 million cubic meters (MCM) in the year 2006–2007. The net recharge in post-monsoon is estimated to be less than that of pre-monsoon and monsoon periods (Figure 10). Around 6–15 MCM of water recharge the aquifer system during the post-monsoon period, whereas 33–54 MCM of water percolates into the aquifer system in the pre-monsoon period. Huge extraction of groundwater leads to less net recharge in the post-monsoon season, though natural rainfall happens to have occurred in the study area. As compared to the post and pre-monsoon season, the coastal aquifer system gets highly recharged by rainfall in the monsoon period, estimated in between 180.26 and 223.08 MCM.

5.4. Groundwater Outflow to the Bay of Bengal

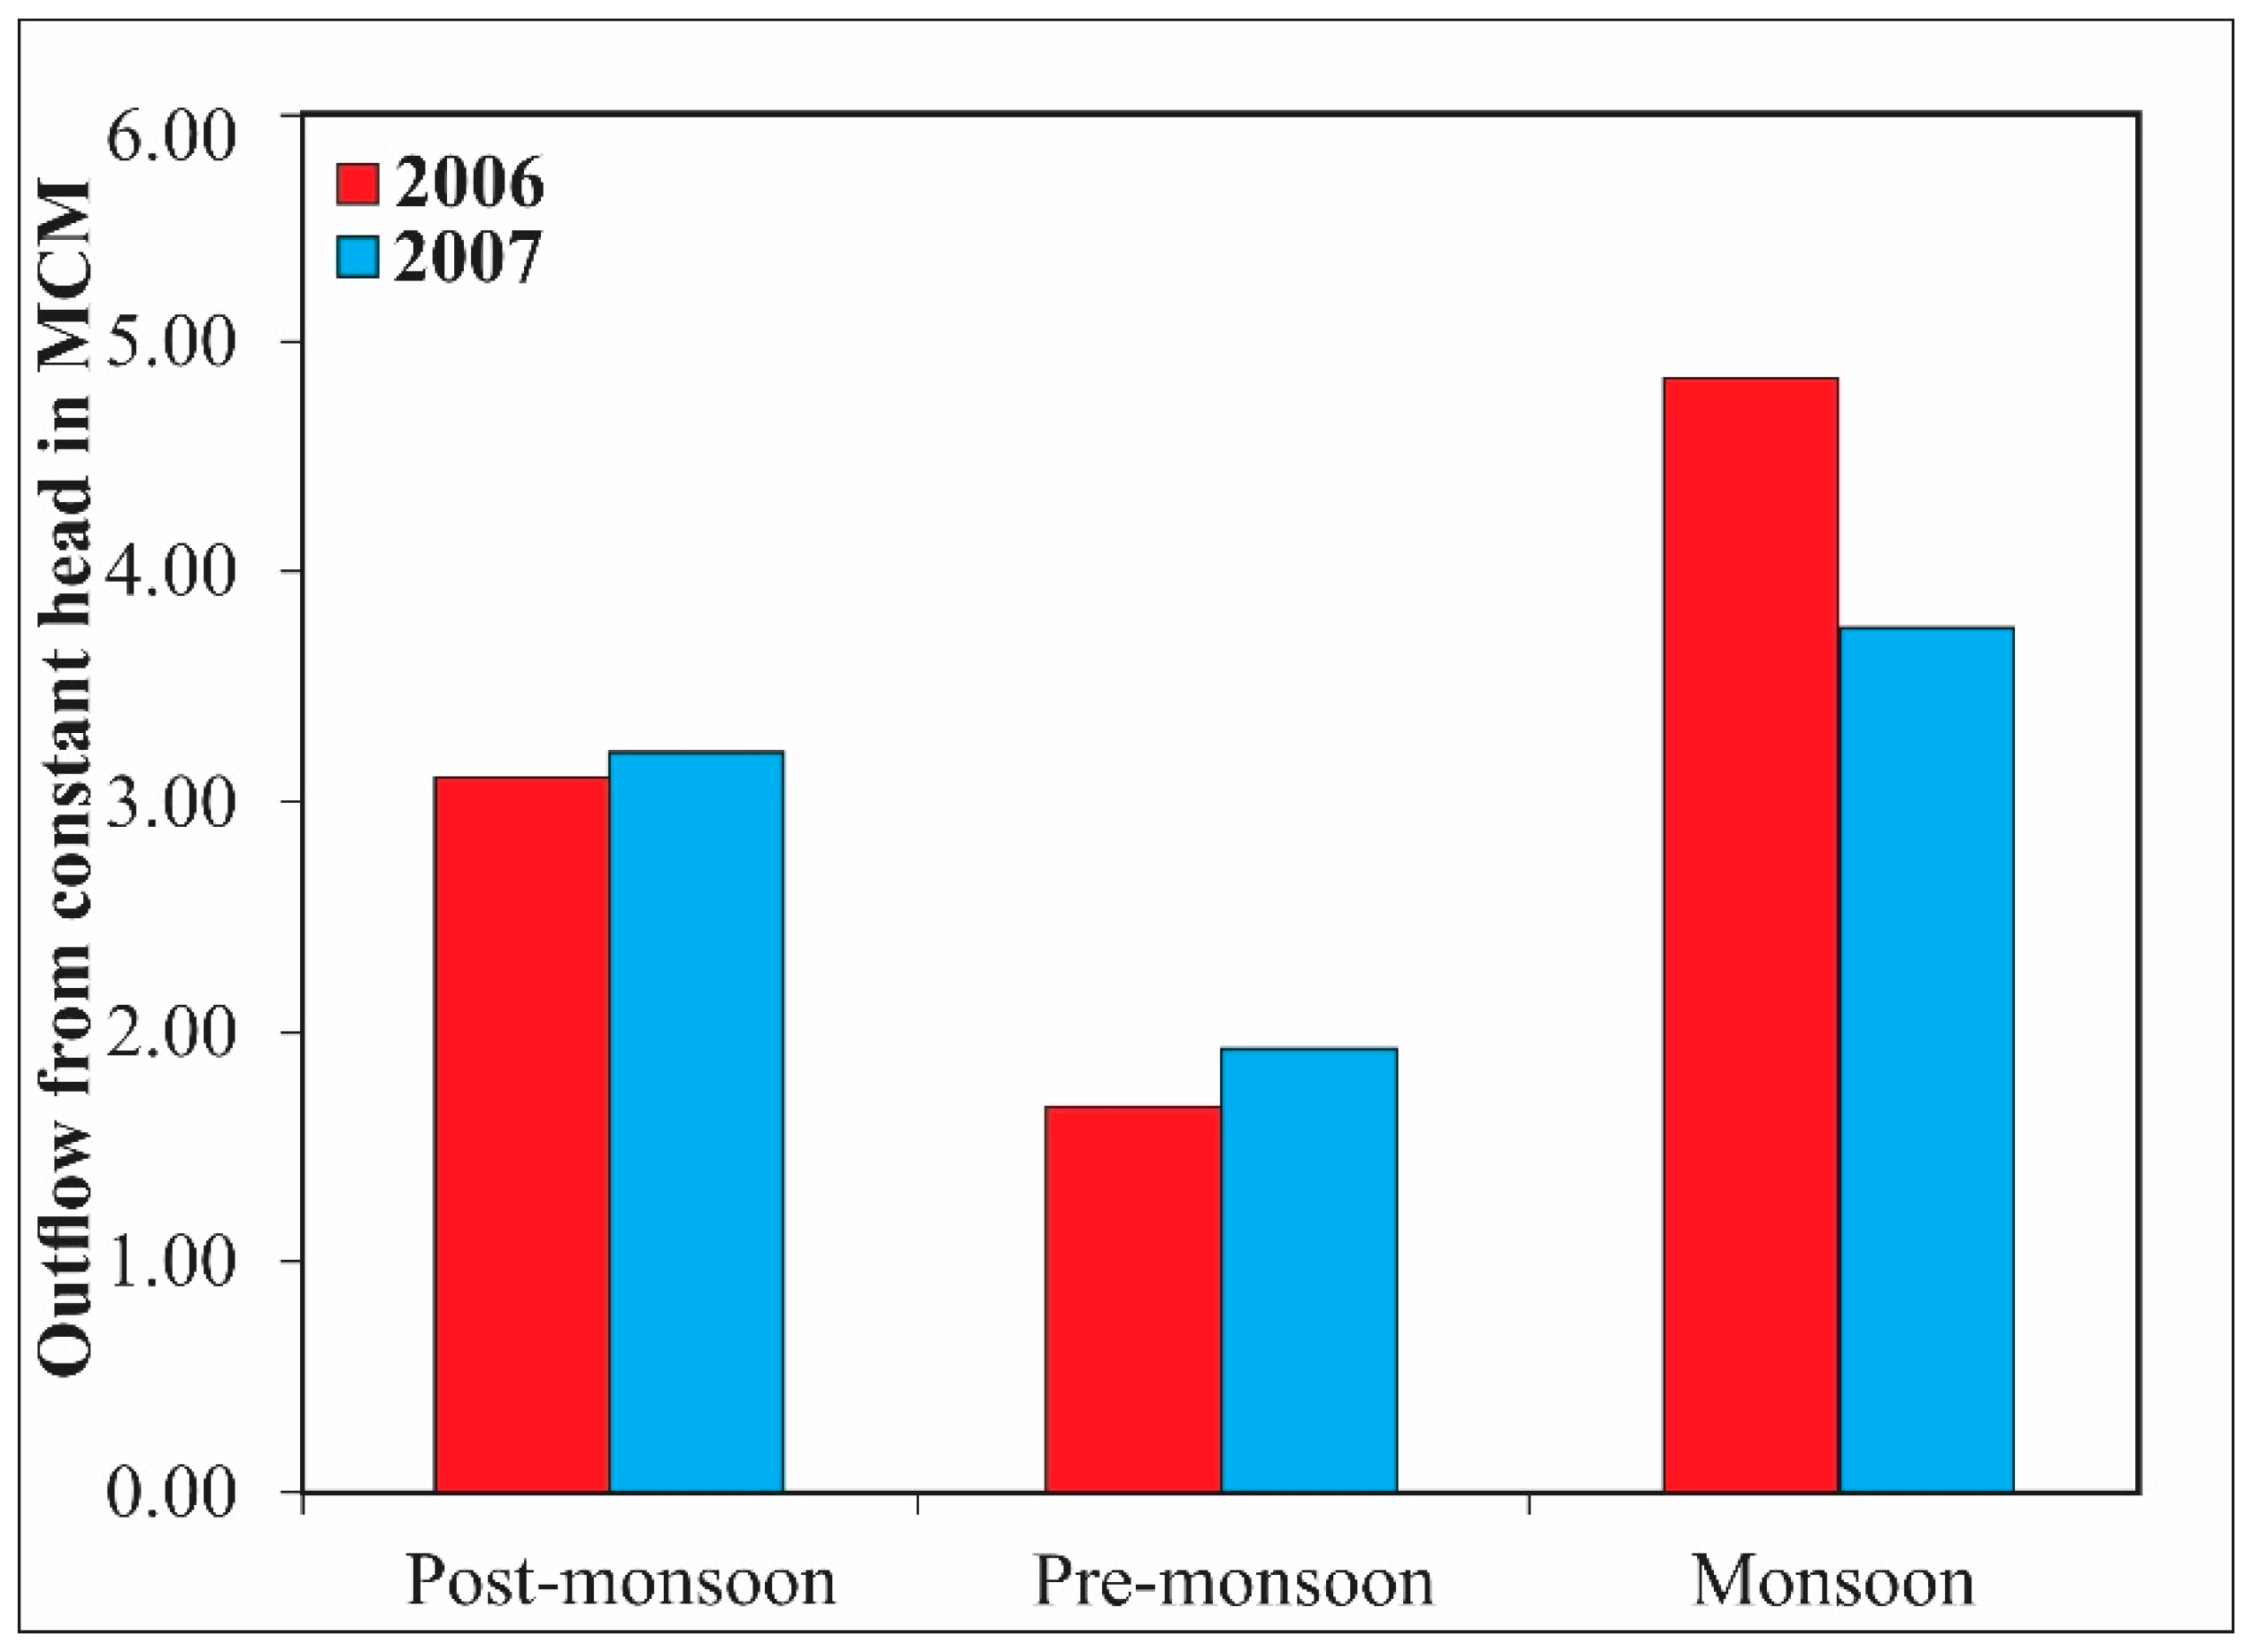
The groundwater flow direction in the study area is towards the Bay of Bengal as shown in Figure 8. The model simulation results show that the outflow to the Bay of Bengal varies from 8.92 to 9.64 MCM on an annual basis (2006–2007) (Figure 11). The unconfined coastal aquifer of the studied area discharges nearly 50% of its groundwater during the monsoon period, while the rest discharges during dry periods [29]. This is due to the groundwater recharge by rainfall and reduction of groundwater abstraction during the monsoon season. The resultant outflow from the Bay of Bengal also prevents seawater ingress into the aquifer system.

6. Conclusions

The groundwater dynamics in the coastal area of the Mahanadi delta was studied using a modeling technique with the help of Visual MODFLOW. The simulated heads matched significantly with the observed heads characterized by different statistical parameters, showing the development of a robust model for this study area. The aquifer parameters (hydraulic conductivity and specific yield) estimated by the PEST tool and trial-and-error method through modeling are approximately the same. Further, the parameters have been subjected to uncertainty analysis, yielding a 95% confidence interval between 39.70 and 48.43 m/day for a particular zone.
The shallow coastal aquifer was influenced by the river system. The estimated groundwater abstraction (180 MCM) led to inflow from the river during the non-monsoon time. Further, the excess amount of groundwater as base flow during the monsoon period recharges the river. This is one of the controlling factors that also affects the river stage. The good connectivity between river and shallow aquifer indicates the regular water circulation, exchange from groundwater to surface water or vice versa. This can improve the aquatic environmental condition. On the other hand, the decline of groundwater was due to the heavy extraction of groundwater to grow non-monsoon agricultural products. Furthermore, the temporal variation of the hydraulic head reveals that the shallow coastal aquifer is very sensitive to rainfall as it quickly responds to rainfall events.
Based on the estimated aquifer parameters, i.e., hydraulic conductivity and specific yield, the net groundwater recharge to this coastal aquifer was estimated to vary between 247.89 and 262.63 MCM. The results derived from the groundwater modeling indicate that there is a net outflow of groundwater into the Bay of Bengal. The outflow varies between 8.92 and 9.64 MCM, which may prevent the seawater ingress into the coastal aquifer of Jagatsinghpur, Odisha. Further, this scientific evidence may prove to be significant for the development of resilient water development plans for dynamic coastal aquifers, so that future generations can utilize the precious resource against climate-related hazards.

Author Contributions

Writing—original draft, A.K.B.; reviewing and editing, A.K.B., R.M.P., S.K., G.J.C. and P.K.; methodology, A.K.B. and S.K.; supervision, S.K. and G.J.C.; data collection and conceptualization, A.K.B. All authors have read and agreed to the published version of the manuscript.

Funding

This research received no external funding.

Institutional Review Board Statement

Not available.

Informed Consent Statement

Not available.

Data Availability Statement

The data presented in this study are available on request from the corresponding author.

Acknowledgments

We would like to acknowledge CGWB SE Region, Bhubaneswar for providing the necessary data to research groundwater modeling in the Jagatsinghpur area, Odisha. University Grant Commission (Govt. of India), New Delhi is acknowledged for the award of Junior Research Fellowship to Ajit Kumar Behera. We are thankful to the editor and three anonymous reviewers for their constructive comments and suggestions which has greatly improved the present version of the manuscript.

Conflicts of Interest

The authors declare no conflict of interest.

References

  1. Post, V.E.A. Fresh and saline groundwater interaction in coastal aquifers: Is our technology ready for the problems ahead? Hydrogeol. J. 2005, 13, 120–123. [Google Scholar] [CrossRef]
  2. Antonellini, M.; Mollema, P.; Giambastiani, B.; Bishop, K.; Caruso, L.; Minchio, A.; Pellegrini, L.; Sabia, M.; Ulazzi, E.; Gabbianelli, G. Salt water intrusion in the coastal aquifer of the southern Po Plain, Italy. Hydrogeol. J. 2008, 16, 1541–1556. [Google Scholar] [CrossRef]
  3. Ferguson, G.; Gleeson, T. Vulnerability of coastal aquifers to groundwater use and climate change. Nat. Clim. Chang. 2012, 2, 342–345. [Google Scholar] [CrossRef]
  4. Moore, W. Large groundwater inputs to coastal waters revealed by 226Ra enrichments. Nature 1996, 380, 612–614. [Google Scholar] [CrossRef]
  5. Trenberth, K.; Smith, L.; Qian, T.; Dai, A.; Fasullo, J. Estimates of the Global Water Budget and Its Annual Cycle Using Observational and Model Data. J. Hydrometeorol. 2007, 8, 758–769. [Google Scholar] [CrossRef]
  6. Schwartz, F.; Ibaraki, M. Groundwater: A Resource in Decline. Elements 2011, 7, 175–179. [Google Scholar] [CrossRef]
  7. Jelgersma, S.; Zijp, V.M.; Brinkman, R. Sea level rise and the coastal lowlands in the developing world. J. Coast. Res. 1993, 9, 958–972. [Google Scholar]
  8. Arnell, N. Climate change and global water resources. Glob. Environ. Chang. 1999, 9, 31–49. [Google Scholar] [CrossRef]
  9. Ranjan, R.; Shogren, J. How probability weighting affects participation in water markets. Water Resour. Res. 2006, 42. [Google Scholar] [CrossRef] [Green Version]
  10. Oude Essink, G.H.P.; Van Baaren, E.S.; De Louw, P.G. Effects of climate change on coastal groundwater systems: A modeling study in the Netherlands. Water Resour. Res. 2010, 46. [Google Scholar] [CrossRef]
  11. Singh, A.; Panda, S.N. Optimization and simulation modelling for managing the problems of water resources. Water Resour. Manag. 2013, 27, 3421–3431. [Google Scholar] [CrossRef]
  12. Anderson, M.P.; Woessner, W.W. Applied Groundwater Modeling: Simulation of Flow and Advective Transport; Academic Press: San Diego, CA, USA, 1992. [Google Scholar]
  13. Wang, H.F.; Anderson, M.P. Introduction to Groundwater Modeling: Finite Difference and Finite Element Methods; Academic Press: London, UK, 1995. [Google Scholar]
  14. Pinder, G.F.; Gray, W.G.; Brebbia, C.A. Finite Elements in Water Resources. In Proceedings of the First International Conference on Finite Elements in Water Resources, Princeton University, Princeton, NJ, USA, 12–16 July 1976; Pentech Press: London, UK, 1977. [Google Scholar]
  15. Voss, C.I. A Finite-Element Simulation Model for Saturated-Unsaturated, Fluid-Density-Dependent Ground-Water Flow with Energy Transport or Chemically-Reactive Single-Species Solute Transport; US Geological Survey: Reston, VA, USA, 1984.
  16. Istok, J. Groundwater Modeling by the Finite Element Method; Water Resources Monograph Series, 13; American Geophysical Union: Washington, DC, USA, 1989. [Google Scholar]
  17. Freeze, R.A.; Witherspoon, P.A. Theoretical analysis of regional groundwater flow: 1. Analytical and numerical solutions to the mathematical model. Water Resour. Res. 1966, 2, 641–656. [Google Scholar] [CrossRef] [Green Version]
  18. Pinder, G.F.; Bredehoeft, J.D. Application of the digital computer for aquifer evaluation. Water Resour. Res. 1968, 4, 1069–1093. [Google Scholar] [CrossRef]
  19. Trescott, P.C.; Pinder, G.F.; Larson, S.P. Finite-Difference Model for Aquifer Simulation in Two Dimensions with Results of Numerical Experiments; US Department of the Interior, Geological Survey: Reston, VA, USA, 1976.
  20. McDonald, M.G.; Harbaugh, A.W. A Modular Three-Dimensional Finite-Difference Ground-Water Flow Model; US Geological Survey Technical Manual of Water Resources Investigation, Book 6; USGS: Reston, VA, USA, 1988.
  21. Essink, G.H.O. Salt water intrusion in a three-dimensional groundwater system in the Netherlands: A numerical study. Transp. Porous Media 2001, 43, 137–158. [Google Scholar] [CrossRef]
  22. Bakker, M.; Essink, G.; Langevin, C. The rotating movement of three immiscible fluids—A benchmark problem. J. Hydrol. 2004, 287, 270–278. [Google Scholar] [CrossRef]
  23. Vandenbohede, A.; Houtte, E.; Lebbe, L. Sustainable groundwater extraction in coastal areas: A Belgian example. Environ. Geol. 2009, 57, 735–774. [Google Scholar] [CrossRef]
  24. Scanlon, B.; Mace, R.; Barrett, M.; Smith, B. Can we simulate regional groundwater flow in a karst system using equivalent porous media models? Case study, Barton Springs Edwards aquifer, USA. J. Hydrol. 2003, 276, 137–158. [Google Scholar] [CrossRef]
  25. Majumdar, P.K.; Ram, S.; Rao, P.R. Artificial recharge in multi aquifers of a mountainous watershed. J. Hydrol. Eng. 2009, 14, 215–222. [Google Scholar] [CrossRef]
  26. Rani, F.M.; Chen, Z.H. Numerical Modeling of Groundwater Flow in Karst Aquifer, Makeng Mining Area. Am. J. Environ. Sci. 2010, 6, 78–82. [Google Scholar] [CrossRef] [Green Version]
  27. Varalakshmi, V.; Venkateswara Rao, L.B.; SuriNaidu, L.; Tejaswini, M. Groundwater flow modeling of a hard rock aquifer: Case study. J. Hydrol. Eng. 2014, 19, 877–886. [Google Scholar] [CrossRef] [Green Version]
  28. Kashaigili, J.J.; Mashauri, D.A.; Abdo, G. Groundwater management by using mathematical modeling: Case of the Makutupora groundwater basin in Dodoma Tanzania. Botsw. J. Technol. 2003, 12, 19–24. [Google Scholar] [CrossRef]
  29. Rejani, R.; Jha, M.K.; Panda, S.N.; Mull, R. Simulation modeling for efficient groundwater management in Balasore coastal basin, India. Water Resour. Manag. 2008, 22, 23–50. [Google Scholar] [CrossRef]
  30. Rao, S.V.N.; Bhallamudi, S.M.; Thandaveswara, B.S.; Mishra, G.C. Conjunctive Use of Surface and Groundwater for Coastal and Deltaic Systems. J. Water Resour. Plan. Manag. 2004, 130, 255–267. [Google Scholar] [CrossRef] [Green Version]
  31. Huyakorn, P.S.; Andersen, P.F.; Mercer, J.W.; White, H.O. Saltwater intrusion in aquifers: Development and testing of a three-dimensional finite element model. Water Resour. Res. 1987, 23, 293–312. [Google Scholar] [CrossRef]
  32. Yeh, W.W. Review: Optimization methods for groundwater modeling and management. Hydrogeol. J. 2015, 23, 1051–1065. [Google Scholar] [CrossRef]
  33. Kumar, P.; Dasgupta, R.; Dhyani, S.; Kadaverugu, R.; Johnson, B.K.; Hashimoto, S.; Sahu, N.; Avtar, R.; Saito, O.; Chakraborty, S.; et al. Scenario-Based Hydrological Modeling for Designing Climate-Resilient Coastal Water Resource Management Measures: Lessons from Brahmani River, Odisha, Eastern India. Sustainability 2021, 13, 6339. [Google Scholar] [CrossRef]
  34. Kadaverugu, R.; Dhyani, S.; Dasgupta, R.; Kumar, P.; Hashimoto, S.; Pujari, P. Multiple values of Bhitarkanika mangroves for human well-being: Synthesis of contemporary scientific knowledge for mainstreaming ecosystem services in policy planning. J. Coast. Conserv. 2021, 25, 1–15. [Google Scholar] [CrossRef]
  35. CGWB; SER; BBSR. Hydrogeological Framework and Development Prospects of Jagatsinghpur District; CGWB: Odisha, India, 2013.
  36. Behera, A.K.; Chakrapani, G.J.; Kumar, S.; Rai, N. Identification of seawater intrusion signatures through geochemical evolution of groundwater: A case study based on coastal region of the Mahanadi delta, Bay of Bengal, India. Nat. Hazards 2019, 97, 1209–1230. [Google Scholar] [CrossRef]
  37. Mahalik, N.K. Mahanadi Delta, Geology, Resources and Biodiversity; AIT Alumni Assn. (India Chapter): New Delhi, India, 2000. [Google Scholar]
  38. Tyagi, J.V.; Kumar, S. Estimation of Rainfall Recharge in A Coastal Area Through Inverse Groundwater Modeling. In Proceedings of the International Conference on Integrated Water Resources Management for Sustainable Development, ICIWRM 2000, New Delhi, India, 19–21 December 2000; pp. 312–322. [Google Scholar]
  39. Nayak, S.R.; Sarangi, R.K.; Rajawat, A.S. Application of IRS-P4 OCM data to study the impact of cyclone on coastal environment of Orissa. Curr. Sci. 2001, 80, 1208–1212. [Google Scholar]
  40. Chhotray, V.; Few, R. Post-disaster recovery and ongoing vulnerability: Ten years after the super-cyclone of 1999 in Orissa, India. Glob. Environ. Chang. 2012, 22, 695–702. [Google Scholar] [CrossRef]
  41. Ghosh, S.; Raje, D.; Mujumdar, P.P. Mahanadi streamflow: Climate change impact assessment and adaptive strategies. Curr. Sci. 2010, 98, 1084–1091. [Google Scholar]
  42. GSI. Geological Survey of India. Kolkata, India, 2011. Available online: https://www.gsi.gov.in/webcenter/portal/OCBIS?_afrLoop=45165913799575592&_adf.ctrl-state=rdpwts8sr_1#!%40%40%3F_afrLoop%3D45165913799575592%26_adf.ctrl-state%3Drdpwts8sr_5 (accessed on 7 November 2021).
  43. Yidana, S.; Chegbeleh, L. The hydraulic conductivity field and groundwater flow in the unconfined aquifer system of the Keta Strip, Ghana. J. Afr. Earth Sci. 2013, 86, 45–52. [Google Scholar] [CrossRef]
  44. Fetter, C.W. Applied Hydrogeology; Prentice-Hall: Upper Saddle River, NJ, USA, 2001. [Google Scholar]
  45. Senthilkumar, M.; Elango, L. Three-dimensional mathematical model to simulate groundwater flow in the lower Palar River basin, southern India. Hydrogeol. J. 2004, 12, 197–208. [Google Scholar] [CrossRef]
  46. Datta, B.; Vennalakanti, H.; Dhar, A. Modeling and control of saltwater intrusion in a coastal aquifer of Andhra Pradesh, India. J. Hydroenviron. Res. 2009, 3, 148–159. [Google Scholar] [CrossRef]
  47. Konikow, L.F. Modeling Chloride Movement in the Alluvial Aquifer at the Rocky Mountain Arsenal, Colorado; US Government Printing Office: Washington, DC, USA, 1977.
  48. Luckey, R.R.; Gutentag, E.D.; Heimes, F.J.; Weeks, J.B. Digital Simulation of Ground-Water Flow in the High Plains Aquifer in Parts of Colorado, Kansas, Nebraska, New Mexico, Oklahoma, South Dakota, Texas, and Wyoming; USGS: Reston, VA, USA, 1986.
  49. Doherty, J. PEST–Model-Independent Parameter Estimation–User Manual Part I: PEST, SENSAN, and Global Optimisers; Watermark Numerical Computing: Corinda, Australia, 2016. [Google Scholar]
  50. Knowling, M.J.; Werner, A.D. Estimability of recharge through groundwater model calibration: Insights from a field-scale steady-state example. J. Hydrol. 2016, 540, 973–987. [Google Scholar] [CrossRef]
  51. Delottier, H.; Pryet, A.; Dupuy, A. Why Should Practitioners be Concerned about Predictive Uncertainty of Groundwater Management Models? Water Resour. Manag. 2016, 31, 61–73. [Google Scholar] [CrossRef]
  52. Mohanty, S.; Jha, M.K.; Kumar, A.; Jena, S.K. Hydrologic and hydrogeologic characterization of a deltaic aquifer system in Orissa, eastern India. Water Resour. Manag. 2012, 26, 1899–1928. [Google Scholar] [CrossRef]
  53. Sahoo, S.; Jha, M.K. Numerical groundwater-flow modeling to evaluate potential effects of pumping and recharge: Implications for sustainable groundwater management in the Mahanadi delta region. Hydrogeol. J. 2017, 25, 2489–2511. [Google Scholar] [CrossRef]
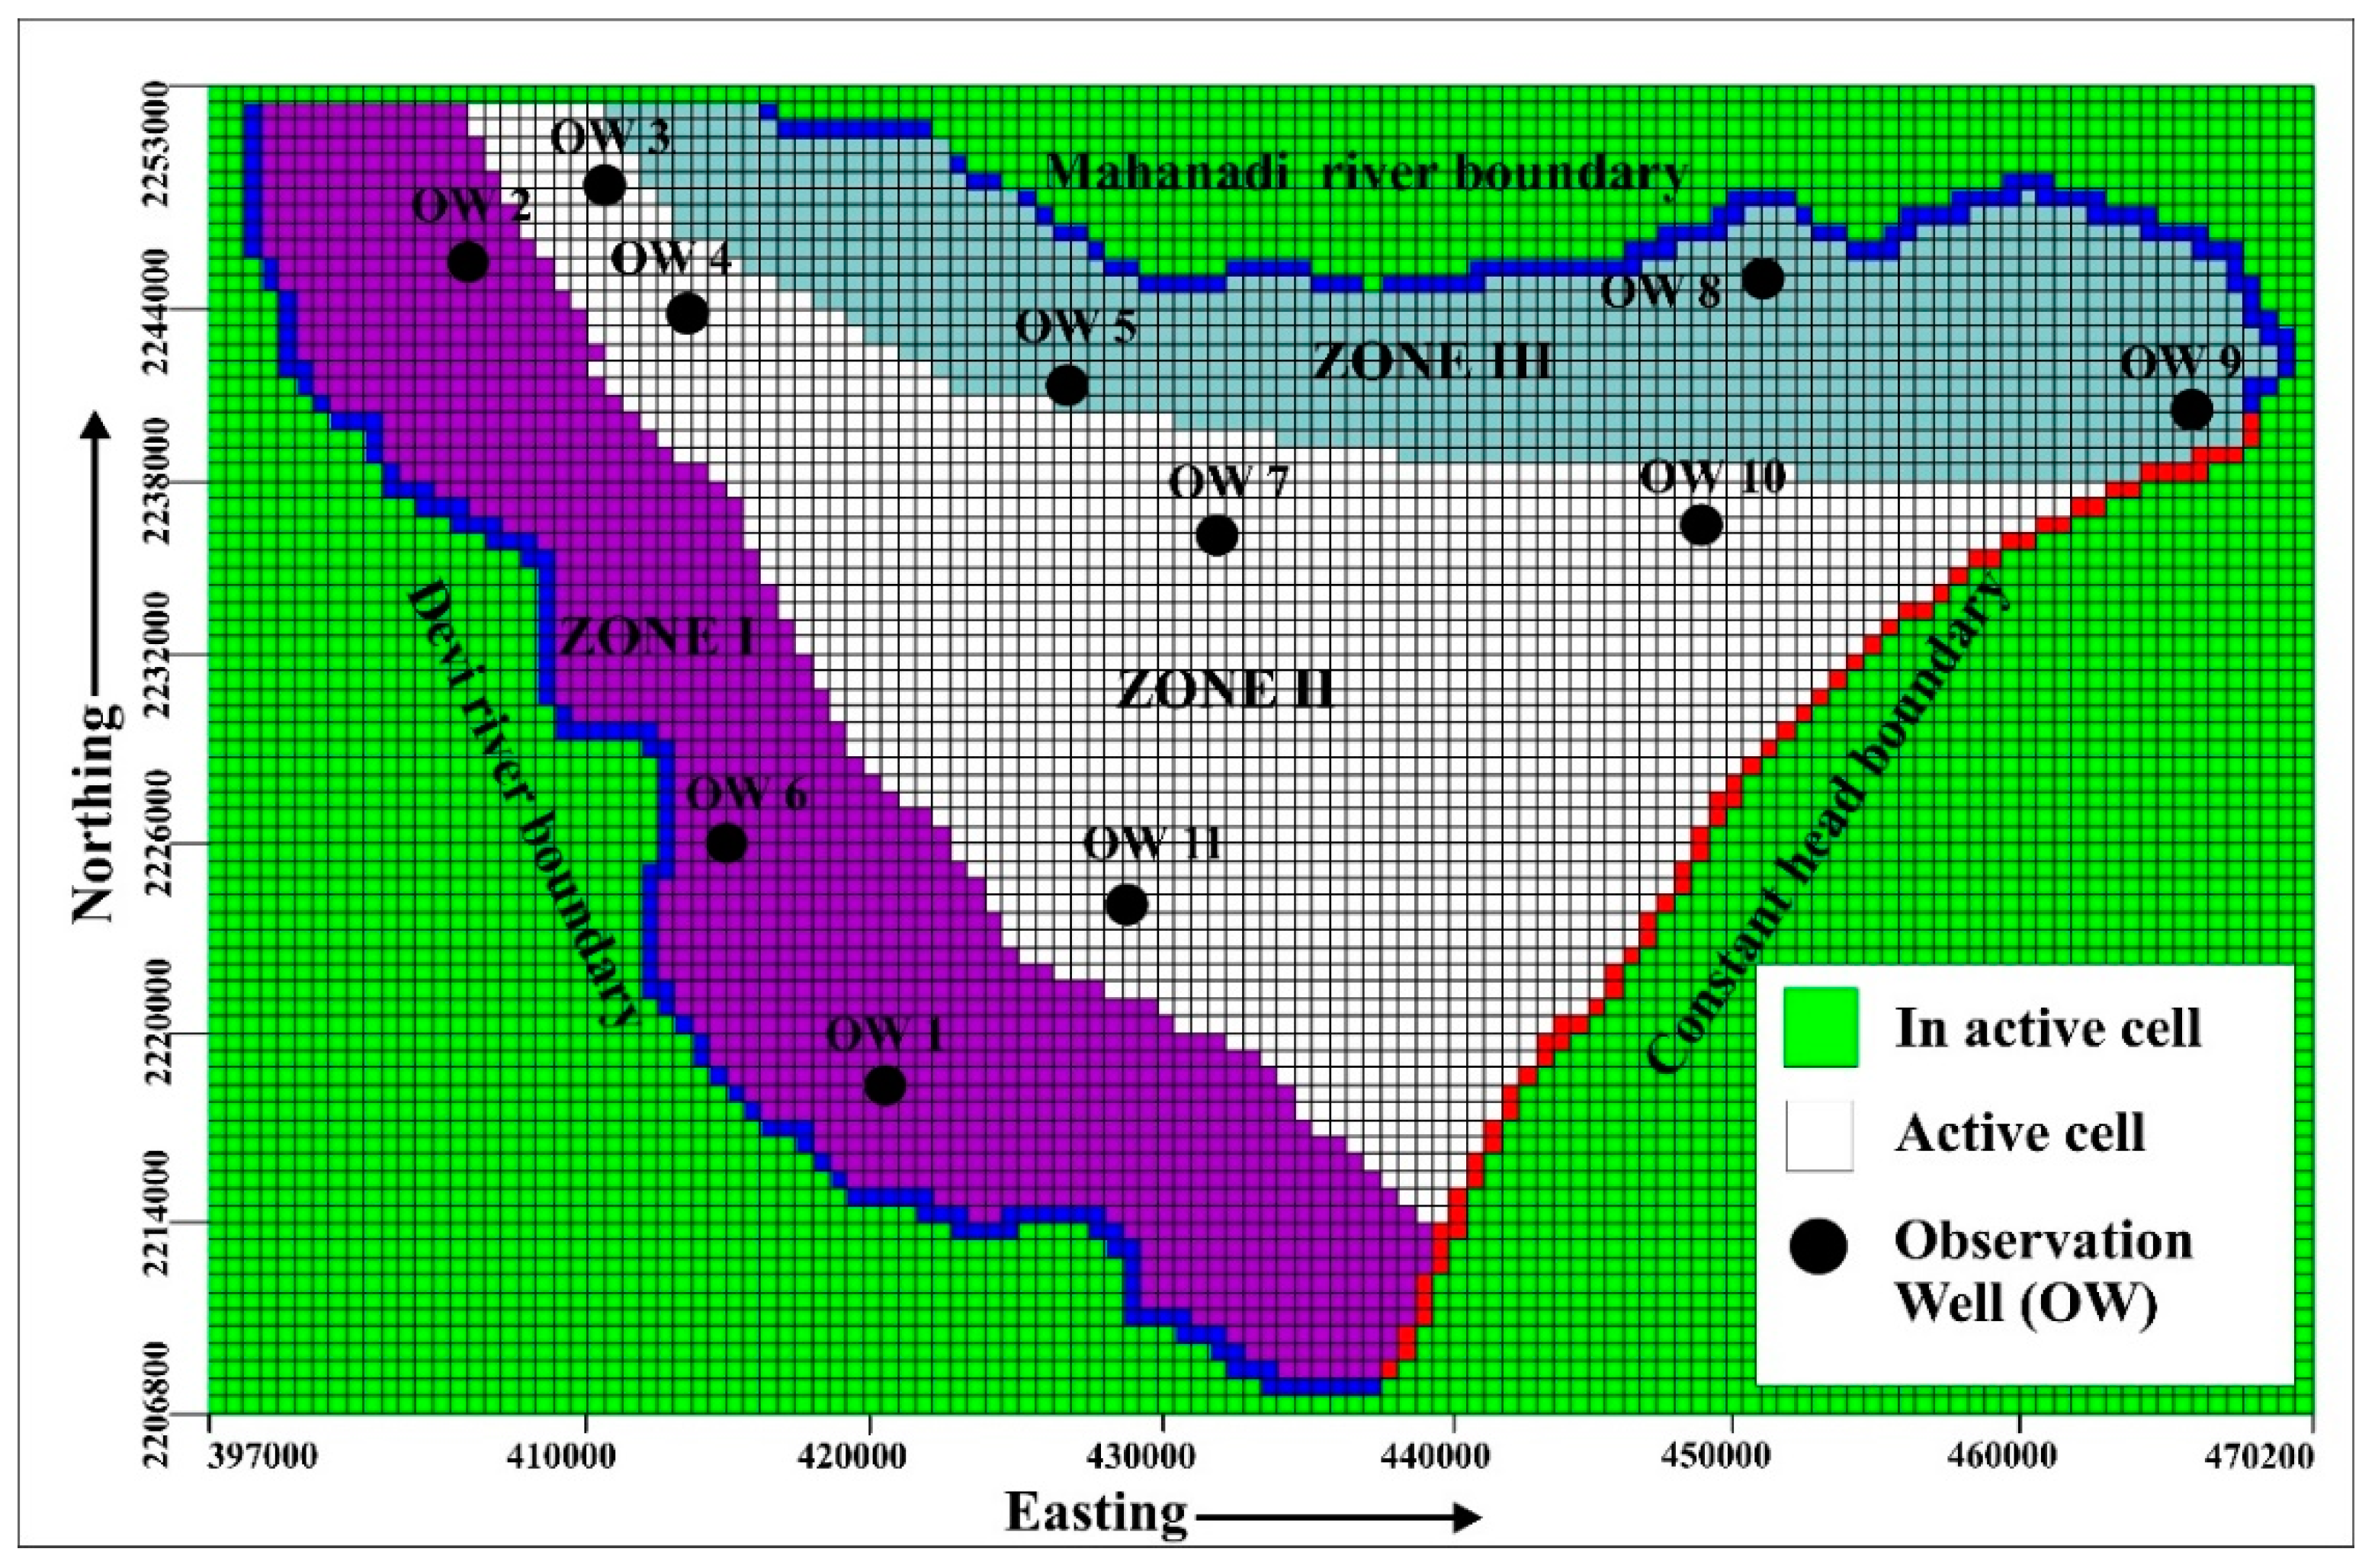
Figure 2. Discretization of the study area into grids.
Water 14 00611 g002
Figure 3. Steady-state condition: calculated head versus observed head during calibration (2004–2005) of the model.
Water 14 00611 g003
Figure 4. Transient state condition (a) calculated head versus observed head during calibration of the model (b) calculated head versus observed head during validation of the model.
Water 14 00611 g004
Figure 5. Correlation graph between observed head and calculated head by PEST.
Water 14 00611 g005
Figure 6. Interaction between river and aquifer (a) River inflow/outflow into/from the aquifer system in 2006 (b) River inflow/outflow into/from the aquifer system in 2007 (c) Graph showing the influence of groundwater abstraction on the river systems in seasons.
Water 14 00611 g006
Figure 7. A correlation Graph between the river stage and groundwater flux (a) the river stage vs. inflow from the river boundary (b) the river stage vs. outflow the river boundary.
Water 14 00611 g007
Figure 8. Spatio-temporal variation of the hydraulic head (m) in the study area.
Water 14 00611 g008
Figure 9. Recharge zones in the study area.
Water 14 00611 g009
Figure 10. Estimated net recharge in the study area in different time periods for the year 2006–2007.
Water 14 00611 g010
Figure 11. Groundwater outflow from the constant head in different time periods for the year 2006–2007.
Water 14 00611 g011
Table 1. Input model parameters.
Sl No.ParametersInputs
1.Cell
1.1ActiveWhite Cells (600 m × 600 m)
1.2InactiveGreen Cells (600 m × 600 m)
2.Model Boundaries
2.1Constant HeadHead = 0 m (Bay of Bengal-SW to NE)
2.2RechargeVariable
2.3EvapotranspirationRate = 1400 mm/year
Extinction Depth = 3.0 m
3.Layer
3.1Layer No.1
3.2Layer TypeUnconfined
4.Aquifer Parameters
4.1Hydraulic Conductivity (K)Kx = Ky = 40 to 45 m/d
Kz = 4 to 4.5 m/d
Specific Yield (Sy)0.05 to 0.07
5.Wells
5.1Observation Wells11 nos.
6.Aquifer StressesData for individual pumping wells is not available, the same has been included in net recharge
7.Simulation Period
7.1Steady State1 January 2004 (1 day)
7.2Transient State2004 to 2009
Table 2. Aquifer parameters in the study area.
ZonesHorizontal Hydraulic Conductivity (Kh) in m/DayVertical Hydraulic Conductivity (Kv) in m/DaySpecific Yield
I4040.05
II424.20.06
III454.50.07
Table 3. Initial and PEST hydraulic parameters.
ZonesInitial Hydraulic ParametersPEST Estimated Parameters
Hydraulic Conductivity in m/DaySpecific YieldHydraulic Conductivity in m/DaySpecific Yield
I400.0536.850.058
II420.0644.390.075
III450.0744.010.053
Table 4. Uncertainty analysis (95% confidence interval) by Parameter estimation (PEST) techniques.
ZonesHydraulic Conductivity (K) in m/DaySpecific Yield (Sy)
I30.746 < K < 44.180.046 < Sy < 0.074
II40.81 < K < 48.300.048 < Sy < 0.116
III39.70 < K < 48.780.043 < Sy < 0.067
Publisher’s Note: MDPI stays neutral with regard to jurisdictional claims in published maps and institutional affiliations.