
Study on Infiltration and Soil Moisture Characteristics of a Sand-Covered Slope


 ,
,
Abstract
:1. Introduction
2. Materials and Methods
2.1. Test Material
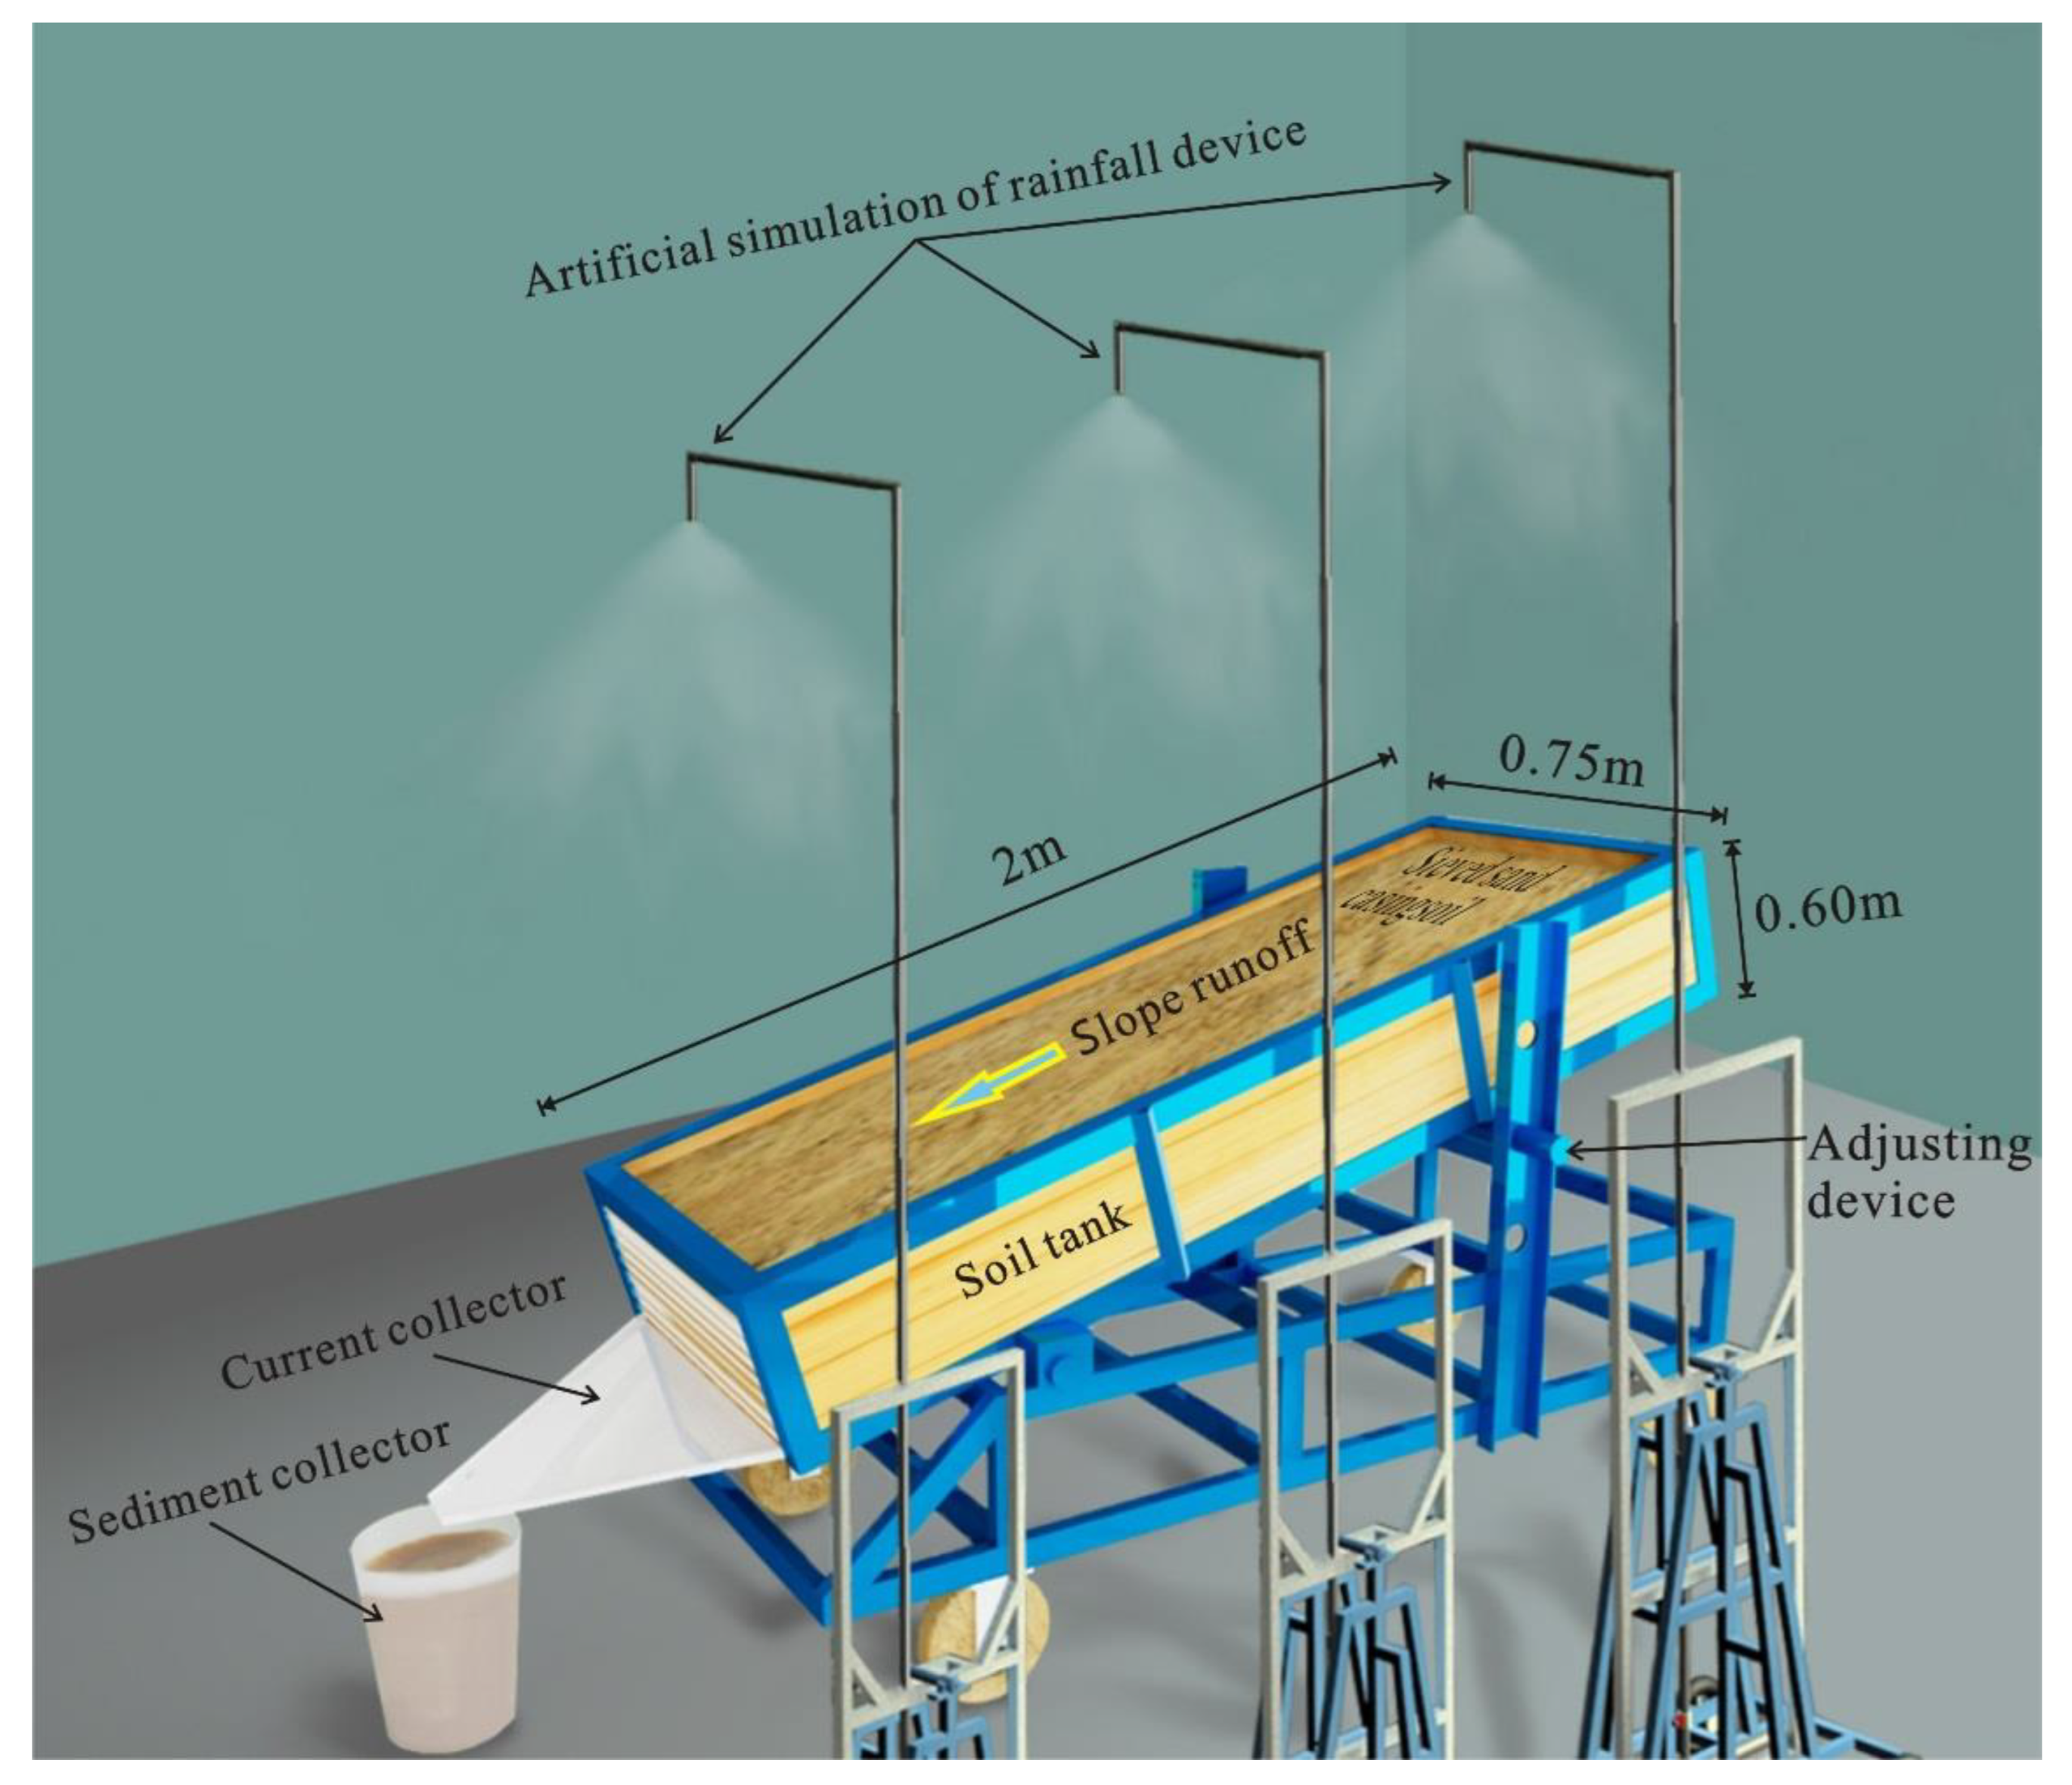
2.2. Experimental Design
2.3. Measurement and Calculation of Indicators
- (1)
- Determination of Runoff Sediment Index
- (2)
- Calculation of runoff velocity and soil moisture parameters
- Runoff velocity
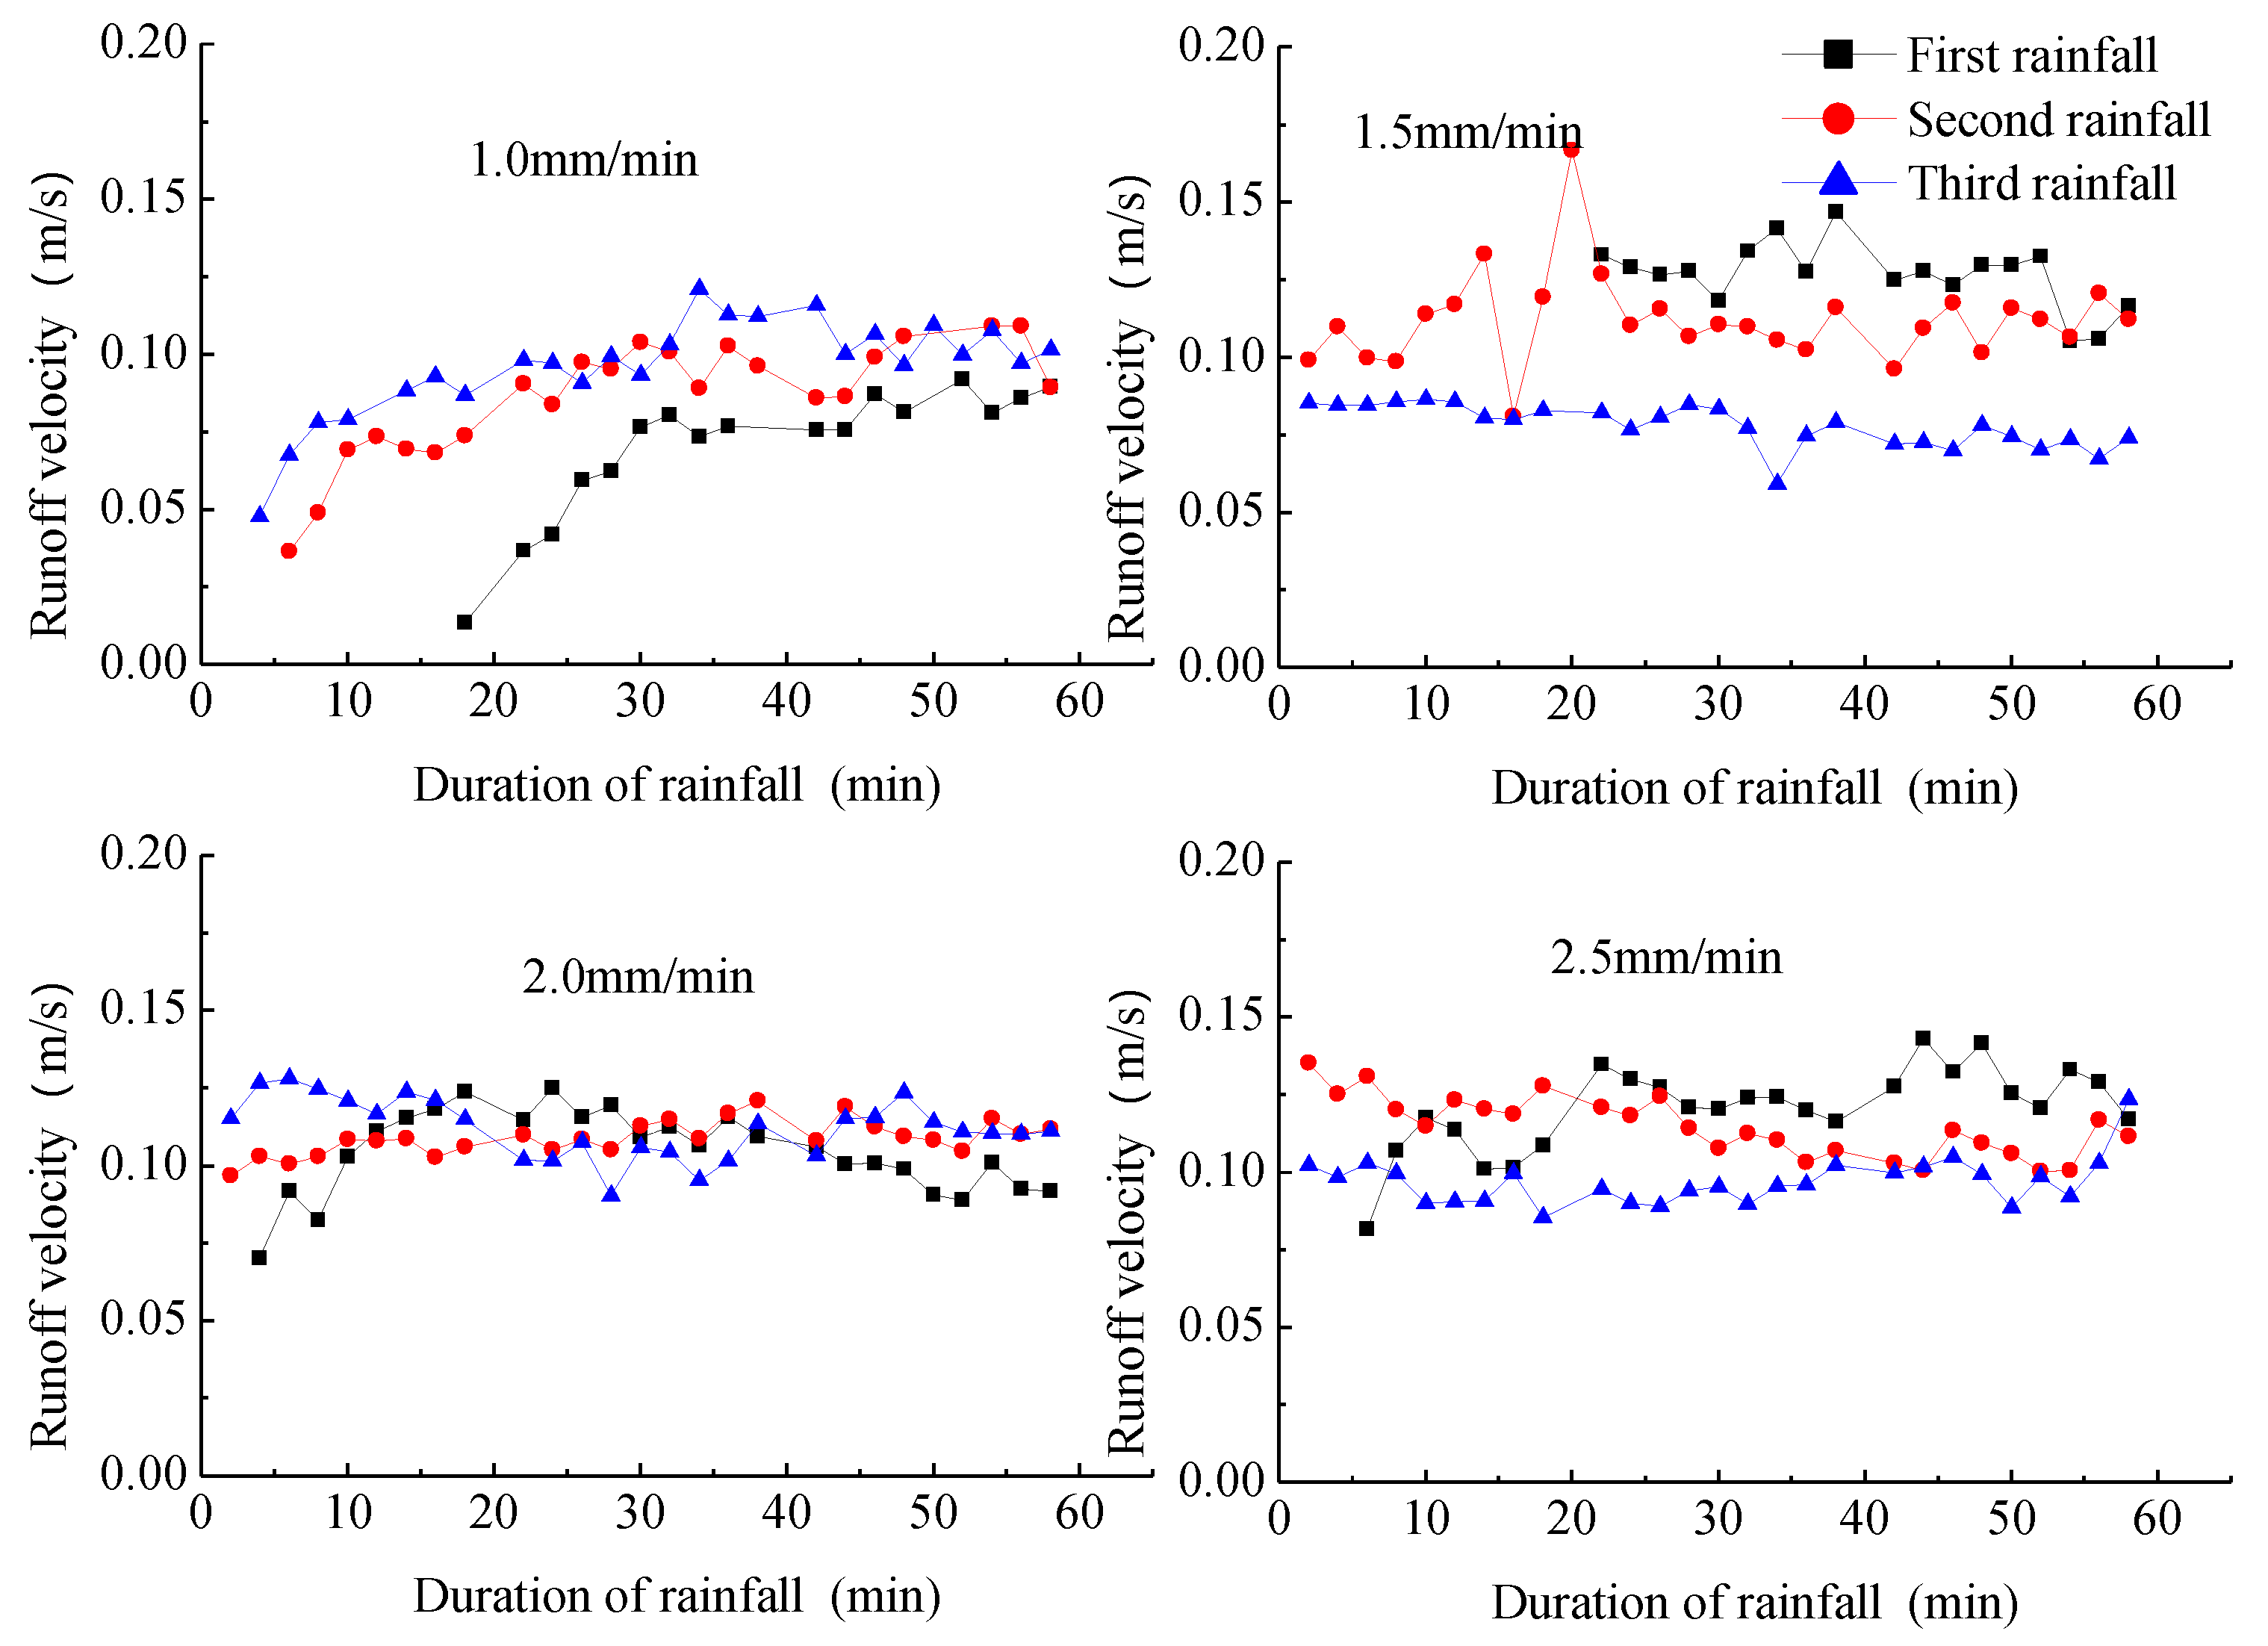
During the experiment, a potassium permanganate staining method was used to determine the surface runoff velocity, Vs, of the slope runoff. The average runoff velocity of slope runoff was calculated as follows:where V is the average velocity of runoff and β is the correction coefficient of runoff velocity, and is taken as 0.75 in this study [32].- Runoff depth
Since the slope flow in the experiment is a thin-layer flow, it is difficult to measure the runoff depth h. For this reason, previous researchers have adopted the assumption that the slope flow is uniformly distributed. The method for calculating the runoff depth in this study is as follows:where h is runoff depth, m; Q is the runoff during a period of T, m3; V is slope average velocity, m/s; B is water width, m; and T is the duration, s. Runoff depth in rills is measured directly using the ruler method.- Flow shear stress
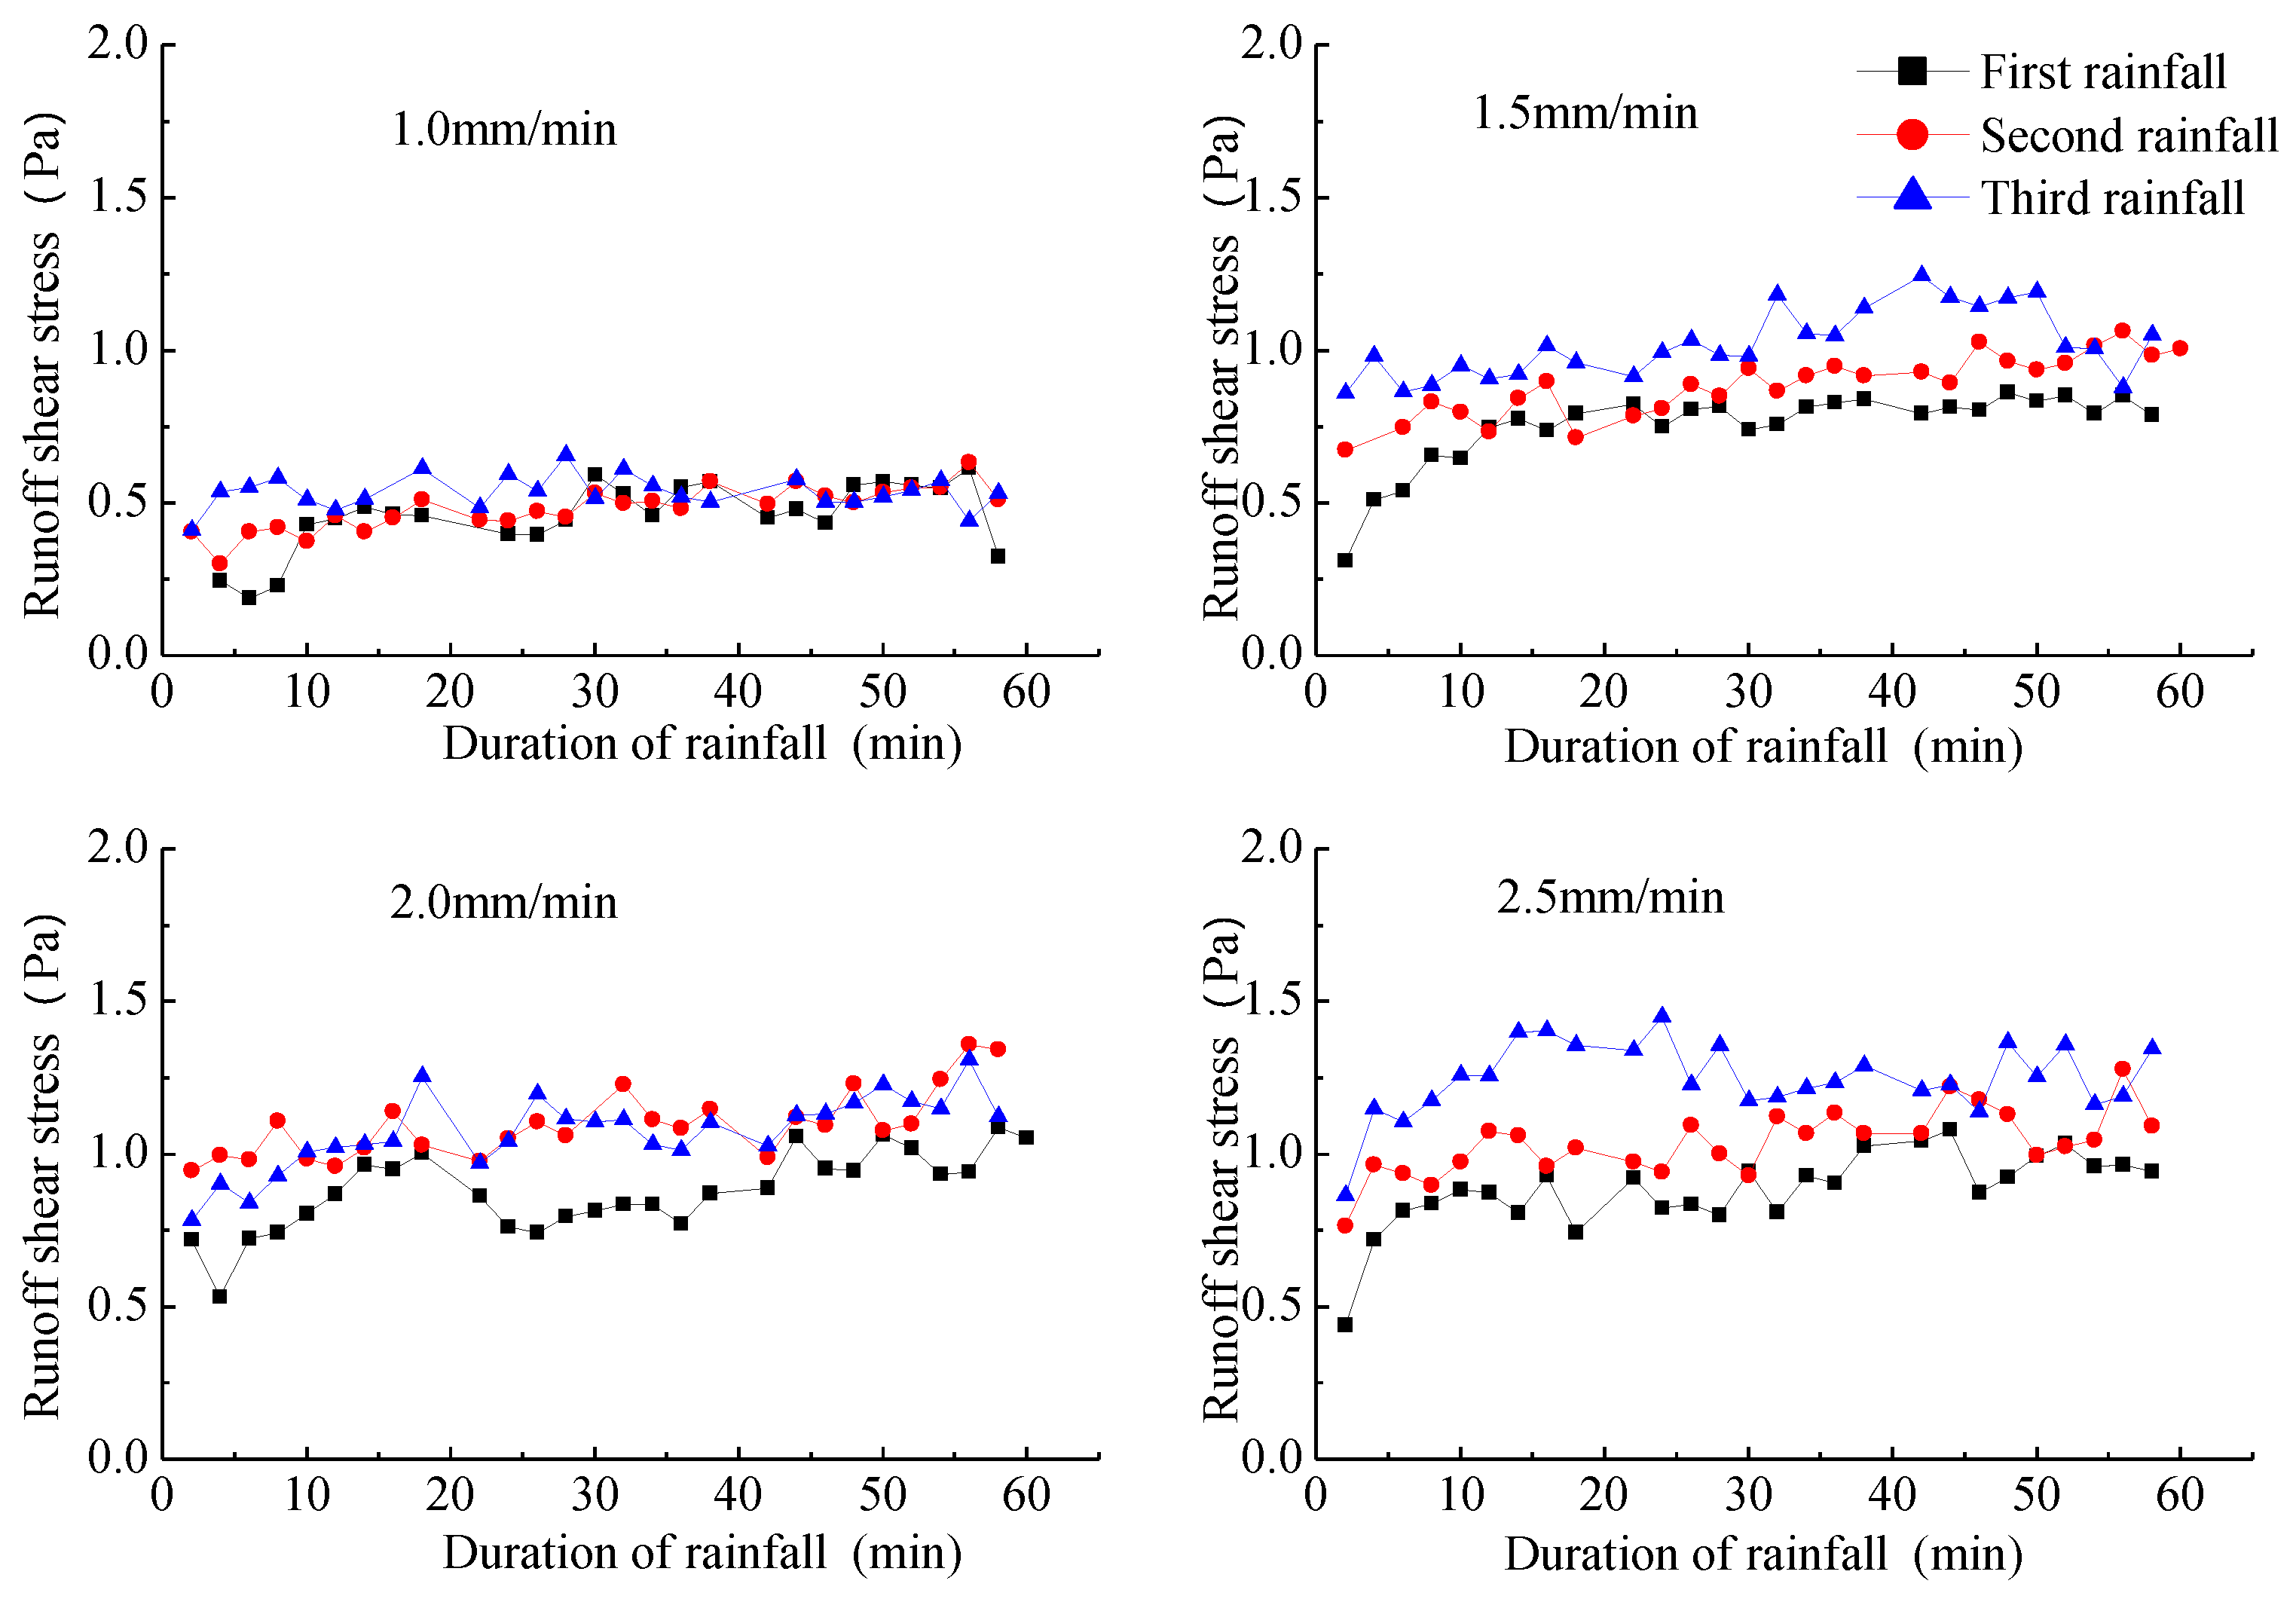
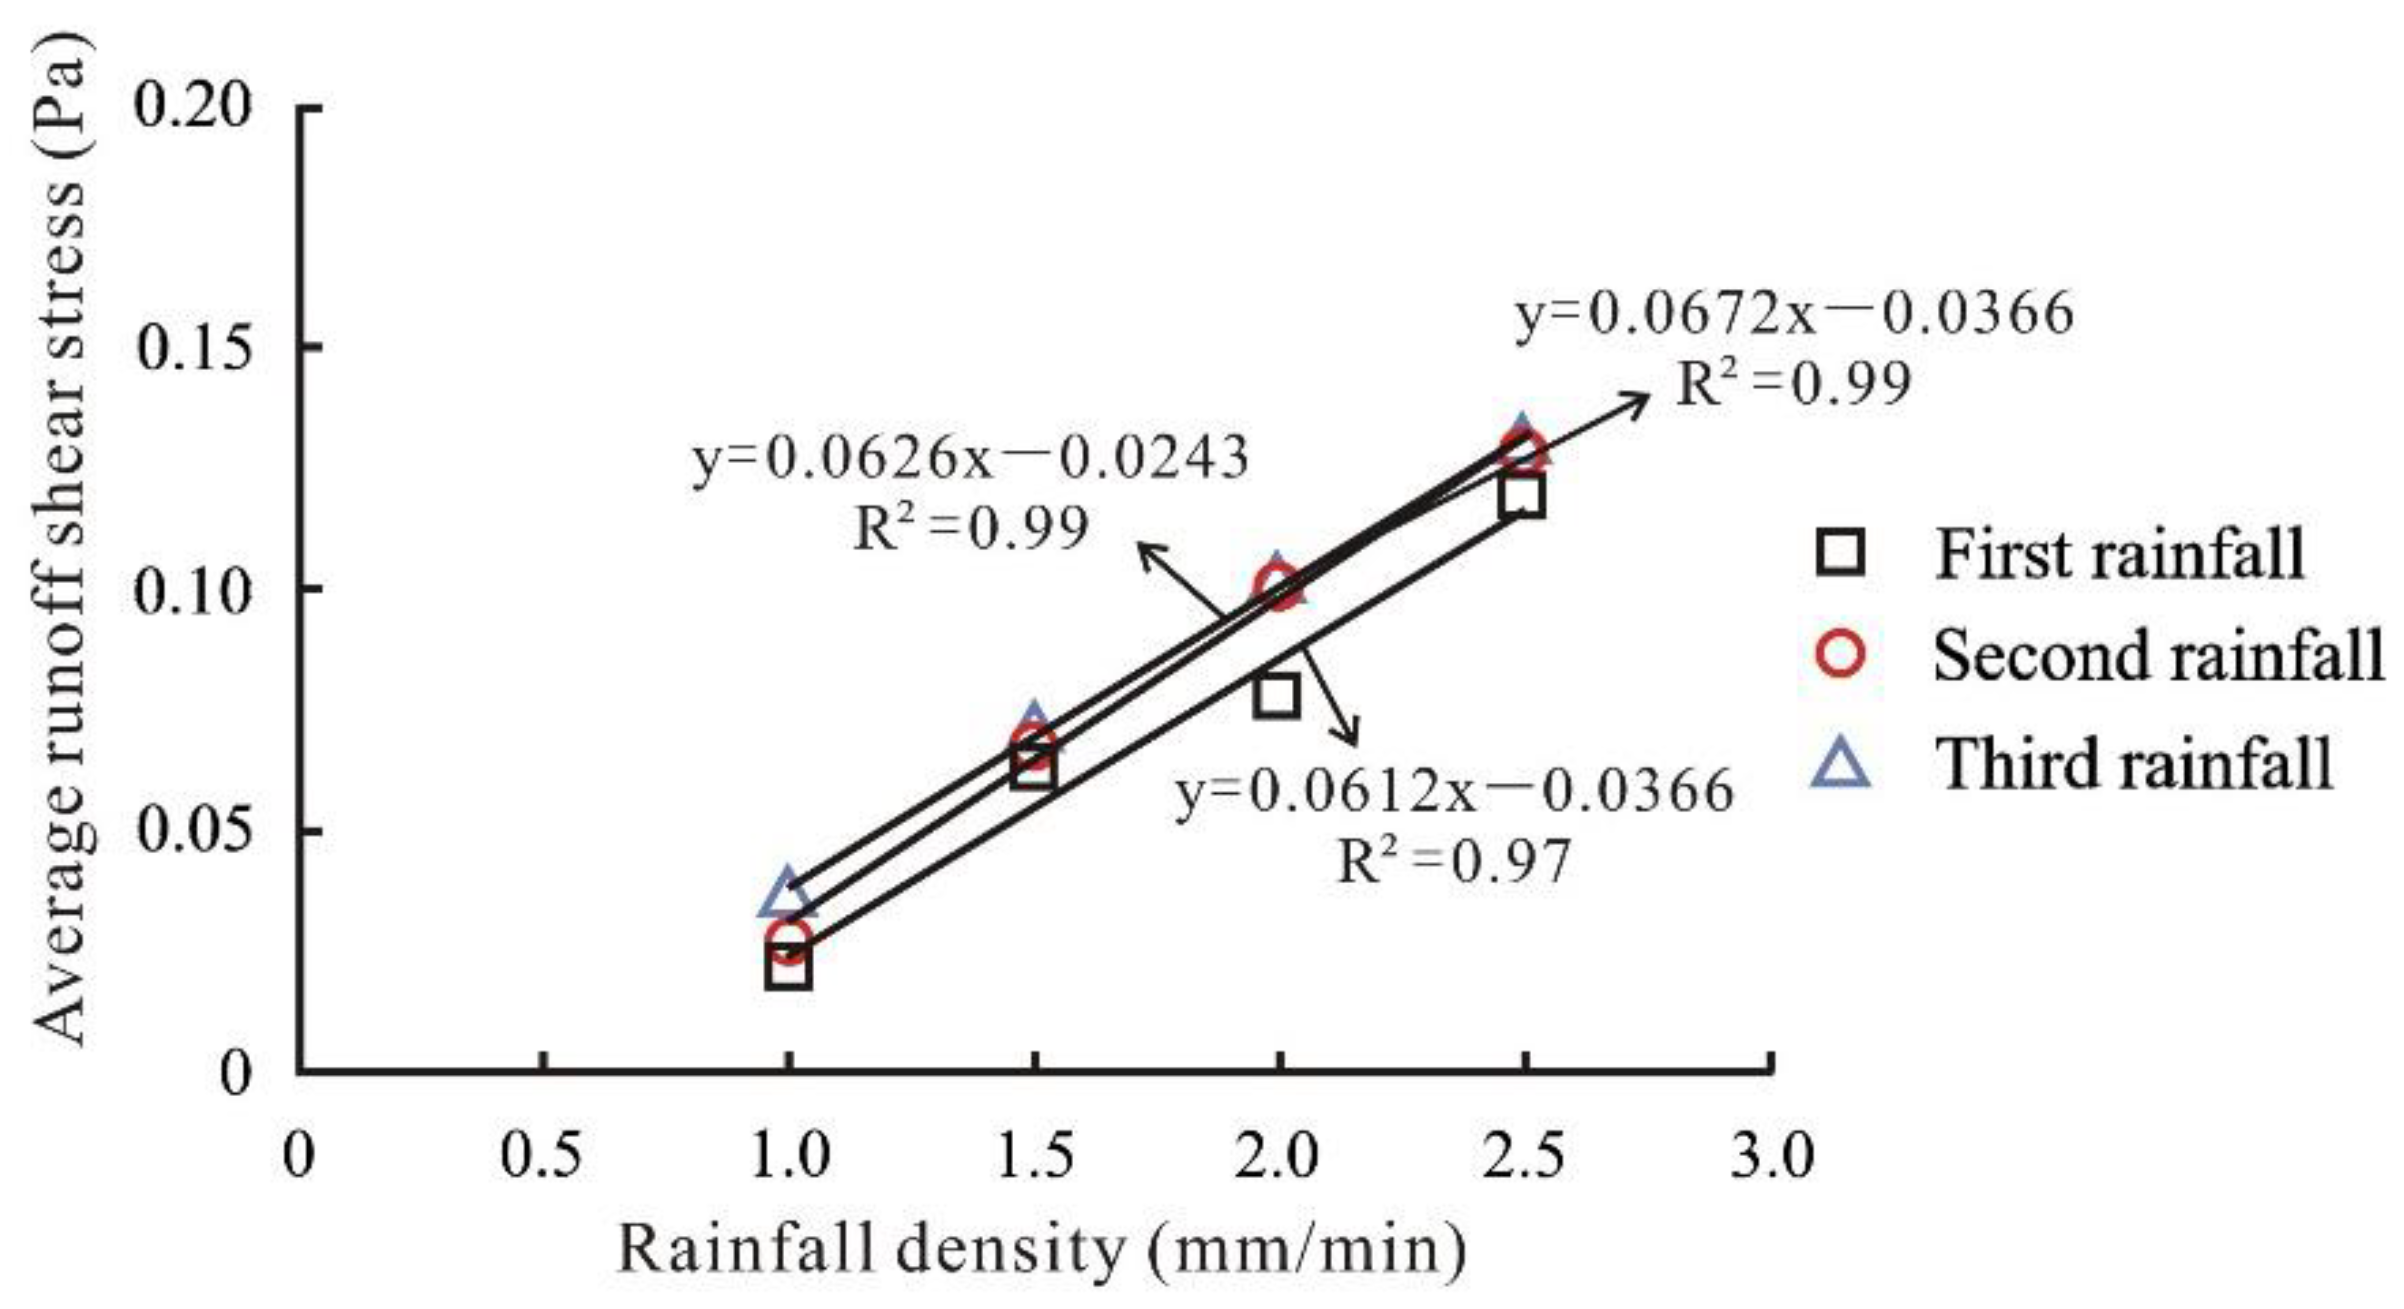
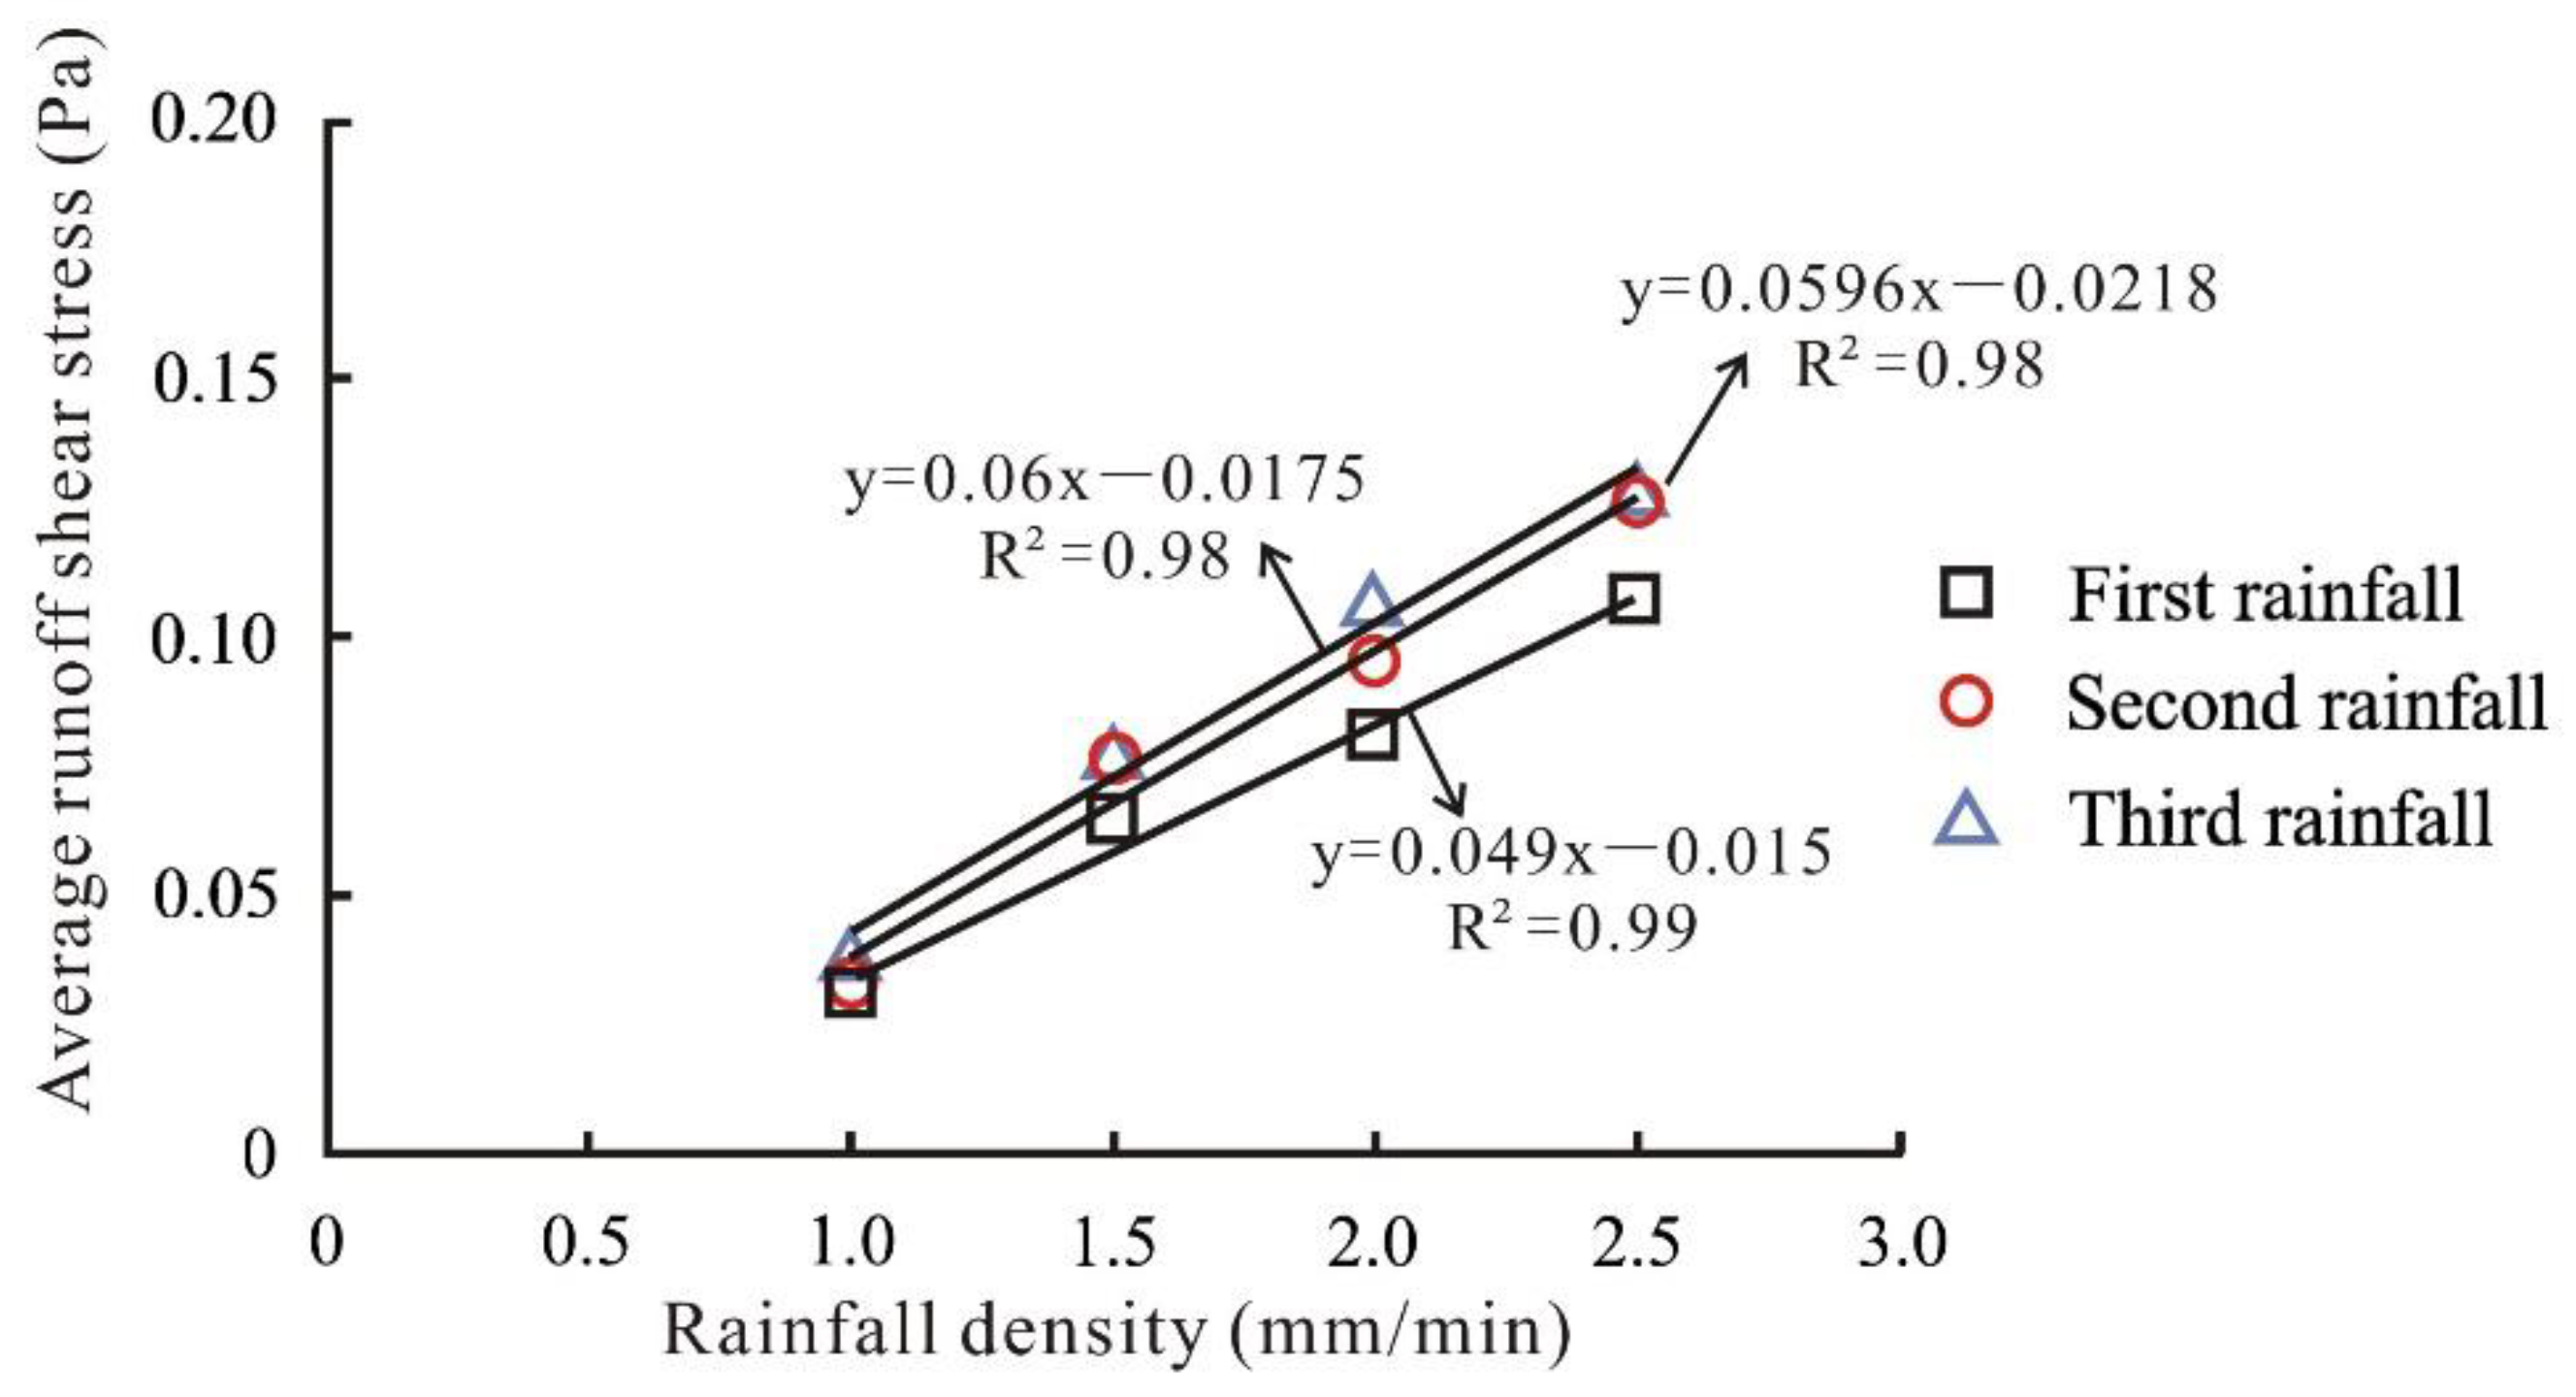
The shear force of runoff can peel soil particles from their original position by damaging the original structure of the soil and removing them from the slope with the flow. In practical research, the movement form of slope flow is simplified as a one-dimensional uniform flow. The method for calculating runoff shear stress is as follows:where τ is the runoff shear stress on the slope, Pa; ρ is the density of rain water, 1000 kg/m3; g is the gravity acceleration, which is 9.8 m/s2; R is the hydraulic radius, where the hydraulic radius of the thin-layer flow is equivalent to its runoff depth, and the runoff depth of the rill is measured by a ruler, m; and S is the hydraulic gradient, which is simplified as the sinusoidal value of the soil groove gradient, namely S = sin θ, and θ is the soil groove gradient of 12°.- Runoff power
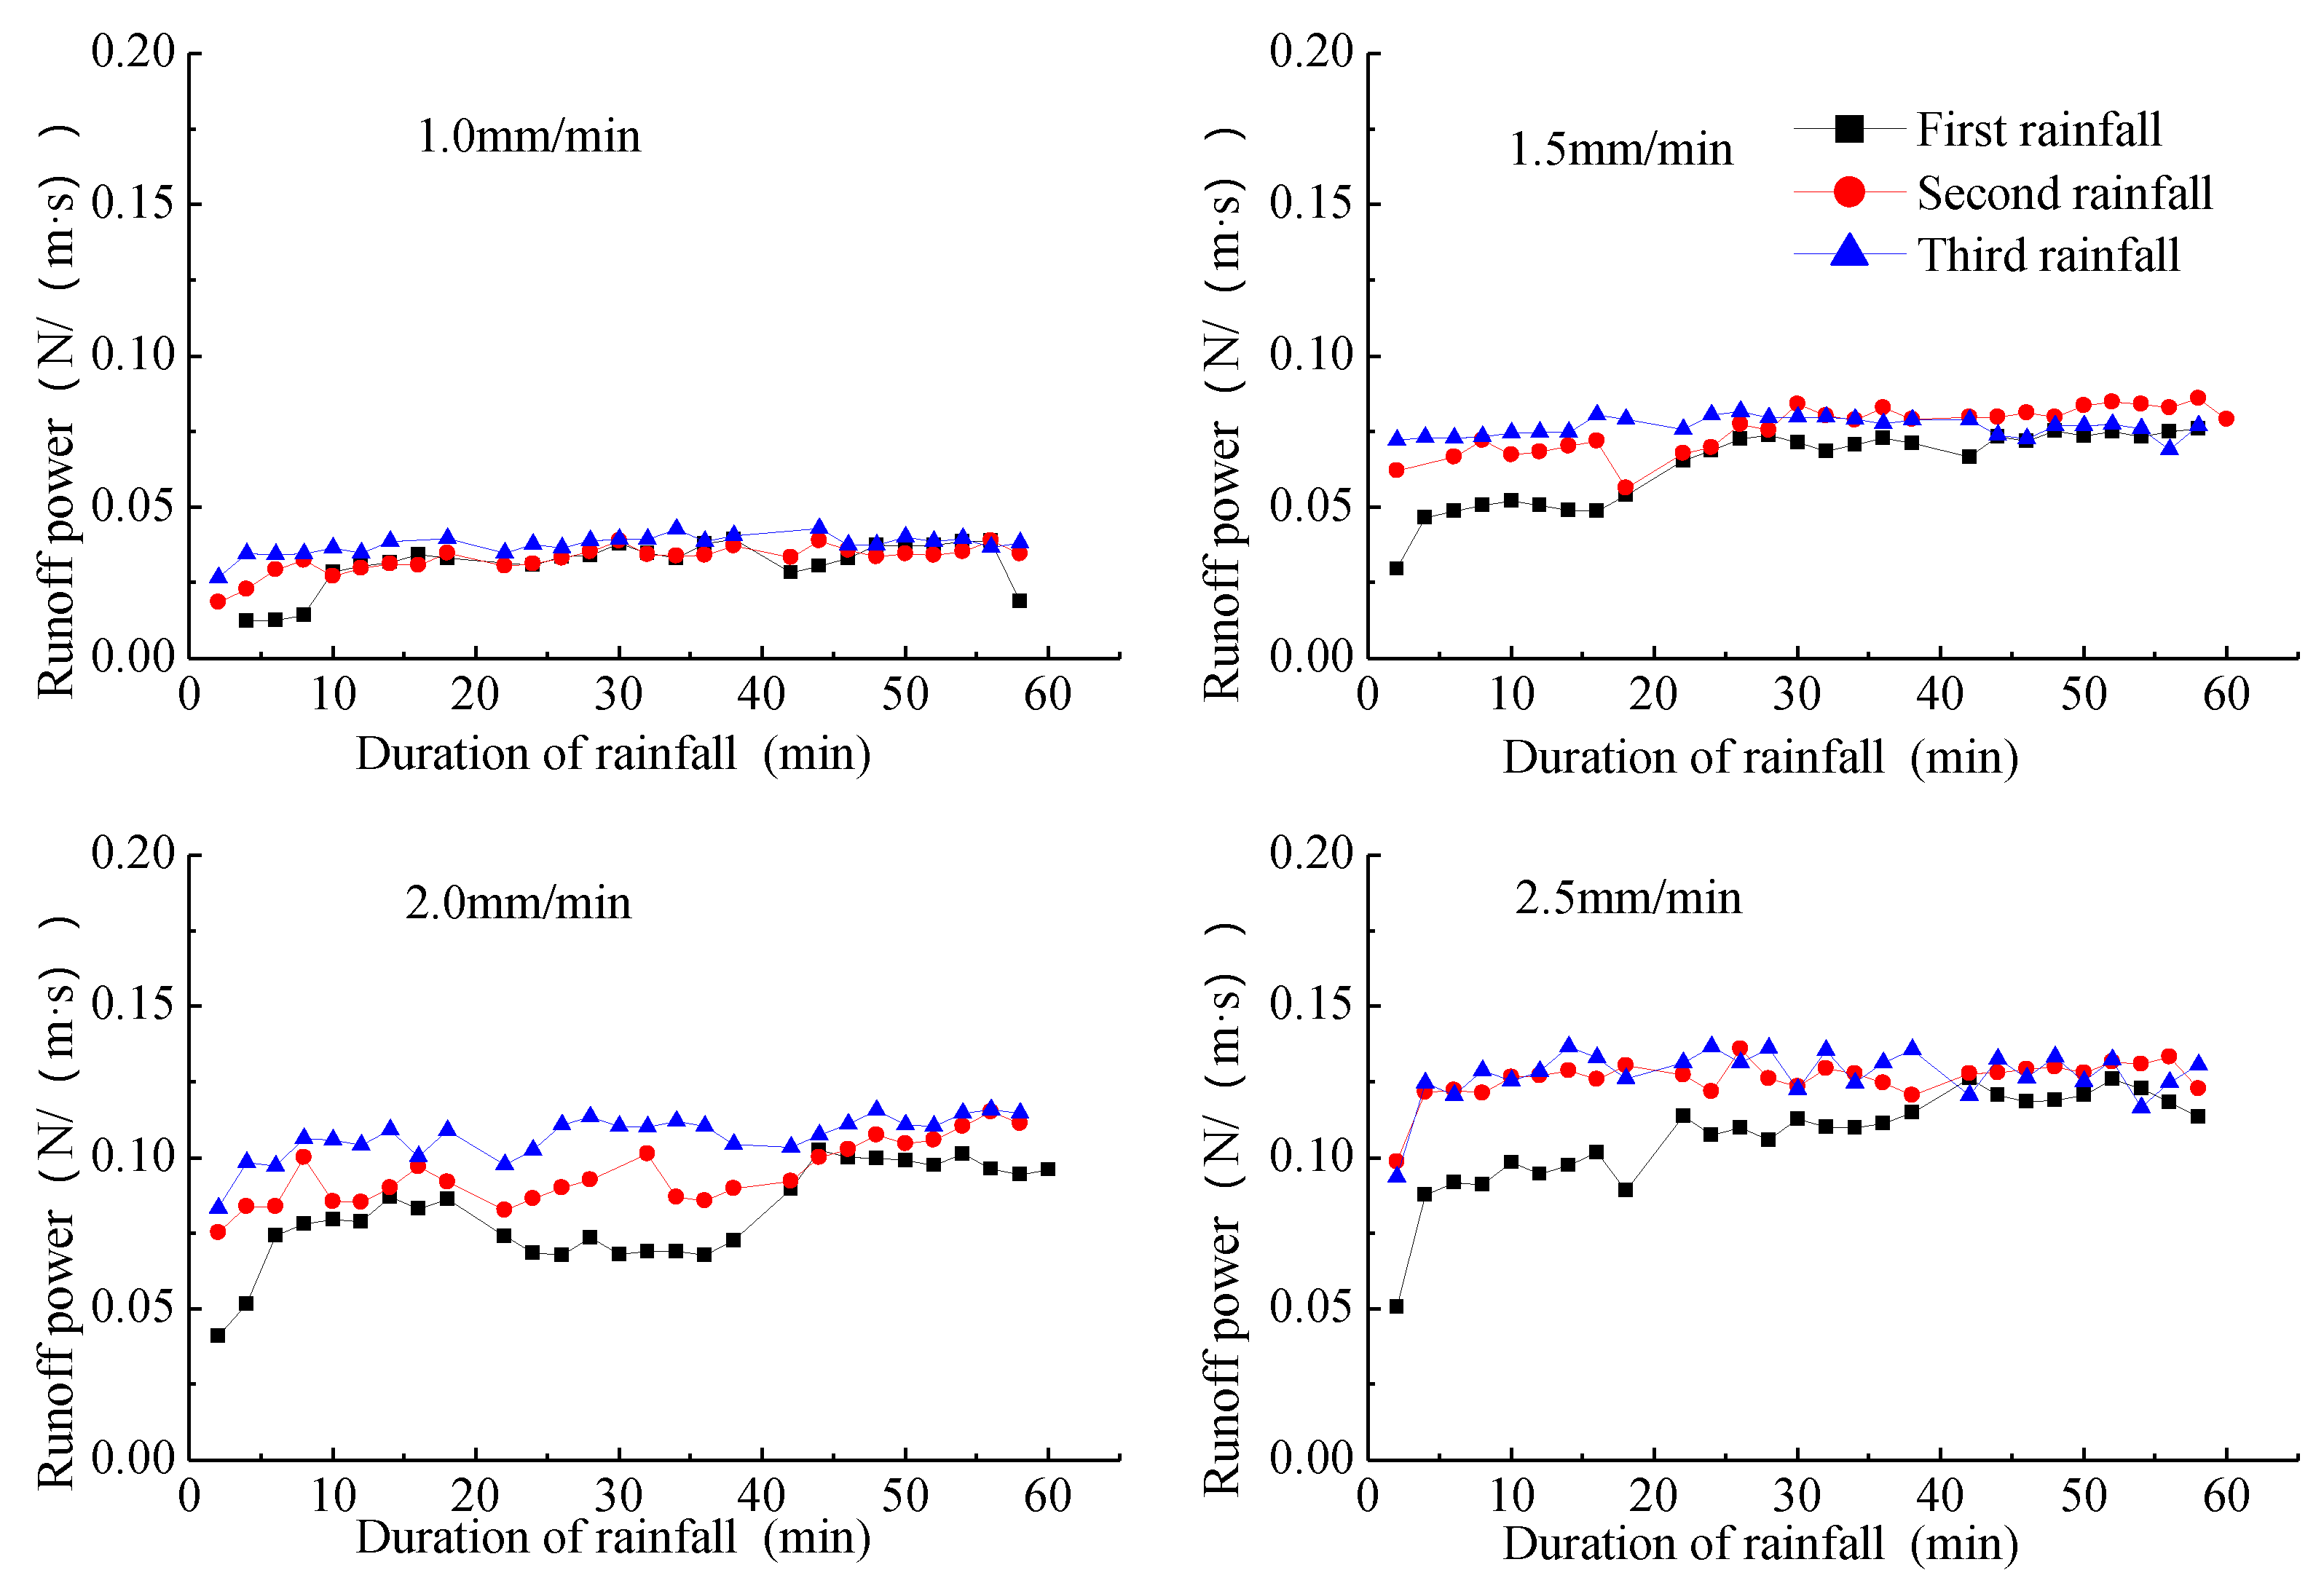
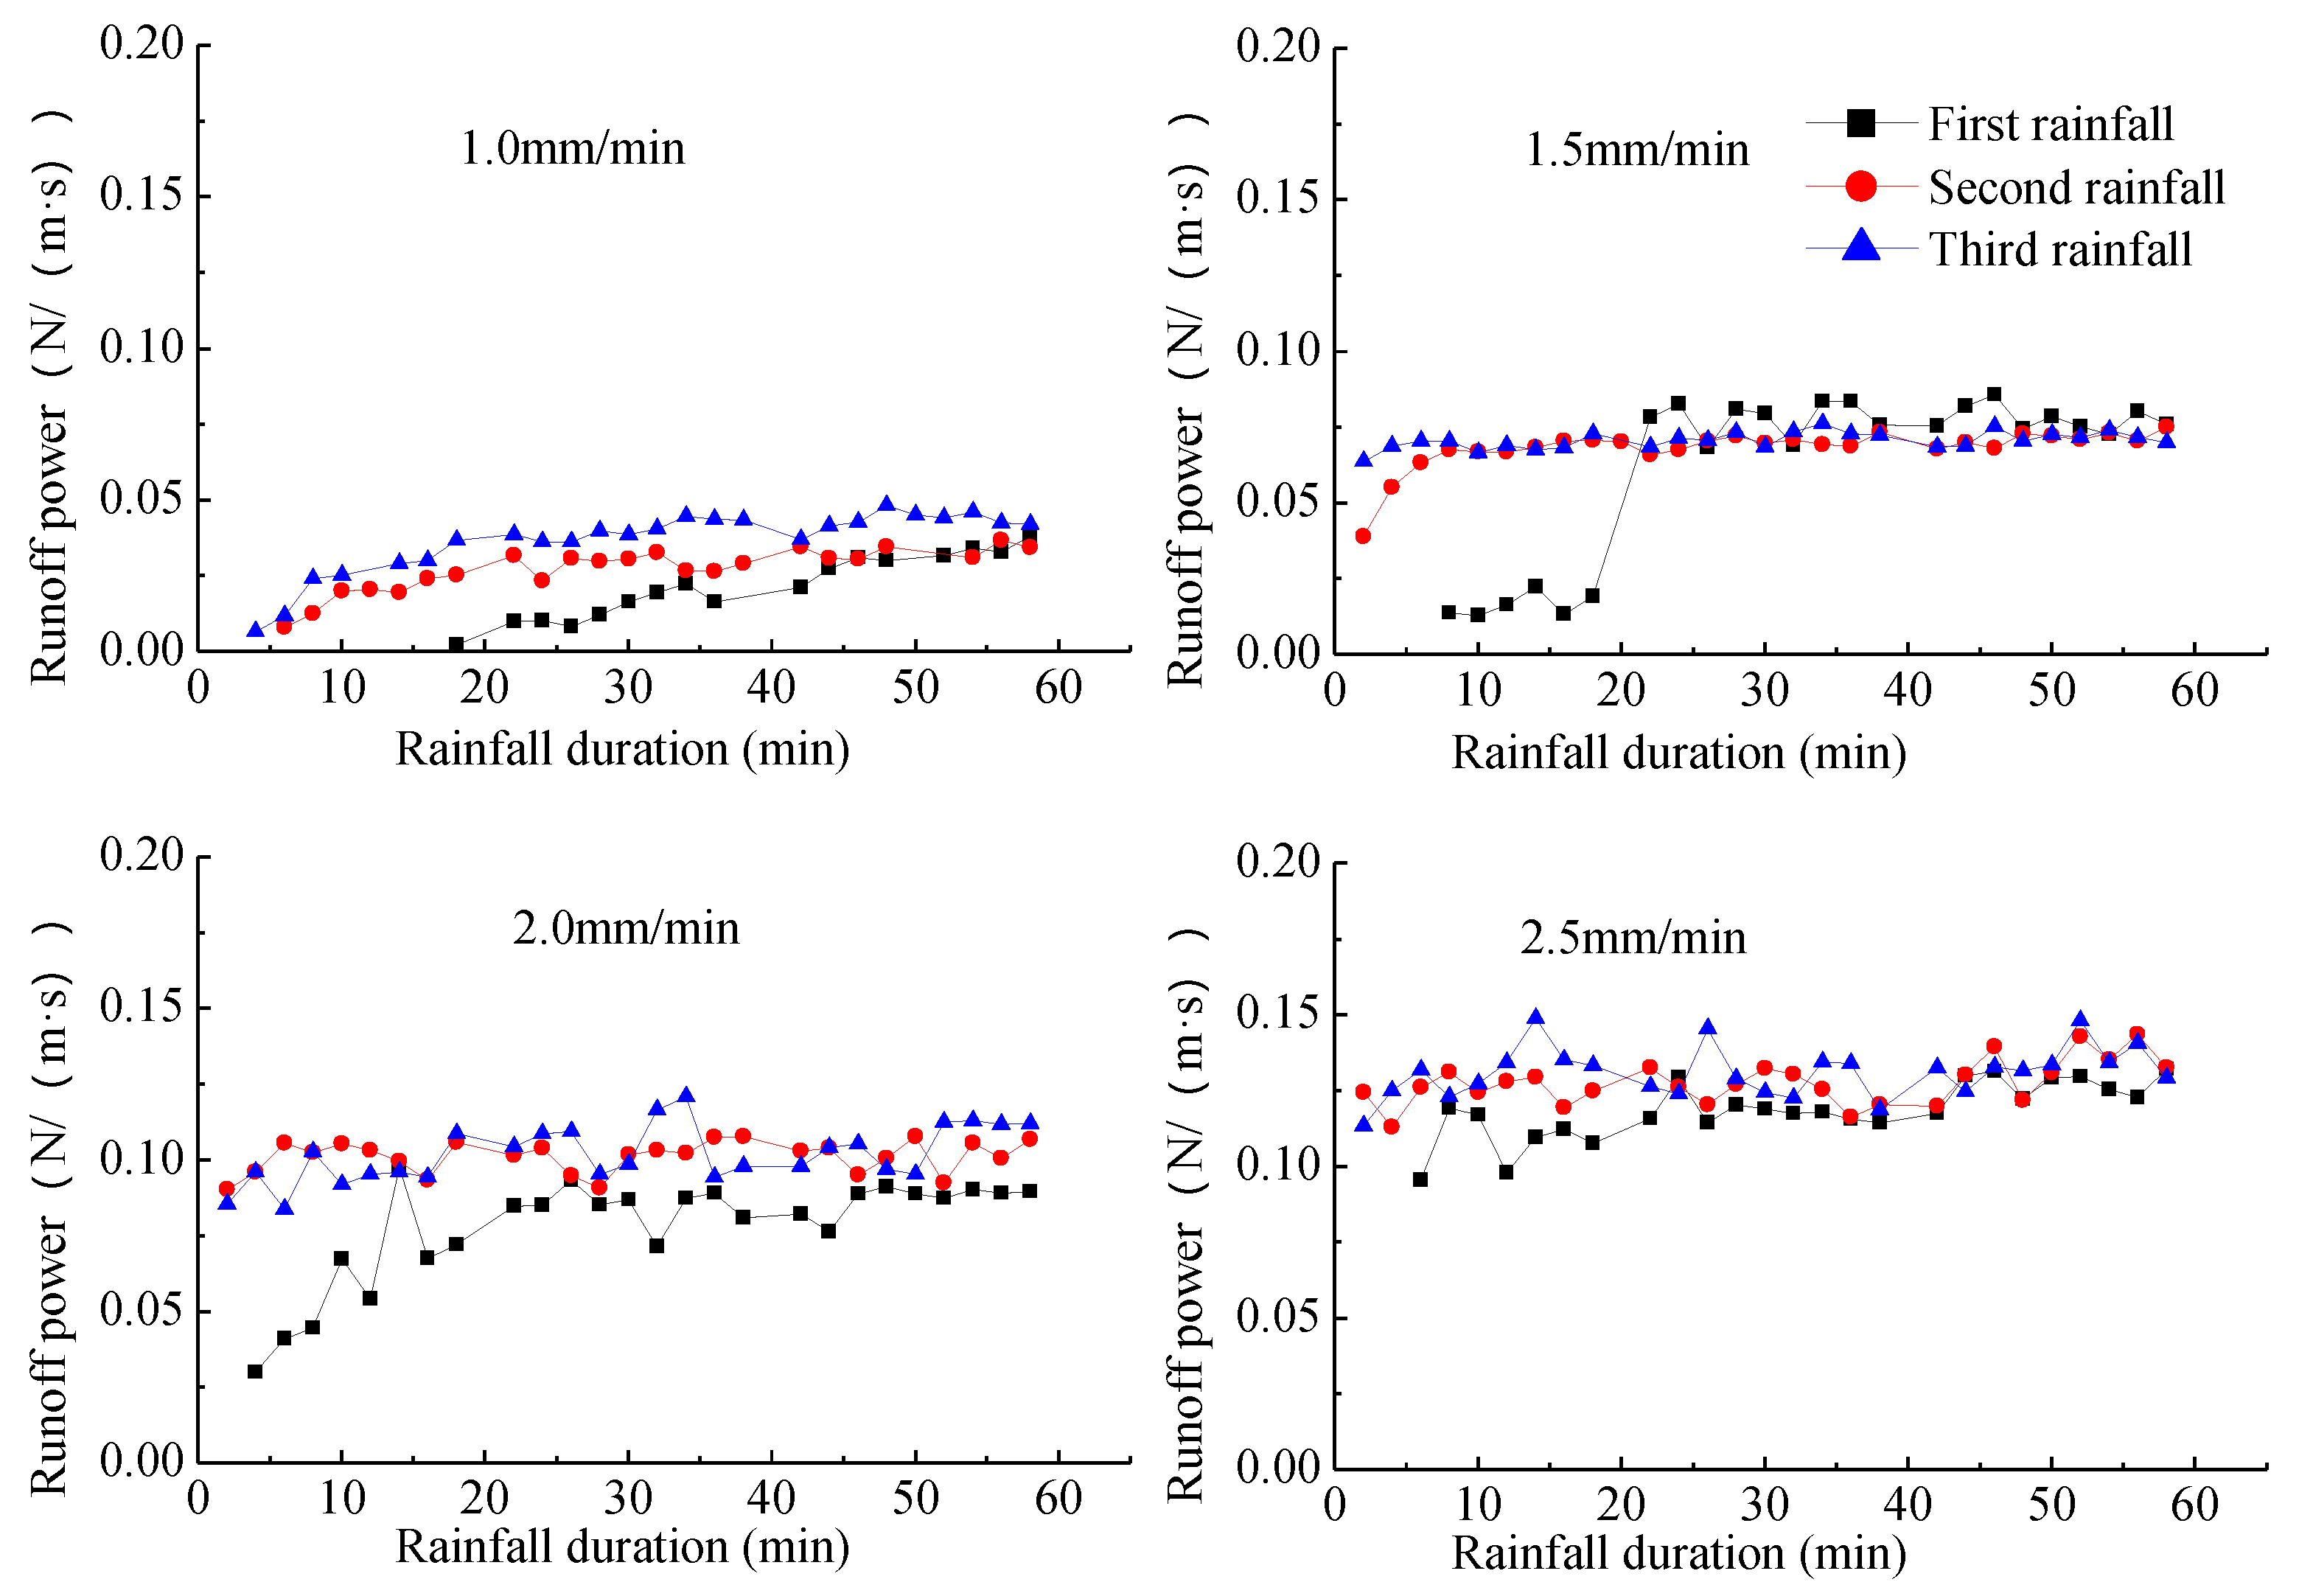
Runoff power refers to the change rate of water potential energy with time per unit of area. This study uses the following method to calculate runoff power:where ω is the runoff power of the slope, N/(m·s), and the other letters have the same meaning as denoted previously.
2.4. Data Processing and Analysis
3. Result
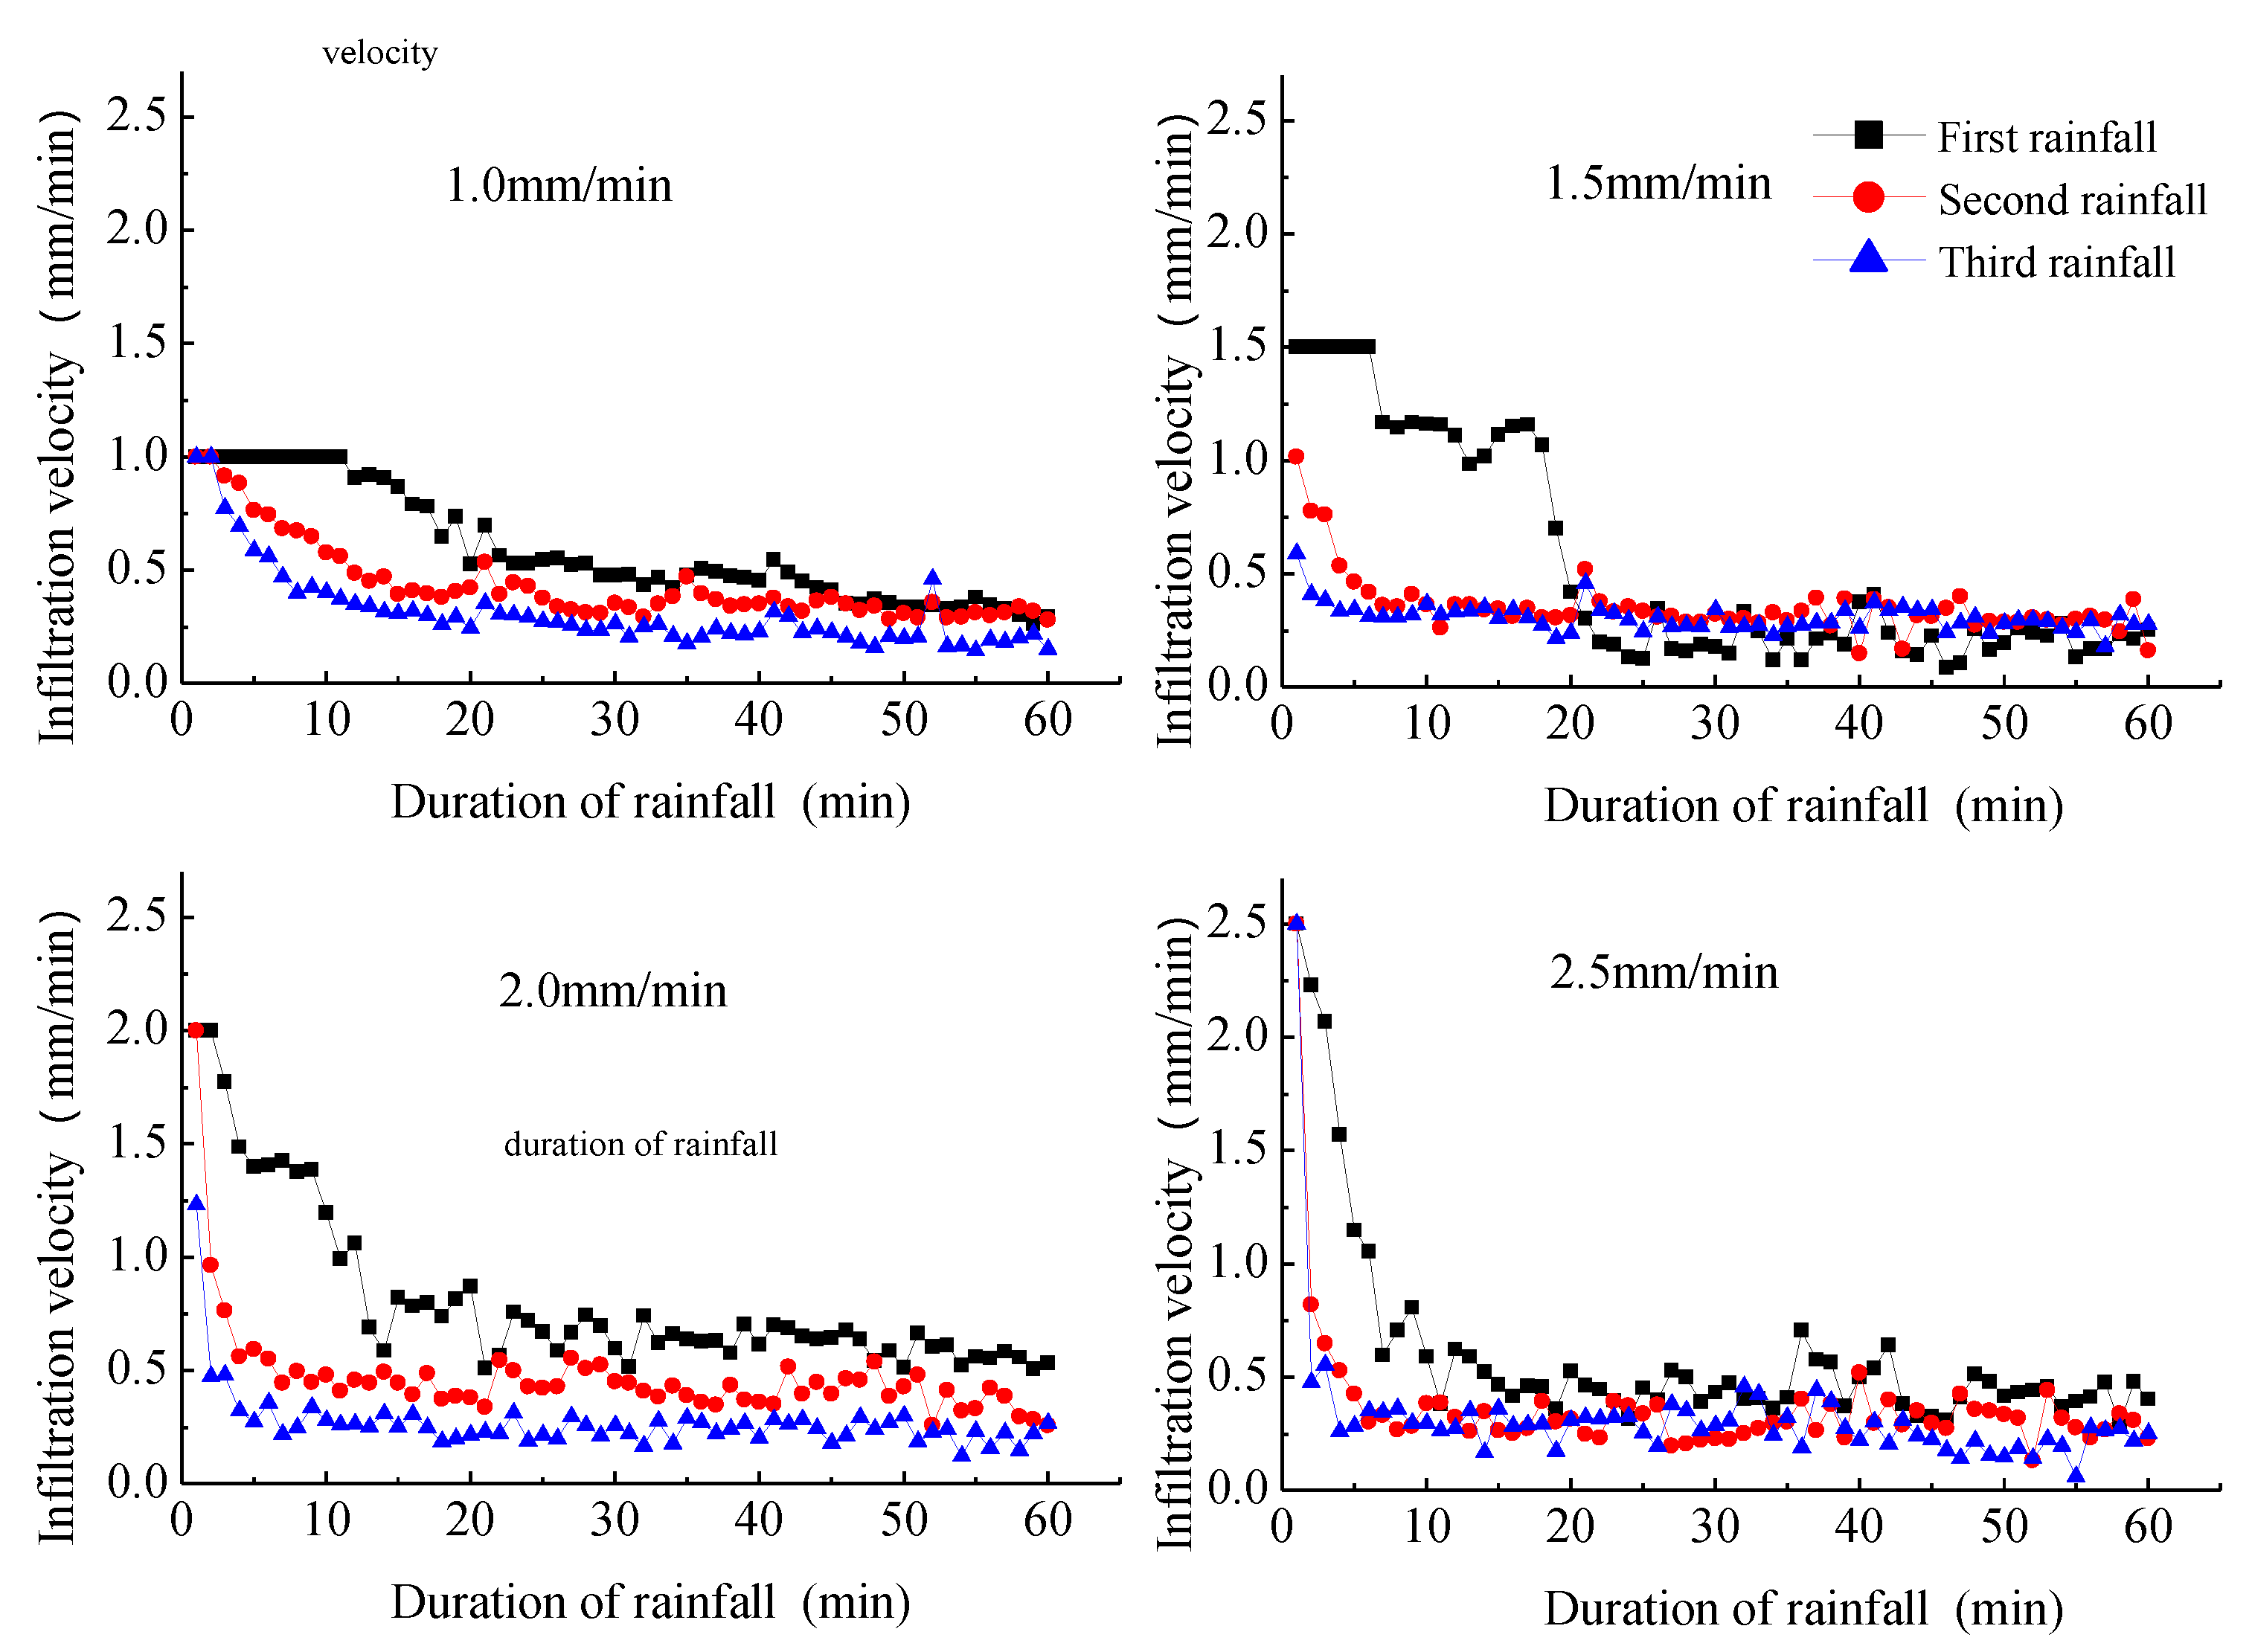
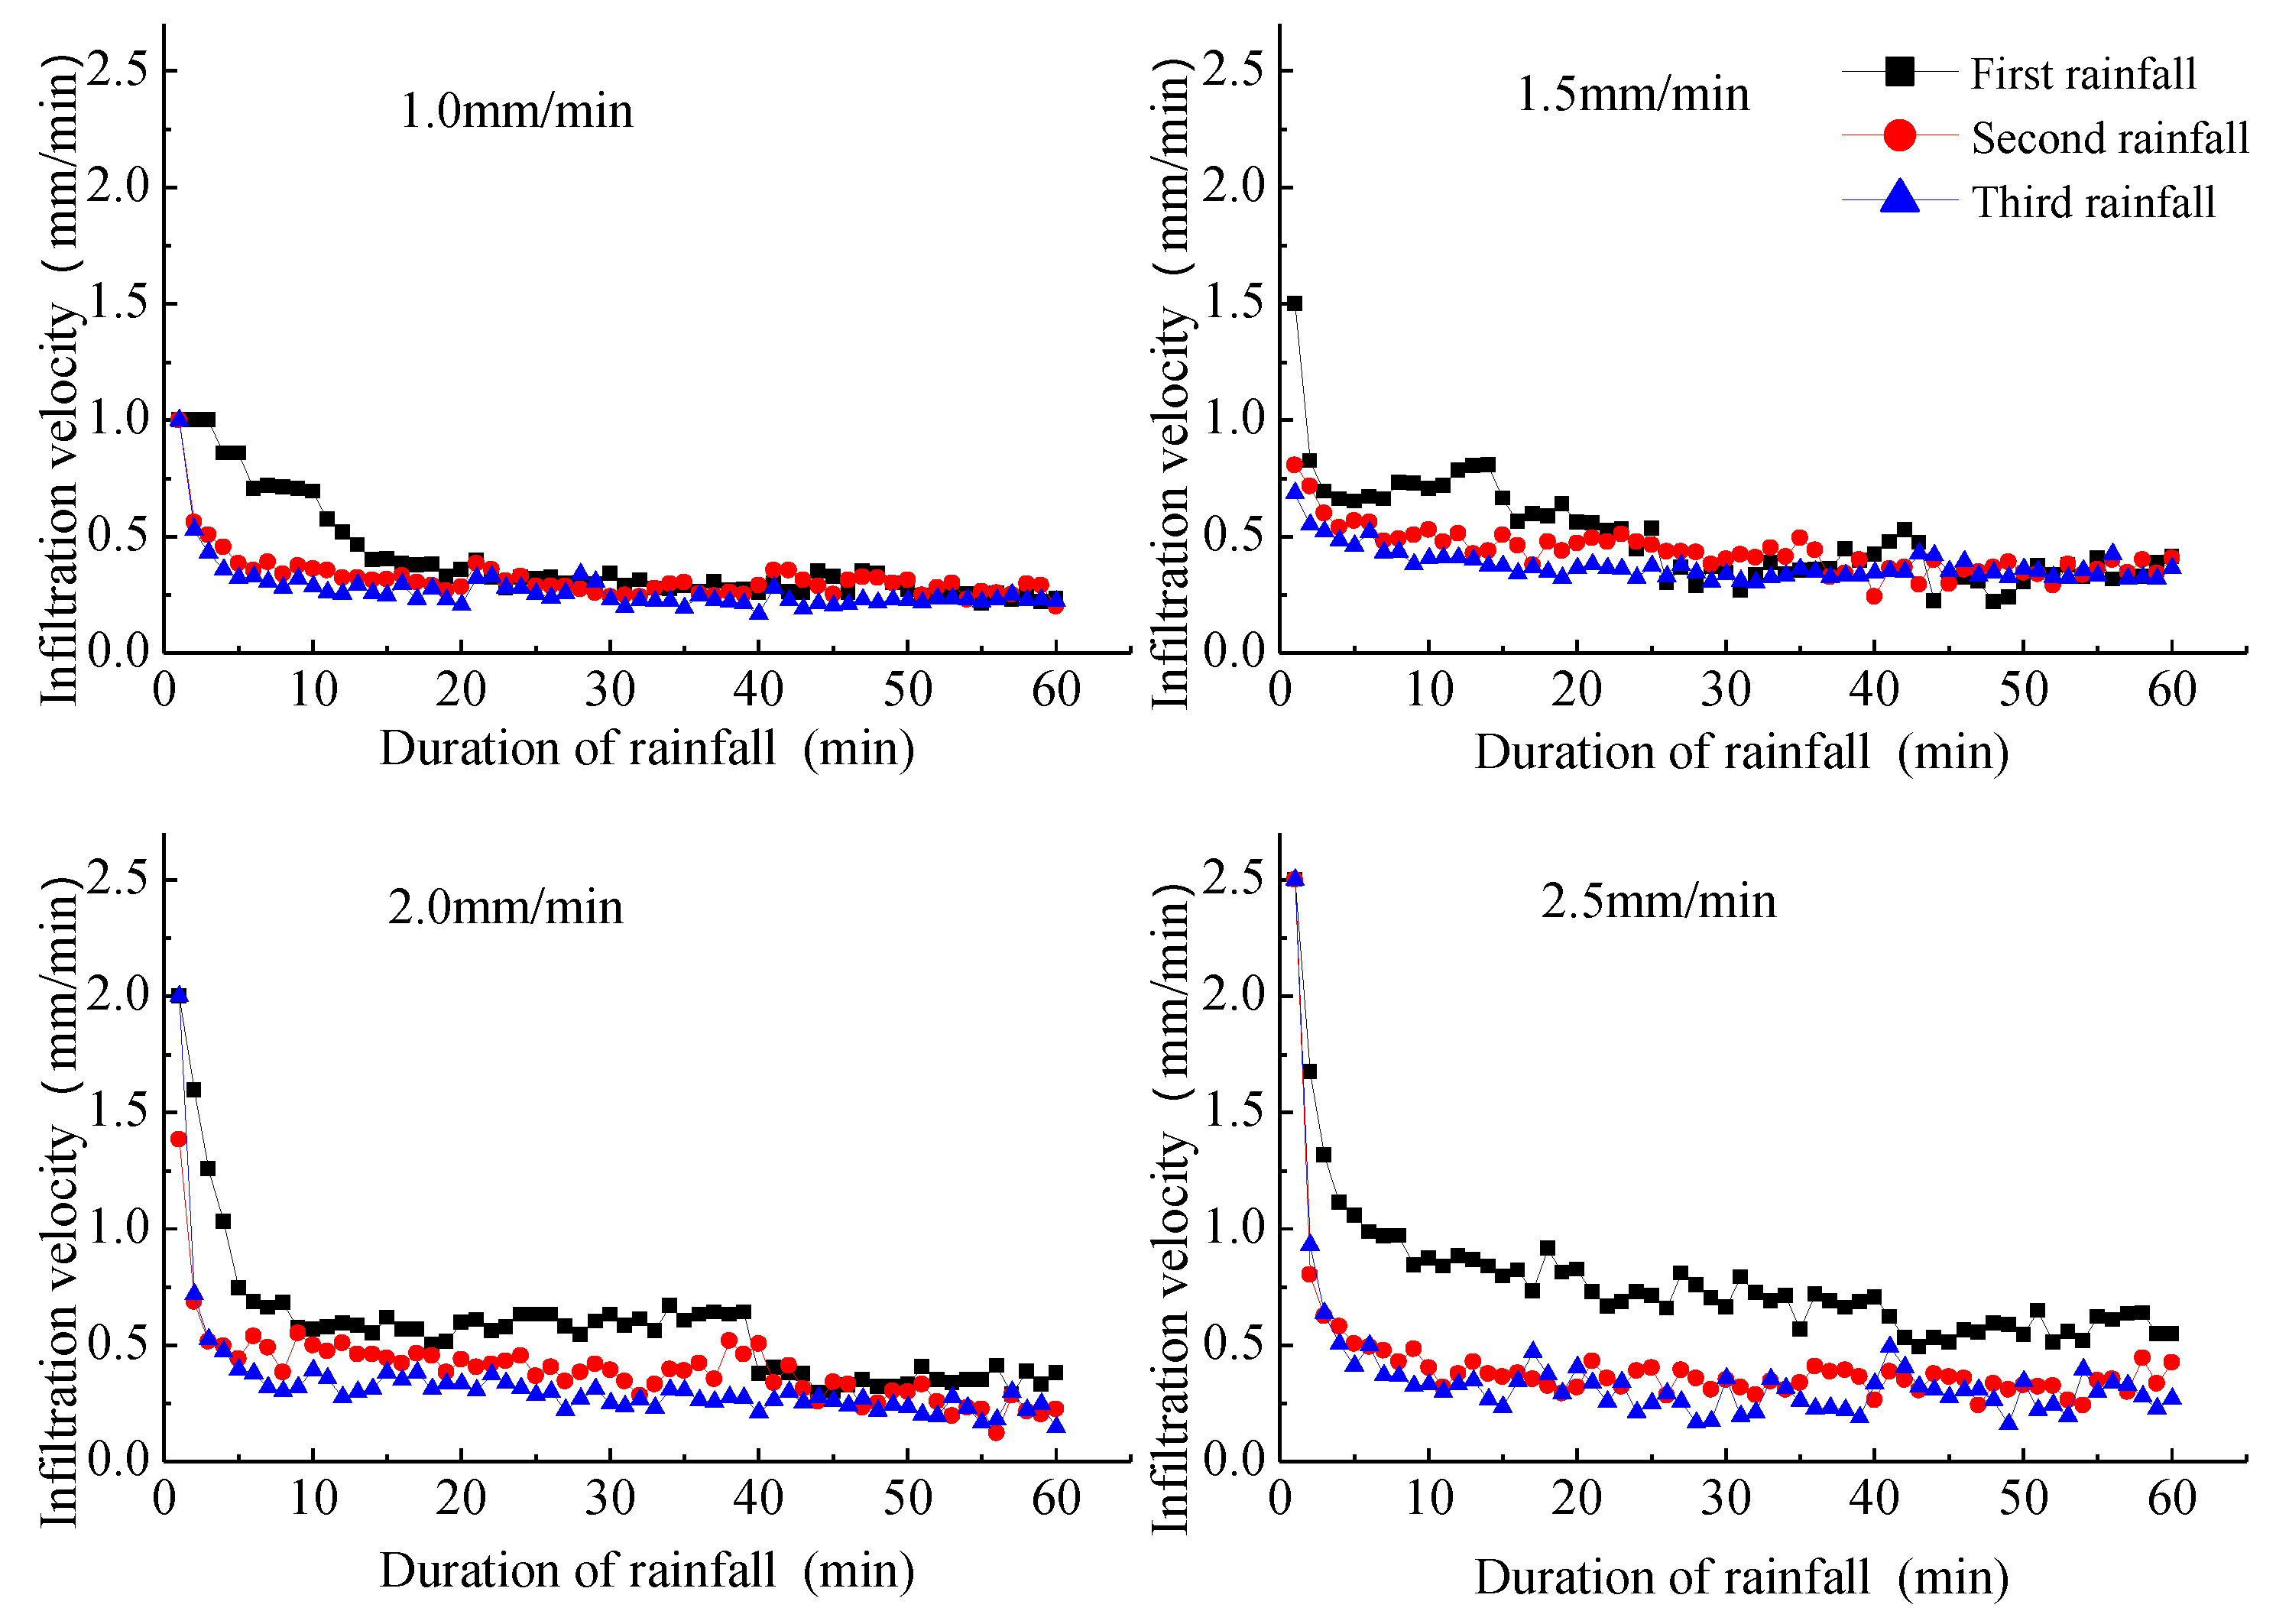
3.1. Infiltration and Runoff Process on Sandy Slope
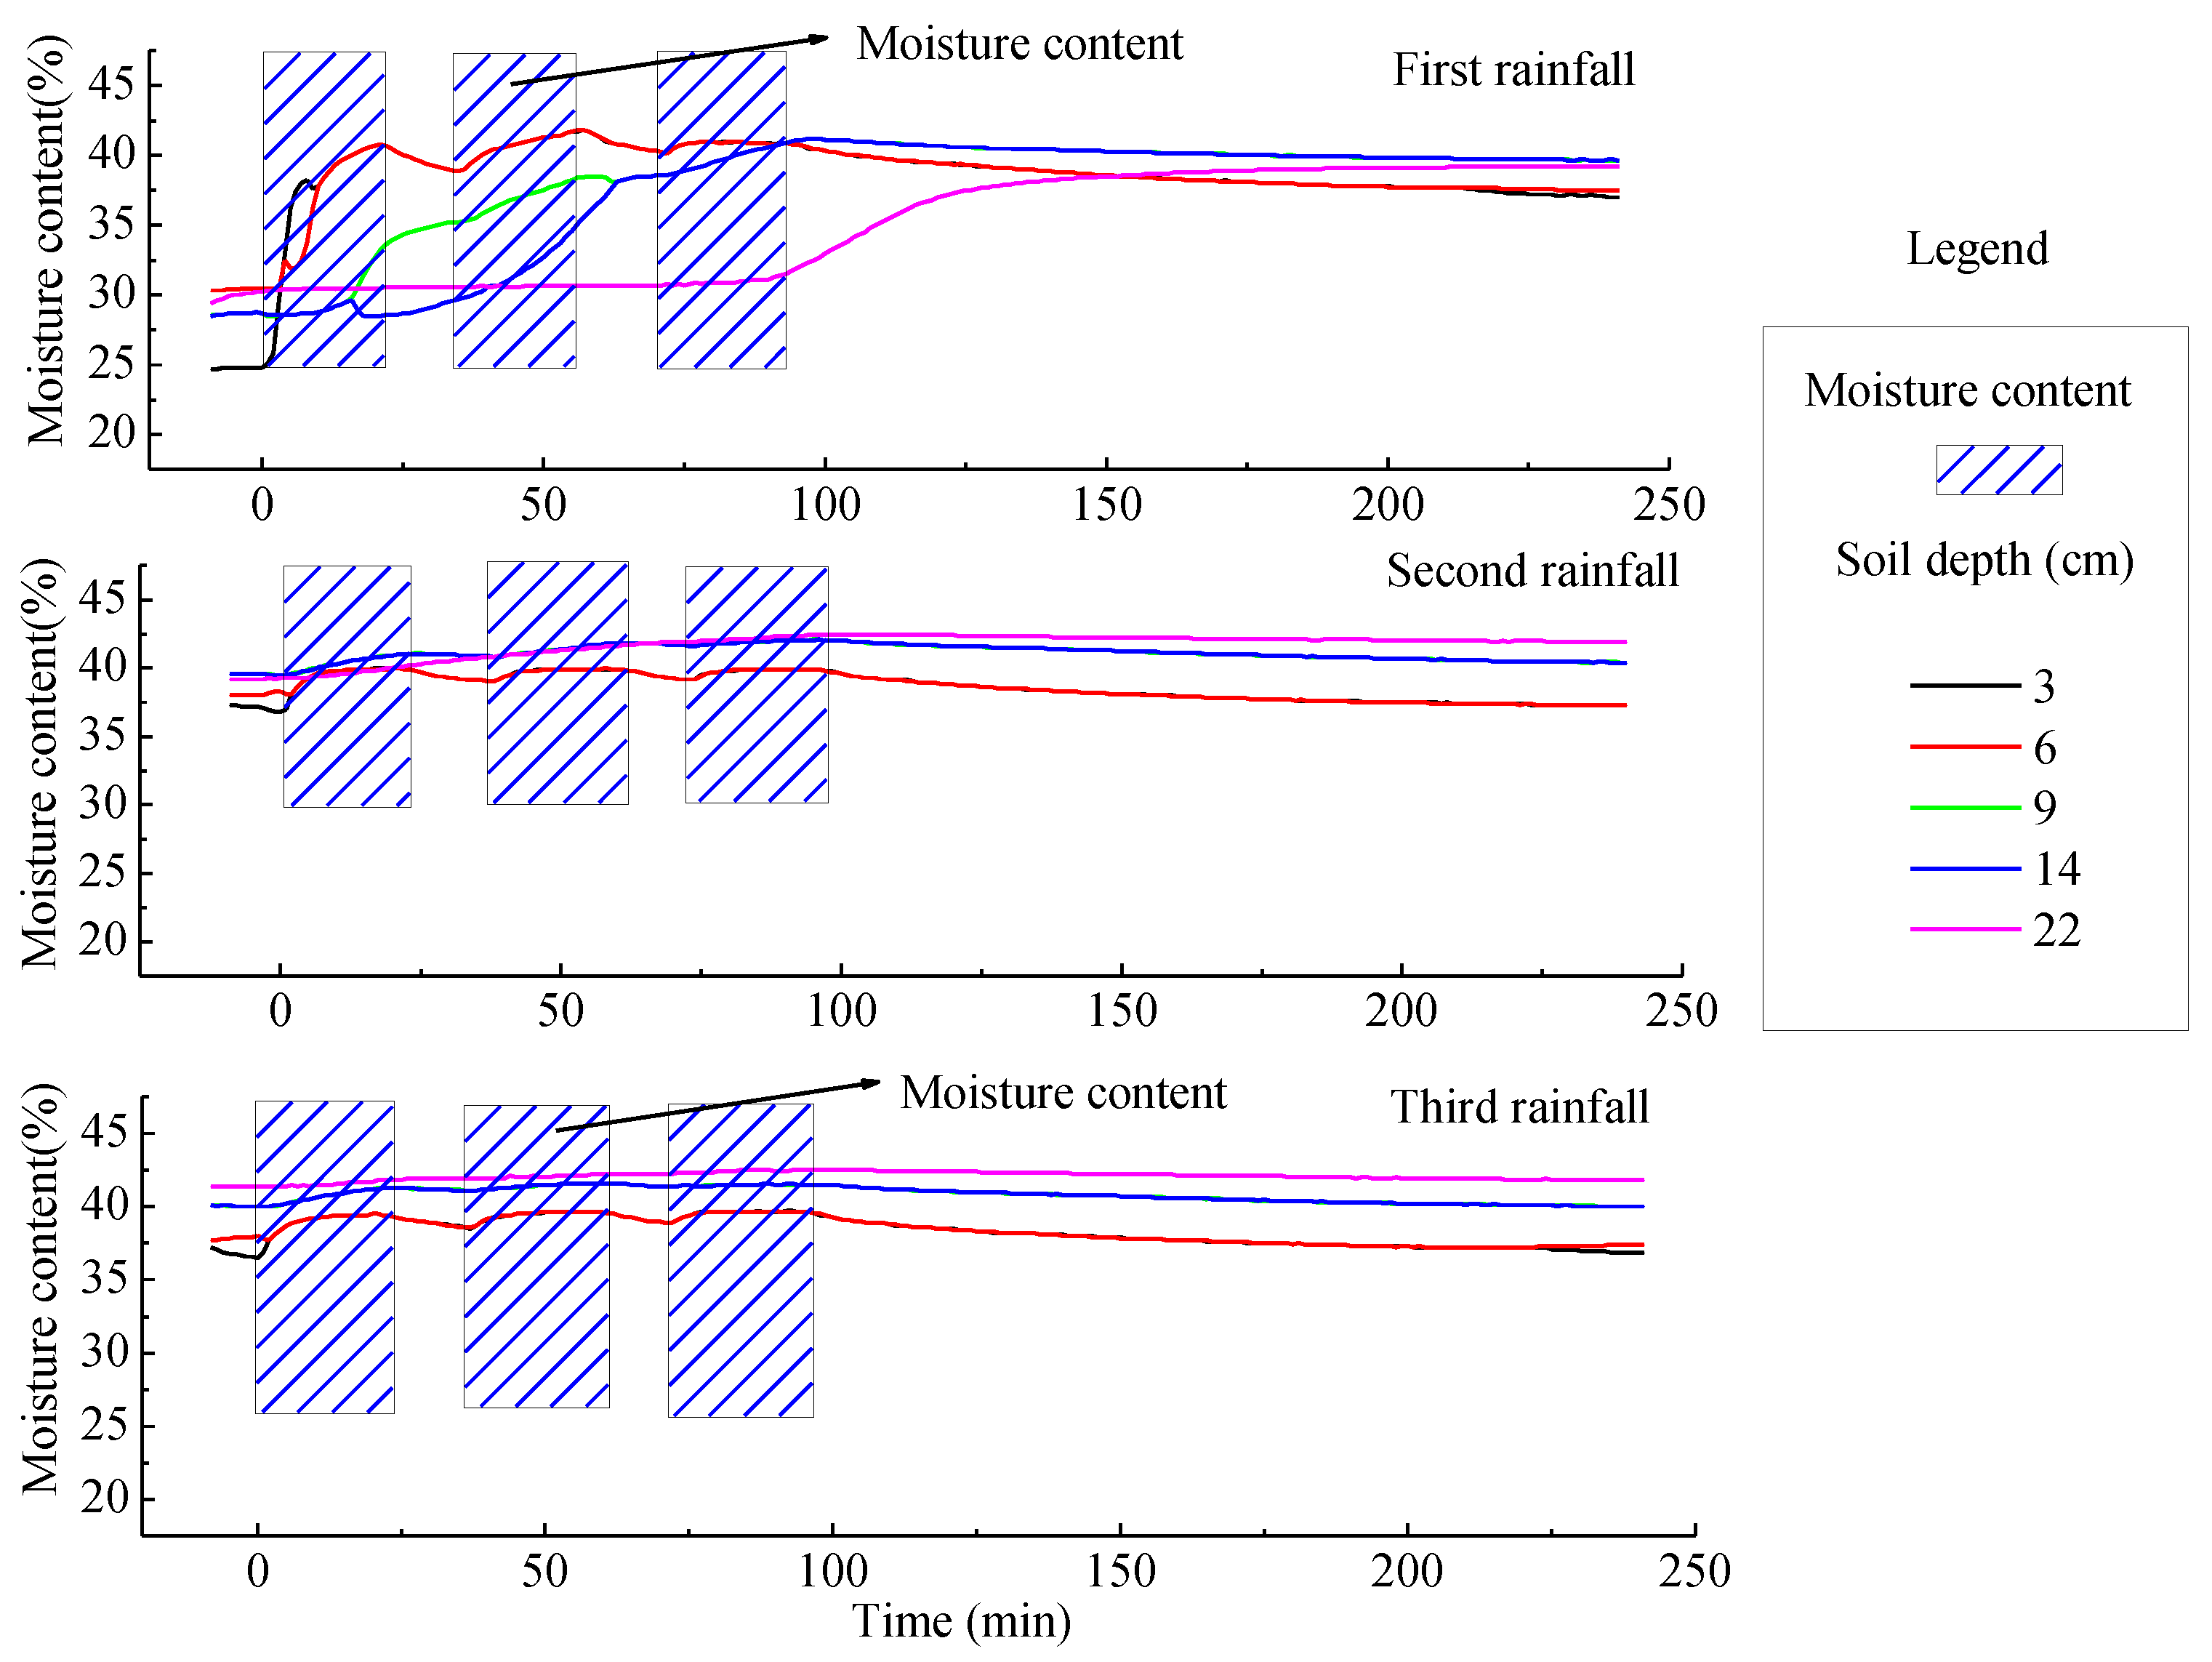
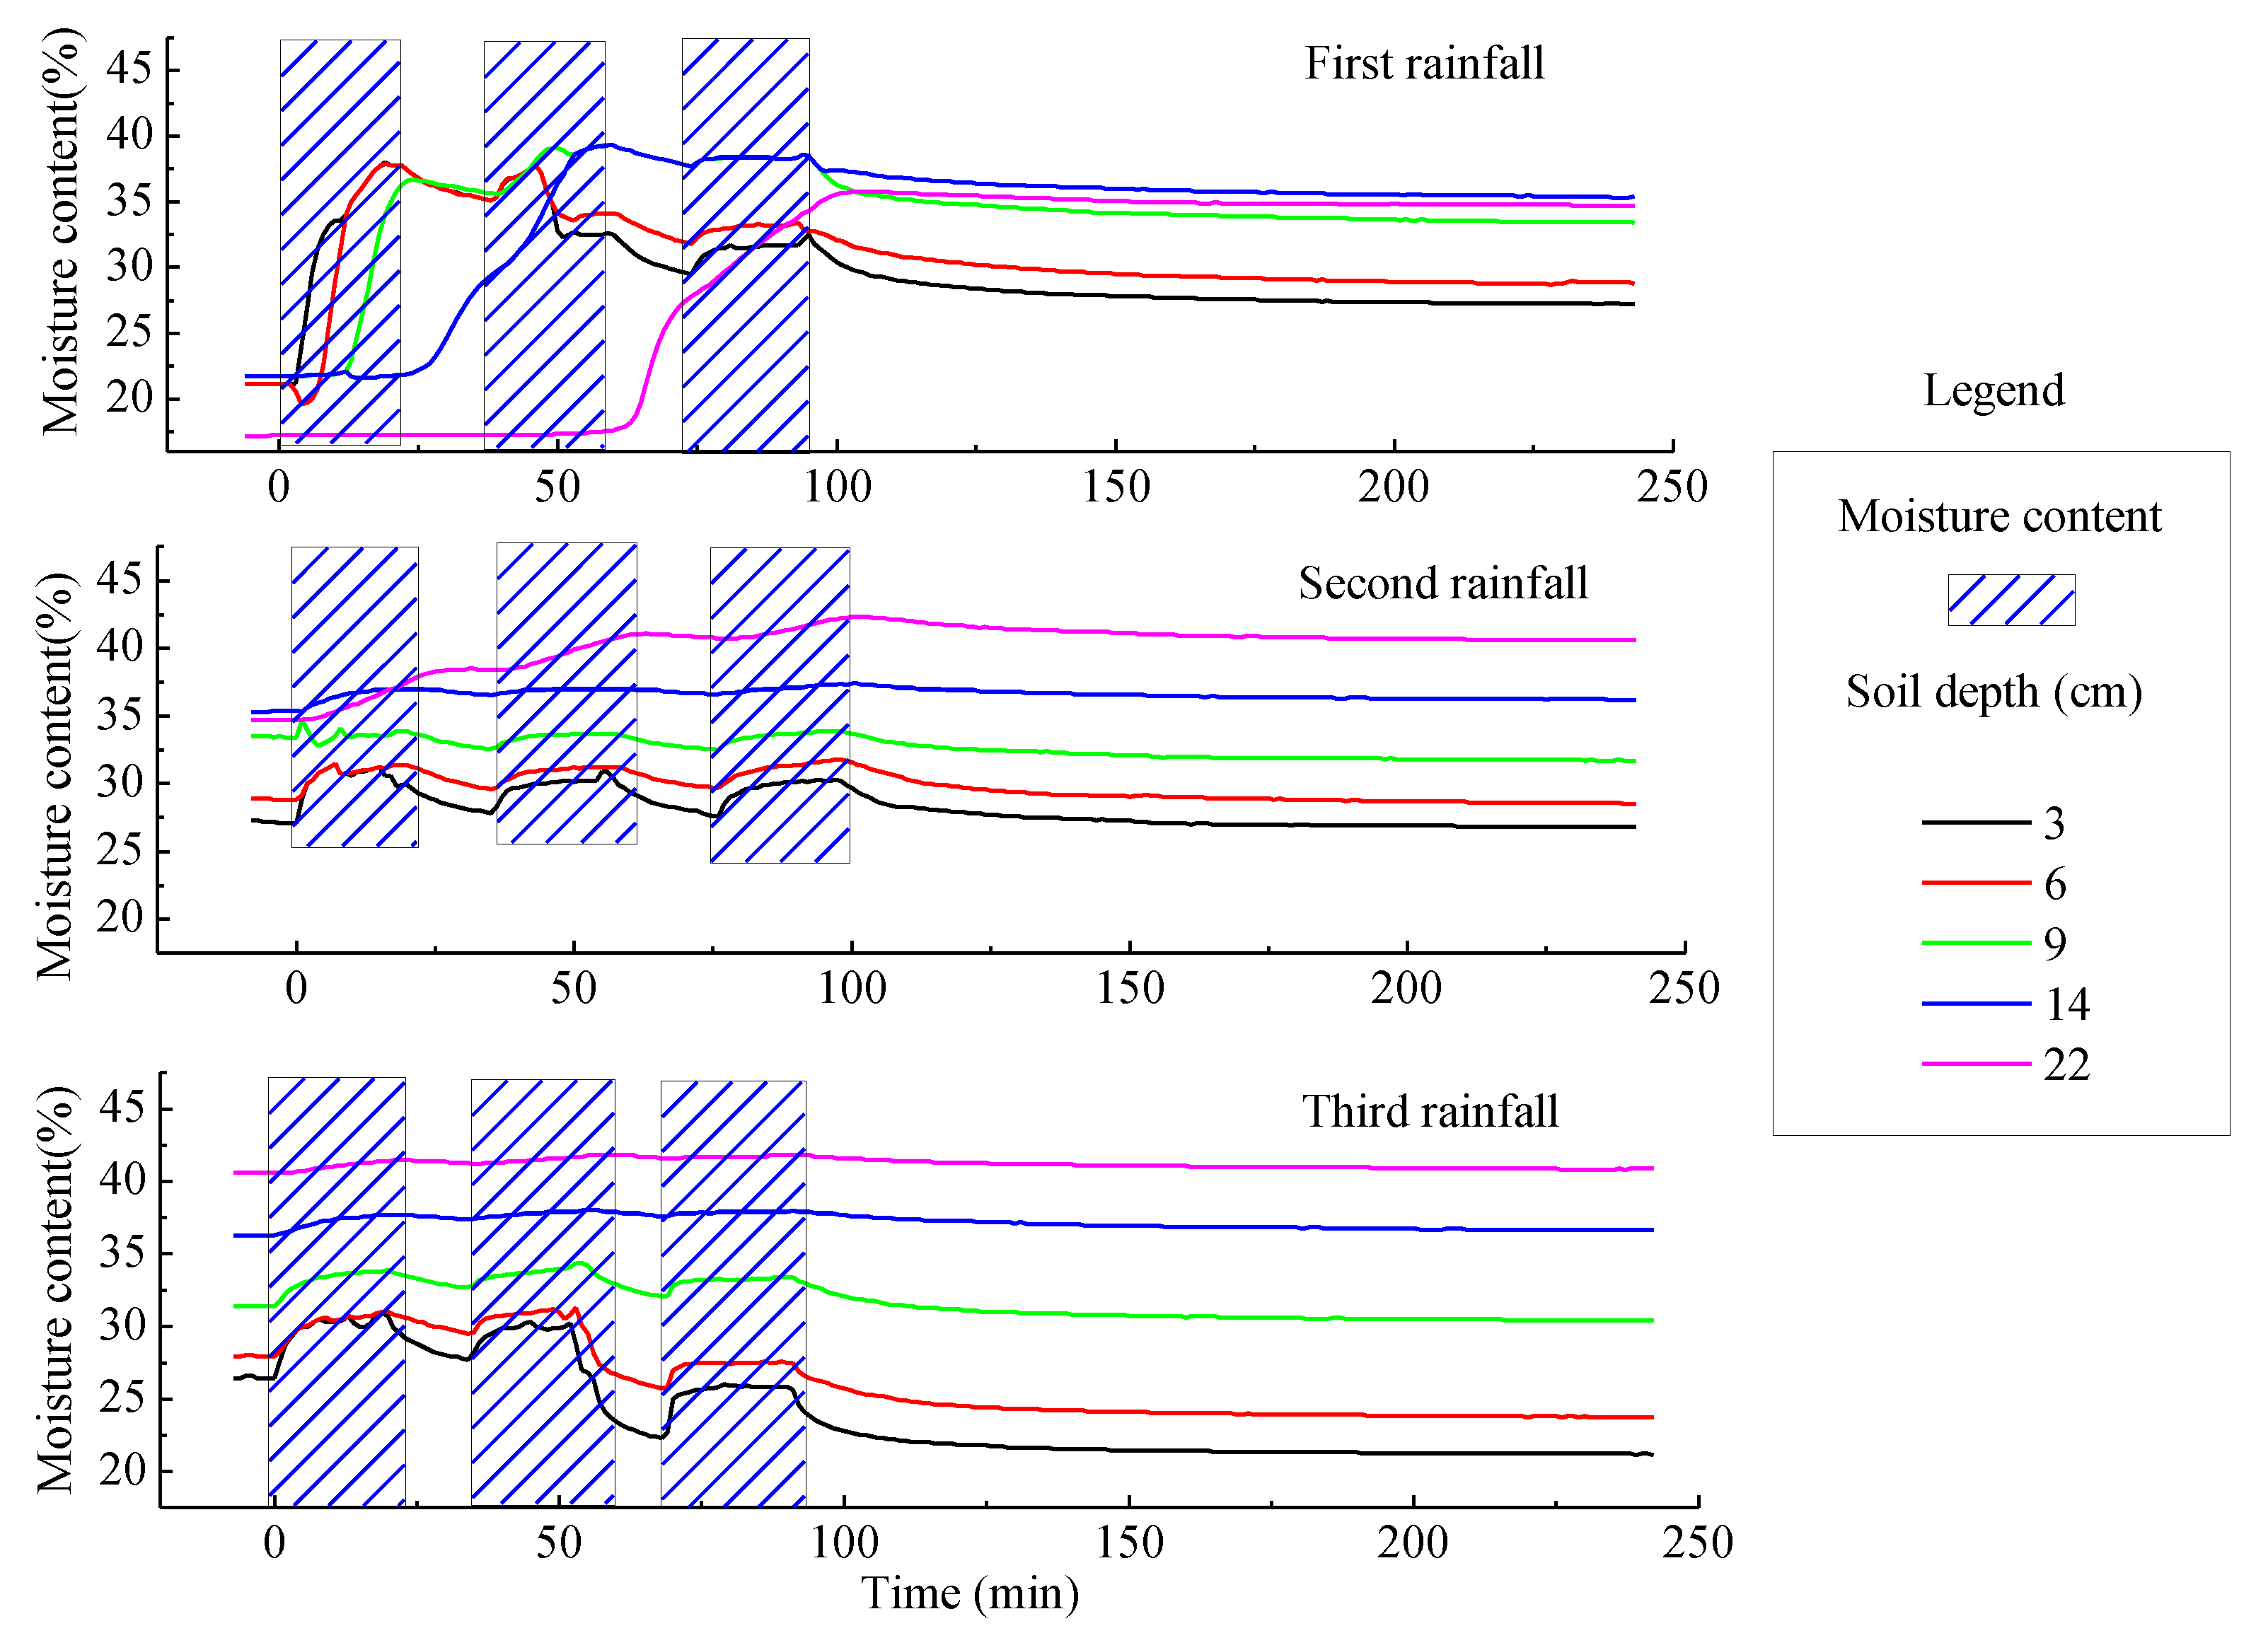
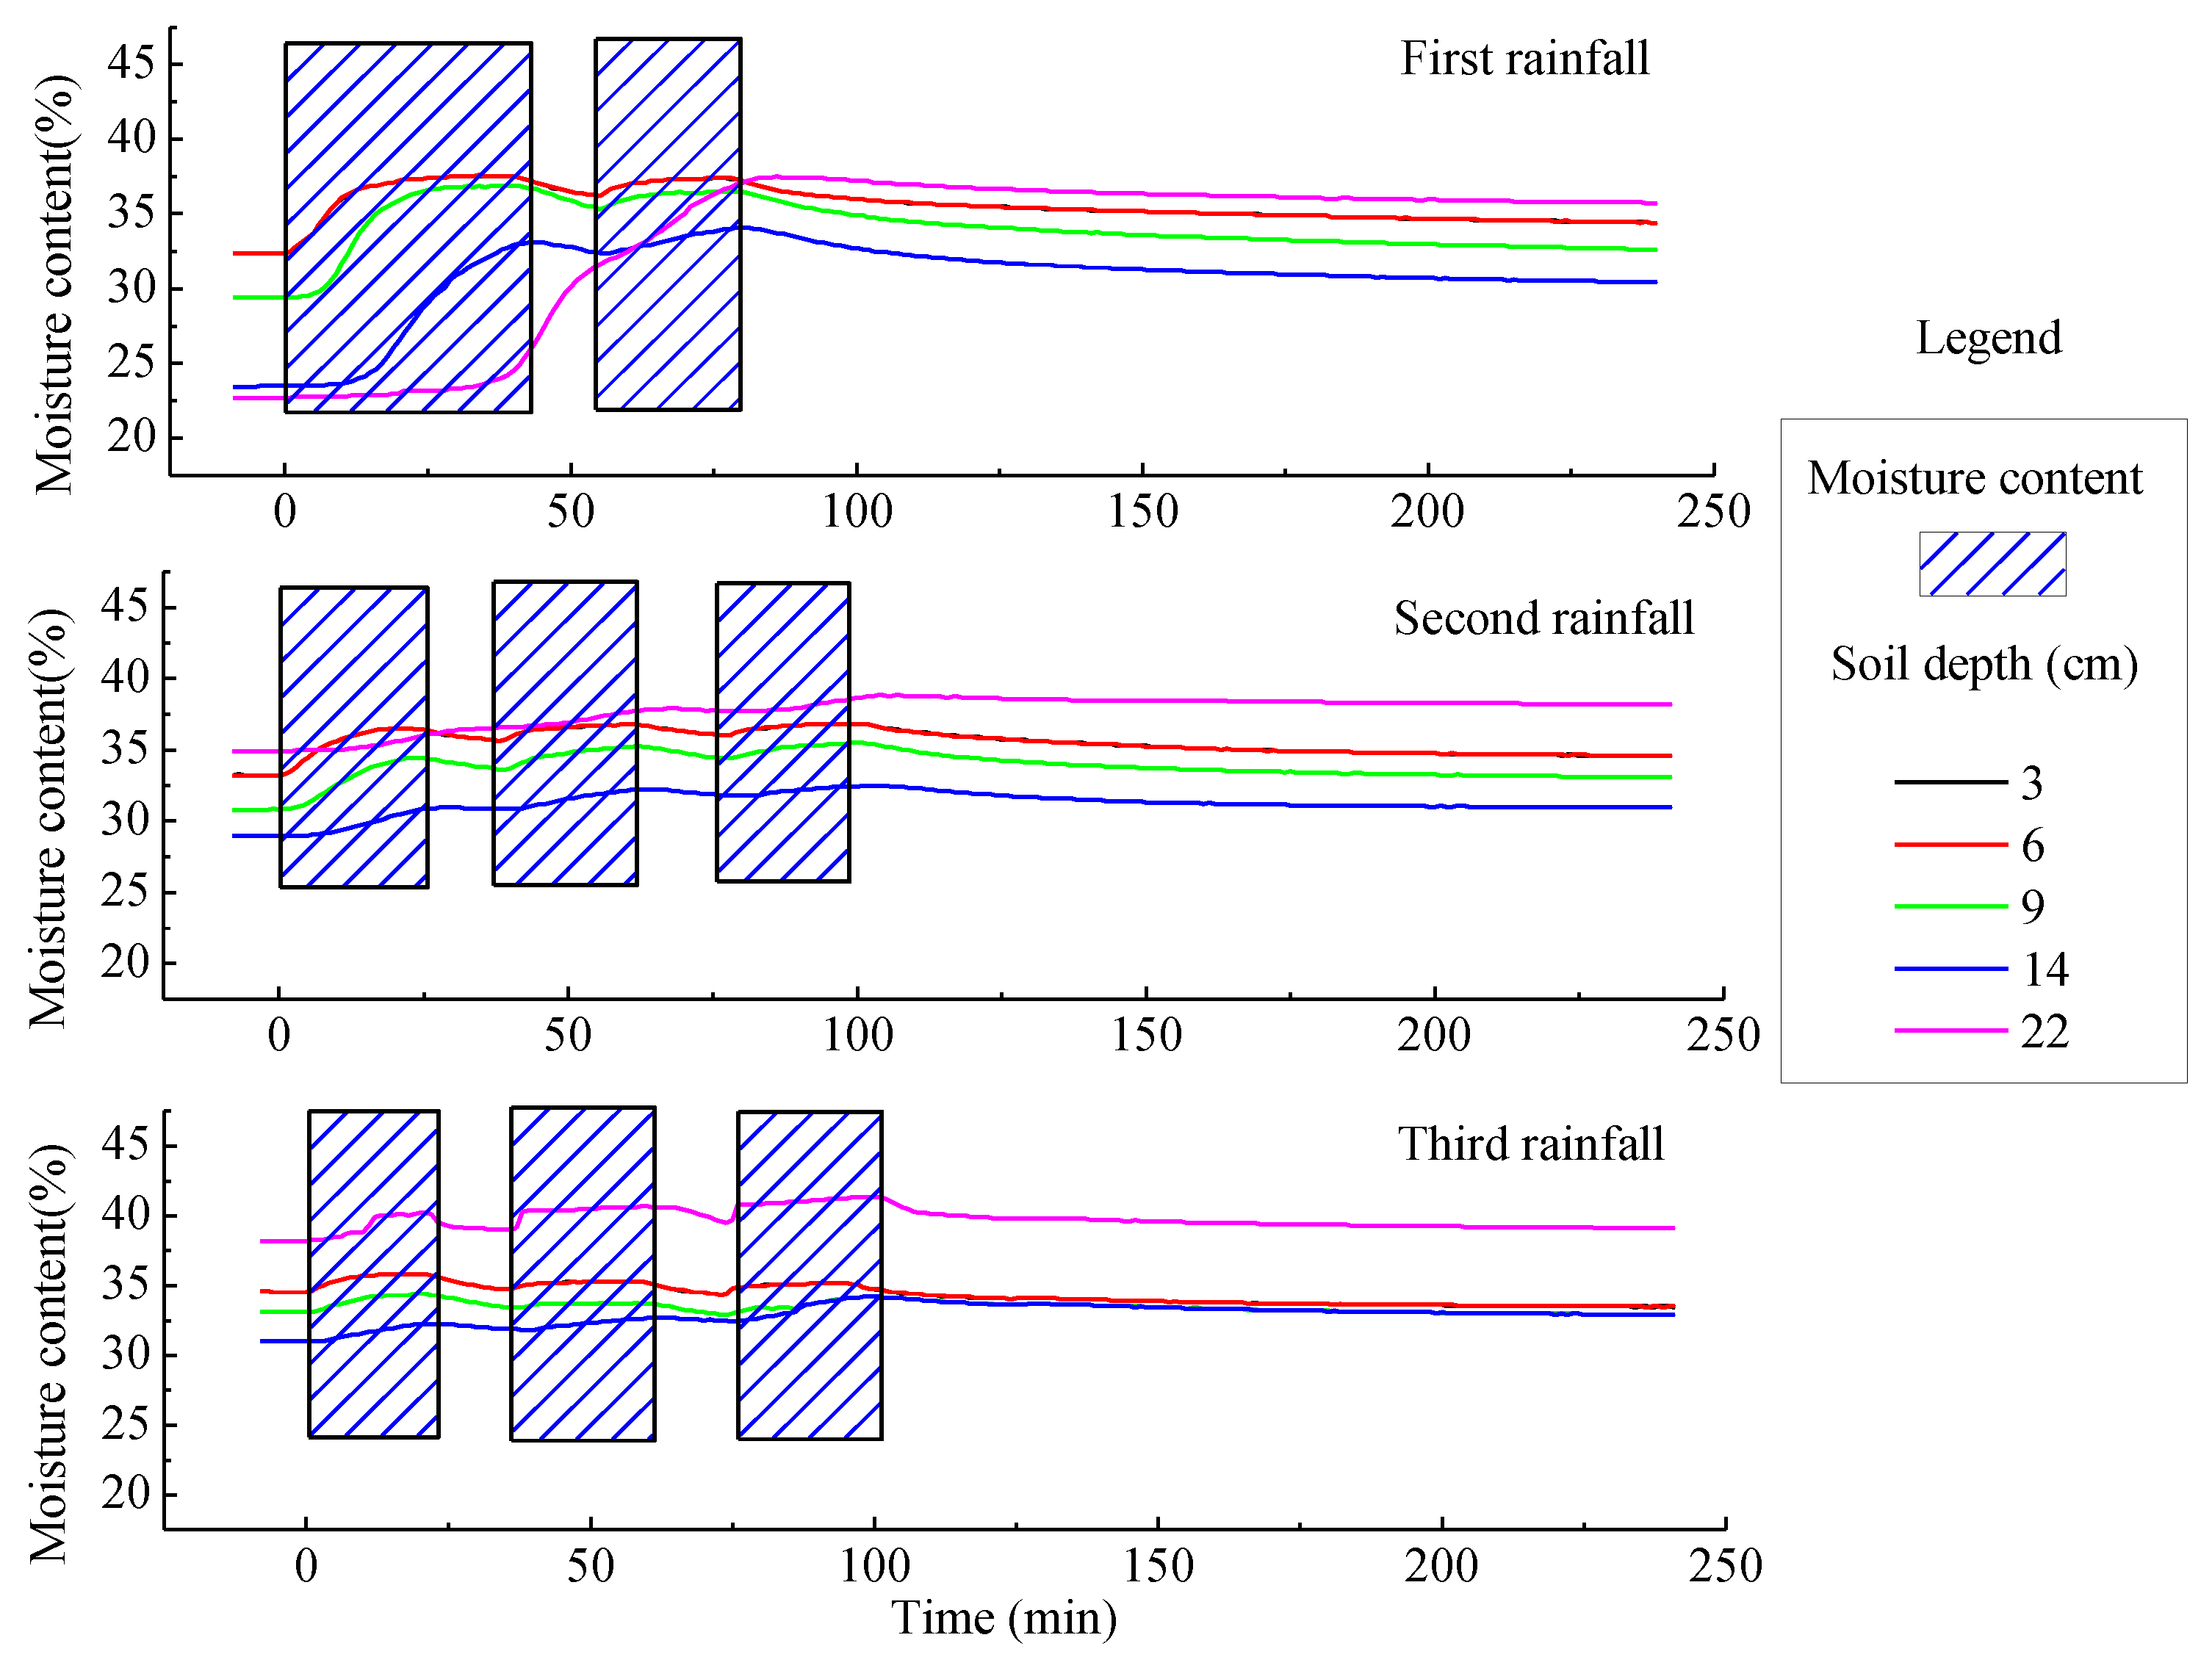
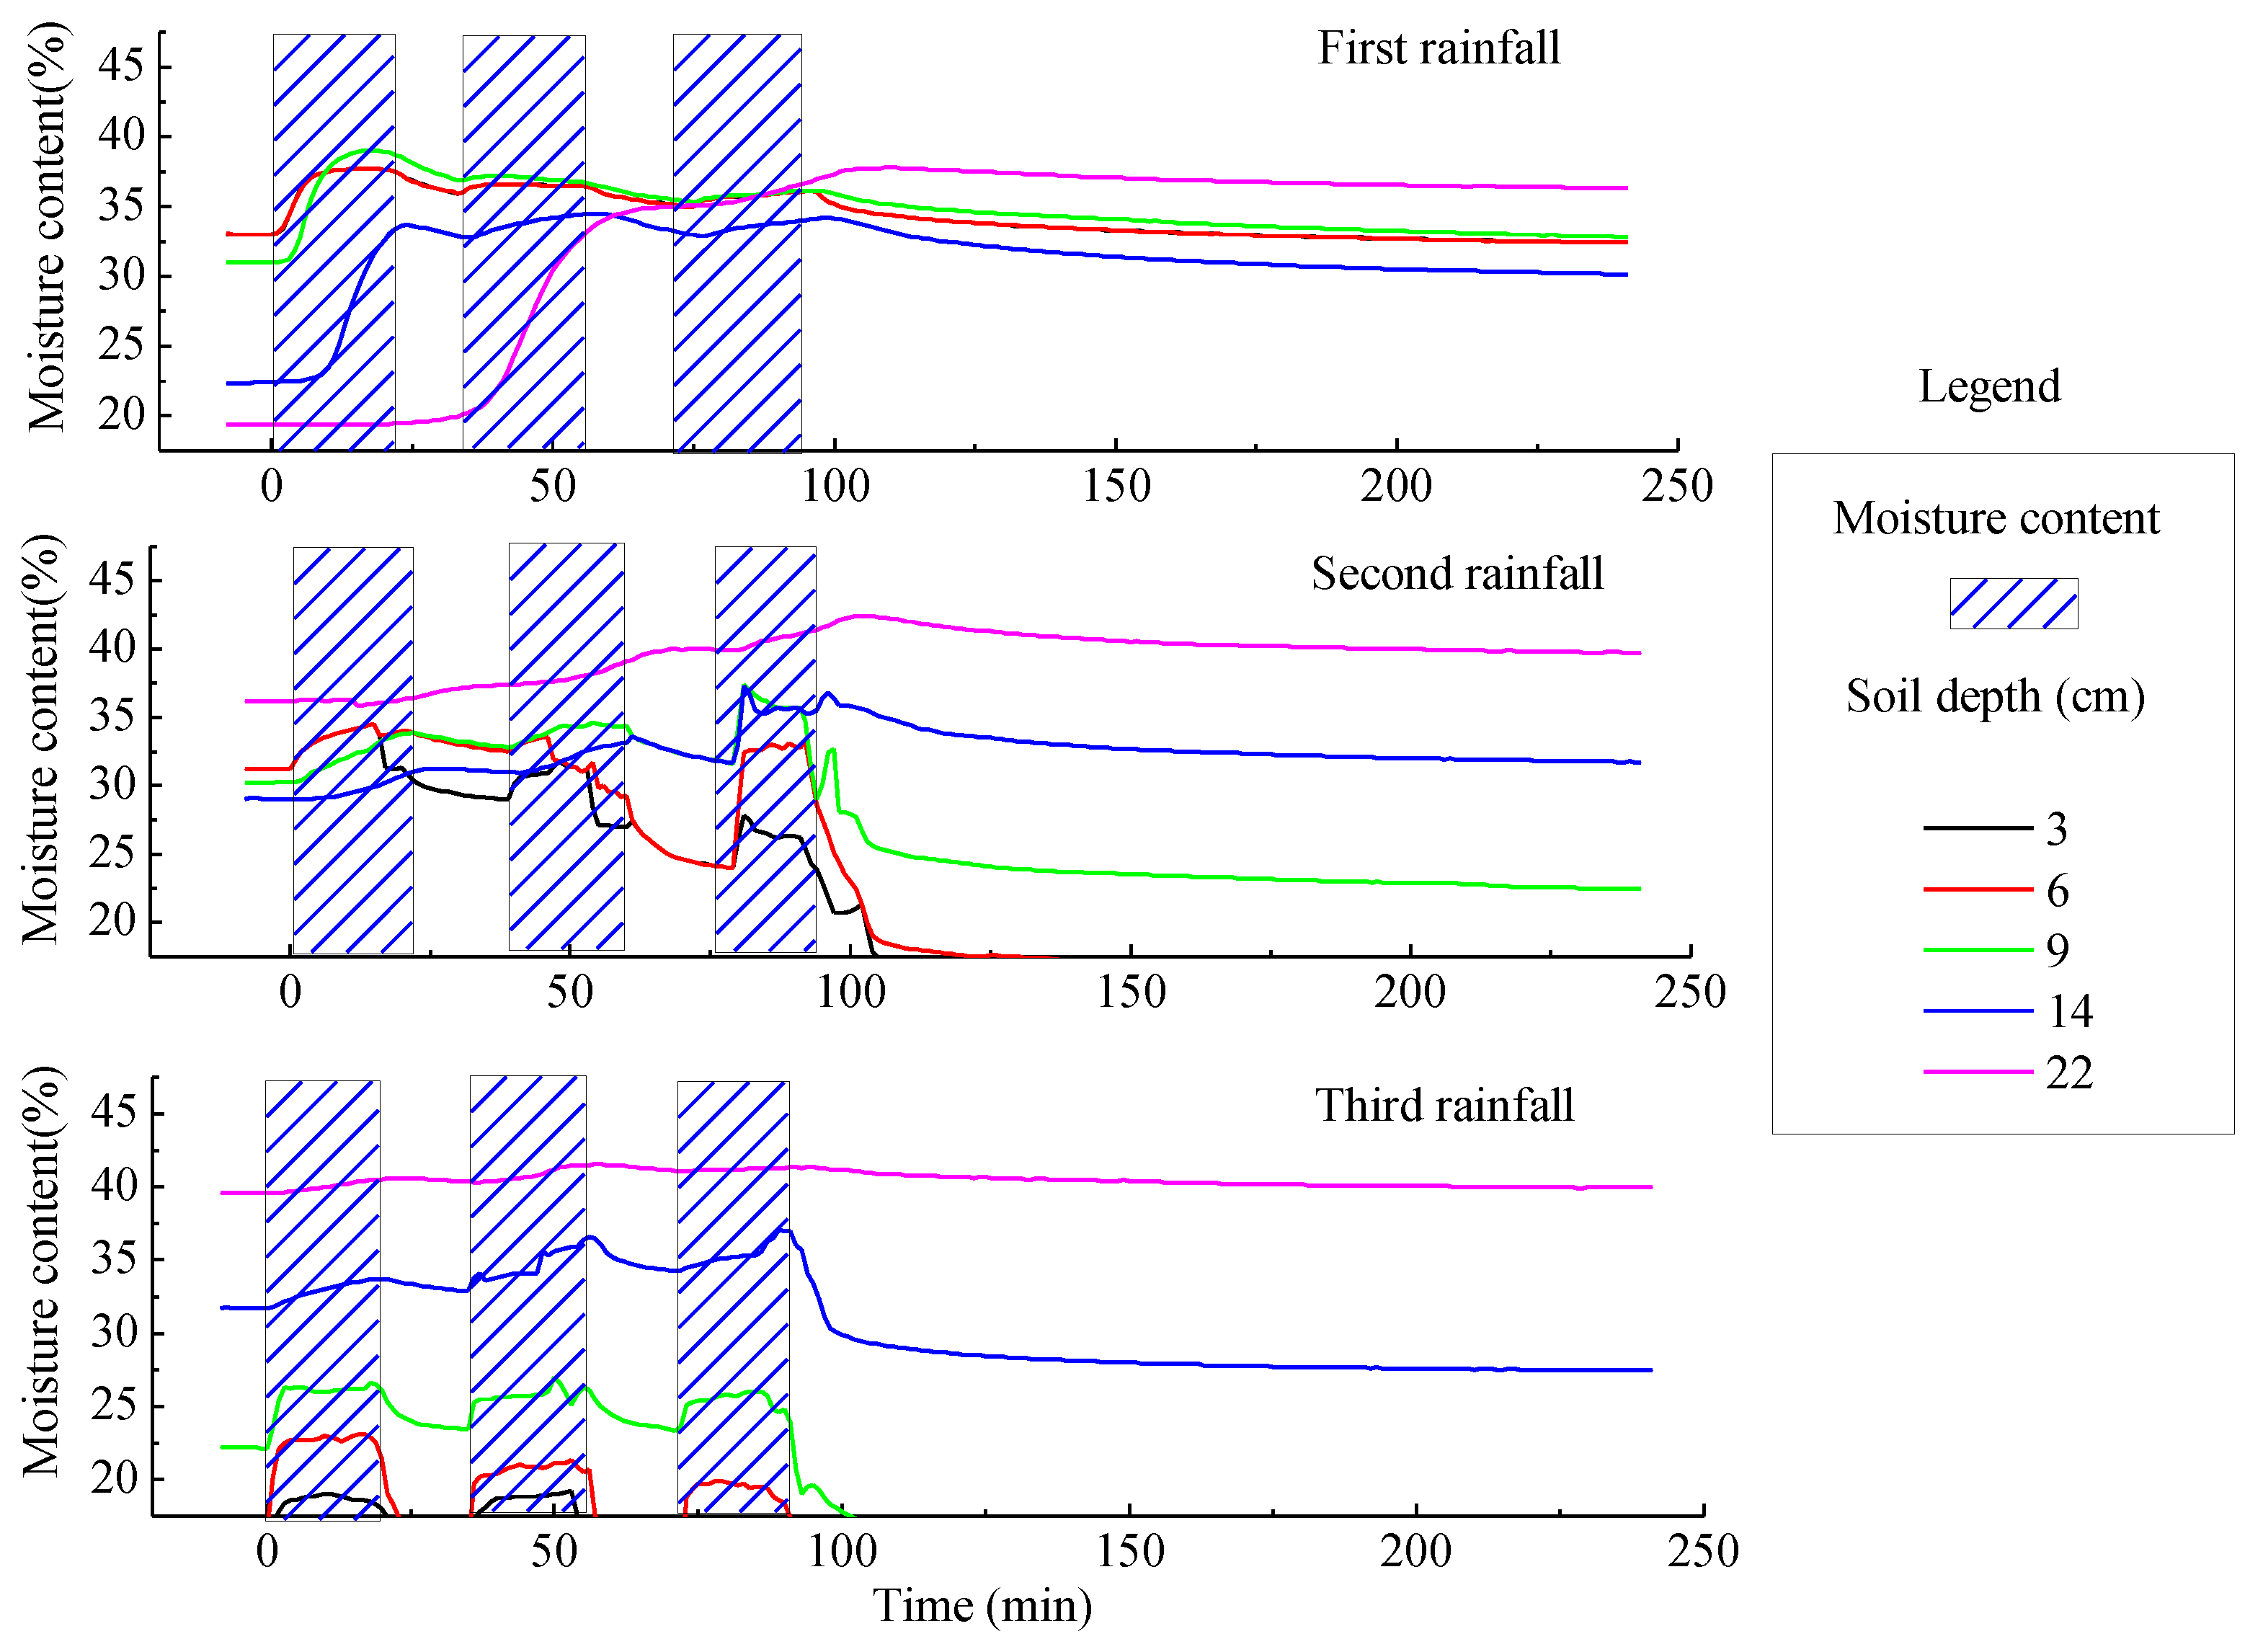
3.2. Spatial and Temporal Distribution Characteristics of Soil Moisture on Sand-Covered Slope under Different Rainfall Densities
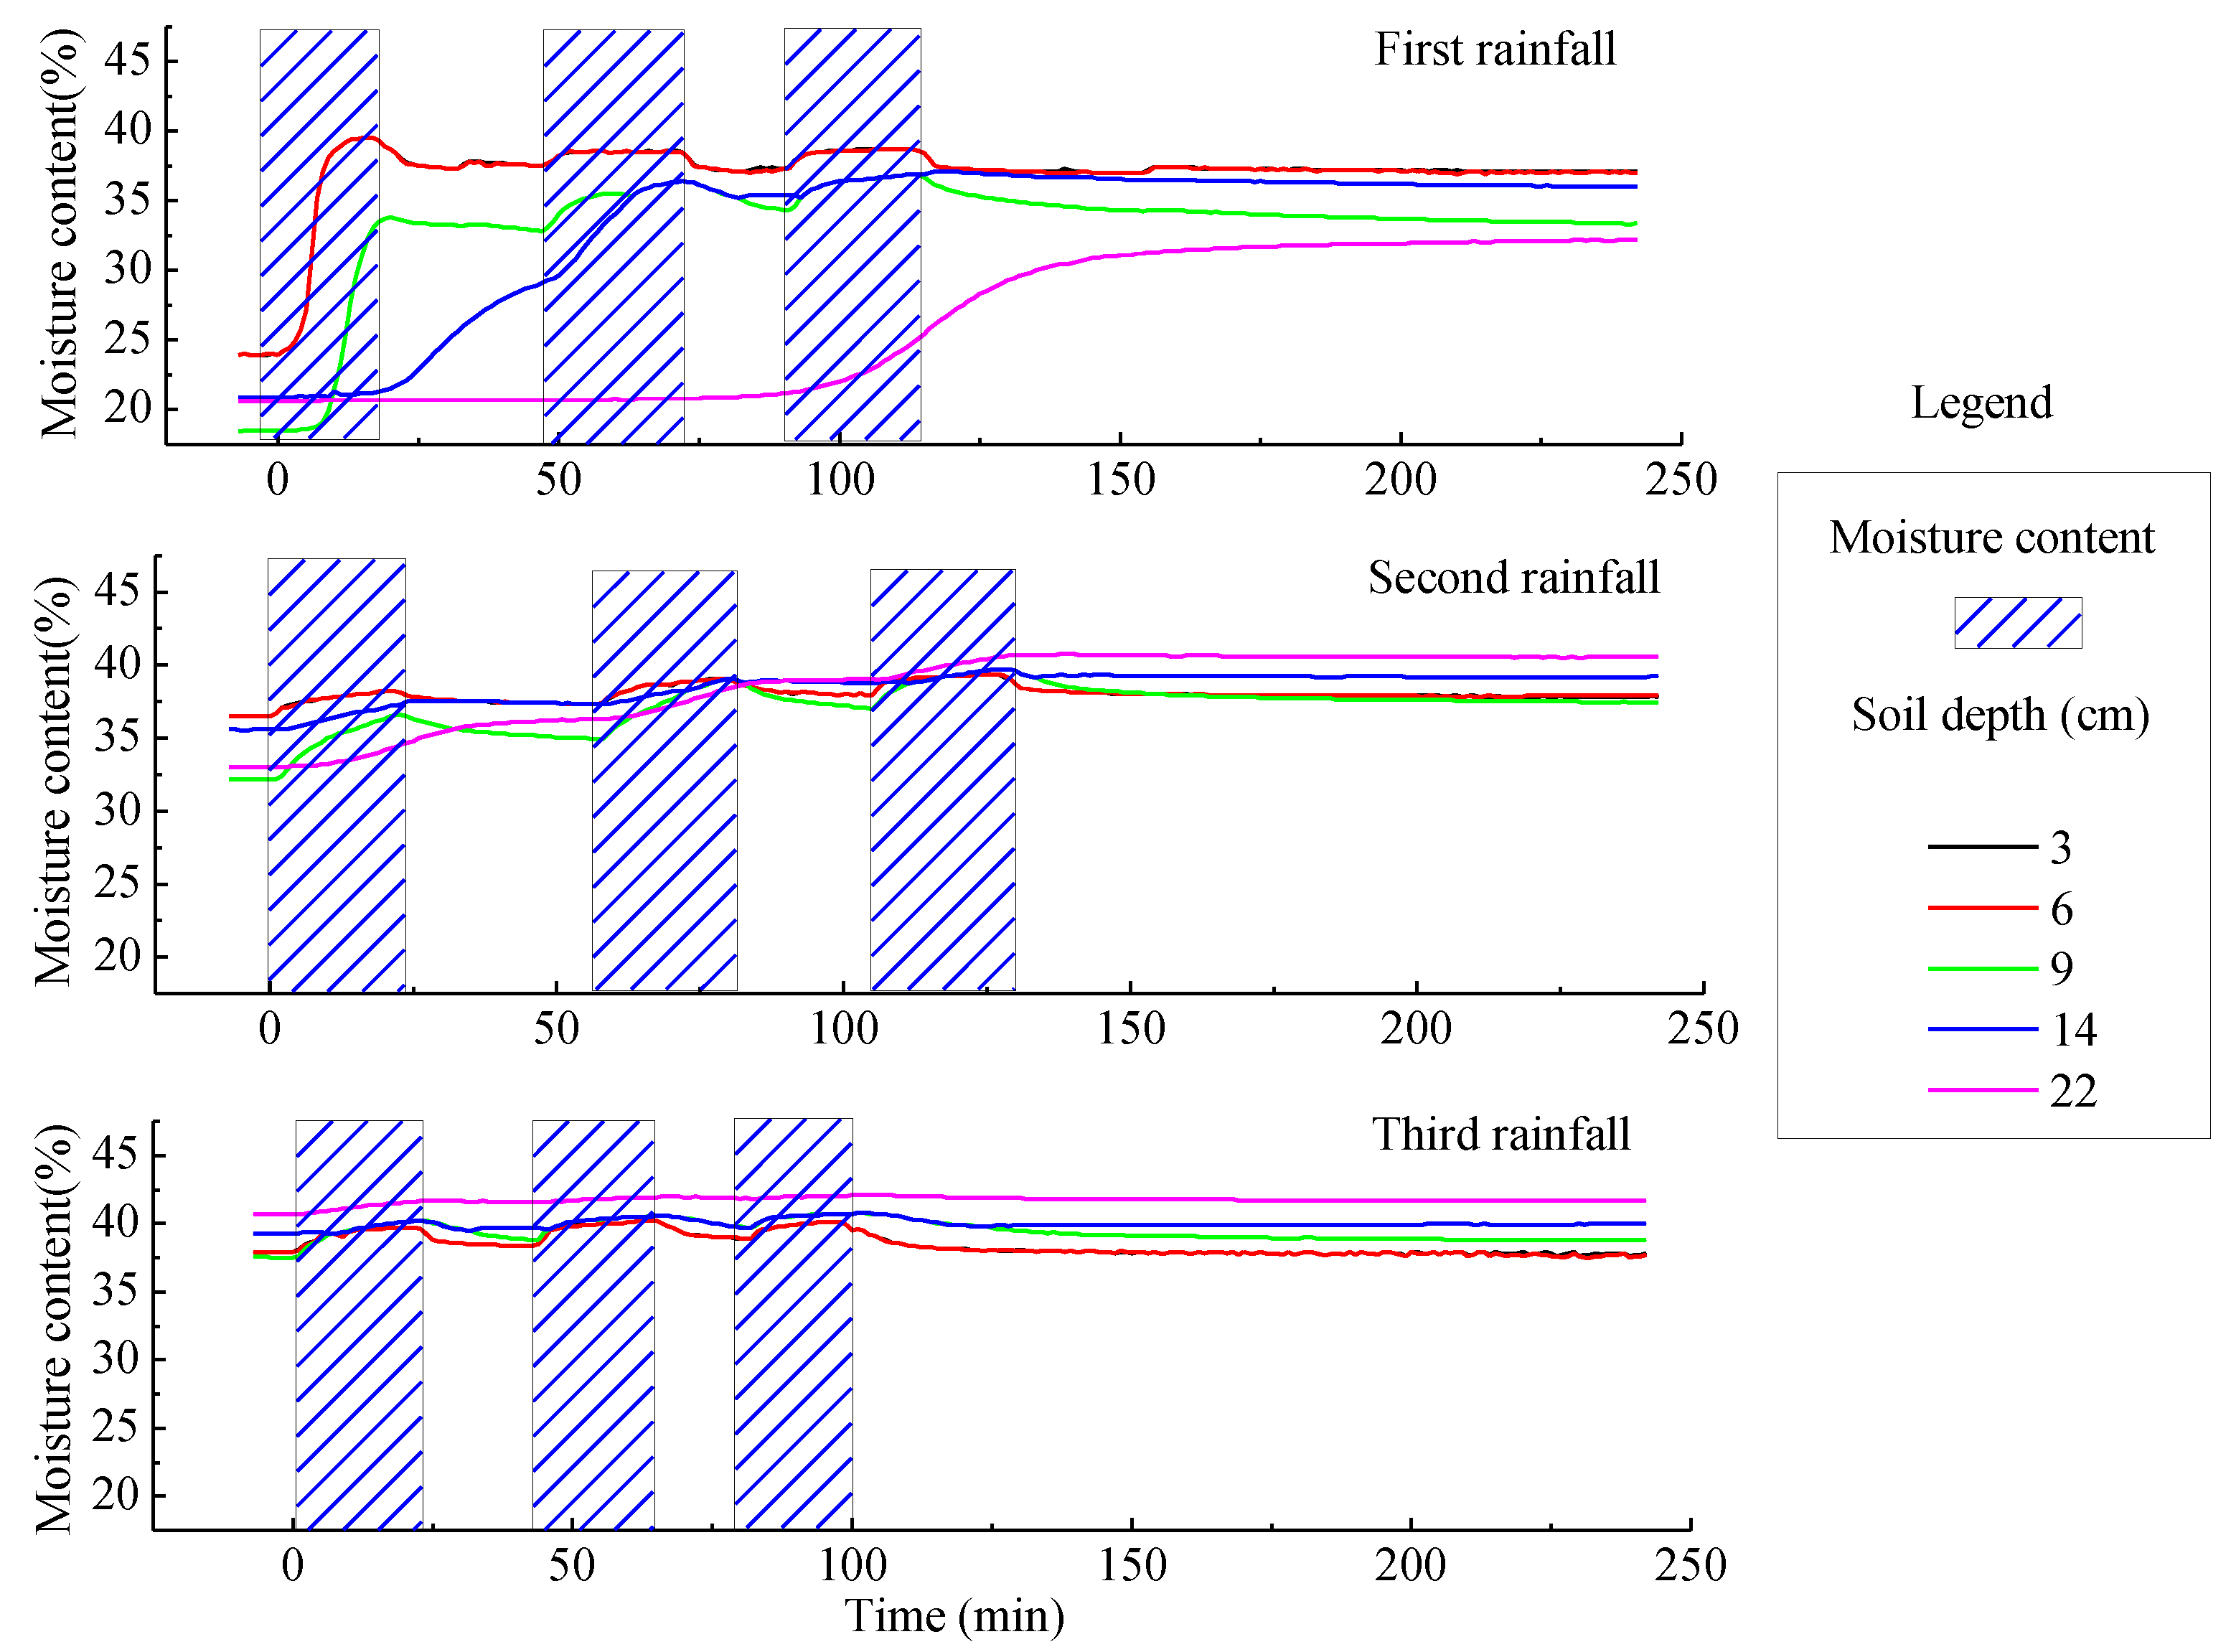
3.2.1. Spatial and Temporal Distribution Characteristics of Soil Moisture on the Slope Surface under a Rainfall Density of 1.0 mm/min
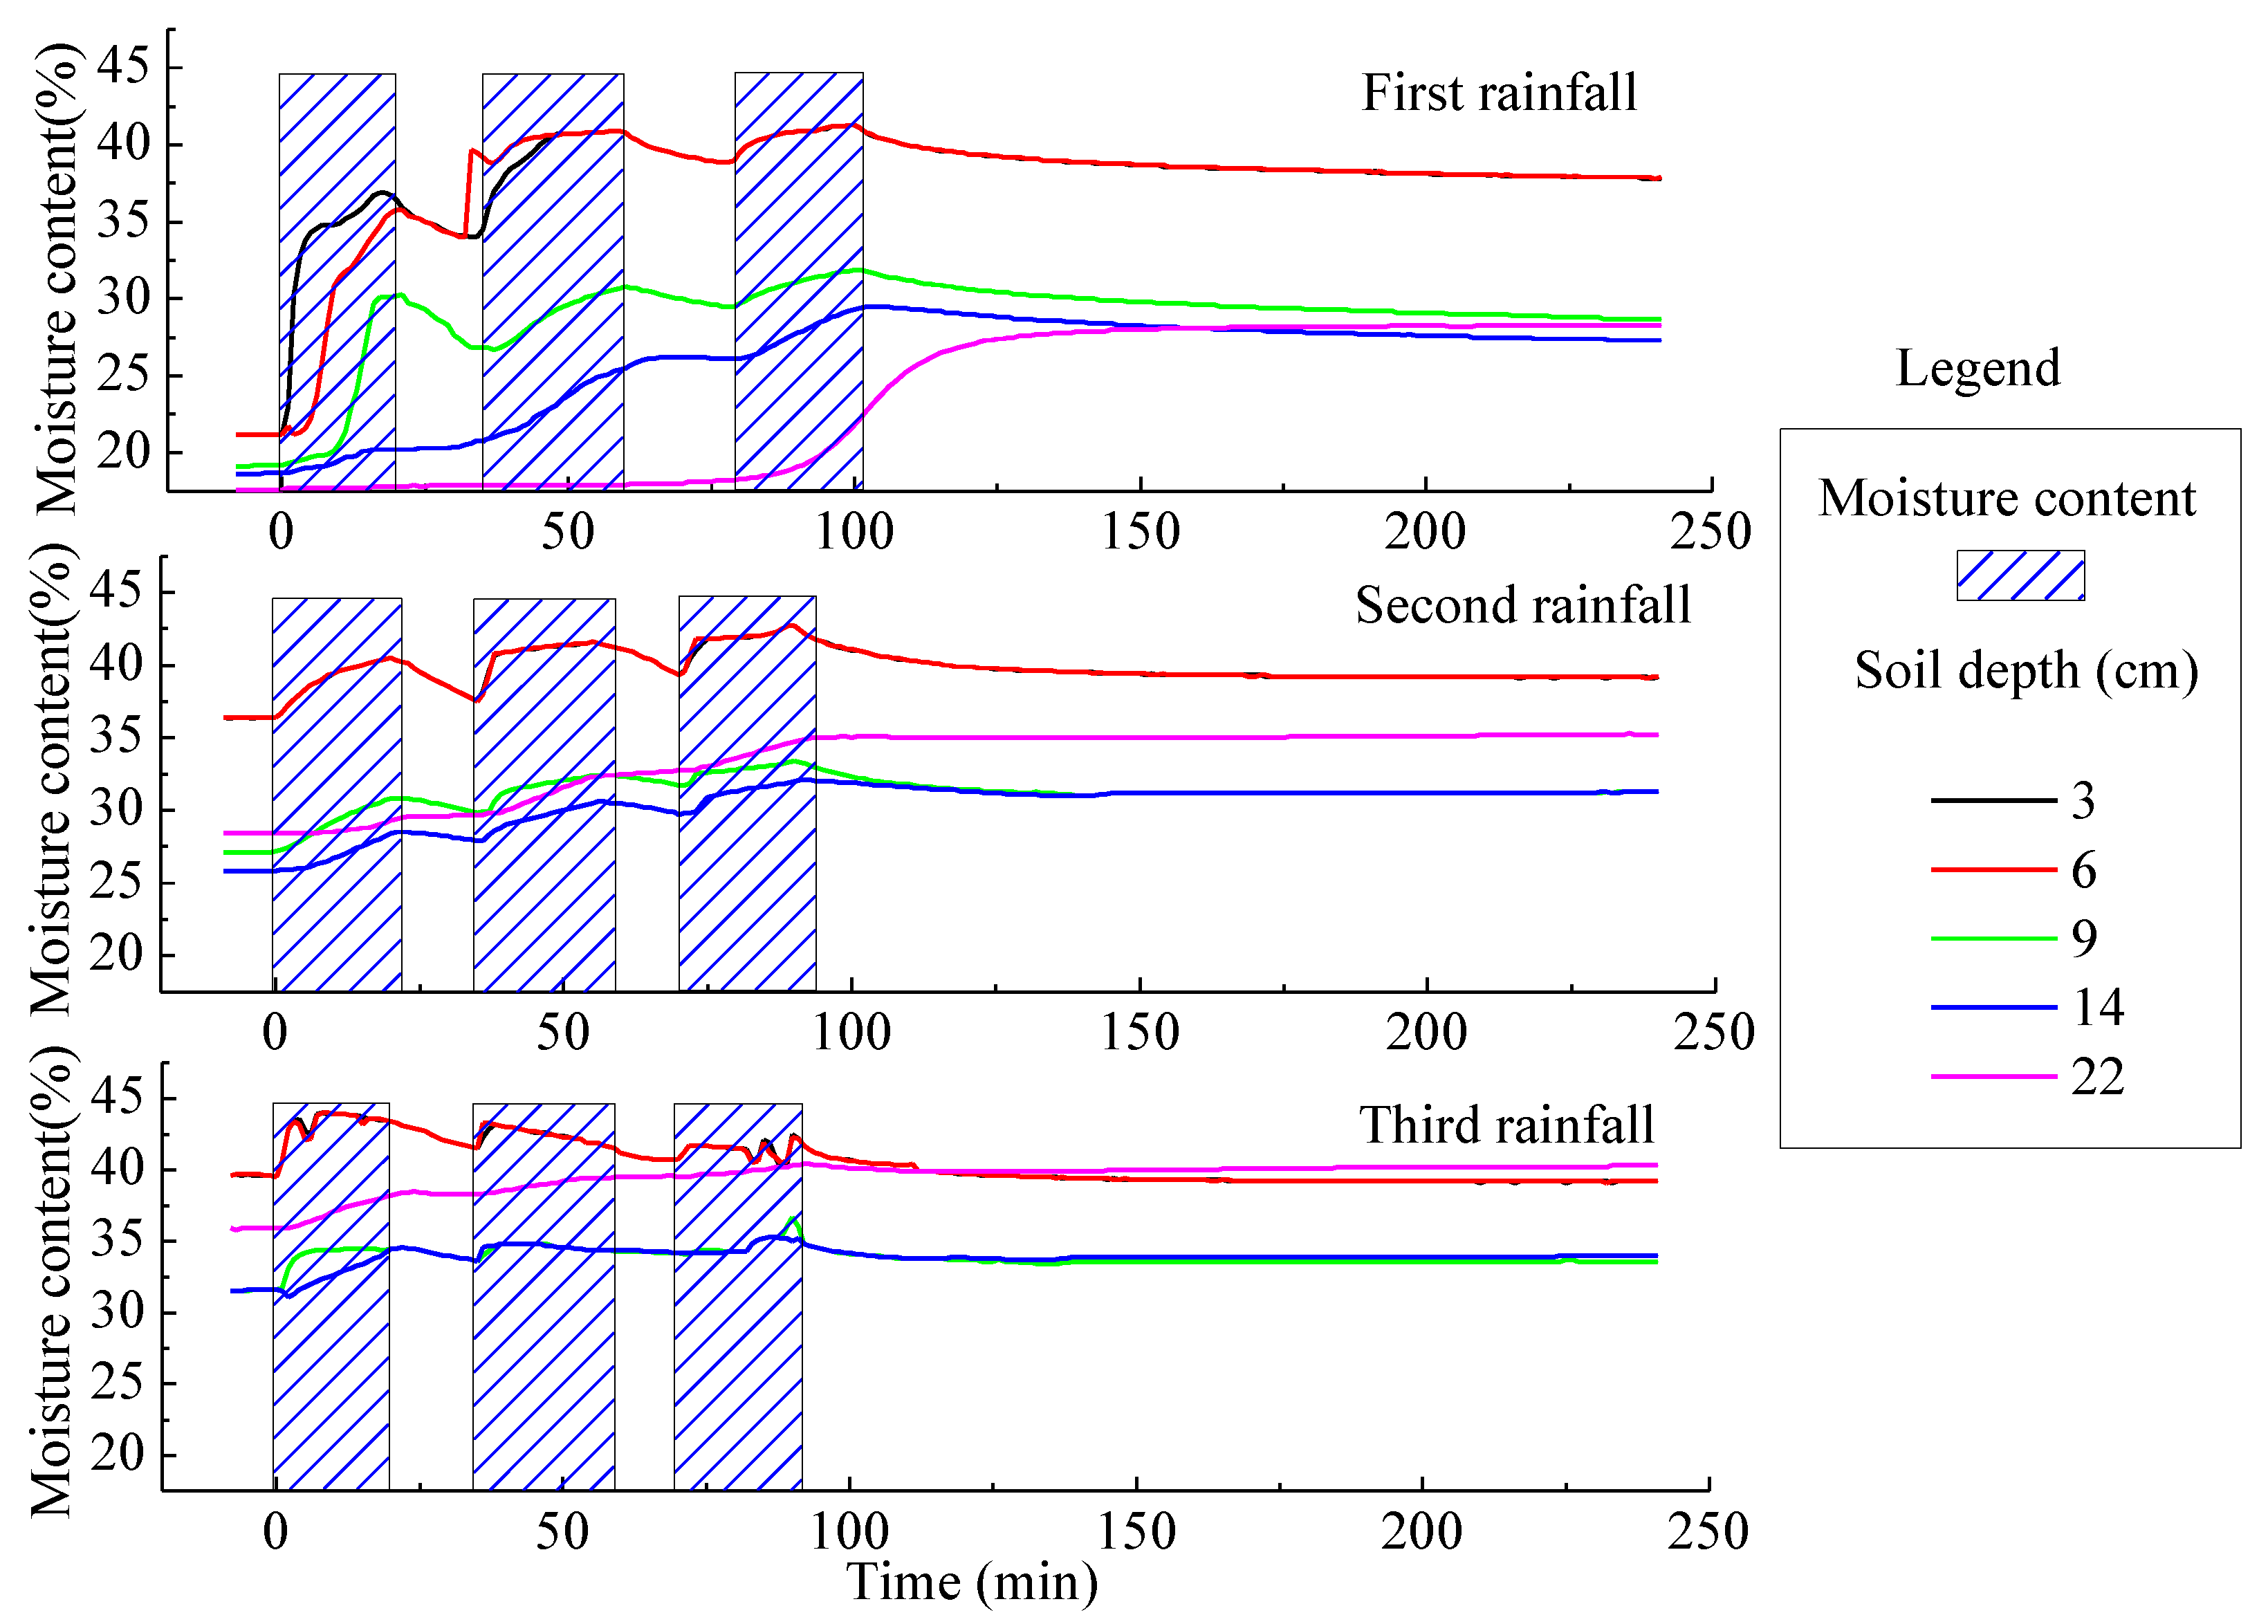
3.2.2. Spatial and Temporal Distribution Characteristics of Soil Moisture on the Slope Surface under a Rainfall Density of 1.5 mm/min
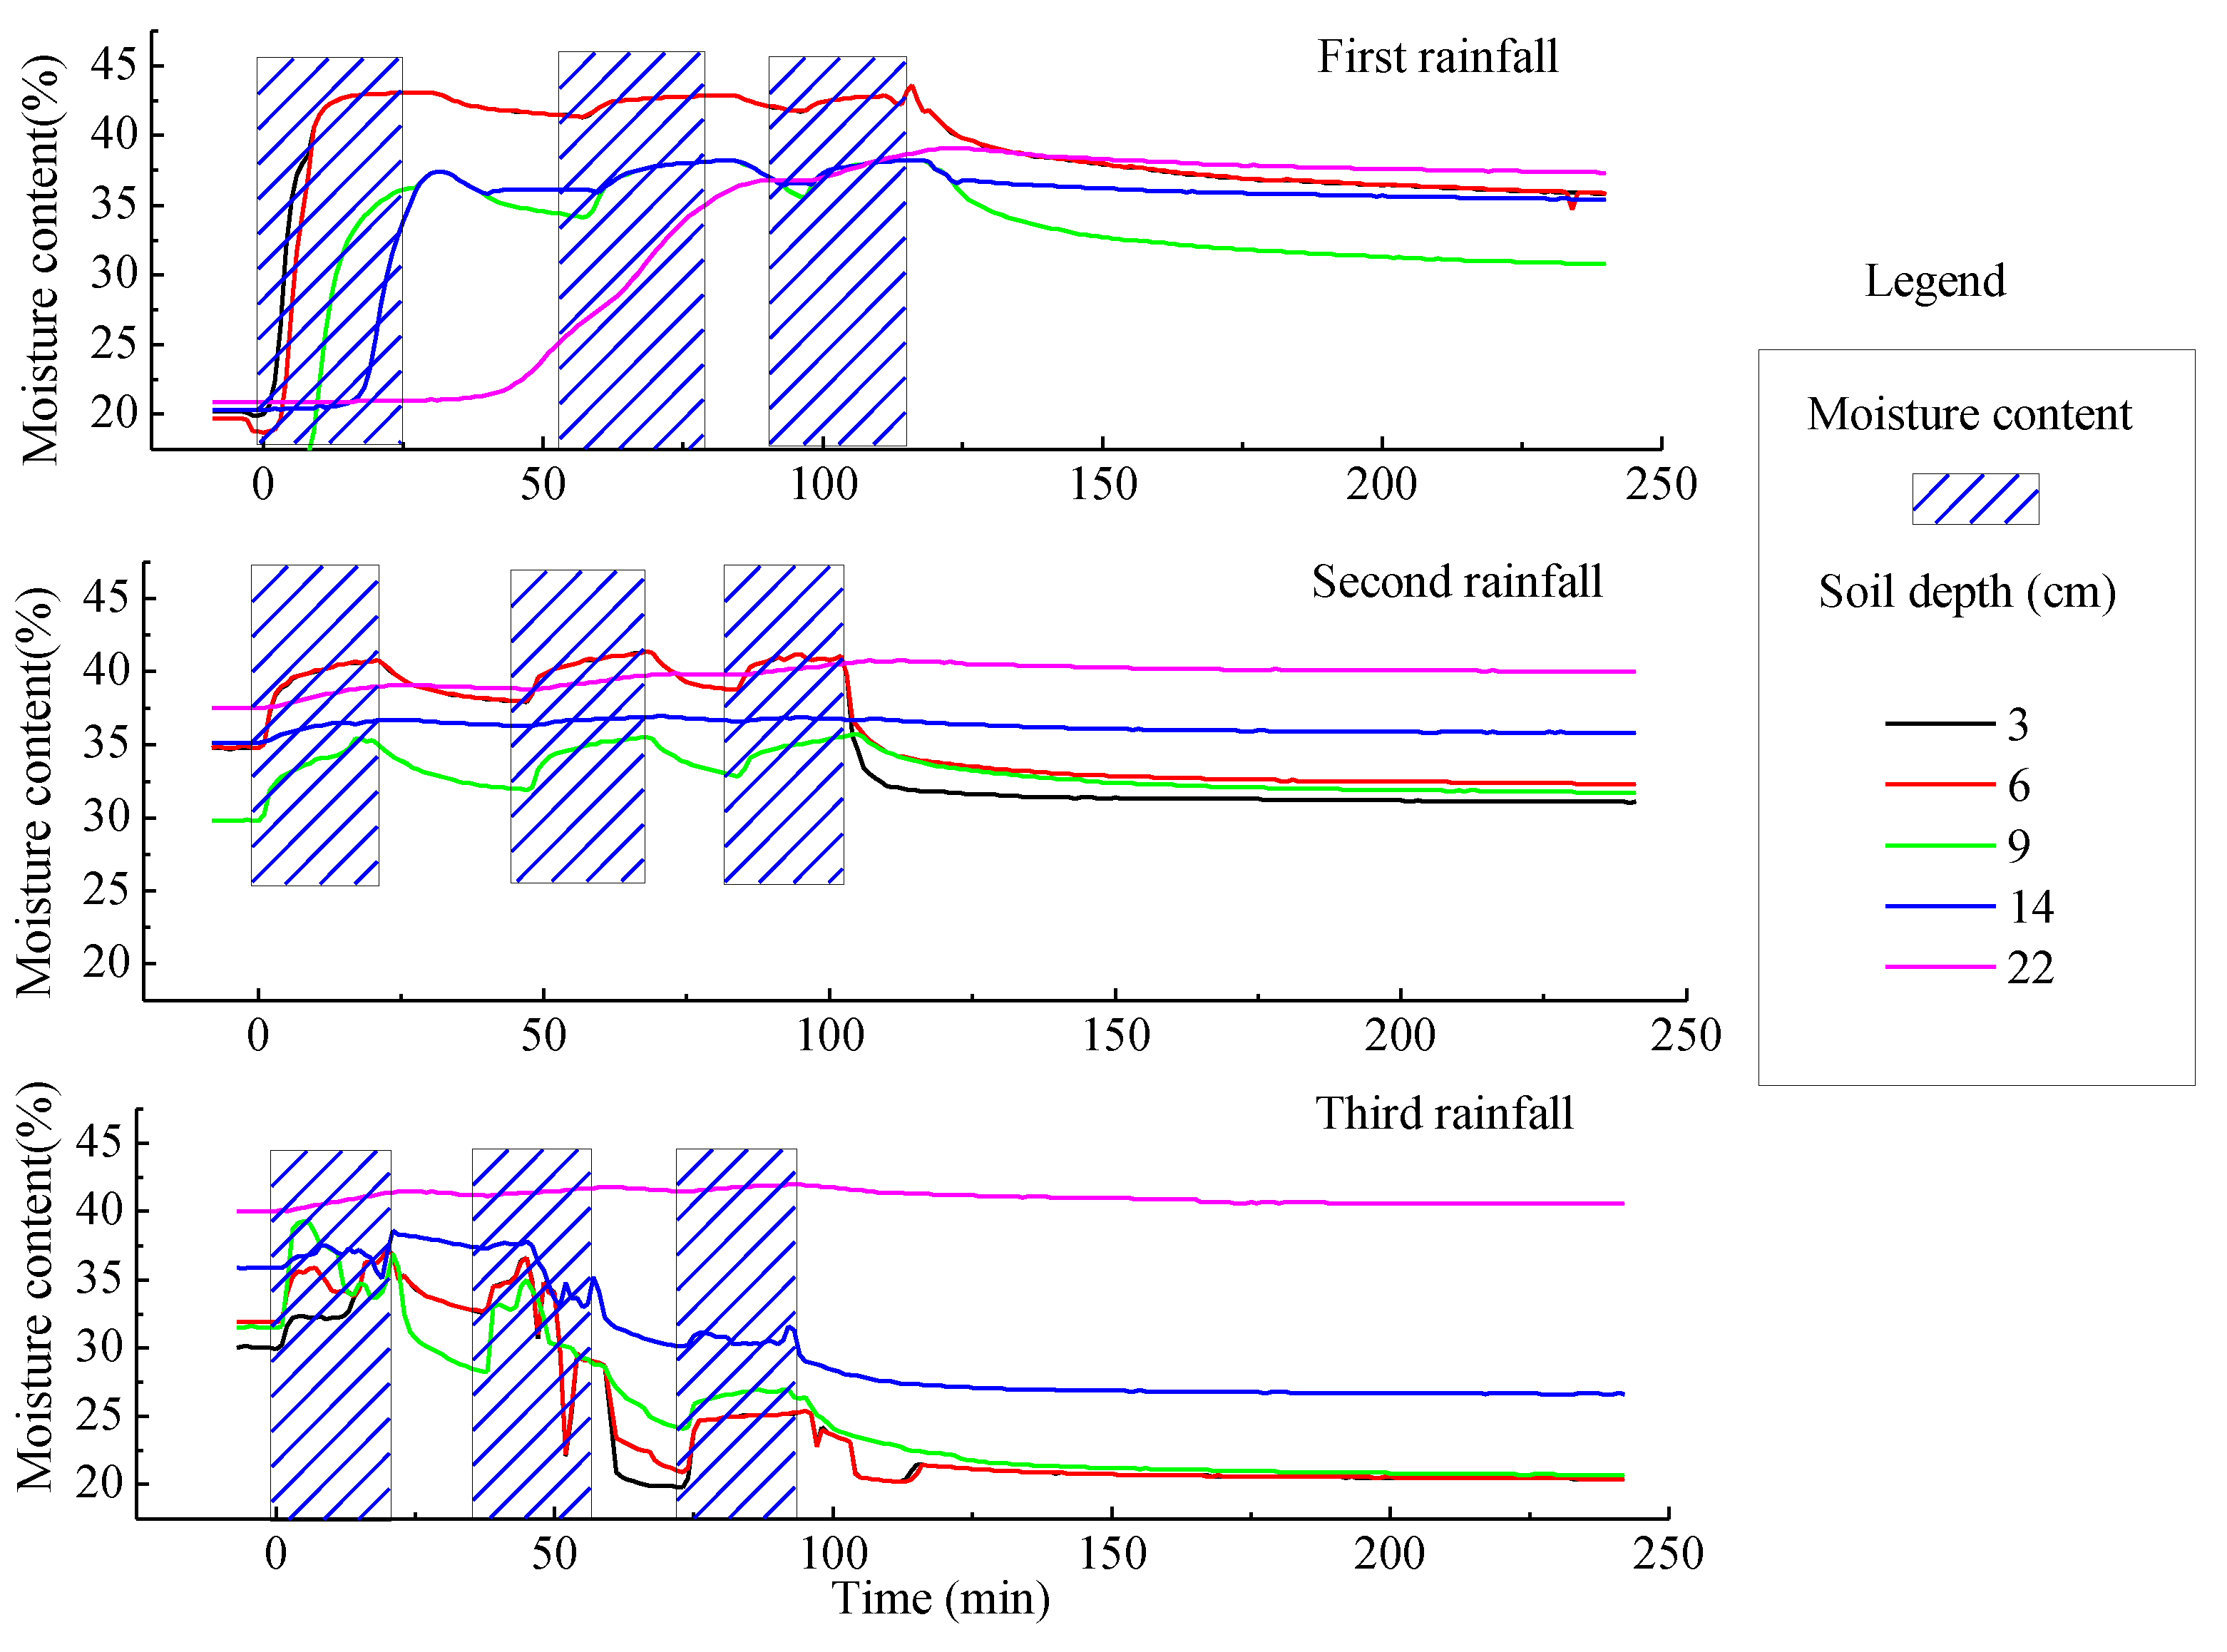
3.2.3. Spatial and Temporal Distribution Characteristics of Soil Moisture on the slope Surface under a Rainfall Density of 2.0 mm/min
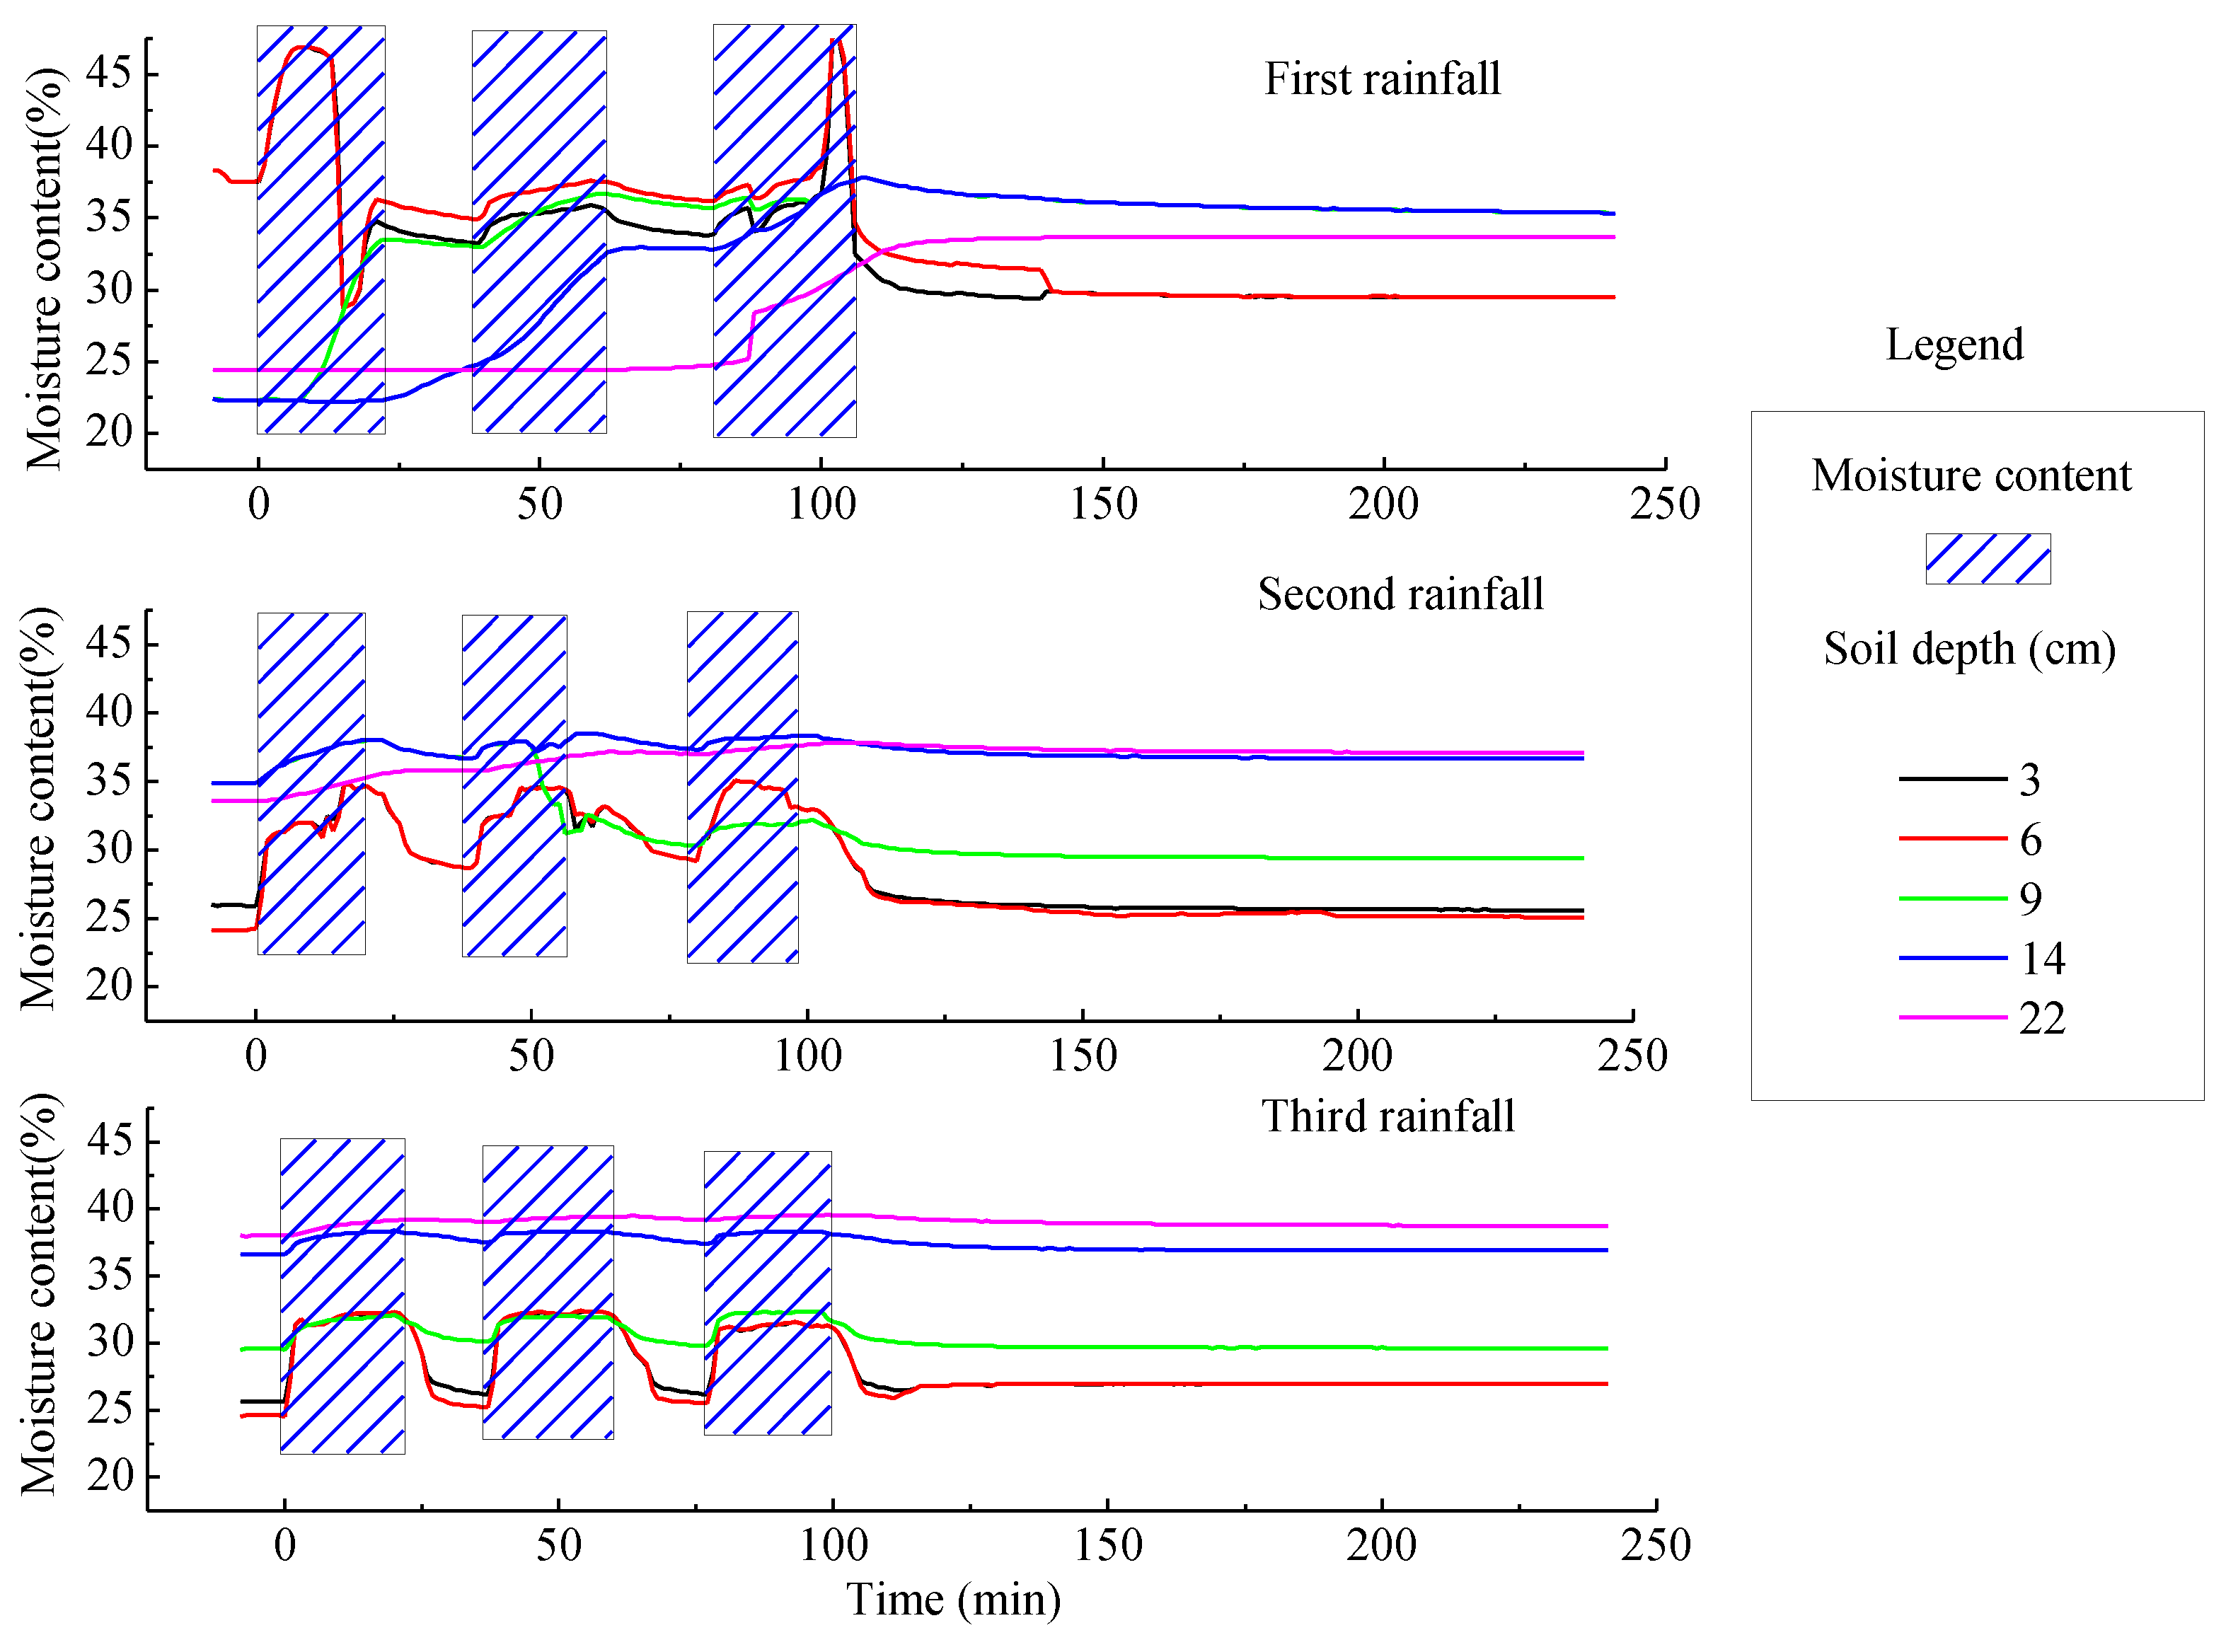
3.2.4. Spatial and Temporal Distribution Characteristics of Soil Moisture on the Slope Surface under a Rainfall Density of 2.5 mm/min
3.3. Soil Moisture Parameter Change Process of the Slopes
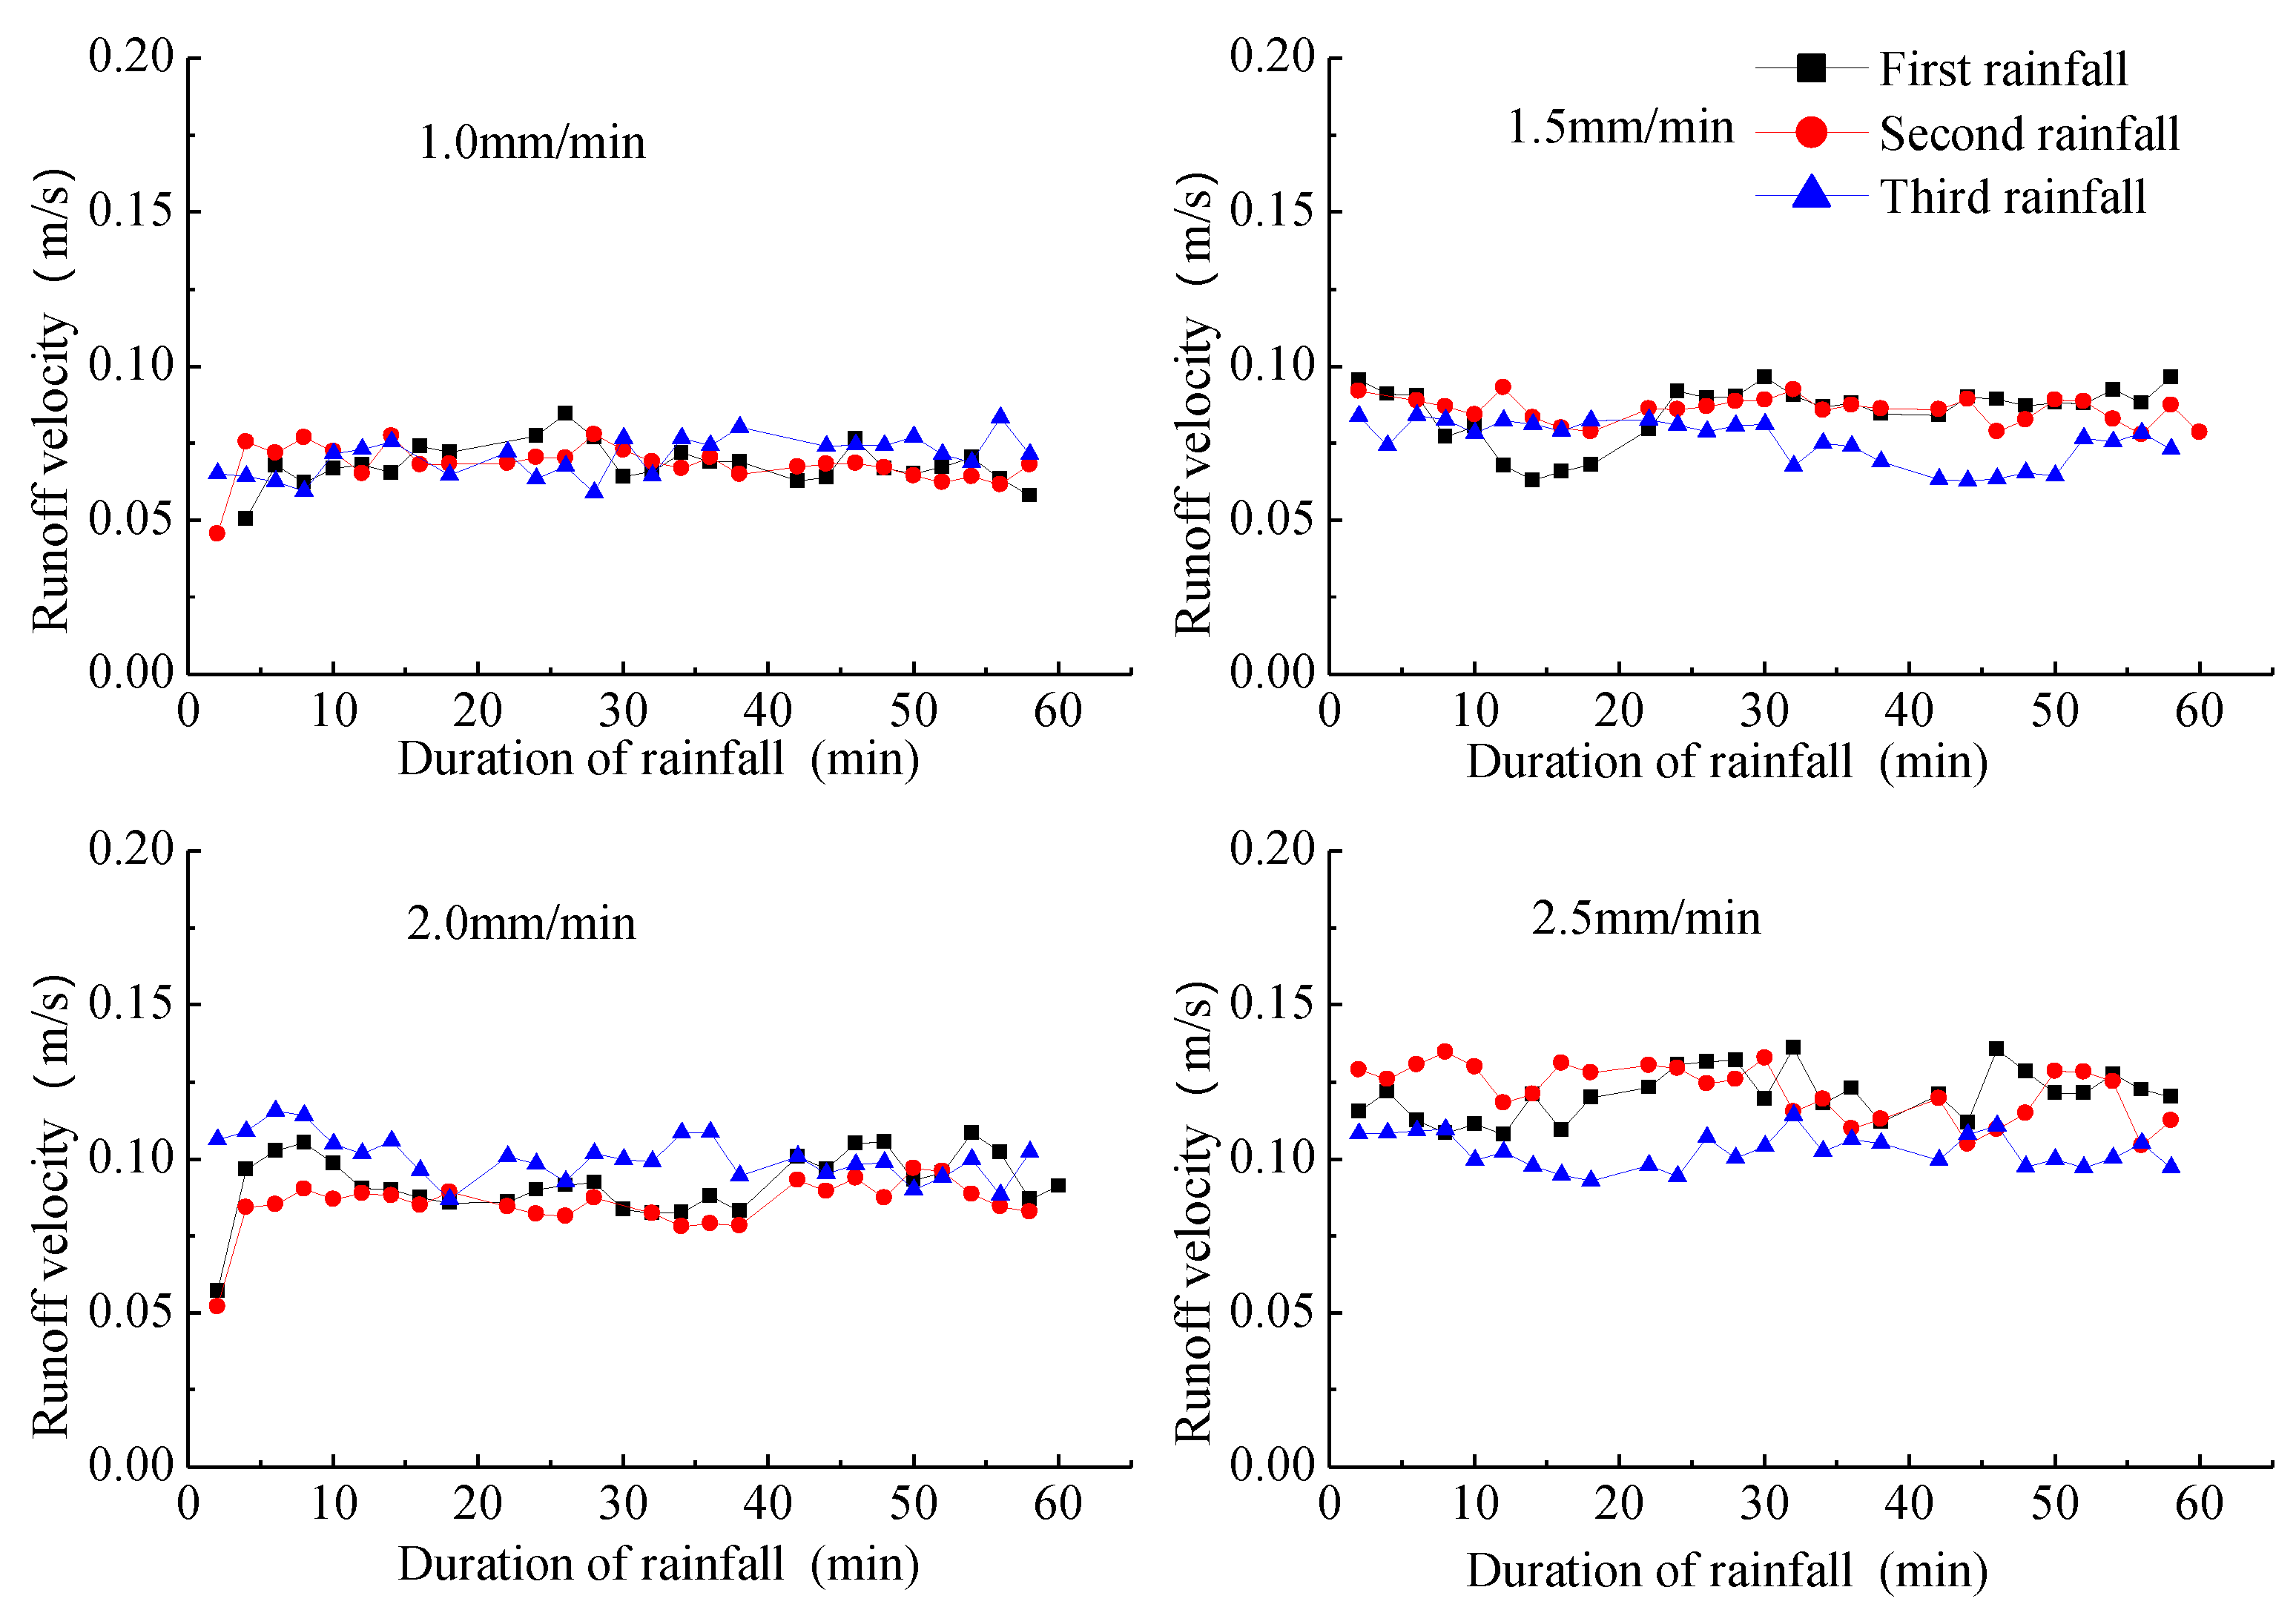
3.3.1. Slope Runoff Velocity
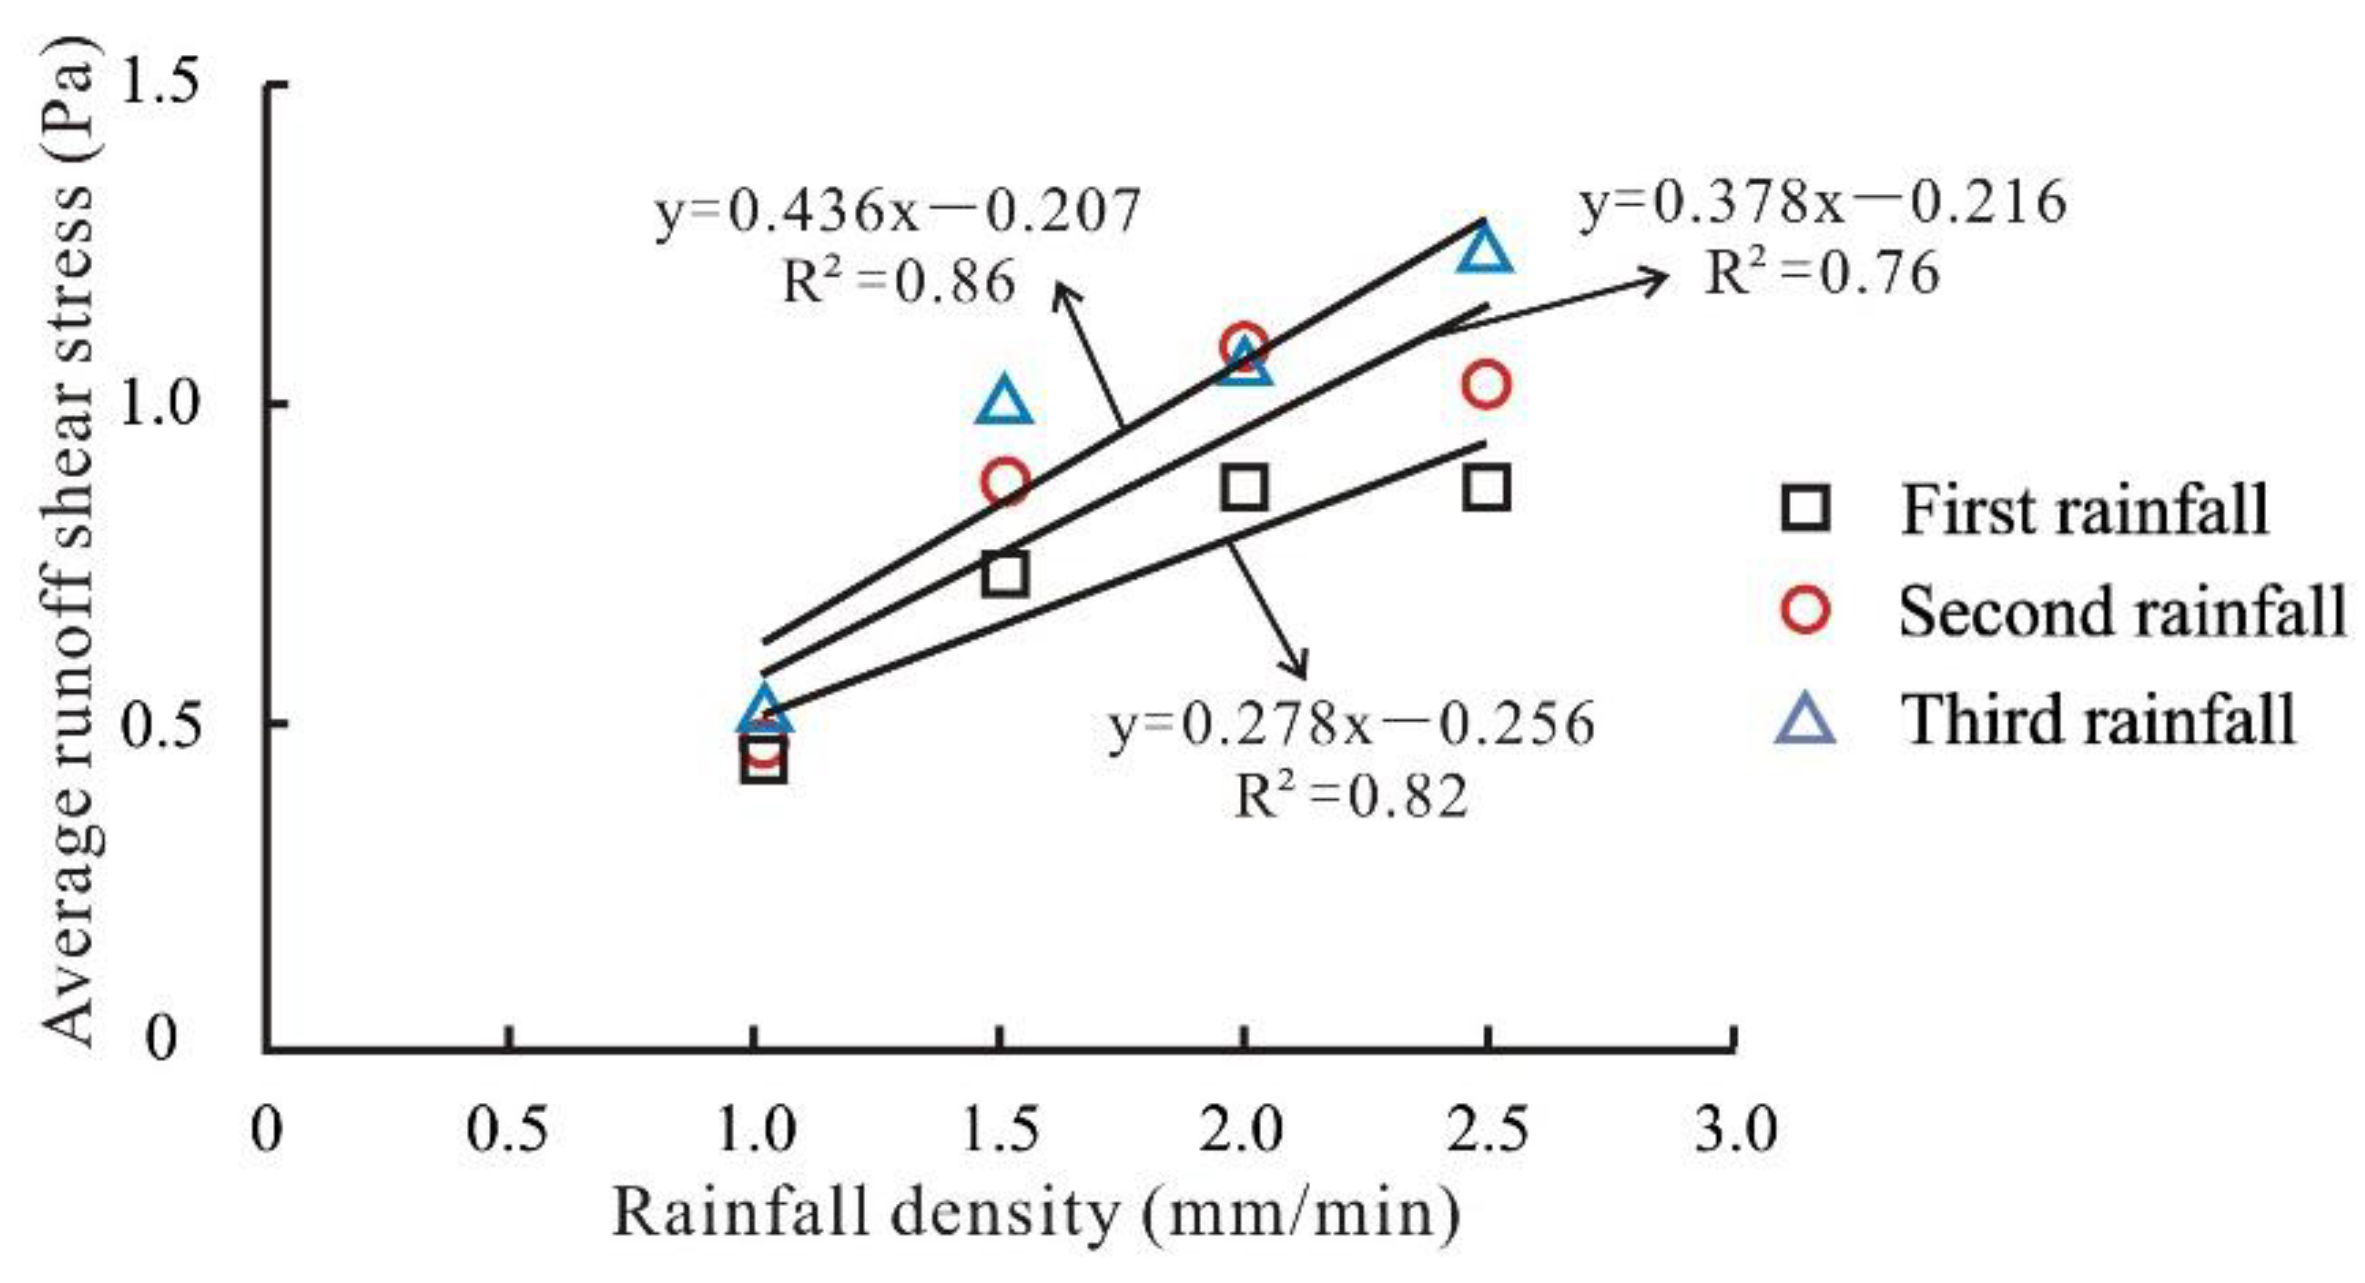
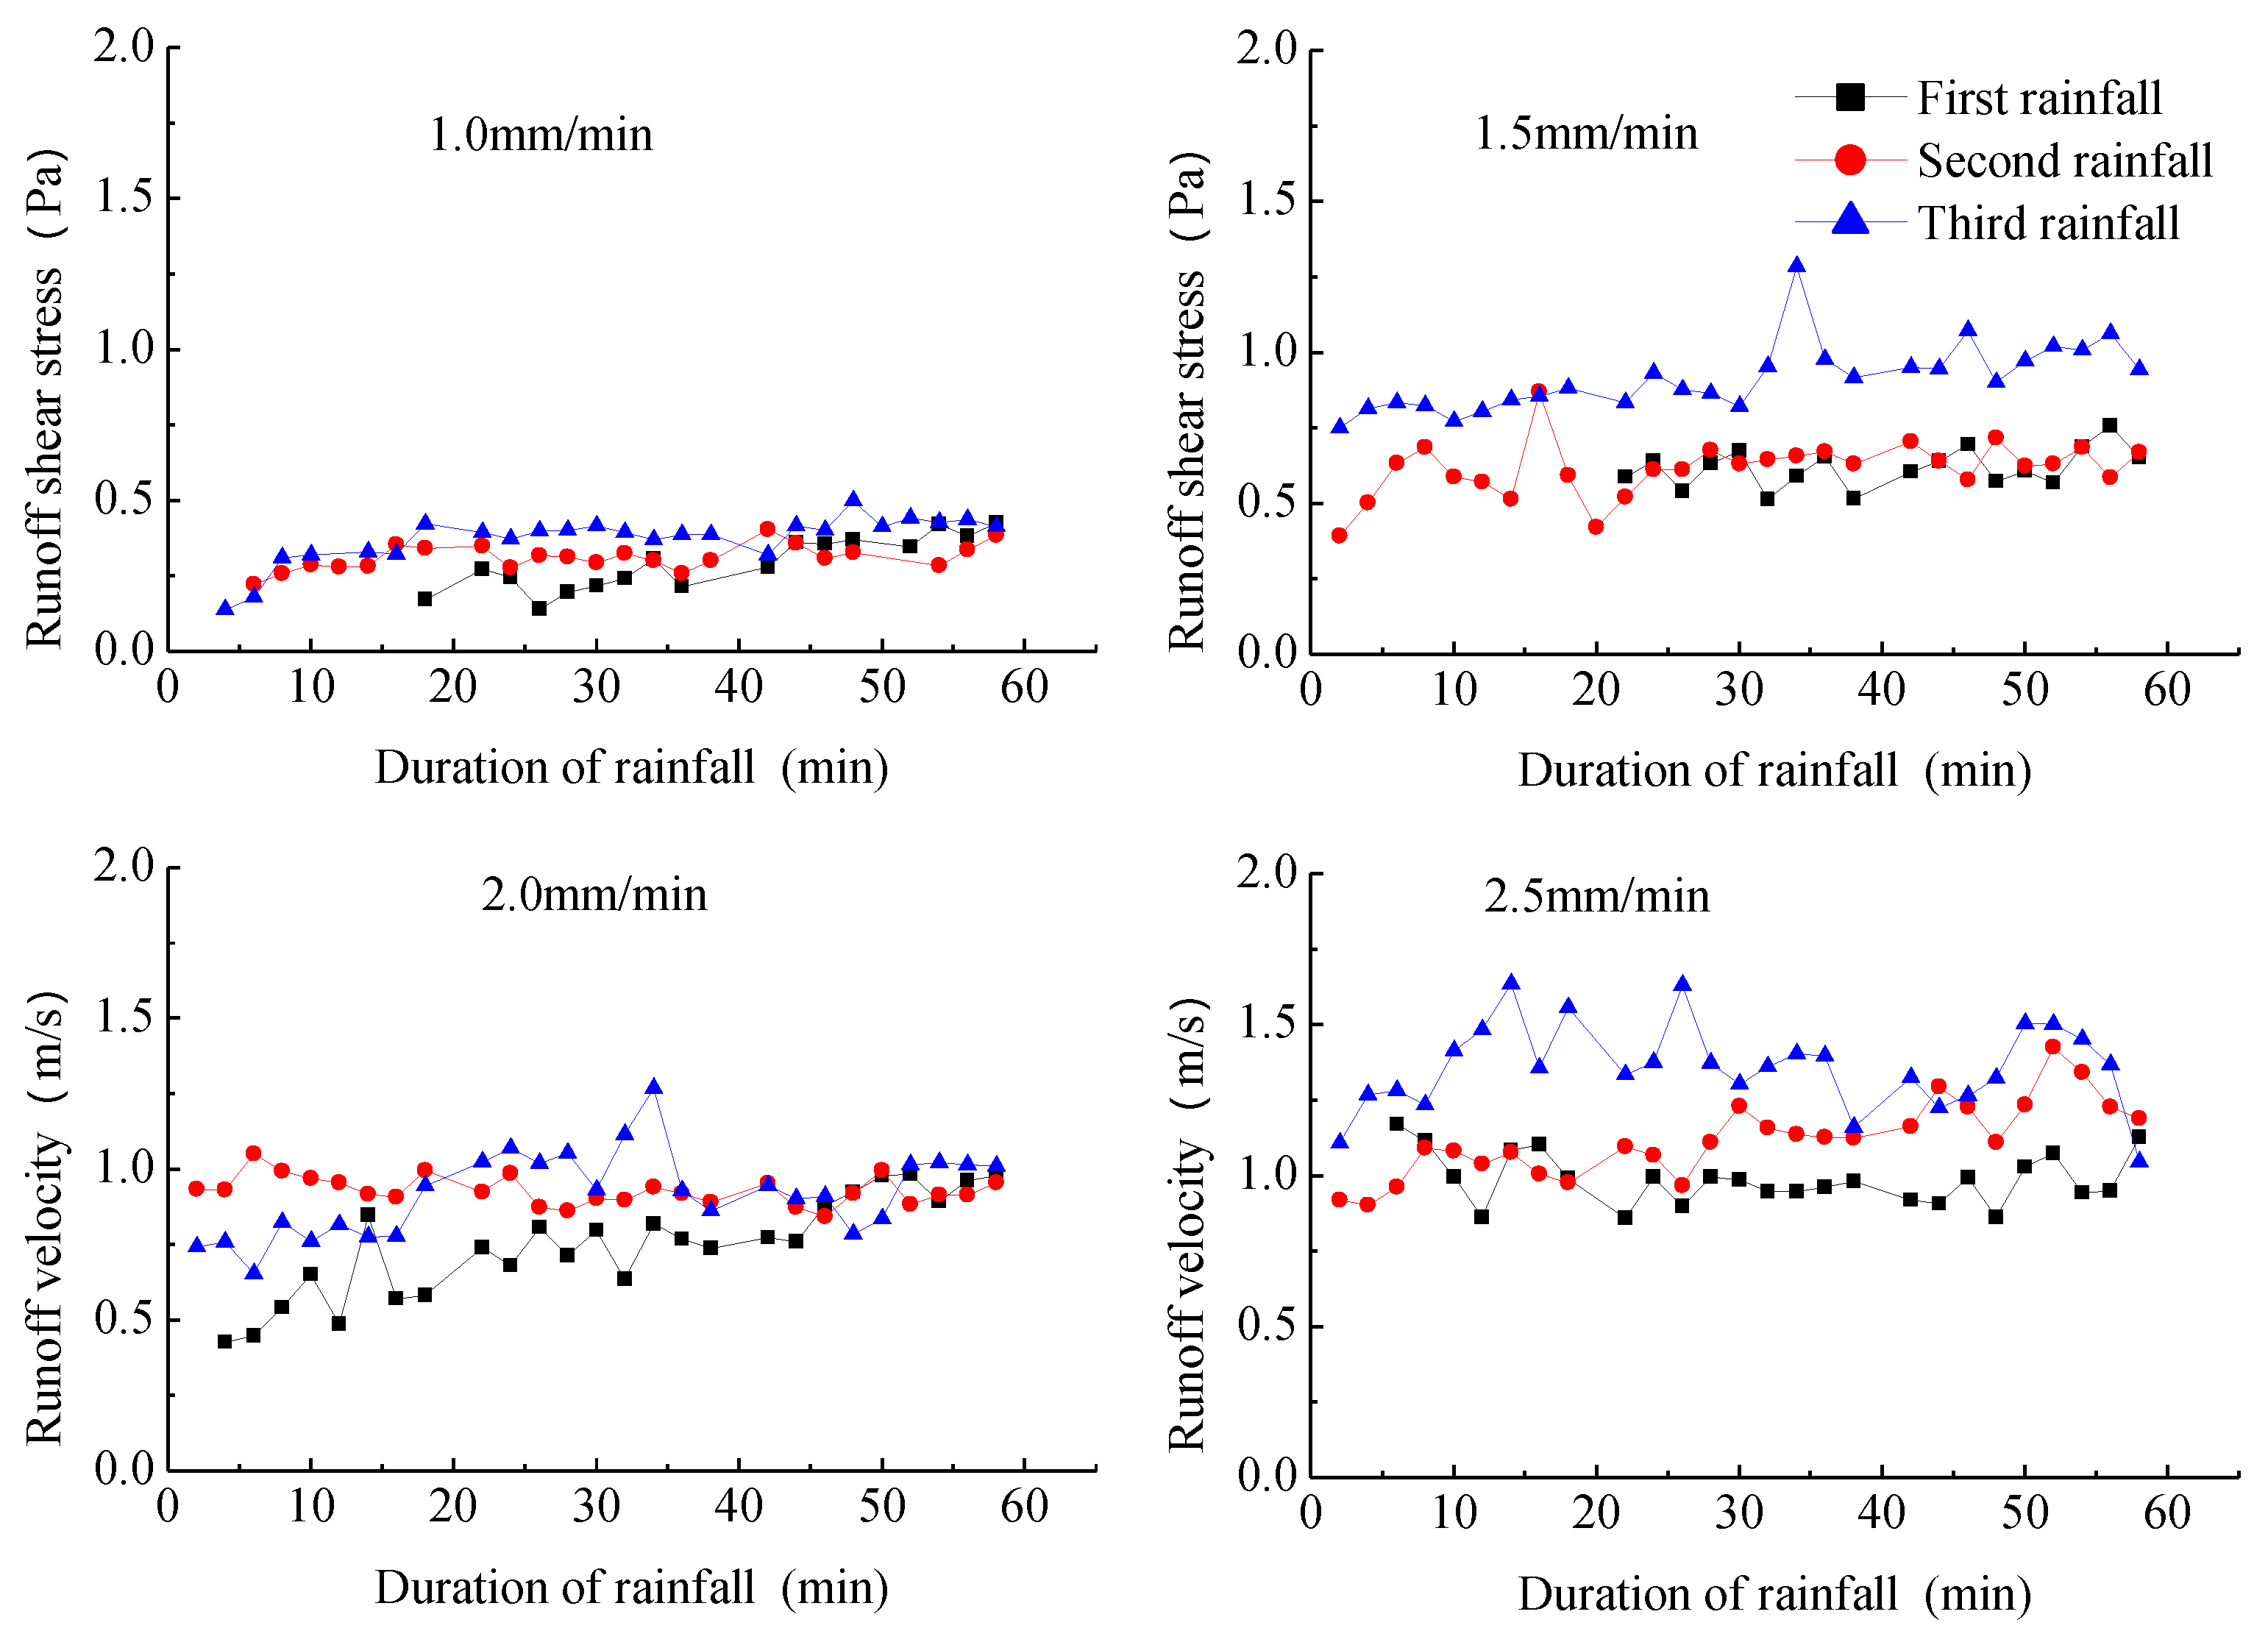
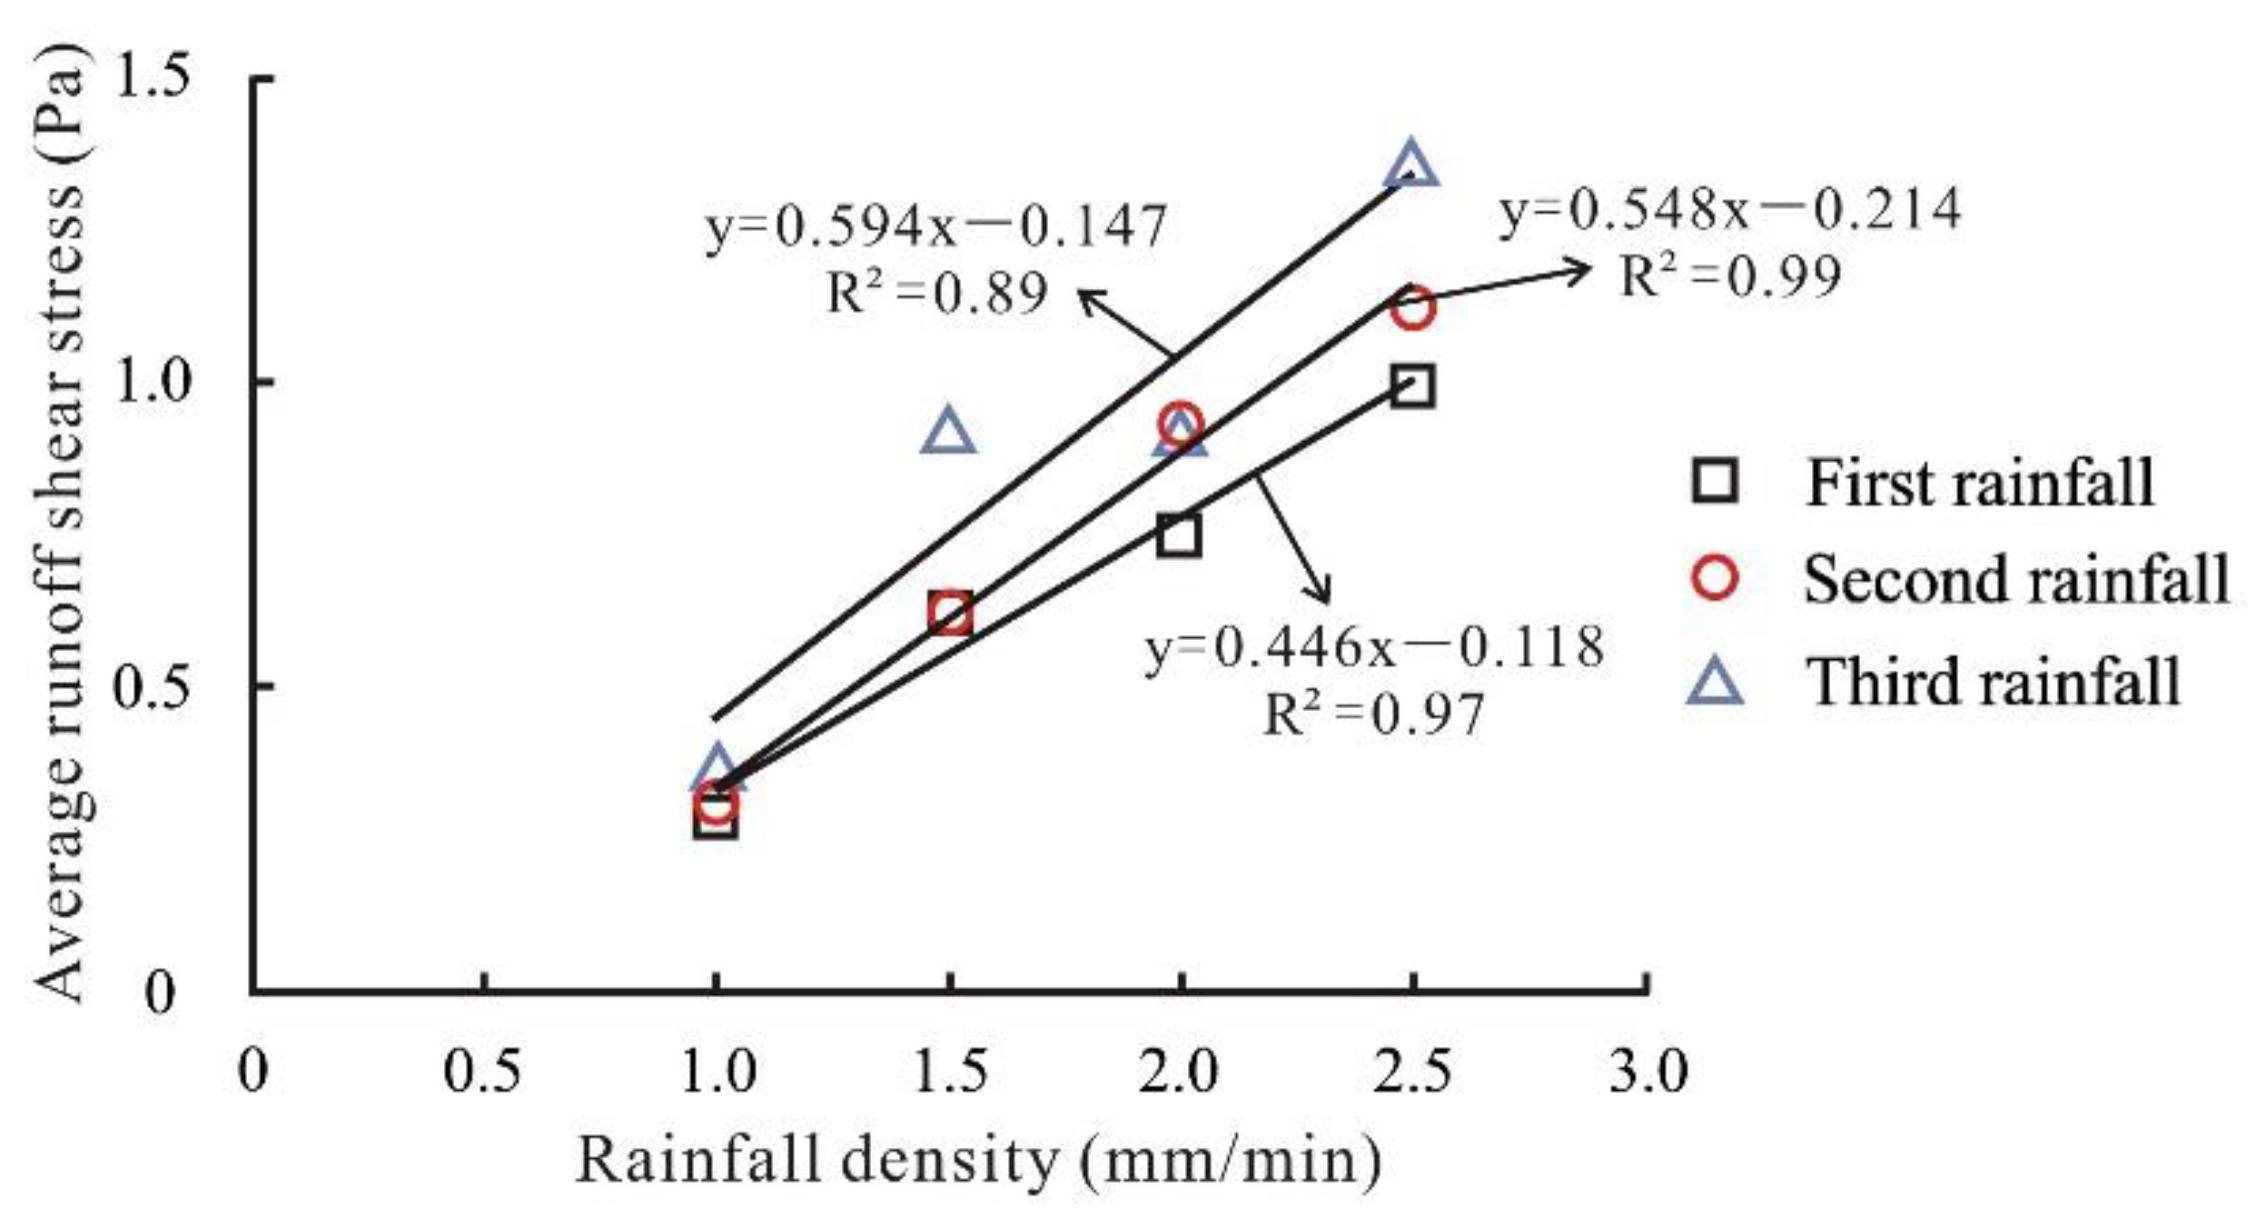
3.3.2. Slope Runoff Shear Stress
3.3.3. Slope Runoff Power
4. Discussion
4.1. Sand-Covered Slope
4.2. Soil Moisture Changes
5. Conclusions
Author Contributions
Funding
Institutional Review Board Statement
Informed Consent Statement
Data Availability Statement
Acknowledgments
Conflicts of Interest
References
- Zhao, H.L.; Yang, H.B.; Li, Y.F.; Li, R.F. Response of suspended sediment concentration to water and sediment regulation in yellow river estuary. In Proceedings of the 2015 4th International Conference on Sustainable Energy and Environmental Engineering, Shenzhen, China, 20–21 December 2015; Volume 209, pp. 2352–5401. [Google Scholar]
- Poesen, J. Soil erosion in the Anthropocene: Research needs. Earth Surf. Process. Landf. 2017, 43, 64–84. [Google Scholar] [CrossRef]
- Shi, P.; Hou, P.; Gao, J.; Wan, H.; Wang, Y.; Sun, C. Spatial-Temporal Variation Characteristics and Influencing Factors of Vegetation in the Yellow River Basin from 2000 to 2019. Atmosphere 2021, 12, 1576. [Google Scholar] [CrossRef]
- Xie, L.Y.; Bai, Y.J.; Zhang, F.B.; Yang, M.Y.; Li, Z.B. Effects of Thickness and Particle Size Composition of Overlying Sand layer on Runoff and Sediment Yield on Sand-covered Loess Slopes. Acta Pedol. Sin. 2017, 54, 60–72. [Google Scholar]
- Dong, J.; Zhang, K.; Guo, Z. Runoff and soil erosion from highway construction spoil deposits: A rainfall simulation study. Transp. Res. Part D Transp. Environ. 2012, 17, 8–14. [Google Scholar] [CrossRef]
- Sun, W.; Shao, Q.; Liu, J.; Zhai, J. Assessing the effects of land use and topography on soil erosion on the Loess Plateau in China. Catena 2014, 121, 151–163. [Google Scholar] [CrossRef]
- Gao, H.; Li, Z.; Jia, L.; Li, P.; Xu, G.; Ren, Z.; Pang, G.; Zhao, B. Capacity of soil loss control in the Loess Plateau based on soil erosion control degree. J. Geogr. Sci. 2016, 26, 457–472. [Google Scholar] [CrossRef] [Green Version]
- Ding, W.F.; Li, Z.B.; Ding, D.S.; Zhuang, D.C. Study on spatial and temporal characters of rill erosion on slope. Adv. Water Sci. 2004, 15, 19–23, (In Chinese with English abstract). [Google Scholar]
- Sihag, P.; Kumar, M.; Sammen, S.S. Predicting the infiltration characteristics for semi-arid regions using regression trees. Water Sci. Technol. Water Supply 2021, 21, 2583–2595. [Google Scholar] [CrossRef]
- Xu, G.; Tang, S.; Lu, K.; Li, P.; Li, Z.; Gao, H.; Zhao, B. Runoff and sediment yield under simulated rainfall on sand-covered slopes in a region subject to wind–water erosion. Environ. Earth Sci. 2015, 74, 2523–2530. [Google Scholar] [CrossRef]
- Zhang, F.; Bai, Y.; Xie, L.; Yang, M.; Li, Z.; Wu, X. Runoff and soil loss characteristics on loess slopes covered with aeolian sand layers of different thicknesses under simulated rainfall. J. Hydrol. 2017, 549, 244–251. [Google Scholar] [CrossRef]
- Zhang, F.; Yang, M.; Li, B.; Li, Z.; Shi, W. Effects of slope gradient on hydro-erosional processes on an aeolian sand-covered loess slope under simulated rainfall. J. Hydrol. 2017, 553, 447–456. [Google Scholar] [CrossRef]
- Zhang, X.; Li, Z.; Li, P.; Tang, S.; Wang, T.; Zhang, H. Influences of sand cover on erosion processes of loess slopes based on rainfall simulation experiments. J. Arid Land 2018, 10, 39–52. [Google Scholar] [CrossRef] [Green Version]
- Wang, C.S.; Gao, F.; Sun, W.Y.; Mu, X.M.; Gao, P.; Zhao, G.J.; Song, X.Y. Rainfall-infiltration process and characteristics of slope-gully system in the hilly and gully region of the Loess Plateau. Acta Ecol. Sin. 2021, 41, 3111–3122, (In Chinese with English Abstract). [Google Scholar]
- Shu, F.Y.; Dong, Q.G.; Feng, H.; Li, C.; Han, J.Q.; Zhang, T.B. Effects of Different Organic Materials on Water Movement in Gully Land Consolidation Soil on The Loess Plateau. J. Soil Water Conserv. 2022, 36, 74–79, (In Chinese with English Abstract). [Google Scholar]
- Sakellariou-Makrantonaki, M.; Angelaki, A.; Evangelides, C.; Bota, V.; Tsianou, E.; Floros, N. Experimental Determination of Hydraulic Conductivity at Unsaturated Soil Column. Procedia Eng. 2016, 162, 83–90. [Google Scholar] [CrossRef] [Green Version]
- Angelaki, A.; Sakellariou-Makrantonaki, M.; Tzimopoulos, C. Laboratory experiments and estimation of cumulative infiltra-tion and sorptivity. Water Air Soil Pollut. Focus 2004, 4, 241–251. [Google Scholar] [CrossRef]
- Muntohar, A.S.; Liao, H.-J. Factors affecting rain infiltration on a slope using Green-Ampt model. J. Phys. Sci. 2019, 30, 71–86. [Google Scholar] [CrossRef]
- Pandey, P.K.; Pandey, V. Estimation of infiltration rate from readily available soil properties (RASPs) in fallow cultivated land. Sustain. Water Resour. Manag. 2018, 5, 921–934. [Google Scholar] [CrossRef]
- Schmid, B.H. On overland flow modelling: Can rainfall excess be treated as independent of flow depth? J. Hydrol. 1989, 107, 1–8. [Google Scholar] [CrossRef]
- Angelaki, A.; Sihag, P.; Makrantonaki, M.S.; Tzimopoulos, C. The effect of sorptivity on cumulative infiltration. Water Sci. Technol. Water Supply 2020, 21, 606–614. [Google Scholar] [CrossRef]
- Tang, S.S.; Li, Z.B.; Ren, Z.P.; Yao, J.W.; Tang, H. Experimental Study on the Process of Runoff and Sediment Yield on Sand-covered Slope. J. Soil Water Conserv. 2015, 29, 25–28. [Google Scholar]
- Zhang, L.P.; Tang, K.L.; Zhang, P.C. Research on Soil Wind Erosion Laws in Loess Hilly-Gully Region Covered by Sheet Sand. J. Soil Water Conserv. 1999, 5, 40–45. [Google Scholar]
- Wu, X.R.; Zhang, F.B.; Wang, Z.L. Variation of Sand and Loess Properties of Binary Structure Profile in Hilly Region Covered by Sand of the Loess Plateau. J. Soil Water Conserv. 2014, 28, 190–193. [Google Scholar]
- Tang, S.; Li, Z.; Lu, K.; Liu, Y.; Su, Y.; Ma, Y. Relationship between hydrodynamic parameters and runoff and sediment yield on sand-covered slope in rainfall simulation study. Trans. Chin. Soc. Agric. Eng. 2017, 33, 136–143. [Google Scholar]
- Mishra, S.K.; Chaudhary, A.; Shrestha, R.K.; Pandey, A.; Lal, M. Experimental Verification of the Effect of Slope and Land Use on SCS Runoff Curve Number. Water Resour. Manag. 2014, 28, 3407–3416. [Google Scholar] [CrossRef]
- Bao, Y.X.; Wang, X.; Zhou, L.L.; Chen, Z.Q.; Zhang, K. A Study on the Temporal and Spatial Evolutionary Processes of the Dynamic Responses of Hydrodynamic Erosion Parameters on Freeze-thaw Slopes. J. Soil Water Conserv. 2017, 31, 103–110. [Google Scholar]
- Zhou, P.H.; Wang, Z.L. Soil erosion storm rainfall standard in the loess plateau. Bull. Soil Water Conserv. 1987, 1, 38–44, (In Chinese with English Abstract). [Google Scholar]
- Mertens, J.; Stenger, R.; Barkle, G.F. Multiobjective Inverse Modeling for Soil Parameter Estimation and Model Verification. Vadose Zone J. 2006, 5, 917–933. [Google Scholar] [CrossRef]
- Guellouz, L.; Askri, B.; Jaffré, J.; Bouhlila, R. Estimation of the soil hydraulic properties from field data by solving an in-verse problem. Sci. Rep. 2020, 10, 9359. [Google Scholar] [CrossRef]
- Hao, H.; Guo, Z.; Wang, X.; Zhan, H.; Ma, R.; Li, Z.; Jiang, J. Rill erosion process on red soil slope under interaction of rainfall and scouring flow. Trans. Chin. Soc. Agric. Eng. 2017, 33, 134–140, (In Chinese with English abstract). [Google Scholar]
- An, J.; Zheng, F.; Lu, J.; Li, G. Investigating the Role of Raindrop Impact on Hydrodynamic Mechanism of Soil Erosion under Simulated Rainfall Conditions. Soil Sci. 2012, 177, 517–526. [Google Scholar] [CrossRef]
- Li, Y.; Shao, M.-A. Infiltration characteristics of soil water on loess slope land under intermittent and repetitive rainfall con-ditions. Chin. J. Appl. Ecol. 2008, 19, 1511–1516, (In Chinese with English Abstract). [Google Scholar]
- Zhang, Z.H. Soil Water Infiltration Characteristics and Model Simulation of Biological Soil Crusts Based on the Line Source Infiltration Method; Northwest A&F University: Xianyang, China, 2020; (In Chinese with English Abstract). [Google Scholar] [CrossRef]
- Ma, J.L.; Xu, H.H.; Wang, B.; Zhang, B.Q.; Dan, C.H. Effect of Soil Physical Crust on Runoff and Sediment Yield on Sloping Farm-land of the Loess Plateau. J. Soil Water Conserv. 2022, 36, 45–49, (In Chinese with English Abstract). [Google Scholar]
- Mao, X.R.; Yang, J.J.; Cao, Y.-E.; Tang, D.; Ding, Z.L. Wind Tunnel Study of Soil Crust Area and Distribution Affecting on Wind Ero-sion. J. Soil Water Conserv. 2020, 34, 1–7, (In Chinese with English Abstract). [Google Scholar]
- Li, Y.B.; Li, S.L.; Xiao, B.; Wang, F.F. Evaporation characteristics of covered with moss crust in the wind-water erosion crisscross region of the loess plateau. J. Soil Water Conserv. 2020, 34, 208–215, (In Chinese with English Abstract). [Google Scholar]
- Cao, X.J.; Xie, L.Y.; Zhang, F.B.; Yang, M.Y.; Li, Z.B. Quantifying the contributions of sand layer characteristic to variations of runoff and sediment yields from sand-covered loess slopes during simulated rainfall. Acta Geogr. Sin. 2019, 74, 962–974, (In Chinese with English Abstract). [Google Scholar]
- Liu, R.; Yu, X.X.; Cai, Q.G.; Sun, L.Y.; Fang, H.Y.; Jia, G.D.; He, J.J. Erosion process of loess slope and influencing factors in the loess hilly-gully region. Chin. J. Appl. Ecol. 2021, 32, 2886–2894, (In Chinese with English abstract). [Google Scholar]
- Shi, P.; Li, P.; Li, Z.; Sun, J.; Wang, D.; Min, Z. Effects of grass vegetation coverage and position on runoff and sediment yields on the slope of Loess Plateau, China. Agric. Water Manag. 2022, 259, 107231. [Google Scholar] [CrossRef]
- Kang, H.; Wang, W.; Xue, Z.; Guo, M.; Shi, Q.; Li, J.; Guo, J. Erosion morphology and runoff generation and sediment yield on ephemeral gully in loess hilly region in field scouring experiment. Trans. Chin. Soc. Agric. Eng. 2016, 32, 161–170, (In Chinese with English abstract). [Google Scholar]
- Wang, W.; Su, Y.Y.; Li, P.; Shi, P.; Zhao, B.H.; Xue, S.B.; Yang, G. Relationship Between Energy Parameters of Sand-Covered Loess Slope and Runoff and Sediment Yield During Thawing Period. J. Soil Water Conserv. 2021, 35, 56–64, (In Chinese with English Abstract). [Google Scholar]
- Song, M.H. Study on Water-Sand Process and Soil Erosion Dynamics Characteristics of Covered Slope under Artificial Simulated Rainfall Conditions; Beijing Forestry University: Beijing, China, 2019; (In Chinese with English Abstract). [Google Scholar] [CrossRef]


| Experimental Soil | Bulk Density (g/cm3) | Initial Soil Moisture | Clay Particle (≤0.002 mm) | Powder Particle (0.002~0.02 mm) | Sand Grains (≥0.02 mm) |
|---|---|---|---|---|---|
| Loess | 1.3 | 15% | 0.02% | 65.28% | 34.70% |
| Sand | 1.3 | 15% | 0.72% | 14.38% | 84.90% |
| Slope Type | Rainfall Density (mm/min) | Thickness of Sand-Covered (cm) | Rainfall Event |
|---|---|---|---|
| Sand-covered slope | 1.0 | 2 cm | 3 |
| 1.5 | 2 | 3 | |
| 2.0 | 2 | 3 | |
| 2.5 | 2 | 3 | |
| Slope land | 1.0 | 0 | 3 |
| 1.5 | 0 | 3 | |
| 2.0 | 0 | 3 | |
| 2.5 | 0 | 3 |
| Rainfall Density (mm/min) | Soil Depth | Initial Runoff Time (min) | ||||
|---|---|---|---|---|---|---|
| 3 cm | 6 cm | 9 cm | 14 cm | 22 cm | ||
| 1.0 | 1 | 1 | 7 | 13 | 33 | 15 |
| 1.5 | 1 | 1 | 7 | 18 | 90 | 6 |
| 2.0 | 1 | 2 | 6 | 16 | 40 | 3 |
| 2.5 | 1 | 1 | 3 | 8 | 27 | 2 |
| Rainfall Density (mm/min) | Soil Depth | Initial Runoff Time (min) | ||||
|---|---|---|---|---|---|---|
| 3 cm | 6 cm | 9 cm | 14 cm | 22 cm | ||
| 1.0 | 1 | 2 | 16 | 22 | 91 | 3 |
| 1.5 | 1 | 4 | 9 | 26 | 93 | 1 |
| 2.0 | 1 | 1 | 8 | 24 | 86 | 1 |
| 2.5 | 2 | 5 | 11 | 24 | 60 | 1 |
| Sand-Covered Slope (Pa) | Slope Land (Pa) | ||||||||
|---|---|---|---|---|---|---|---|---|---|
| Rainfall density (mm/min) | 1.0 | 1.5 | 2.0 | 2.5 | Rainfall density (mm/min) | 1.0 | 1.5 | 2.0 | 2.5 |
| First rainfall | 0.29 | 0.62 | 0.75 | 0.99 | First rainfall | 0.46 | 0.75 | 0.88 | 0.88 |
| Second rainfall | 0.31 | 0.62 | 0.93 | 1.12 | Second rainfall | 0.48 | 0.89 | 1.10 | 1.04 |
| Third rainfall | 0.37 | 0.92 | 0.92 | 1.36 | Third rainfall | 0.54 | 1.02 | 1.07 | 1.25 |
| Sand-Covered Slope (N/(m·s)) | Loess Slope (N/(m·s)) | ||||||||
|---|---|---|---|---|---|---|---|---|---|
| Rainfall density (mm/min) | 1.0 | 1.5 | 2.0 | 2.5 | Rainfall density (mm/min) | 1.0 | 1.5 | 2.0 | 2.5 |
| First rainfall | 0.022 | 0.063 | 0.078 | 0.119 | First rainfall | 0.031 | 0.064 | 0.081 | 0.107 |
| Second rainfall | 0.027 | 0.068 | 0.101 | 0.128 | Second rainfall | 0.033 | 0.076 | 0.095 | 0.126 |
| Third rainfall | 0.037 | 0.071 | 0.102 | 0.131 | Third rainfall | 0.038 | 0.077 | 0.107 | 0.128 |
Publisher’s Note: MDPI stays neutral with regard to jurisdictional claims in published maps and institutional affiliations. |
© 2022 by the authors. Licensee MDPI, Basel, Switzerland. This article is an open access article distributed under the terms and conditions of the Creative Commons Attribution (CC BY) license (https://creativecommons.org/licenses/by/4.0/).
Share and Cite
Wang, F.; Xu, G.; Li, Z.; Li, P.; Wang, T.; Zhang, J.; Wang, J.; Cheng, Y. Study on Infiltration and Soil Moisture Characteristics of a Sand-Covered Slope. Water 2022, 14, 1043. https://doi.org/10.3390/w14071043
Wang F, Xu G, Li Z, Li P, Wang T, Zhang J, Wang J, Cheng Y. Study on Infiltration and Soil Moisture Characteristics of a Sand-Covered Slope. Water. 2022; 14(7):1043. https://doi.org/10.3390/w14071043
Chicago/Turabian StyleWang, Feichao, Guoce Xu, Zhanbin Li, Peng Li, Tian Wang, Jianwen Zhang, Jie Wang, and Yuting Cheng. 2022. "Study on Infiltration and Soil Moisture Characteristics of a Sand-Covered Slope" Water 14, no. 7: 1043. https://doi.org/10.3390/w14071043
APA StyleWang, F., Xu, G., Li, Z., Li, P., Wang, T., Zhang, J., Wang, J., & Cheng, Y. (2022). Study on Infiltration and Soil Moisture Characteristics of a Sand-Covered Slope. Water, 14(7), 1043. https://doi.org/10.3390/w14071043