Article

Evaluation of Spatial-Temporal Characteristics of Rainfall Variations over Thailand Inferred from Different Gridded Datasets

by
Kritanai Torsri
1,2,3,
Zhaohui Lin
1,2,*,
Victor Nnamdi Dike
1,4,
Thippawan Thodsan
3 and
Prapaporn Wongsaming
5
1
International Center for Climate and Environment Sciences, Institute of Atmospheric Physics, Beijing 100029, China
2
College of Earth and Planetary Sciences, University of Chinese Academy of Sciences, Beijing 100049, China
3
Hydro-Informatics Institute, Ministry of Higher Education, Science, Research and Innovation, Bangkok 10900, Thailand
4
Energy, Climate, and Environment Science Group, Imo State Polytechnic Umuagwo, Owerri 464119, Imo State, Nigeria
5
Thai Meteorological Department, Ministry of Digital Economy and Society, Bangkok 10260, Thailand
*
Author to whom correspondence should be addressed.
Water 2022, 14(9), 1359; https://doi.org/10.3390/w14091359
Submission received: 3 March 2022 / Revised: 7 April 2022 / Accepted: 19 April 2022 / Published: 22 April 2022
(This article belongs to the Section Ecohydrology)

Abstract

:
The fidelity of gridded rainfall datasets is important for the characterization of rainfall features across the globe. This study investigates the climatology, interannual variability, and spatial-temporal variations of seasonal rainfall over Thailand during the 1970–2007 period using station data obtained from the Thai Meteorological Department (TMDstn). In addition, the performance of three gridded rainfall datasets, namely APHRODITE, CRU, and GPCC, in reproducing these seasonal rainfall features were intercompared and further validated with the results derived from the TMDstn. Results show that the gridded datasets can reproduce the spatial distribution of the TMDstn’s summer mean rainfall. However, large systematic underestimation is seen in APHRODITE, while GPCC shows better agreement with TMDstn as compared to others. In the winter, the spatial distribution of the seasonal mean of rainfall is well captured by all gridded data, especially in the upper part of Thailand, while they failed to capture high rainfall intensity in the south and the eastern parts of Thailand. Meanwhile, all the gridded datasets underestimated the interannual variability of summer and winter season rainfall. Using EOF analysis, we demonstrate that all the gridded datasets captured the first two dominant modes of summer rainfall, while they underestimated the explained variance of EOF-1. In the winter season, a good agreement is found between the first two modes of the TMDstn and the gridded datasets for both the spatial pattern and temporal variation. Overall, the GPCC data show relatively better performance in reproducing the spatial distribution of rainfall climatology and their year-to-year variation over Thailand. Furthermore, the performance of the gridded datasets over Thailand is largely dependent on the season and the complexity of the topography. However, this study indicates the existence of systematic bias in the gridded rainfall datasets when compared with TMDstn. Therefore, this indicates the need for users to pay attention to the reliability of gridded rainfall datasets when trying to identify possible mechanisms responsible for the interannual variability of seasonal rainfall over Thailand.

1. Introduction

With the current concerns about the impacts of flood and drought disasters across the globe, there is an increasing interest to study rainfall variation in Thailand, since rainfall is a primary source of freshwater, feeding into rivers, lakes, and reservoir storage in the country. Meanwhile, these water resources support human activities in many sectors, especially agriculture, which plays a key role in the economy of the country [1]. Apart from its necessities, Thailand has experienced disasters induced by extreme rainfall. For example, a severe flood in 2011 was caused by intense summer monsoon rainfall during the May to October months, triggered by tropical storms [2]. Remarkably, this record-breaking event prompted a disastrous flood that caused huge socio-economic losses estimated at THB 1.43 trillion (USD 46.5 billion). In addition, the impact of drought is witnessed in some areas of Thailand. For instance, as documented in the Hydro-Informatics Institute (HII)’s archives, Thailand experienced a severe drought in 2013–2014 in most parts of the country (44 out of 77 provinces) [3]. This suggests that the interannual variation of rainfall has a great impact on the society and economy of the country.
In addition, rainfall is one of the most important components of the water cycle, with high spatiotemporal variability. It is also important for understanding the characteristics of disaster floods and drought events in Thailand. Hence, the fidelity of rainfall data is important for a better understanding of the terrestrial water cycle. In the past decade, several long-term gridded rainfall datasets have been developed and continuously improved. Hence, they have become more accessible for hydro-climatic studies, driving hydrological models, and validation of climate model simulations [4,5,6,7,8,9,10]. Moreover, most of the gridded datasets are constructed based on rain gauge station datasets that are unevenly distributed in space and sparse in some areas. Hence, the use of some of these datasets to examine the spatiotemporal characteristics of seasonal rainfall may create uncertainties or lead to a misleading interpretation of rainfall features over an area [11]. Additionally, using different gridded rainfall products as an input to drive hydrological simulations can also yield conflicting results [12]. Therefore, it is imperative to assess the capability of the gridded rainfall datasets in reproducing spatiotemporal characteristics of seasonal rainfall by comparing them with ground-truth data.
Previous studies have attempted to understand some aspects of rainfall variation in Thailand [6,13,14,15,16,17]. However, most of these studies focused on the features of rainfall variations over all of Southeast Asia (SEA). It is imperative to note that the common period of these previous studies is mostly limited to the 20th century, with a very sparse network of Thailand’s rain gauge datasets considered in the previous studies. Nonetheless, long-term data were not available, and the available data contained a lot of missing values, especially during the 1950s to 1960s [18]. Hence, in-depth characteristics of rainfall variation over Thailand cannot be well established from the studies. Recently, Takahashi et al. [19] mainly used 56 Thailand rain gauges to characterize the interannual variation of rainfall over the Indochina Peninsula. The temporal coverage of the rainfall data was limited to the year 2000 and only a 23-year record was used. Moreover, most of the rainfall stations were situated only in the upper part of Thailand. In their study, gridded rainfall data from two different sources, the Global Precipitation Climatology Project 1° Daily Precipitation (GPCP-1DD) and satellite-derived rainfall data from the Climate Prediction Center Merged Analysis of Precipitation (CMAP), were used as secondary information in their analysis to extend the study period to 1979–2011 and to provide a wide range of spatial rainfall patterns over the Indochina Peninsula. However, these two datasets have a very coarse spatial resolution (several hundred kilometers), hence details of rainfall variability at a regional scale, smaller than its grid cell, cannot be understood clearly. Recently, Singh et al. [20] utilized a moderate-resolution gridded (0.5°) rainfall data covering the 1951–2014 period to study rainfall variation and the changes in frequency and intensity of extreme rainfall over the SEA region and provided a more reliable results.
However, studies suggest that rainfall variability over Thailand is characterized by sea surface temperature anomalies (SSTA) and the attendant atmospheric moisture circulations [21,22,23,24]. For instance, Singhrattna et al. [21] indicate that rainfall anomalies in Thailand are linked to the cold/warm phase of SSTA in the tropical Pacific Ocean. While using a dense network of rainfall stations with a long-term data record (1975–2006) to investigate a relationship between the interannual summer rainfall and two Asian monsoon indices (i.e., Indian summer monsoon and western North Pacific summer monsoon index), Limsakul et al. [22] concluded that there is an interconnection between the Asian monsoon subsystems in controlling the interannual variation of summer rainfall in Thailand. However, the western North Pacific summer monsoon is suggested to have a greater impact on the rainfall in the country than the Indian summer monsoon [22]. Using the Tropical Rainfall Measuring Mission (TRMM) dataset, Lim et al. [24] investigated the impacts and interaction of boreal winter monsoon cold surges and the Madden–Julian oscillation (MJO) on rainfall over SEA. It must be stated that the reported mechanisms associated with rainfall over Thailand are partly dependent on the choice of the reference dataset, which can cause discrepancies in the estimates of rainfall variability.
Nonetheless, studies reveal that using different gridded rainfall data in statistical analysis over a particular area of interest can yield different rainfall features [5,25,26,27]. The discrepancies of the gridded rainfall products when compared against gauge stations can be contributed by several factors, mainly due to different data sources, interpolation methods, and density of the station incorporated in each product [5]. The availability of high temporal resolution long-term daily gridded rainfall data makes it possible to analyze rainfall extremes over Asia. For example, Lai et al. [28] examined the fidelity of the Asian Precipitation-Highly-Resolved Observational Data Integration Towards Evaluation (APHRODITE) data in reproducing extreme rainfall over Central Asia and found that it can reproduce the spatial distributions of rainfall extremes but grossly underestimated the rainfall extremes in mountainous terrains. While evaluating the performance of seven satellite-based rainfall products (i.e., series of TRMM and Global Satellite Mapping of Precipitation (GSMaP) products, Global Precipitation Measurement (GPM), Climate Prediction Center Morphing (CMORPH), Precipitation Estimation from Remotely Sensed Information using Artificial Neural Networks (PERSIANN)) in reproducing sub-daily rainfall in Thailand over the 2014–2016 period, Trang et al. [29] found that no single dataset is universally superior in all aspects, when compared against station-based observations. It is also found that each product shows a different magnitude of bias and correlations, whereas some products fail to capture fluctuations and magnitude of the rainfall over Thailand. The mismatch in the spatiotemporal rain variations has also been reported in other regions [30,31,32]. Essentially, Chokngamwong and Chiu [33] indicated that different versions of TRMM provide conflicting rainfall variability over Thailand. However, when compared to other gridded observations, the CMORPH is found to have a better representation of spatiotemporal rainfall variability over Thailand than other datasets [29].
In addition, the gridded observational dataset is also commonly used as reference data for the assessment of climate model performance in many regions where station datasets are sparse [5,8,27,34,35,36,37]. Studies have shown that the performance of the models is largely dependent on the reference dataset [5,8,27,34,35,36]. In fact, the reliability of future rainfall projection can be established by assessing the ability of historical simulations in reproducing the observed gridded rainfall data [18,38,39].
Given the need to obtain reliable spatiotemporal characteristics of seasonal rainfall variability over Thailand, this study mainly uses station-based rain gauge data to reveal climatology, interannual variability, and spatial-temporal interannual variation of rainfall over Thailand, and also to access the ability of the gridded rainfall datasets in reproducing the rainfall features over the country. The remainder of this study is organized as follows. Data description and methods employed in this study are described in Section 2, while the intercomparison of the ability of the gridded datasets in reproducing different aspects of rainfall variability is presented in Section 3. Thereafter, discussions and conclusions are summarized in Section 4 and Section 5, respectively.

2. Data and Methods

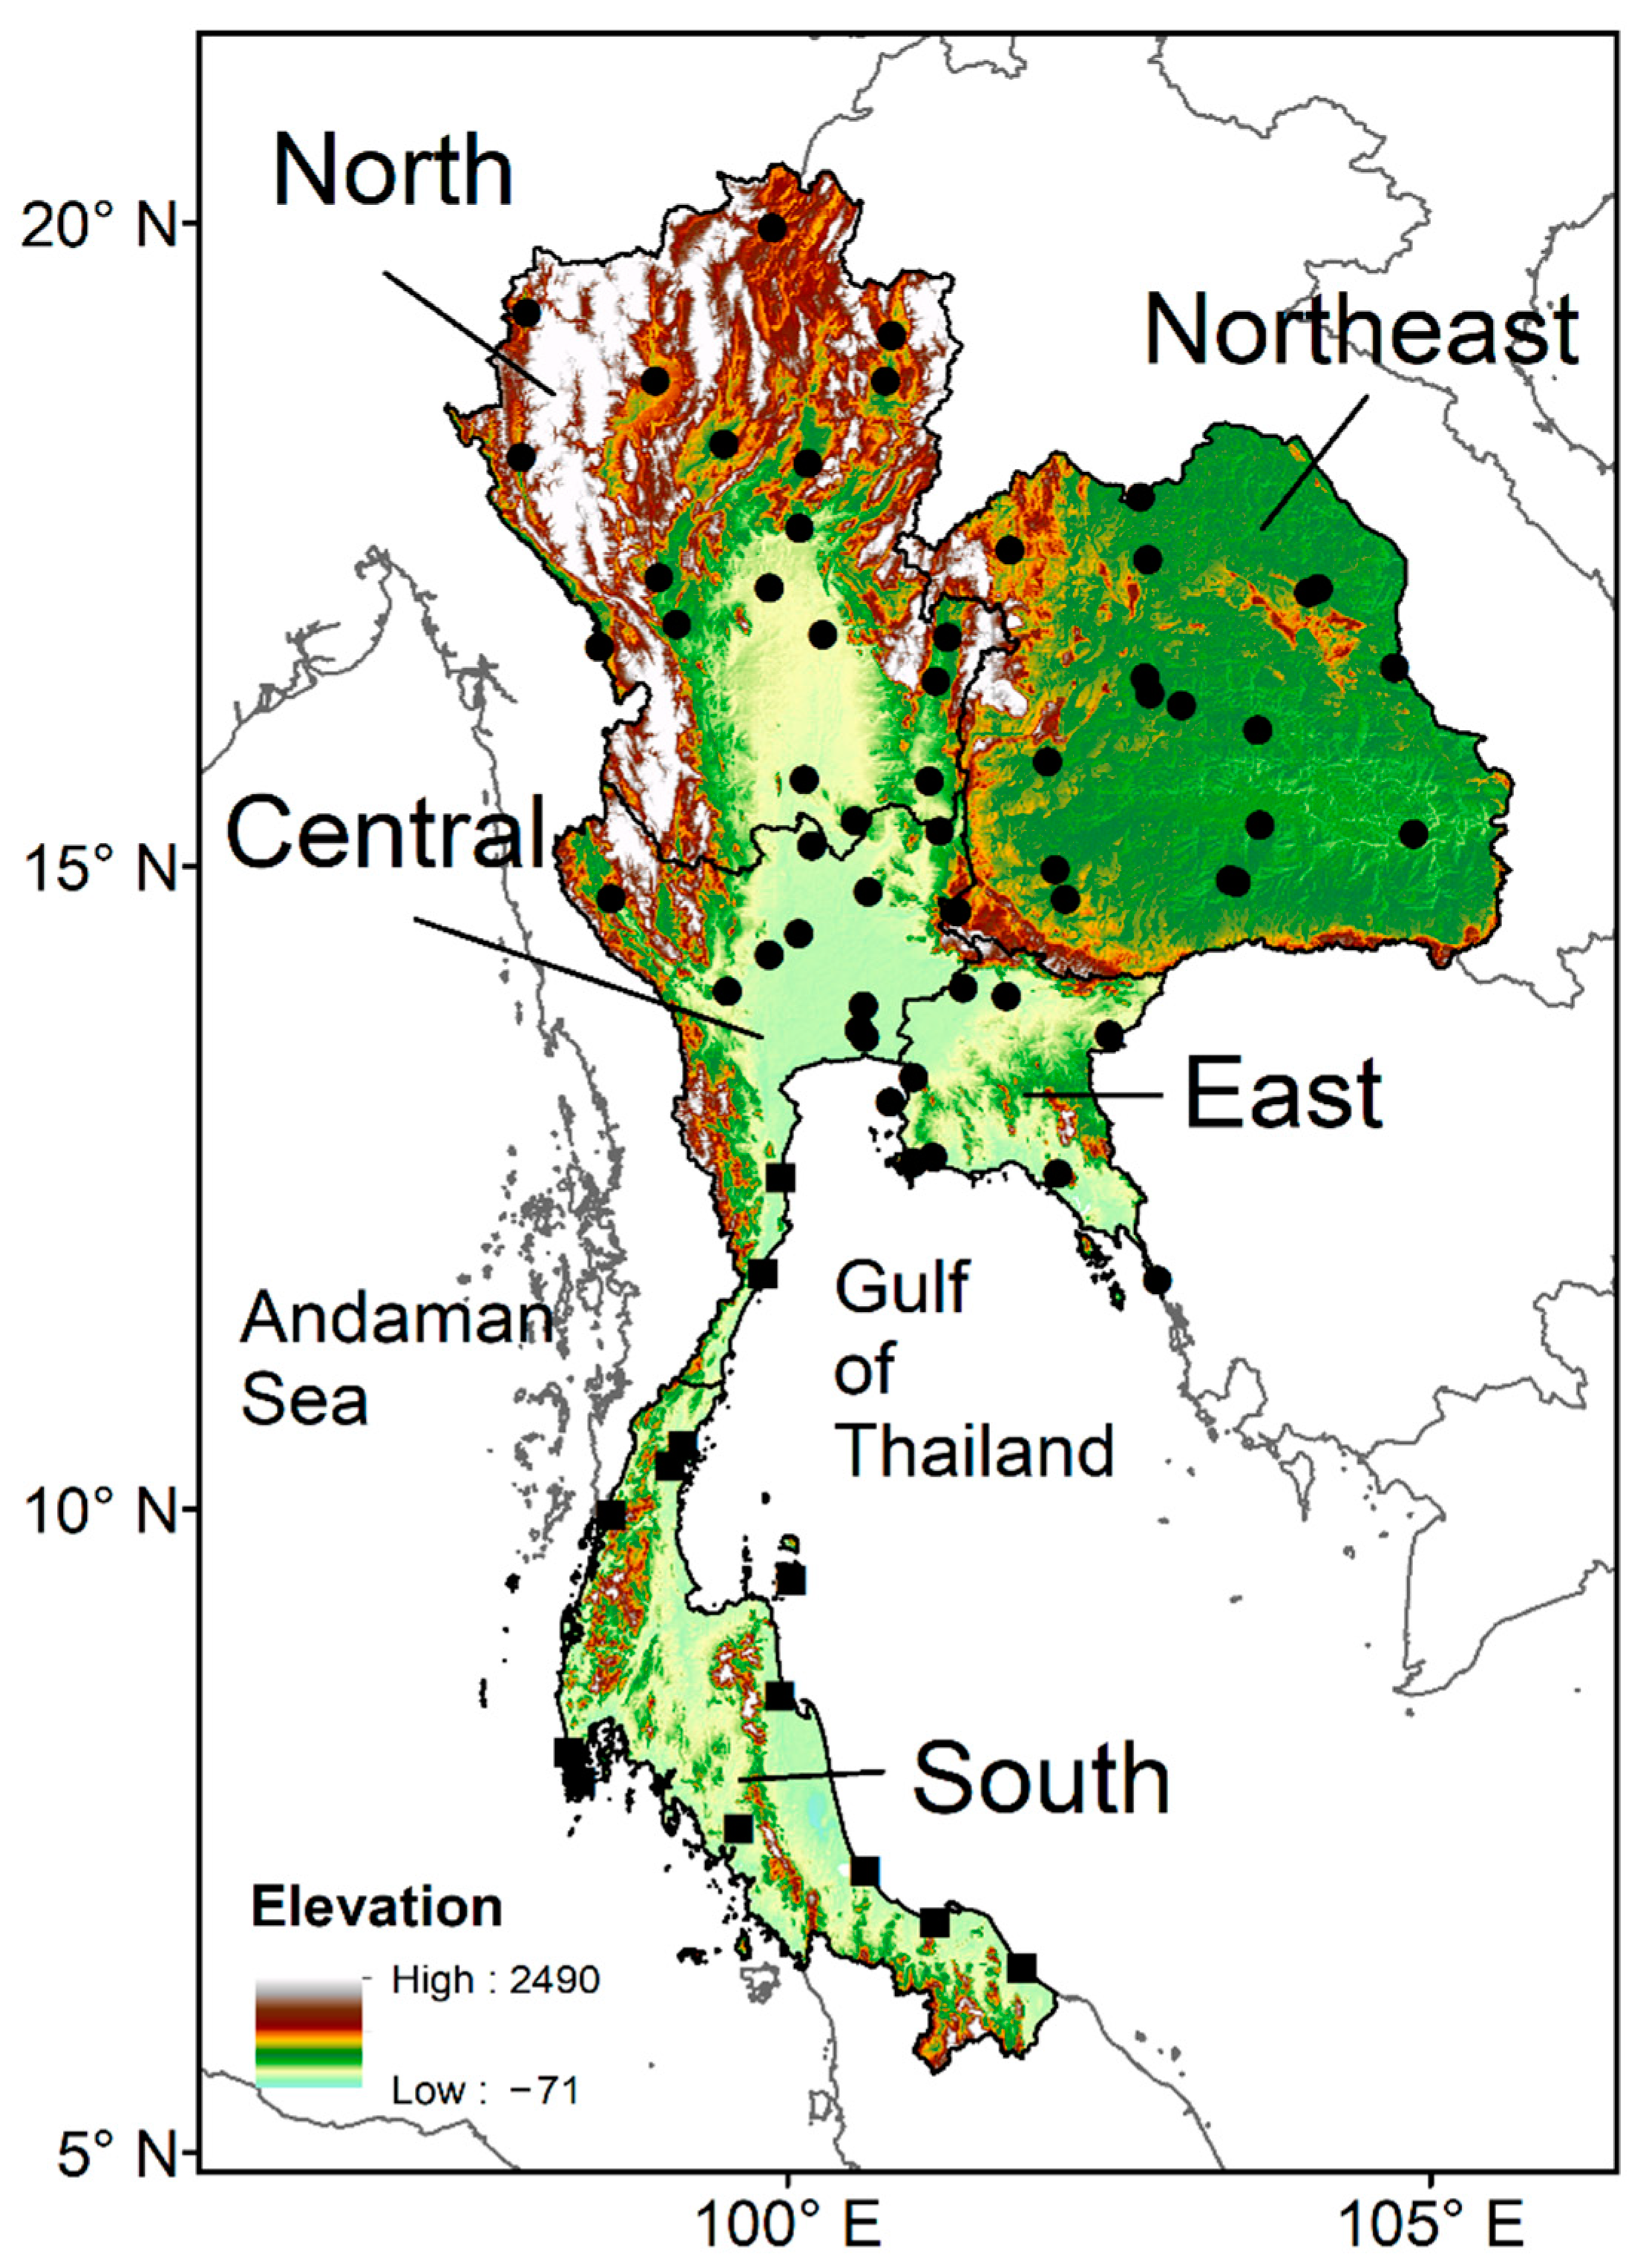
2.1. Rainfall Station Data in Thailand

Thailand is located in the tropical area between 5° N–22° N and 97° E–106° E bordered by Myanmar, Laos, Cambodia, and Malaysia. The climate pattern may be divided into five parts consisting of the north, northeast, central, east, and the south [40]. The north, northeast, central, and east parts of Thailand can be aggregated as upper Thailand due to the similarity in their climate patterns [18], see Figure 1. In general, the upper part of Thailand experiences dry weather from December to February due to the prevailing northeast monsoon and receives higher rainfall from May to October as a result of the prevailing southwest monsoon and tropical cyclones, while the southern part of Thailand records abundant rainfall all year round [40].
In this study, daily rainfall provided by TMD was used. All the station datasets were subjected to quality checks to adjust negative rainfall values as well as missing values. Daily rainfall data spanning from 1970 to 2007 (38 years) were obtained from 69 TMD stations (TMDstn). Datasets before this period reportedly contain a lot of missing values [18]. The spatial distribution of the rain gauge stations superimposed on terrain elevations is shown in Figure 1. The daily TMD rainfall data are thus aggregated to monthly values and thereafter utilized for analysis and comparison with other gridded datasets. Here, we also construct a gridded product (TMDgrd) based on the TMDstn, to be used as supplementary data to quantify some qualitative statistics. The method used for constructing the TMDgrd is briefly presented in Section 2.3.

2.2. Selected Gridded Rainfall Datasets

Three different gridded datasets provided from different sources were also selected, including (1) the Global Precipitation Climatology Centre (GPCC), (2) a time series version of Climate Research Unit (CRU TS), and (3) a daily product of APHRODITE (hereafter, APHRO). These three datasets were selected because they are considered contemporary data (i.e., up to date, occasionally reconstructed, and routinely updated) and they have been widely used in many studies [41,42,43,44,45]. The current version of GPCC is constructed based on the Spherical adaptation of Shepard’s interpolation method. More details of the product are described in Becker et al. [41] and Schneider et al. [46]. In this dataset, about 55 Thailand rain gauge datasets were interpolated in to the recent version. Meanwhile, the CRU data is constructed by the University of East Anglia based on the adjustment of rainfall anomalies [47] and, recently, the data is updated to span 1901 to 2020 [42,48]. In the CRU TS product, only 11 TMD rain-gauge station data were interpolated into the product, as such a few station data are considered in version 3.22 of the CRU data.
However, the APHRO dataset was constructed using a dense network of observation data collected from various sources in the monsoon region [45,49], including daily data provided by national hydrological and meteorological agencies, those from precompiled datasets by other projects or organizations, and those transmitted to a global network, Global Telecommunication System (GTS) [45]. For Thailand’s domain, a dense network of station datasets collected from two different sources (i.e., TMD and the Royal Irrigation Department) were included in the product. The description of datasets used herein is further summarized in Table 1.

2.3. Constructing a 0.5° Monthly Gridded TMD Data (TMDgrd)

To provide a basis for comparison, a monthly average of the daily rainfall was computed for each TMD station. Then, an interpolation approach was employed to construct gridded data with a spatial resolution of 0.5° × 0.5° latitude/longitude comprising 18 × 32 grid cells in the X- and Y-axis (hereafter, TMDgrd). Note that the TMDgrd is only used as supplementary data to compute the spatial distribution of error statistics.
The Cressman interpolation method is used to map the station dataset into 0.5° × 0.5° grid size. The method is commonly used to construct gridded data and it is acclaimed for its robustness in reproducing rainfall characteristics, even in complex terrain [50,51,52,53,54,55,56,57,58]. This method is suitable if available station networks are dense [51]; as such, we collected 69 TMD stations with long-term records and considerable spatial distribution over Thailand.
In addition to station density, the Cressman method strongly depends on the tightness of the radius of influence (i.e., the number of scans) by which a station is located within the radius of influence. The Cressman algorithm allows the user to define the number of scans, required to control the estimation of the weighting factor (W) in each grid point at consecutively smaller radii of influence [51]. For four scans herein specified at 1.45°, 1.25°, 1.0°, and 0.5° (units are in degrees of latitude), we found that these numbers gave a reasonable result by which for any grid point in the domain rainfall can be estimated rather than allocated a missing value.
At each scan, a new estimated value is calculated based on a function of distance as given in Equation (1), which is determined from each observed point fallen within a radius of influence. The W is then applied to all grid points located within the radius of influence before the next pass is made. The weighting factor at each pass is expressed as follows:
W = R 2 d 2 R 2 + d 2
where R is the radius of influence and d is the distance between a grid point and an observed point. The interpolated rainfall at a grid point is then computed as a linear combination between its first guess and the sum of the products of a distance-weight (W), and the difference between the observed rainfall at a station fallen in the radius of influence and an estimated value at that grid point, divided by the sum of the weights.
For the basis of comparison, we selected a 38-year (1970–2007) period, since it is a common period for the available TMD station data and other datasets. Note that the daily APHRO rainfall was converted into a monthly mean of daily values, and units of total rainfall were converted from mm to mm day−1 for CRU and GPCC. The analysis focused on two seasonal monsoon regimes consisting of (1) winter monsoon (December to February, hereafter DJF or dry season) and (2) summer monsoon (June to August, hereafter JJA or wet season).

2.4. Intercomparison Methods

To examine the spatiotemporal characteristics of rainfall variability over Thailand, the mean state and the interannual variability of seasonal rainfall were estimated using the station data. For comparison, the TMDgrd is herein used as supplementary data to compute the biases in the APHRO, CRU, and GPCC observations using Equation (2). Firstly, the consistency between the original TMD (i.e., TMDstn) and TMDgrd were examined using triangular mesh capability. Moreover, the study used TMDstn as a reference for evaluating the ability of the APHRO, CRU, and GPCC observations in reproducing the standard deviation of seasonal rainfall over Thailand.
Bias = 1 N t = 1 N ( P ( t ) grd P ( t ) tmd )
where P(t)grd is a global/regional gridded rainfall (i.e., APHRO, CRU, or GPCC) and P(t)tmd is TMDgrd value on month t at any grid points. N is the total number of months in a particular period (i.e., a season). In addition, root mean square error (RMSE) is considered.
Moreover, we used the Empirical Orthogonal Function (EOF) technique to further examine the spatiotemporal variability of rainfall over Thailand as implemented in previous studies [59,60,61,62,63]. Here, we performed the EOF analysis for both station points and gridded data. In the case of gridded rainfall data, we selected only grid points fallen in Thailand’s boundary, and the EOF analysis was employed afterward for ensuring the given EOF modes reflect rainfall variability over the domain.
Nonetheless, temporal correlation coefficients (TCC), as well as the pattern correlation coefficients (PCC), are used to determine the performance of the gridded observations in reproducing the station-observed temporal variation and the spatial pattern of seasonal rainfall as follows.
TCC = 1 N 1 t = 1 N ( P ( t ) tmd P tmd ¯ ) S D tmd ( P ( t ) grd P grd ¯ ) S D grd
PCC = 1 M 1 i = 1 M ( P ( i ) tmd P tmd ¯ ) S D tmd ( P ( i ) grd P grd ¯ ) S D grd
where SD is the standard deviation of observation (tmd) and other gridded data (grd) over time (t) space for TCC (N is the number of years) and grid space (i) for PCC (M is number of grid cells).

3. Results

3.1. Spatial Distribution of Summer and Winter Rainfall Climatology

Figure 2a shows the spatial distribution of the observed TMDstn mean summer rainfall over Thailand during the 1970–2007 period. Essentially, Figure 2a suggests that summer rainfall intensity increased across Thailand (i.e., 2.0–18.0 mm day−1) (Figure 2a), with the highest rain intensity occurring in the southern and the northeast parts of Thailand. This is perhaps resulting from the inhomogeneous impact of the summer monsoon circulation over the country [6,19,22].
Interestingly, the TMDgrd data reasonably captured the spatial distribution of the summer rainfall as compared to TMDstn (Figure 2b). Hence, the TMDgrd data were thereafter used as supplementary data to compare the performance of other gridded rainfall products in reproducing the spatial distribution of seasonal rainfall. Figure 2c indicates that APHRO fails to reproduce the spatial pattern of the summer rainfall in most parts of Thailand as captured in the TMDstn, especially in areas where the high rain intensity occurred (see, Figure 2a). As compared to TMDgrd, it is found that the APHRO captured the spatial pattern of summer rainfall with PCC = 0.73; however, the APHRO grossly underestimated the summer rainfall in most parts of Thailand with absolute bias between 1.5–2.0 mm day−1 (see Figure S1 in Supplementary Information). Moreover, CRU and GPCC are comparable in their ability to reproduce the spatial distribution of the summer rainfall (Figure 2d,e). However, the GPCC seems to be more similar to that of the TMDstn than CRU (Figure 2d,e). As such, the PCC between the TMDgrd and GPCC is 0.87, whereas the PCC between TMDgrd and CRU is 0.80. In addition, both CRU and GPCC datasets largely overestimated summer rainfall mostly in the western and northeastern parts of Thailand. Notably, the GPCC is much closer to the TMDgrd than CRU, with overall bias ranging from −1.0 to 1.0 mm day−1. Moreover, Figure S3a–c (Supplementary Information) suggests that the RMSE in both datasets is larger than the RMSE in the GPCC dataset. We hypothesize that the better performance of GPCC data might be a result of the high number of station data integrated into the GPCC dataset [64]. In addition, Yatagai et al. [45] also demonstrated that APHRO largely underestimated GPCC over the Indo-China region.
In Figure 3a, we show the 38-year mean of winter (DJF) rainfall distribution over Thailand based on the TMDstn. Basically, most of upper Thailand experienced dry conditions during the season with an average rainfall < 0.6 mm day−1. Figure 3a essentially shows that higher rainfall intensity occurs in eastern coastal strips of the upper sub-region (about 2.0 mm day−1). This area is notably located near the Gulf of Thailand with high convective activity [65], unlike other parts of the upper part of Thailand [18,66]. Moreover, abundant rainfall is more profound during the winter season in southern Thailand (i.e., >1.0 mm day−1), with the highest intensity (>5.0 mm day−1) on the east coast along the South China Sea. Interestingly, Loo et al. [67] and Jhun and Lee [68] demonstrated that during the winter season, the East Asian winter monsoon is responsible for heavy rainfall in the coastal areas where severe floods occasionally occurred [69]. It is imperative to note that the TMDgrd data reasonably reproduce the spatial pattern of DJF rainfall over Thailand (compared to TMDstn), as Figure 3b illustrates. Therefore, we also used TMDgrd as supplementary data to compare the performance of other gridded datasets in reproducing the DJF rainfall. Figure 3c–e present the spatial distribution of winter rainfall based on APHRO, CRU, and GPCC datasets. Seemingly, all the gridded rainfall datasets show similar patterns comparable to the TMDstn, with dry and wet conditions between upper and southern Thailand. To estimate bias and PCC in the other gridded data, all gridded products were compared with TMDgrd (see Figure S2). Results show that all the gridded datasets underestimated the winter rainfall distribution. However, in the upper part of Thailand, there is no substantial difference between TMDgrd and the other gridded data, as the absolute bias is less than 0.5 mm day−1. This is probably because the minimum winter rainfall is below 0.6 mm day−1 in the dry season in most areas. As such, a smaller RMSE is obtained in all the datasets relative to the TMDstn (Figure S3d–f). However, larger absolute biases greater than 2.0 mm day−1 are found in all gridded data over the east coast of the southern sub-region where high-intensity rainfall occurs. Although the biases are large in these aforementioned areas, the CRU and GPCC show better skills with a smaller magnitude of underestimation. Interestingly, all the gridded datasets skillfully reproduced the spatial pattern of winter rainfall over Thailand with PCC greater than 0.9.

3.2. Interannual Variability of Seasonal Rainfall

Figure 4a shows the spatial distribution of standard deviation (SD) based on the TMDstn, which was used to identify interannual variability of summer rainfall over Thailand. In general, the standard deviation of the summer rainfall is higher than 2.0 mm day−1. Apparently, a higher magnitude of SD (>3.0 mm day−1) can be observed in the upper part of the north, the northeast, and the western part of Thailand, whereas the highest magnitude is found in the east and southwest coast with SD higher than 4.0 mm day−1. This is an indication that high summer rainfall variability is recorded in these areas. Clearly, the TMDgrd captures the summer variability, especially in areas where SD < 3.0 mm day−1, while the TMDgrd seems to underestimate higher magnitude summer rainfall variability (compared to TMDstn). Notably, the TMDgrd can reproduce the rainfall variability in plane land terrain but cannot capture the pattern of rainfall variability over mountains, or in the narrow tip of the coastline where high rainfall variability is observed (Figure 4b). The spatial distribution of the interannual variability in all gridded data is similar to the pattern in TMDgrd; they also fail to reproduce the summer rainfall variability in areas where SD > 3.0 mm day−1. Moreover, it is obvious that the spatial distribution of the variability in all gridded rainfall data is smoothed and relatively shows a uniform pattern throughout Thailand (Figure 4c–e).
Figure 5 shows the spatial pattern of winter rainfall standard deviation (SD) over Thailand. Figure 5a illustrates that the variability is weak with SD < 1.0 mm day−1 over the upper part of Thailand, which suggests a weak rainfall variability during the dry season. This is perhaps induced by seasonal northeasterly circulation dominant during the winter season which brings dry air from mainland China toward the upper part of Thailand. Conversely, higher rainfall variability is found on the east coast of the southern sub-region, where high rainfall intensity is observed, with SD higher than 4.0 mm day−1. Apparently, the spatial distribution of the winter rainfall SD is well reproduced by the TMDgrd but is much smoother than that of TMDstn (Figure 5b). However, a large difference is seen between the TMDgrd and the TMDstn data in the upper part of Thailand, where the SD is much smaller (SD < 0.5 mm day−1). However, they are comparable in the southern part except over the eastern coast of southern Thailand. Similarly, other gridded datasets show a large difference in the spatial pattern of SD in the upper part of Thailand which is much smaller than that of TMDstn and TMDgrd (Figure 5c,d). Nonetheless, the winter rainfall variability is well estimated by other gridded data in areas where SD is less than 3.0 mm day−1, while the gridded datasets fail to capture high rainfall variability on the east coast. However, it is observed that among the other gridded datasets, the GPCC performed better in estimating rainfall variability over Thailand (Figure 5e).

3.3. Dominant Modes of Summer Rainfall and Its Variations

Figure 6 presents the spatial distribution of the first three leading EOF modes of the summer rainfall for TMDstn, TMDgrd, and other gridded data. For the TMDstn, the first three EOF modes contribute about 51% of the total variance (Figure 6a,f,k), in which ~22% of the variance can be explained by EOF-1 and ~19% by EOF−2, whereas EOF−2 can account for 10% of the explained variance. In EOF−1, the summer rainfall in the upper part of Thailand exhibits a dipole structure, with two distinct centers of action located over the central part and its vicinity (Figure 6a). The dipolar rainfall pattern suggests that a different mechanism may be responsible for interannual variation in the sub-regions [70,71]. In addition to the large-scale circulation and weather disturbances, urbanization can also be another factor that contributed to the interannual variation of the summer rainfall [72,73,74]. Meanwhile, the spatial distribution of EOF−2 shows a relatively uniform pattern, accounting for ~19% of the total variance; moreover, a different pattern can be found in the eastern fringes of the upper part of Thailand (Figure 6k).
In southern Thailand, the summer rainfall variation of the first two major modes exhibits a uniform pattern with a single center of action over the southwest coast (Figure 6a,f), while the EOF−3 mode exhibits a dipole variation (Figure 6k). Indeed, in the summer season, a strong center of the rainfall variation exists on the southwest coast in all the major modes.
For gridded data, the spatial distribution of the summer rainfall in the first three modes based on the TMDgrd dataset is comparable to its corresponding mode from TMDstn (Figure 6b,g,l). In EOF−1, for instance, the TMDgrd reproduced the dipole structure of rainfall variation in the upper part of Thailand, but it seems to have overestimated the explained variance (Figure 6b). Yet, it reproduced the spatial variations of the summer rainfall variation, especially on the southwest coast. In EOF−2, the pattern of TMDstn can be estimated by the TMDgrd, and its explained variance (4%) is slightly underestimated by the interpolated TMD (Figure 6g). The TMDgrd can also capture the spatial variations of the summer rainfall in the upper part of Thailand and the southwest coast. However, it agrees well with the TMDstn in the southern part of Thailand. For EOF−3, the spatial distributions of the summer rainfall variation in TMDgrd and TMDstn are relatively comparable in most parts of Thailand, albeit a slight difference between their explained variance (~2.4%). However, a reverse pattern between these datasets can be seen in the central part of Thailand (Figure 6l). Nonetheless, the other gridded rainfall dataset could not reproduce the corresponding EOF modes as shown in TMDstn for all the major modes (Figure 6c–e,h–j,m–o for EOF−1, EOF−2, and EOF−3, respectively).
Next, we considered the principal component (PC) time series of the summer variation in the first three modes for the TMDstn (Figure 7a). Based on the PC time series of TMDstn, it is found that summer rainfall in Thailand shows a strong interannual variability in the first two modes (Figure 7a,b). Moreover, in PC−1, it is observed that the summer rainfall exhibited high variation after the 1990s with the largest positive peak in 1997 and the largest negative peak in 1998 (Figure 7a), corresponding to a very strong ENSO year [75]. Apparently, the high year-to-year variation is more pronounced in PC−2 (Figure 7b), whereas the PC−3 represents summer rainfall variation on a decadal (Figure 7c).
Interestingly, the PC−1 time series of the TMDgrd gridded datasets show a good agreement with TMDstn with a high correlation coefficient (TCC = 0.9). Meanwhile, the PC−1 obtained from the other gridded rainfall datasets did not fit very well with that of TMDstn, as TCC is relatively below 0.5. Among the other gridded data, GPCC shows better performance with a higher correlation (TCC = 0.49), followed by CRU (TCC = 0.27). For PC−2, the TCC value between the PC time series of TMDstn and TMDgrd decreased compared to PC−1, but it is still high (TCC = 0.67). In the PC−2, the performance of CRU and GPCC are comparable with TCC = 0.57 and 0.59, respectively. Again, the APHRO shows the lowest TCC in both PC−1 and PC−2 (TCC < 0.20). For PC−3, TMDgrd still shows a high correlation with TMDstn, but the magnitude of TCC decreased and it is smaller than that of the first two modes (TCC = 0.55). Notably, with TCC < 0.15, the PC−3 of the gridded datasets could capture the temporal variation of the summer rainfall over Thailand. The TCC values between the PCs of TMDstn and other gridded datasets are summarized in Table 2.
In general, Figure 6 and Figure 7 suggest that the spatial patterns of the leading modes of the TMDstn data are well captured by the TMDgrd, especially the first two modes (Figure 6b). Moreover, the corresponding PC time series of the original and interpolated TMD are highly correlated (i.e., TCC = 0.90) (Figure 7a). However, the remaining major EOFs both are observed to be slightly different in terms of spatial pattern, but their corresponding PC time series are still well correlated (TCC = 0.67 and TCC = 0.55 for PC−2 and PC−3, respectively) (see Table 2 and Figure 7b,c). This confirms that there is a good agreement between the original and interpolated TMD, and thus it may also be used as the reference data for our comparison. Moreover, it might be useful for climate studies or used as a tool for model evaluation. However, the other gridded data (i.e., APHRO, CRU, and GPCC) fail to spectacularly reproduce the spatial pattern of the dominant EOF modes, as seen in the EOF mode of TMDstn. The corresponding PC time series of each dataset is shown to be positively correlated with that of TMDstn, and the GPCC shows a higher TCC for the first two modes when compared to the others, whereas all other gridded data fail to reproduce the PC−3 of TMDstn.
Notably, it is observed that the EOF−1 and EOF−2 of the APHRO, CRU, and GPCC datasets are comparable to the EOF−2 and EOF−1 of the TMDstn (Figure 8). Therefore, we further investigate the large discrepancy between the corresponding TMDstn’s EOF patterns and the other gridded data by shifting the first two EOF modes to re-examine them comparatively. The pattern correlation (PCC) of its corresponding EOF mode increased from negative PCC to positive PCC (i.e., −0.03 to 0.09, −0.08 to 0.09, and −0.18 to 0.16 for APHRO, CRU, and GPCC, respectively). Furthermore, it is found that their PC time series and the PC time series of the TMDstn are similar, such that the PC−1 of the TMDstn and PC−2 of the other gridded data are positively correlated with TCC > 0.4. In addition, the PC−2 of TMDstn and PC−1 of the gridded data are highly correlated with TCC greater than 0.7. The EOF−2 of the TMDstn was also compared to the EOF−1 of the gridded data. Interestingly, it is found that the PCC between its corresponding modes is increased from −0.05 to 0.27, −0.01 to 0.29, and 0.04 to 0.54 for APHRO, CRU, and GPCC, respectively. Moreover, Figure 9 indicates that their temporal correlations also increased (see Table S1 for a summary of the TCC).
The foregoing demonstrates that the major EOF modes of the ground-truth summer rainfall can be reproduced by the other gridded datasets (Figure 8 and Figure 9). Apparently, they underestimated the explained variance of the station data. In other words, EOF−1 of the gridded datasets is a replica of the EOF−2 TMDstn.

3.4. Dominant Modes of Winter Rainfall and Its Variations

For the winter season, the EOF−1, EOF−2, and EOF−3 based on the TMDstn are presented in Figure 10a,f,k, respectively. As seen, the first and second modes contribute about 60% and ~16% of the total variance of winter rainfall over Thailand. In fact, variances of the winter rainfall over Thailand are mostly accounted for by the first two modes, which is about 76%. In EOF−1, rainfall variability in the upper part of Thailand exhibits a dipole structure in which there is a variation between the eastern and western parts of the sub-region. This might be ascribed to the geographical differences in the two sub-regions, as the eastern part is characterized by an upland plateau, whereas the western part is mountainous terrain. Nonetheless, the PC−1 reveals that the winter rainfall pattern exhibits a strong interannual variation (Figure 11), which may be associated with the interannual variation of the easterly wind anomalies induced by the East Asia winter monsoon [76].
The spatial structures of the first two EOF modes of the DJF rainfall are well estimated by all products (compared to TMDstn) as presented in Figure 10b–e for EOF−1 and Figure 10g–j for EOF−2, such that the EOF−1 is comparable to the EOF−1 of APHRO, CRU, and GPCC with a relatively high PCC of 0.66, 0.69, and 0.69, respectively, albeit a weaker PCC for EOF−2, ranging from 0.50 to 0.55. The EOF−3 is well estimated by the CRU dataset, with PCC = 0.54 while the PCC for GPCC is 0.52, whereas a lower PCC is observed with APHRO (PCC = 0.27). Overall, the explained variances of the major modes estimated by the gridded rainfall datasets are comparable to that of the TMDstn. However, the first and second modes tend to have been overestimated and underestimated compared to the TMDstn’s explained variances. In addition to the good agreement in estimating the spatial structures, the first two PC time series of the TMDstn are highly correlated with the corresponding PC time series of each product (Figure 11a,b). Interestingly, only the TMDgrd and GPCC can accurately estimate the variance and temporal variations as observed in the TMDstn.
Based on our results, the performance of gridded rainfall data (i.e., APHRO, CRU, and GPCC) over Thailand varies depending on the season and the complexity of the land areas as compared to the station data. For the summer season, the spatial distribution of the rainfall given by TMDstn can be captured by the gridded datasets, but a large systematic underestimation is seen in APHRO, and GPCC is much closer to the TMDstn than the others (see Figure S1). In the winter season, the climatology of the rainfall is well estimated by all gridded data, especially in the upper part of Thailand, while they fail to estimate the high rainfall intensity over the east coast. In fact, all the gridded data tend to smoothen the rainfall variability in both summer and winter seasons; hence, the datasets could not reproduce the spatial distribution in the areas where high rainfall variability (with SD > 3.0 mm day−1) occurred. Particularly, the two modes of summer monsoon rainfall obtained in the TMDstn are well reproduced by the APHRO, CRU, and GPCC datasets. However, the explained variance of EOF−1 is underestimated in all the datasets. Interestingly, there is a shift between the first modes of the station data and the second mode of the gridded datasets. For the winter season, all gridded rainfall datasets can estimate the spatial variations of the first three dominant modes. However, in the first two modes (Figure 11a,b), a high correlation is found between the PC time series of all gridded data and station data (see Table 2 for a summary of the TCC). A notable decrease in TCC is found for PC−3, especially in APHRO and CRU, whereas the GPCC shows a better performance in reproducing the temporal variation of winter rainfall in the first three EOF modes (Figure 11c).

4. Discussion

Based on the analysis, it is found that using different gridded rainfall datasets to study seasonal rainfall over Thailand may yield different results depending on the geographical location, season, and statistical metrics considered. Moreover, this may create uncertainty in the observed spatiotemporal characteristics of seasonal rainfall in any given location [11,77,78,79]. Hence, this study examined the performance of other gridded datasets, namely APHRO, CRU, and GPCC rainfall datasets, in reproducing the spatiotemporal characteristics of seasonal rainfall obtained based on TMDstn. Results show that the interpolated TMD data is comparable to the original station data, which demonstrates that the seasonal rainfall climatology and its variation are consistent and well preserved in the TMDgrd. As such, the TMDgrd estimated the spatial distribution of summer and winter rainfall relative to TMDstn creditably. However, the TMDgrd data tend to smoothen the amount of rainfall variability over Thailand for both the summer and winter seasons. Therefore, to obtain a reliable result we compared the gridded dataset with the TMDstn.
Notably, amongst other gridded data used in this study, the GPCC data show better performance in reproducing summer rainfall distribution than that observed using the TMDstn. This might be attributed to the fact that the amount of TMD rain gauge data incorporated in the GPCC product is higher than that incorporated in CRU data [42,46]. Although the APHRO data were constructed based on a very dense network of rain gauge station data [45], these data were found to be largely different from TMDstn. Meanwhile, Yatagai et al. [45] indicated that the APHRO data are relatively different from GPCC in the Indo-China Peninsula. The observed inconsistency in both datasets is perhaps related to the quality of station-based datasets incorporated in the APHRO dataset. Moreover, it is also found that GPCC and CRU show a large wet bias over the western and northeastern part of Thailand and a large dry bias in the mountainous terrain of northern Thailand. This deficiency has also been identified for China by Liu et al. [36], and may be related to the sparse network of rain gauge stations in mountainous areas. This suggests that the findings over Thailand are consistent with that over China. For the winter season, other gridded rainfall data can also reproduce the winter rainfall climatology relative to TMDstn. Yet, it is found that the APHRO could not capture the spatiotemporal features of winter rainfall as observed in TMDstn, whereas the GPCC and CRU show good agreement with TMDstn. Interestingly, the GPCC data performed better than other datasets in the upper part of Thailand, while the apparent low performance of CRU data is perhaps related to the limited number of rain gauge stations incorporated in the data [47,64]. Meanwhile, both CRU and GPCC datasets are comparable in the southern part of Thailand. However, it is noticed that all gridded data failed to estimate accurately the magnitude of the seasonal rainfall variability over the entire country. This suggests that the amount of rainfall variability is smoothed in all gridded rainfall products, hence the underestimation of rainfall magnitude in both seasons. In terms of rainfall variability over Thailand, all gridded data failed to estimate the magnitude of the standard deviation of TMDstn in both summer and winter seasons. This reflects the limitations of the gridded rainfall datasets. However, it is found that the GPCC shows better performance in reproducing the variation of seasonal rainfall variation than APHRO and CRU data. The GPCC product is also found to be superior to other gridded rainfall over Pakistan [27].
Furthermore, the observed EOF analysis of the first three modes of summer rainfall given by the station data accounts for about 51% of the total variance, which is mostly explained variance of the first two EOF modes. This suggests that the rainfall patterns in these two modes dominate summer rainfall variation in Thailand. Essentially, EOF−1 exhibits dipole modes by which the patterns of rainfall in central Thailand, specifically Bangkok and its environs, are different from other areas. Moreover, the PC time series revealed that the summer rainfall exhibits strong interannual variability with variations that are in phase with cold ENSO episodes (La Niña Years). The spatial pattern of EOF−2 is quite uniform in most parts of Thailand. Results further indicate that in the summer season, the EOF−1 of the TMDstn is more comparable to the EOF−2 of the gridded datasets, whereas their EOF−2 is comparable to the EOF−1 of the TMDstn data. As such, the PC−1 of the TMDstn is found to be highly correlated with PC−2 of the gridded data (TCC > 0.4), whereas the PC−2 of the TMDstn and PC−1 of the gridded datasets show a higher correlation greater than 0.7. This suggests that the summer EOF modes can be reproduced by the gridded datasets but are likely to underestimate the explained variance as obtained from the station data. In the other words, the EOF−1 of the gridded data should be alternated with its EOF−2 to obtain a more reliable result.
Nonetheless, results show that the first mode of winter rainfall contributes about 60% of the total variance, which demonstrates the dominance of the first EOF mode. The spatial pattern indicates that the northern part of Thailand is markedly dry whereas the southern part is remarkably wetter during the winter (dry) season, although all the gridded rainfall datasets show good agreement with the TMDstn data in reproducing the leading EOF modes of winter rainfall over Thailand. The gridded datasets struggle to reproduce the magnitude of winter rainfall in the southern part of Thailand due to their relatively coarse resolution (0.5° × 0.5°), which cannot provide sufficient information over small and narrow areas in the south. This suggests that the performance of the gridded datasets is perhaps connected with the low magnitude of rainfall associated with the dry season, especially in most parts of upper Thailand. It is also imperative to note that the GPCC dataset performed better than other gridded observations in representing the EOF pattern and the associated PC time series, as observed using the TMDstn dataset.

5. Conclusions

In this study, we mainly used station-based rainfall data covering 69 meteorological stations to examine the spatiotemporal characteristics of seasonal rainfall over Thailand during the 1970–2007 period. Thereafter, the performance of gridded rainfall products (i.e., APHRO, CRU, and GPCC) in reproducing the characteristics of summer and winter rainfall were compared with the results obtained using the station data. Specifically, using the ground-truth TMDstn dataset as a reference, we assessed the ability of the three gridded rainfall datasets in representing the spatial distribution of seasonal mean rainfall, interannual variations, and the dominant modes of seasonal rainfall over Thailand. The main findings can be summarized as follows.
Results show that the spatial distribution of summer mean rainfall is not homogenous across Thailand, with the highest magnitude of 18.0 mm day−1 occurring in the east and the southwest. Conversely, the winter season is markedly dry, with rainfall magnitude less than 1.0 mm day−1 especially in the upper part of Thailand, while the southeast coast records about 5.0 mm day−1 during the winter season. To compare the pattern and magnitude of the TMDstn seasonal rainfall with the gridded observations, we constructed a gridded dataset (TMDgrd) based on the TMDstn. For the seasonal mean of rainfall, the TMDgrd is comparable to the TMDstn, hence it is used as supplementary data to compare with other gridded datasets. It is found that the APHRO, CRU, and GPCC reproduced the spatial distribution of seasonal rainfall over Thailand with PCC greater than 0.7. Meanwhile, the GPCC dataset shows better skill in reproducing the spatial distribution of seasonal rainfall with PCC greater than 0.87. However, the gridded datasets could not reproduce the magnitude of summer rainfall distribution, whereas they underestimated the magnitude of winter rainfall distribution over Thailand.
Nonetheless, it is observed that the summer rainfall exhibits high spatial variability, as such the standard deviation (SD) reaches 4.0 mm day−1 in most parts of Thailand, except the central part with a relatively lower magnitude of SD. Meanwhile, the spatial variability of the winter rainfall is largely homogenous over the upper part of Thailand, with an SD of about 2.0 mm day−1, whereas the magnitude is relatively higher in the southern part of Thailand. The gridded products failed to reproduce the spatial variability and magnitude of summer rainfall in upper Thailand, while to a certain extent, they captured the spatial variability and magnitude of winter rainfall in the southern part of Thailand.
Furthermore, it is observed that the first three modes of summer rainfall account for about 51% of the total variance, such that the explained variance of the first two EOFs are 22.2% and 18.6% for EOF−1 and EOF−2, respectively. Notably, EOF−1 exhibits a dipole structure, with a pattern that indicates a negative variation in the central part of Thailand and position variation elsewhere, while EOF−2 shows a spatially homogenous pattern. Comparatively, the APHRO, CRU, and GPCC datasets failed to creditably reproduce their corresponding EOF modes to that observed in TMDstn. However, it is found that there is a shift in the pattern of the leading EOF modes estimated from the gridded observations. As such, the pattern of the EOF−2 in the gridded dataset matches creditably with the pattern of EOF−1 in the TMDstn. Additionally, the PC−2 of the gridded datasets shows a higher correlation (TCC > 0.4) with the PC−1 of the TMDstn. Furthermore, the APHRO, CRU, and GPCC datasets underestimated the explained variance of the leading EOF modes as obtained from the station data. It is therefore imperative to state that using the dominant modes obtained from the gridded datasets to study the possible mechanisms of summer rainfall variation over Thailand may lead to erroneous conclusions.
Interestingly, the first EOF mode of the winter rainfall contributes about 60% of the total variance. The spatial pattern shows a negative rainfall pattern over the northeast of Thailand and a positive variation elsewhere. Nonetheless, all the gridded datasets creditably reproduced the dominant modes of the winter rainfall as estimated from the station data, such that the EOF−1 from the TMDstn is comparable with the EOF−1 of the gridded datasets with a relatively high PCC of 0.66, 0.69, and 0.69 for APHRO, CRU, and GPCC, respectively, whereas their corresponding PC time series is also well correlated with a high TCC greater than 0.8. Meanwhile, the PC time series of the GPCC data is highly correlated with that of TMDstn for all the corresponding dominant modes, with a TCC greater than 0.90 during the winter season. The performance of the gridded datasets in reproducing the winter rainfall dominant modes may be linked to the weak variation of winter rainfall over Thailand.
In summary, as compared to station data, there are variations in the performance of the APHRO, CRU, and GPCC datasets in reproducing the spatiotemporal characteristics of seasonal rainfall over Thailand, although results show that GPCC rainfall data performed better than the APHRO and CRU datasets in different aspects of seasonal rainfall metrics herein considered. Most of the station datasets in Thailand is marred with missing values, only 69 stations with complete data were considered in this study. Nonetheless, the spatiotemporal characteristics of seasonal rainfall over Thailand are better described using station data, given that the gridded observation datasets are inconsistent. Particularly, studies focusing on the possible mechanism associated with the variability of summer rainfall over Thailand should depend on the station-based dataset to examine the dominant modes of summer rainfall over the country. Moreover, further studies should use up-to-date datasets for a better understanding of recent characteristics of seasonal rainfall and to assess the ability of the gridded datasets in reproducing rainfall extremes over Thailand. Despite the limitations of this study, the results obtained herein shows the need to incorporate more station data into the gridded datasets to improve their capability in representing seasonal rainfall over Thailand.

Supplementary Materials

The following supporting information can be downloaded at: https://www.mdpi.com/article/10.3390/w14091359/s1, Figure S1: Spatial distribution of bias in JJA rainfall climatology based on (a) APHRO, (b) CRU, and GPCC relative to the TMDgrd. Black circles represent 69 TMD station locations used for TMDgrd, Figure S2: Spatial distribution of bias in DJF rainfall climatology based on (a) APHRO, (b) CRU, and (c) GPCC relative to the TMDgrd. Black circles represent 69 TMD station locations used for TMDgrd, Figure S3: Spatial distribution of root mean square error (RMSE) based on APHRO, CRU, and GPCC relative to the TMDgrd. (a–c) for the summer (JJA) season rainfall and (d-f) for the winter (DJF) season rainfall. Black circles represent 69 TMD station locations used for TMDgrd. Table S1: Temporal correlation coefficients (TCC) between PC time series of TMDstn EOF Mode 1 and grided EOF mode 2 in the summer season.

Author Contributions

Conceptualization and methodology, Z.L. and K.T.; validation, K.T.; formal analysis, K.T.; data curation, T.T. and P.W.; writing—original draft preparation, K.T.; writing—review and editing, Z.L. and V.N.D. All authors have read and agreed to the published version of the manuscript.

Funding

This study was jointly supported by the CAS Strategic Priority Research Program (grant XDA19030403, XDA20060501) and international collaboration project between the Natural Science Foundation of China (NSFC) and National Research Council of Thailand (NRCT): “Comparative risk assessment of hydrologic hazards and adaption policy in Jiulong and Chao Phraya River Basins” (41661144032). In addition, a research grant was supported by the Thailand Science Research and Innovation (TSRI) under Fundamental Fund No. 48873: “Sub-Seasonal to Seasonal (S2S) Prediction Project for Disaster Risk Reduction and Water Management in Thailand (S2S-THAI Project)”.

Data Availability Statement

Reader can find data availability of APHRODITE via http://www.chikyu.ac.jp/precip/english/products.html (accessed on 18 April 2022); CRU data via http://www.cru.uea.ac.uk/data (accessed on 18 April 2022); and GPCC data via https://opendata.dwd.de/climate_environment/GPCC/html/download_gate.html (accessed on 18 April 2022). For meteorological data over Thailand, they can be found by contacting K.T.

Acknowledgments

The authors sincerely thank the Thai Meteorological Department (TMD) for the observation data, Global Precipitation Climatology Centre (GPCC), Climatic Research Unit (CRU) of University of East Anglia, and APHRODITE project for precipitation data availability. Kritanai Torsri acknowledges support from the CAS-TWAS (The World Academy of Sciences) President Fellowship. All authors would sincerely thank the anonymous reviewers for the improvement of this paper through their constructive and insightful comments.

Conflicts of Interest

The authors declare no conflict of interest.

References

  1. Salim, Z. Thailand’s agricultural sector and free trade agreements. Asia-Pac. Trade Invest. Rev. 2006, 2, 51–70. [Google Scholar]
  2. Gale, E.L.; Saunders, M.A. The 2011 Thailand flood: Climate causes and return periods. Weather 2013, 68, 233–237. [Google Scholar] [CrossRef] [Green Version]
  3. HII. Drought 57. 2018. Available online: http://www.thaiwater.net/current/drought57/drought57.html (accessed on 10 May 2018). (In Thai).
  4. Fatichi, S.; Ivanov, V.Y.; Caporali, E. Investigating Interannual Variability of Precipitation at the Global Scale: Is There a Connection with Seasonality? J. Clim. 2012, 25, 5512–5523. [Google Scholar] [CrossRef]
  5. Degefu, M.A.; Bewket, W.; Amha, Y. Evaluating performance of 20 global and quasi-global precipitation products in representing drought events in Ethiopia I: Visual and correlation analysis. Weather Clim. Extrem. 2022, 35, 100416. [Google Scholar] [CrossRef]
  6. Chen, T.-C.; Yoon, J.-H. Interannual Variation in Indochina Summer Monsoon Rainfall: Possible Mechanism. J. Clim. 2000, 13, 1979–1986. [Google Scholar] [CrossRef]
  7. Caloiero, T.; Coscarelli, R.; Pellicone, G. Trend Analysis of Rainfall Using Gridded Data over a Region of Southern Italy. Water 2021, 13, 2271. [Google Scholar] [CrossRef]
  8. Bosilovich, M.G.; Chen, J.; Robertson, F.R.; Adler, R.F. Evaluation of Global Precipitation in Reanalyses. J. Appl. Meteorol. Climatol. 2008, 47, 2279–2299. [Google Scholar] [CrossRef]
  9. Biemans, H.; Hutjes, R.W.A.; Kabat, P.; Strengers, B.J.; Gerten, D.; Rost, S. Effects of Precipitation Uncertainty on Discharge Calculations for Main River Basins. J. Hydrometeorol. 2009, 10, 1011–1025. [Google Scholar] [CrossRef]
  10. Li, J.; Huo, R.; Chen, H.; Zhao, Y.; Zhao, T. Comparative Assessment and Future Prediction Using CMIP6 and CMIP5 for Annual Precipitation and Extreme Precipitation Simulation. Front. Earth Sci. 2021, 9, 1–20. [Google Scholar] [CrossRef]
  11. Borona, P.; Busch, F.; Krueger, T.; Rufin, P. Uncertainty in Drought Identification Due to Data Choices, and the Value of Triangulation. Water 2021, 13, 3611. [Google Scholar] [CrossRef]
  12. Zhao, C.; Ren, L.; Yuan, F.; Zhang, L.; Jiang, S.; Shi, J.; Chen, T.; Liu, S.; Yang, X.; Liu, Y.; et al. Statistical and Hydrological Evaluations of Multiple Satellite Precipitation Products in the Yellow River Source Region of China. Water 2020, 12, 3082. [Google Scholar] [CrossRef]
  13. Kripalani, R.H.; Kulkarni, A. Rainfall variability over Southeast Asia—Connections with Indian monsoon and ENSO extremes: New perspectives. Int. J. Climatol. 1997, 17, 1155–1168. [Google Scholar] [CrossRef]
  14. Kanae, S.; Oki, T.; Musiake, K. Impact of Deforestation on Regional Precipitation over the Indochina Peninsula. J. Hydrometeorol. 2001, 2, 51–70. [Google Scholar] [CrossRef] [Green Version]
  15. Manton, M.J.; Della-Marta, P.M.; Haylock, M.R.; Hennessy, K.J.; Nicholls, N.; Chambers, L.E.; Collins, D.A.; Daw, G.; Finet, A.; Gunawan, D.; et al. Trends in extreme daily rainfall and temperature in Southeast Asia and the South Pacific: 1961–1998. Int. J. Climatol. 2001, 21, 269–284. [Google Scholar] [CrossRef]
  16. Choi, G.; Collins, D.; Ren, G.; Trewin, B.; Baldi, M.; Fukuda, Y.; Afzaal, M.; Pianmana, T.; Gomboluudev, P.; Huong, P.T.T.; et al. Changes in means and extreme events of temperature and precipitation in the Asia-Pacific Network region, 1955–2007. Int. J. Climatol. 2009, 29, 1906–1925. [Google Scholar] [CrossRef]
  17. Takahashi, H.G. Seasonal changes in diurnal rainfall cycle over and around the Indochina Peninsula observed by TRMM-PR. Adv. Geosci. 2010, 25, 23–28. [Google Scholar] [CrossRef] [Green Version]
  18. Torsri, K.; Octaviani, M.; Manomaiphiboon, K.; Towprayoon, S. Regional mean and variability characteristics of temperature and precipitation over Thailand in 1961-2000 by a regional climate model and their evaluation. Theor. Appl. Climatol. 2013, 113, 289–304. [Google Scholar] [CrossRef]
  19. Takahashi, H.G.; Fujinami, H.; Yasunari, T.; Matsumoto, J.; Baimoung, S. Role of Tropical Cyclones along the Monsoon Trough in the 2011 Thai Flood and Interannual Variability. J. Clim. 2015, 28, 1465–1476. [Google Scholar] [CrossRef] [Green Version]
  20. Singh, V.; Qin, X. Study of rainfall variabilities in Southeast Asia using long-term gridded rainfall and its substantiation through global climate indices. J. Hydrol. 2020, 585, 124320. [Google Scholar] [CrossRef]
  21. Singhrattna, N.; Rajagopalan, B.; Kumar, K.K.; Clark, M. Interannual and Interdecadal Variability of Thailand Summer Monsoon Season. J. Clim. 2005, 18, 1697–1708. [Google Scholar] [CrossRef]
  22. Limsakul, A.; Limjirakan, S.; Suttamanuswong, B. Asian summer monsoon and its associated rainfall variability in Thailand. Environ. Asia 2010, 3, 79–89. [Google Scholar]
  23. Limsakul, A.; Singhruck, P. Long-term trends and variability of total and extreme precipitation in Thailand. Atmos. Res. 2016, 169, 301–317. [Google Scholar] [CrossRef]
  24. Lim, S.Y.; Marzin, C.; Xavier, P.; Chang, C.-P.; Timbal, B. Impacts of Boreal Winter Monsoon Cold Surges and the Interaction with MJO on Southeast Asia Rainfall. J. Clim. 2017, 30, 4267–4281. [Google Scholar] [CrossRef]
  25. Sun, Q.; Miao, C.; Duan, Q.; Ashouri, H.; Sorooshian, S.; Hsu, K.-L. A Review of Global Precipitation Data Sets: Data Sources, Estimation, and Intercomparisons. Rev. Geophys. 2018, 56, 79–107. [Google Scholar] [CrossRef] [Green Version]
  26. Ahmed, K.; Shahid, S.; Wang, X.; Nawaz, N.; Khan, N. Evaluation of Gridded Precipitation Datasets over Arid Regions of Pakistan. Water 2019, 11, 210. [Google Scholar] [CrossRef] [Green Version]
  27. Singh, T.; Saha, U.; Prasad, V.S.; Gupta, M.D. Assessment of newly-developed high resolution reanalyses (IMDAA, NGFS and ERA5) against rainfall observations for Indian region. Atmos. Res. 2021, 259, 105679. [Google Scholar] [CrossRef]
  28. Lai, S.; Xie, Z.W.; Bueh, C.; Gong, Y.F. Fidelity of the APHRODITE dataset in representing extreme precipitation over Central Asia. Adv. Atmos. Sci. 2020, 37, 1405–1416. [Google Scholar] [CrossRef]
  29. Trang, H.T.; Manomaiphiboon, K.; Singhrattna, N.; Assareh, N. Evaluation of multiple sub-daily satellite precipitation products for Thailand. J. Sustain. Energy Environ. 2020, 11, 81–91. [Google Scholar]
  30. Bhattacharyya, S.; Sreekesh, S.; King, A.D. Characteristics of extreme rainfall in different gridded datasets over India during 1983−2015. Atmos. Res. 2021, 267, 105930. [Google Scholar] [CrossRef]
  31. Nnamchi, H.C.; Dike, V.N.; Akinsanola, A.A.; Okoro, U.K. Leading patterns of the satellite-era summer precipitation over West Africa and associated global teleconnections. Atmos. Res. 2021, 259, 105677. [Google Scholar] [CrossRef]
  32. Satgé, F.; Defrance, D.; Sultan, B.; Bonnet, M.-P.; Seyler, F.; Rouché, N.; Pierron, F.; Paturel, J.E. Evaluation of 23 gridded precipitation datasets across West Africa. J. Hydrol. 2019, 581, 124412. [Google Scholar] [CrossRef] [Green Version]
  33. Chokngamwong, R.; Chiu, L.S. Thailand daily rainfall and comparison with TRMM products. J. Hydrometeorol. 2008, 9, 256–266. [Google Scholar] [CrossRef]
  34. Dhanya, C.T.; Villarini, G. An investigation of predictability dynamics of temperature and precipitation in reanalysis datasets over the continental United States. Atmos. Res. 2017, 183, 341–350. [Google Scholar] [CrossRef]
  35. Kim, I.-W.; Oh, J.; Woo, S.; Kripalani, R.H. Evaluation of precipitation extremes over the Asian domain: Observation and modelling studies. Clim. Dyn. 2019, 52, 1317–1342. [Google Scholar] [CrossRef] [Green Version]
  36. Liu, Z.; Liu, Y.; Wang, S.; Yang, X.; Wang, L.; Baig, M.H.A.; Chi, W.; Wang, Z. Evaluation of Spatial and Temporal Performances of ERA-Interim Precipitation and Temperature in Mainland China. J. Clim. 2018, 31, 4347–4365. [Google Scholar] [CrossRef]
  37. Dike, V.N.; Shimizu, M.H.; Diallo, M.; Lin, Z.; Nwofor, O.K.; Chineke, T.C. Modelling present and future African climate using CMIP5 scenarios in HadGEM2-ES. Int. J. Climatol. 2015, 35, 1784–1799. [Google Scholar] [CrossRef]
  38. Chotamonsak, C.; Salathé, E.P.; Kreasuwan, J.; Chantara, S.; Siriwitayakorn, K. Projected climate change over Southeast Asia simulated using a WRF regional climate model. Atmos. Sci. Lett. 2011, 12, 213–219. [Google Scholar] [CrossRef]
  39. Manomaiphiboon, K.; Octaviani, M.; Torsri, K.; Towprayoon, S. Projected changes in means and extremes of temperature and precipitation over Thailand under three future emissions scenarios. Clim. Res. 2013, 58, 97–115. [Google Scholar] [CrossRef]
  40. TMD. Climate of Thailand. Thai Meteorological Department. 2022. Available online: http://www.tmd.go.th/en/archive/thailand_climate.pdf (accessed on 15 March 2022).
  41. Becker, A.; Finger, P.; Meyer-Christoffer, A.; Rudolf, B.; Schamm, K.; Schneider, U.; Ziese, M. A description of the global land-surface precipitation data products of the Global Precipitation Climatology Centre with sample applications including centennial (trend) analysis from 1901-present. Earth Syst. Sci. Data 2013, 5, 71–99. [Google Scholar] [CrossRef] [Green Version]
  42. Harris, I.; Osborn, T.J.; Jones, P.; Lister, D. Version 4 of the CRU TS monthly high-resolution gridded multivariate climate dataset. Sci. Data 2020, 7, 109. [Google Scholar] [CrossRef] [Green Version]
  43. Tangang, F.; Chung, J.X.; Juneng, L.; Supari; Salimun, E.; Ngai, S.T.; Jamaluddin, A.F.; Mohd, M.S.F.; Cruz, F.; Narisma, G.; et al. Projected future changes in rainfall in Southeast Asia based on CORDEX–SEA multi-model simulations. Clim. Dyn. 2020, 55, 1247–1267. [Google Scholar] [CrossRef]
  44. Tangang, F.; Santisirisomboon, J.; Juneng, L.; Salimun, E.; Chung, J.; Supari, S.; Cruz, F.; Ngai, S.T.; Ngo-Duc, T.; Singhruck, P.; et al. Projected future changes in mean precipitation over Thailand based on multi-model regional climate simulations of CORDEX Southeast Asia. Int. J. Climatol. 2019, 39, 5413–5436. [Google Scholar] [CrossRef]
  45. Yatagai, A.; Kamiguchi, K.; Arakawa, O.; Hamada, A.; Yasutomi, N.; Kitoh, A. APHRODITE: Constructing a Long-Term Daily Gridded Precipitation Dataset for Asia Based on a Dense Network of Rain Gauges. Bull. Am. Meteorol. Soc. 2012, 93, 1401–1415. [Google Scholar] [CrossRef]
  46. Schneider, U.; Becker, A.; Finger, P.; Meyer-Christoffer, A.; Rudolf, B.; Ziese, M. GPCC full data reanalysis version 6.0 at 0.5: Monthly land-surface precipitation from rain-gauges built on GTS-based and historic data. GPCC Data Rep. 2011, 10. [Google Scholar] [CrossRef]
  47. Harris, I.; Jones, P.D.; Osborn, T.J.; Lister, D.H. Updated high-resolution grids of monthly climatic observations—the CRU TS3.10 Dataset. Int. J. Climatol. 2014, 34, 623–642. [Google Scholar] [CrossRef] [Green Version]
  48. CRU. Release Notes for CRU TS v4.05: 16 March 2021. 2022. Available online: https://crudata.uea.ac.uk/cru/data/hrg/cru_ts_4.05/Release_Notes_CRU_TS4.05.txt (accessed on 1 April 2022).
  49. Yatagai, A.; Yasutomi, N.; Maeda, M.D.P.S. (Eds.) The Climate Data Guide: APHRODITE: Asian Precipitation-Highly Resolved-Towards Evaluation of Water Resources. 2020. Available online: https://climatedataguide.ucar.edu/climate-data/aphrodite-asian-precipitation-highly-resolved-observational-data-integration-towards (accessed on 14 February 2022).
  50. Lu, C.; Browning, G.L. The Impact of Observational Errors on Objective Analyses. J. Atmos. Sci. 1998, 55, 1791–1807. [Google Scholar] [CrossRef]
  51. Cressman, G.P. An operational objective analysis system. Mon. Weather Rev. 1959, 87, 367–374. [Google Scholar] [CrossRef]
  52. Mitra, A.K.; Gupta, M.D.; Singh, S.V.; Krishnamurti, T.N. Daily Rainfall for the Indian Monsoon Region from Merged Satellite and Rain Gauge Values: Large-Scale Analysis from Real-Time Data. J. Hydrometeorol. 2003, 4, 769–781. [Google Scholar] [CrossRef]
  53. Fruehauf, G.; Halpern, P.; Lester, P. Objective analysis of a two dimensional scalar field by successive corrections using a personal computer. Environ. Softw. 1988, 3, 72–80. [Google Scholar] [CrossRef]
  54. Zhou, J.; Zhao, J. An Intercomparison between ERA-Interim Reanalysis and Observed Precipitation in Northeast China. Discret. Dyn. Nat. Soc. 2015, 2015, 693923. [Google Scholar] [CrossRef] [Green Version]
  55. Mateus, P.; Borma, L.S.; da Silva, R.D.; Nico, G.; Catalão, J. Assessment of two techniques to merge ground-based and TRMM rainfall measurements: A case study about Brazilian Amazon Rainforest. GIScience Remote Sens. 2016, 53, 689–706. [Google Scholar] [CrossRef]
  56. Xuan, D.H.; Hu, Q.; Wang, Y.; Yang, H.; Li, L.; Wang, L. Precipitation Characteristic Analysis of the Zhoushan Archipelago: From the View of MSWEP and Rainfall Merging. Water 2020, 12, 829. [Google Scholar] [CrossRef] [Green Version]
  57. Luo, Y.; Qian, W.; Zhang, R.; Zhang, D.L. Gridded Hourly Precipitation Analysis from High-Density Rain Gauge Network over the Yangtz… Huai Rivers Basin during the 2007 Mei-Yu Season and Comparison with CMORPH. J. Hydrometeorol. 2013, 14, 1243–1258. [Google Scholar] [CrossRef] [Green Version]
  58. Kumar, P.; Gairola, R.M.; Kubota, T.; Kishtawal, C.M. Hybrid Assimilation of Satellite Rainfall Product with High Density Gauge Network to Improve Daily Estimation: A Case of Karnataka, India. J. Meteorol. Soc. Jpn. 2021, 99, 741–763. [Google Scholar] [CrossRef]
  59. Hu, W.J.; Newell, R.E.; Wu, Z.X. Modes of variability of global sea-surface temperature, free atmosphere temperature and oceanic surface-energy flux. Clim. Dyn. 1994, 10, 377–393. [Google Scholar] [CrossRef]
  60. Polonskii, A.B.; Basharin, D.V. Large-scale patterns of eurasian surface meteorological fields influenced by the climate shift of 1976-1977. Russ. Meteorol. Hydrol. 2008, 33, 280–289. [Google Scholar] [CrossRef]
  61. Rao, A.R.; Hsieh, C.H. Empirical orthogonal function analysis of rainfall and runoff series. Water Resour. Manag. 1991, 4, 235–250. [Google Scholar] [CrossRef]
  62. Zveryaev, I.I.; Arkhipkin, A.V. Structure of climatic variability of the Mediterranean sea surface temperature. Part II. principal modes of variability. Russ. Meteorol. Hydrol. 2008, 33, 446–452. [Google Scholar] [CrossRef]
  63. Zveryaev, I.I.; Rudeva, I.A. Intraseasonal non-stationarity of the leading modes of atmospheric moisture over Europe during summer. Clim. Dyn. 2011, 36, 83–95. [Google Scholar] [CrossRef]
  64. Schneider, U.; Becker, A.; Finger, P.; Meyer-Christoffer, A.; Ziese, M.; Rudolf, B. GPCC’s new land surface precipitation climatology based on quality-controlled in situ data and its role in quantifying the global water cycle. Theor. Appl. Climatol. 2014, 115, 15–40. [Google Scholar] [CrossRef] [Green Version]
  65. Nounmusig, W. Analysis of rainfall in the eastern Thailand. Int. J. GEOMATE 2018, 14, 150–155. [Google Scholar] [CrossRef]
  66. Phien, H.N.; Arbhabhirama, A.; Sunchindah, A. Rainfall Distribution in Northeastern Thailand. Hydrol. Sci. J. 2009, 25, 167–182. [Google Scholar] [CrossRef]
  67. Loo, Y.Y.; Billa, L.; Singh, A. Effect of climate change on seasonal monsoon in Asia and its impact on the variability of monsoon rainfall in Southeast Asia. Geosci. Front. 2015, 6, 817–823. [Google Scholar] [CrossRef] [Green Version]
  68. Jhun, J.-G.; Lee, E.-J. A New East Asian Winter Monsoon Index and Associated Characteristics of the Winter Monsoon. J. Clim. 2004, 17, 711–726. [Google Scholar] [CrossRef]
  69. Brakenridge, G.R. DFO Flood Event 4432, Dartmouth Flood Observatory; University of Colorado: Boulder, CO, USA, 2017; Available online: https://floodobservatory.colorado.edu/Events/2017Thailand4432/2017Thailand4432.html (accessed on 18 April 2022).
  70. Manatsa, D.; Mukwada, G. Rainfall Mechanisms for the Dominant Rainfall Mode over Zimbabwe Relative to ENSO and/or IODZM. Sci. World J. 2012, 2012, 926310. [Google Scholar] [CrossRef] [Green Version]
  71. Park, C.-K.; Park, D.-S.R.; Ho, C.-H.; Park, T.-W.; Kim, J.; Jeong, S.; Kim, B.-M. A Dipole Mode of Spring Precipitation between Southern China and Southeast Asia Associated with the Eastern and Central Pacific Types of ENSO. J. Clim. 2020, 33, 10097–10111. [Google Scholar] [CrossRef]
  72. Liu, J.; Niyogi, D. Meta-analysis of urbanization impact on rainfall modification. Sci. Rep. 2019, 9, 7301. [Google Scholar] [CrossRef] [Green Version]
  73. Burian, S.J.; Shepherd, J.M. Effect of urbanization on the diurnal rainfall pattern in Houston. Hydrol. Processes 2005, 19, 1089–1103. [Google Scholar] [CrossRef]
  74. Liu, J.; Schlünzen, K.H.; Frisius, T.; Tian, Z. Effects of urbanization on precipitation in Beijing. Phys. Chem. Earth Parts A/B/C 2021, 122, 103005. [Google Scholar] [CrossRef]
  75. Picaut, J.; Hackert, E.; Busalacchi, A.J.; Murtugudde, R.; Lagerloef, G.S.E. Mechanisms of the 1997–1998 El Niño–La Niña, as inferred from space-based observations. J. Geophys. Res. Ocean. 2002, 107, 5-1–5-18. [Google Scholar] [CrossRef]
  76. Wen, C.; Graf, H.-F.; Ronghui, H. The interannual variability of East Asian Winter Monsoon and its relation to the summer monsoon. Adv. Atmos. Sci. 2000, 17, 48–60. [Google Scholar] [CrossRef]
  77. Levy, M.C.; Cohn, A.S.; Lopes, A.V.; Thompson, S.E. Addressing rainfall data selection uncertainty using connections between rainfall and streamflow. Sci. Rep. 2017, 7, 219. [Google Scholar] [CrossRef] [PubMed]
  78. Naumann, G.; Dutra, E.; Barbosa, P.M.; Pappenberger, F.; Wetterhall, F.; Vogt, J.V. Comparison of drought indicators derived from multiple data sets over Africa. Hydrol. Earth Syst. Sci. 2014, 18, 1625–1640. [Google Scholar] [CrossRef] [Green Version]
  79. Tarek, M.; Brissette, F.P.; Arsenault, R. Uncertainty of gridded precipitation and temperature reference datasets in climate change impact studies. Hydrol. Earth Syst. Sci. 2021, 25, 3331–3350. [Google Scholar] [CrossRef]
Figure 1. Distribution of rain gauge stations across Thailand. Locations in upper Thailand (black circles) and in southern Thailand (black rectangles), superimposed on the terrain elevation (shaded areas) obtained from the 1−Arc Minute Global Relief Model (ETOPO1).
Water 14 01359 g001
Figure 2. Spatial distribution of summer rainfall climatology averaged over 1970–2007 based on (a) TMDstn, (b) TMDgrd, (c) APHRO, (d) CRU, and (e) GPCC. Black circles in (a) represent 69 TMD station locations used for TMDgrd.
Water 14 01359 g002
Figure 3. Spatial distribution of winter rainfall climatology averaged over 1970–2007 period based on (a) TMDstn, (b) TMDgrd, (c) APHRO, (d) CRU, and (e) GPCC. Black circles in (a) represent 69 TMD station locations used for TMDgrd.
Water 14 01359 g003
Figure 4. Spatial distribution of summer rainfall standard deviation (SD) during 1970–2007 period over Thailand based on (a) TMDstn, (b) TMDgrd, (c) APRHO, (d) CRU, and (e) GPCC. Black circles in (a) represent 69 TMD station locations used for TMDgrd.
Water 14 01359 g004
Figure 5. Spatial pattern of standard deviation (SD) of winter rainfall during the 1970–2007 period over Thailand based on (a) TMDstn, (b) TMDgrd, (c) APHRO, (d) CRU, and (e) GPCC. Black circles in (a) represent 69 TMD station locations used for TMDgrd.
Water 14 01359 g005
Figure 6. The first three EOF modes (EOF−1, the top panels (ae); EOF−2, the middle panels (fj); EOF−3, the bottom panels (ko)) of JJA rainfall over 1970–2007 based on TMDstn along with its corresponding EOFs based on the gridded datasets. Percentage values in parentheses are the explained variance of the modes.
Water 14 01359 g006
Figure 7. The corresponding PC time series of the first three EOF modes of the observed rainfall datasets for JJA. Numbers in parenthesis are correlation coefficients (TCC) between TMDstn and the gridded data (i.e., TMDgrd, APHRO, CRU, and GPCC, respectively). The second Y-axis (red color) is common for all gridded datasets.
Water 14 01359 g007
Figure 8. (a) The first mode (EOF−1) of summer rainfall based on the TMDstn, (bd) the second mode of the gridded datasets, APHRO, CRU, and GPCC, respectively, along with (e) their corresponding PC time series. Percentage values in (ad) are the explained variance of the modes and numbers in parenthesis in (e) are correlation coefficients (TCC) between TMDstn’s PC−1 and PC−2 of APHRO, CRU, and GPCC, respectively.
Water 14 01359 g008
Figure 9. (a) The second mode (EOF−2) of summer rainfall based on the TMDstn. (bd) The second mode of the gridded datasets, APHRO, CRU, and GPCC, respectively, along with (e) their corresponding PC time series. Percentage values in (ad) are the explained variance of the modes and numbers in parenthesis in (e) are correlation coefficients (TCC) between TMDstn’s PC−1 and PC−2 of APHRO, CRU, and GPCC, respectively.
Water 14 01359 g009
Figure 10. The first three EOF modes (EOF−1, the top panels (ae); EOF−2, the middle panels (fj); EOF−3, the bottom panels (ko)) of winter rainfall over the 1970–2007 period based on the TMDstn data along with the corresponding EOFs estimated by the gridded datasets. Percentage values in parentheses are the explained variance.
Water 14 01359 g010
Figure 11. The corresponding PC time series of the first three EOF modes of the observed rainfall datasets for the DJF season. Numbers in parenthesis are correlation coefficients (TCC) between TMDstn and the gridded data (i.e., TMDgrd, APHRO, CRU, and GPCC, respectively). Second Y-axis (red color) is common for all gridded datasets.
Water 14 01359 g011
Table 1. Description of rainfall datasets used in this study.
DescriptionDataset
TMDstn *APHROCRUGPCC
Temporal coverage1970–20071951–20151901–20201891–2019
Spatial resolution 0.5°0.5°0.5°
Temporal resolutionDailyDailyMonthlyMonthly
* The daily TMD data were used to construct a 0.5° monthly gridded rainfall (TMDgrd) and used as supplementary data to compare the performance of other gridded datasets. Details of constructing TMDgrd are briefly described in Section 2.3.
Table 2. Temporal correlation coefficients (TCC) between PC time series of TMDstn and its corresponding PC given by the gridded rainfall.
SeasonPC Based on TMDstnTMDgrdAPHROCRUGPCC
JJAPC-10.900.180.270.49
PC-20.670.160.570.59
PC-30.550.150.030.06
DJFPC-10.990.940.950.99
PC-20.980.850.900.97
PC-30.550.150.370.90
Publisher’s Note: MDPI stays neutral with regard to jurisdictional claims in published maps and institutional affiliations.

