Article

Removal of P-Nitrophenol by Nano Zero Valent Iron-Cobalt and Activated Persulfate Supported onto Activated Carbon

1
School of Environmental Engineering, Xuzhou University of Technology, Xuzhou 221-111, China
2
College of Energy and Environmental Engineering, Hebei University of Engineering, Handan 056-038, China
*
Author to whom correspondence should be addressed.
Water 2022, 14(9), 1387; https://doi.org/10.3390/w14091387
Submission received: 15 March 2022 / Revised: 21 April 2022 / Accepted: 22 April 2022 / Published: 25 April 2022
(This article belongs to the Section Wastewater Treatment and Reuse)

Abstract

:
P-nitrophenol (PNP), a highly toxic carcinogen, is very stable due to its benzene structure. Advanced oxidation technology is becoming the main means for degrading it. A nano iron-cobalt (Co-nZVI) catalyst, supported by granular activated carbon (GAC), was prepared using liquid-phase reduction, and sodium persulfate’s (PS’s) potential to degrade PNP was studied. The Co-nZVI/GAC nanocomposites were classified, and effects of PS dosage, Co-nZVI/GAC dosage, material system type, PNP concentration, initial pH, and material reuse rate on the reaction were investigated. Activated carbon successfully supported iron and cobalt. At 1 mmol/L of PS, the maximum PNP degradation rate was 99.19%, which was unachievable at other dosages. With only Co-nZVI/GAC present, the rate was 69.8%; with activated persulfate present, it increased to 99.19%. The activated PS system was relatively stable under acidic conditions. Catalysis was induced by adding Co-nZVI/GAC (1.5 g/L). When added four times, the catalytic rate was 57%. Liquid chromatography–mass spectrometry (LC-MS) showed that PNP degradation involves the transfer of PNP to p-benzoquinone (PBQ), the main activators being iron(II) and iron(III) and the key active substances being sulfate (SO42−) and hydroxide (·OH). In conclusion, Co-nZVI/GAC-activated PS effectively removes PNP.

1. Introduction

In the 21st century, countries worldwide have paid increasing attention to organic pollutants in water. P-nitrophenol (PNP) is the most common phenolic aromatic compound. It is soluble in organic solvents, such as water and ethanol. It is widely used in natural gas, the chemical industry, medicine, printing and dyeing, tanning, production of explosives, organic pesticides [1,2,3,4], and other fields. However, due to the stable structure of the benzene ring and the conjugation between the benzene ring and p-nitro and hydroxyl groups, PNP is highly toxic and difficult to degrade [5,6]. Even at low concentrations in water, PNP exhibits considerable toxicity, which can cause severe damage to the health of organisms [7] and influence water odor. [8]. When PNP concentration in drinking water reaches 0.002 mg/L, it is harmful to the human body, as drinking water containing phenolic compounds can result in poisoning. When the concentration increases, it can damage the circulatory system, respiratory system [9,10], and even lead to cancer [11] or death [12]. According to the National Bureau of Statistics report, 5432.25 tons per 70 billion tons of industrial wastewater in China have been polluted by volatile phenolic compounds since 2007 [13]. Globally, 10 million tons of such sewage has to be degraded each year. Therefore, finding a safe, efficient, and stable method for removing PNP is essential.
Advanced oxidation is one of the most effective methods for removing refractory organic pollutants. Compared to ·OH, persulfate’s advanced oxidation process has a higher voltage reduction (2.5–3.1 V), longer half-life [14], stronger electronic control forces, and higher solution stability [15]. Figure 1 lists the redox potentials of different substances [14,16,17]. The mechanism of this process involves the activation of PS by the motion of a single electron. When the transition metal ions silver, copper, iron, zinc, cobalt, and manganese exist in water, they activate PS and generate SO4•− [18]. Nano zero valent iron (nZVI) is an efficient catalyst, and the mechanism by which it activates PS is as follows [19]:
Fe0 + S2O82− → Fe2+ + 2SO42−
S2O82− + Fe2+ → SO42− + SO4•− + Fe3+
SO4•− + Fe3+ → SO42− + Fe2+
SO4•− + Fe2+ → Fe3+ + SO42−
nZVI is an iron particle of about 1–100 nm in diameter. It has the advantages of a high reduction rate, high adsorption capacity, large specific surface area, and efficient recovery. Although nZVI is useful in removing perchlorate, nitrate, dyes, and heavy metal ions from solution, its use also carries several disadvantages. Due to their high activity and high specific surface area, nZVI particles easily aggregate. nZVI is also easily oxidized in air and corroded in solution, reducing its activity [20]. When corroded in solution, the iron oxide layer around it affects the contact surface and electron movement efficiency, thus reducing its ability to remove target pollutants. In addition, Elliott [21] found that nZVI can be toxic to the environment. Therefore, finding ways of modifying nZVI to improve its ability to purify pollutants and to reduce its damaging effects on the environment is necessary. Methods of measuring mainly include the support method, bimetallic method, and surface-modification method. In this paper, the bimetallic method is used together with Co and nZVI. Both methods can increase its potential to activate the materials, slow down material oxidation, and increase the effectiveness of the catalytic pathways [22]. Co-nZVI has been found to support activated carbon in an acidic solution. PS is then activated by Co-nZVI/GAC to produce SO4•−, allowing us to study the pollutant surface, main degradation pathways, and main factors influencing the degradation of PNP.

2. Material and Methods

2.1. Reagents and Materials

The supported activated carbon particles were vibrated in a 5% HCl solution for 24 h. They were then washed with deionized water and dried in an oven at 105 °C. Two grams of iron(II) sulfate (FeSO4·7H2O) was then dissolved in deionized water. Thereafter, 0.05 g of polyethylene glycol was dissolved in a 50% (V/V) ethanol solution. Three grams of activated carbon particles were then added to the solution, and the solution underwent ultrasonic vibration for 2 h (until they were thoroughly mixed). The mixture was then transferred into a three-neck flask under nitrogen. While stirring the mixture, 0.3 mol/L of NaBH4 was slowly added before stirring for another 30 min. Subsequently, the mixture was cleaned with oxygen-free deionized water and absolute ethanol, three times each, and a cobalt-chloride solution (with 0.4% of chloride by weight) was added to the solution. After stirring the solution for another 30 min (until it was fully activated), a magnet was placed under the flask to separate the supported particles from the liquid. The liquid was then washed thrice with oxygen-free deionized water and absolute ethanol, and the particles were dried in a vacuum oven at 75 °C, leaving behind Co-nZVI/GAC. The equipment is shown in Figure 2.

2.2. Pre Experiment and Batch Experiments

The experiment was carried out in a brown bottle with an action speed of 150 rpm/min and a temperature of 25 ± 1 °C. Co-nZVI/GAC and PS were added, and activation was initiated. The pH of aqueous solution was adjusted with 0.01 M H2SO4/NaOH solution. In the influence test of sodium persulfate dosage, add 500 mL 15 mg/L PNP solution and 1.5 g/L Co-nZVI/GAC into the reagent bottle, then add 0 mol/L, 0.001 mol/L, 0.002 mol/L, 0.003 mol/L, 0.004 mol/L, and 0.005 mol/L PS, respectively. In the test of the influence of Co-nZVI/GAC dosage, add 500 mL 15 mg/L PNP solution into the reagent bottle with the dosage of 1 mmol/L PS; and add 0.5g/L, 1 g/L, 1.5 g/L, 2 g/L, and 2.5 g/L Co-nZVI/GAC, respectively. In the test of the Influence of different materials, add 500 mL 15 mg/L PNP solution into the reagent bottle and adjust the initial pH to 6. Add 1.5 g/L nZVI, 1.5 g/L Co-nZVI/GAC, 1.5 g/L Co-nZVI + 1 mmol/L PS, 1 mmol/L PS, 2 mmol/L PS, and 3 mmol/L PS, respectively. In the tests of different initial effects, the dosage of PS is 1 mmol/L and 1.5 g/L Co-nZVI/GAC. Then, 500 mL PNP solutions of 5 mg/L, 10 mg/L, 15 mg/L, 20 mg/L, and 25 mg/L are added to the reagent bottle respectively. In the test of different pH effects, add 500 mL 15 mg/L PNP solution into the bottle; the dosage of PS is 1 mmol/L, and the dosage of Co-nZVI/GAC is 1.5 g/L. Adjust the initial pH value of one person to 2, 4, 6, 8, and 10, respectively. A portion of the solution was filtered out using a 0.45 µ water filter membrane and was transferred to a test tube for UV spectrophotometry. The parameters Kobs (h−1) and R2 were obtained using a pseudo first-order reaction, and the reaction rates related to all the parameters are described by Equation (5) [23]:
Ln(C/C0) = −Kobst,
where:
t represents reaction time.
Kobs represents the reaction rate.
C represent the reaction concentration.
C0 represents the initial reaction concentration.
The absorption-dynamics equation between PNP and PS-activated Co-nZVI/GAC was approximated using first- and second-order dynamics equations (Equations (6) and (7)):
q t = q e ( 1 e k 1 t ) .
q t = t k 2 q e 2 1 + q e t k 2
where:
qt and qe are the adsorption capacities at time t and equilibrium, respectively.
k1 is the first-order rate constant.
k2 is the second-order rate constant.

2.3. Analytical Method

For analysis of wide angles (5–90°), the crystal phase and crystallinity were analyzed using an X-ray diffractometer (XRD, D8 ADVANCED, Karlsruhe, Germany). The composition, content in solution, chemical state, and molecular structure of the compounds were analyzed using X-ray photoelectron spectroscopy (XPS, ESCALAB 250XI, Waltham, MA, USA), while the iron content at different positions was analyzed using scanning electron microscopy (SEM-EDS, QUANTA250/QUANTA430, FEI, Hillsboro, OR, USA). The nitrogen adsorption–desorption method was used to measure the specific surface area and pore size distribution. The pore size distribution measurement was carried out using the Barrett–Joyner–Halenda (BJH) method. The specific surface area measurement of Co-nZVI/GAC was analyzed using the Brunauer–Emmett–Teller (BET) model. Both tests were conducted using a Kubo-X1000 automatic analyzer (Beijing bio Electronic Technology Co., Ltd., Beijing, China). Changes in the functional groups of the materials were measured using a Fourier infrared spectrometer (Nicolet IS10, Waltham, MA, USA), while the activation mechanism, intermediate substances in the activation process, and the degradation pathway of PNP were analyzed using liquid chromatography–mass spectrometry (LC-MS, 2695, Milford, MA, USA).

3. Results and Discussion

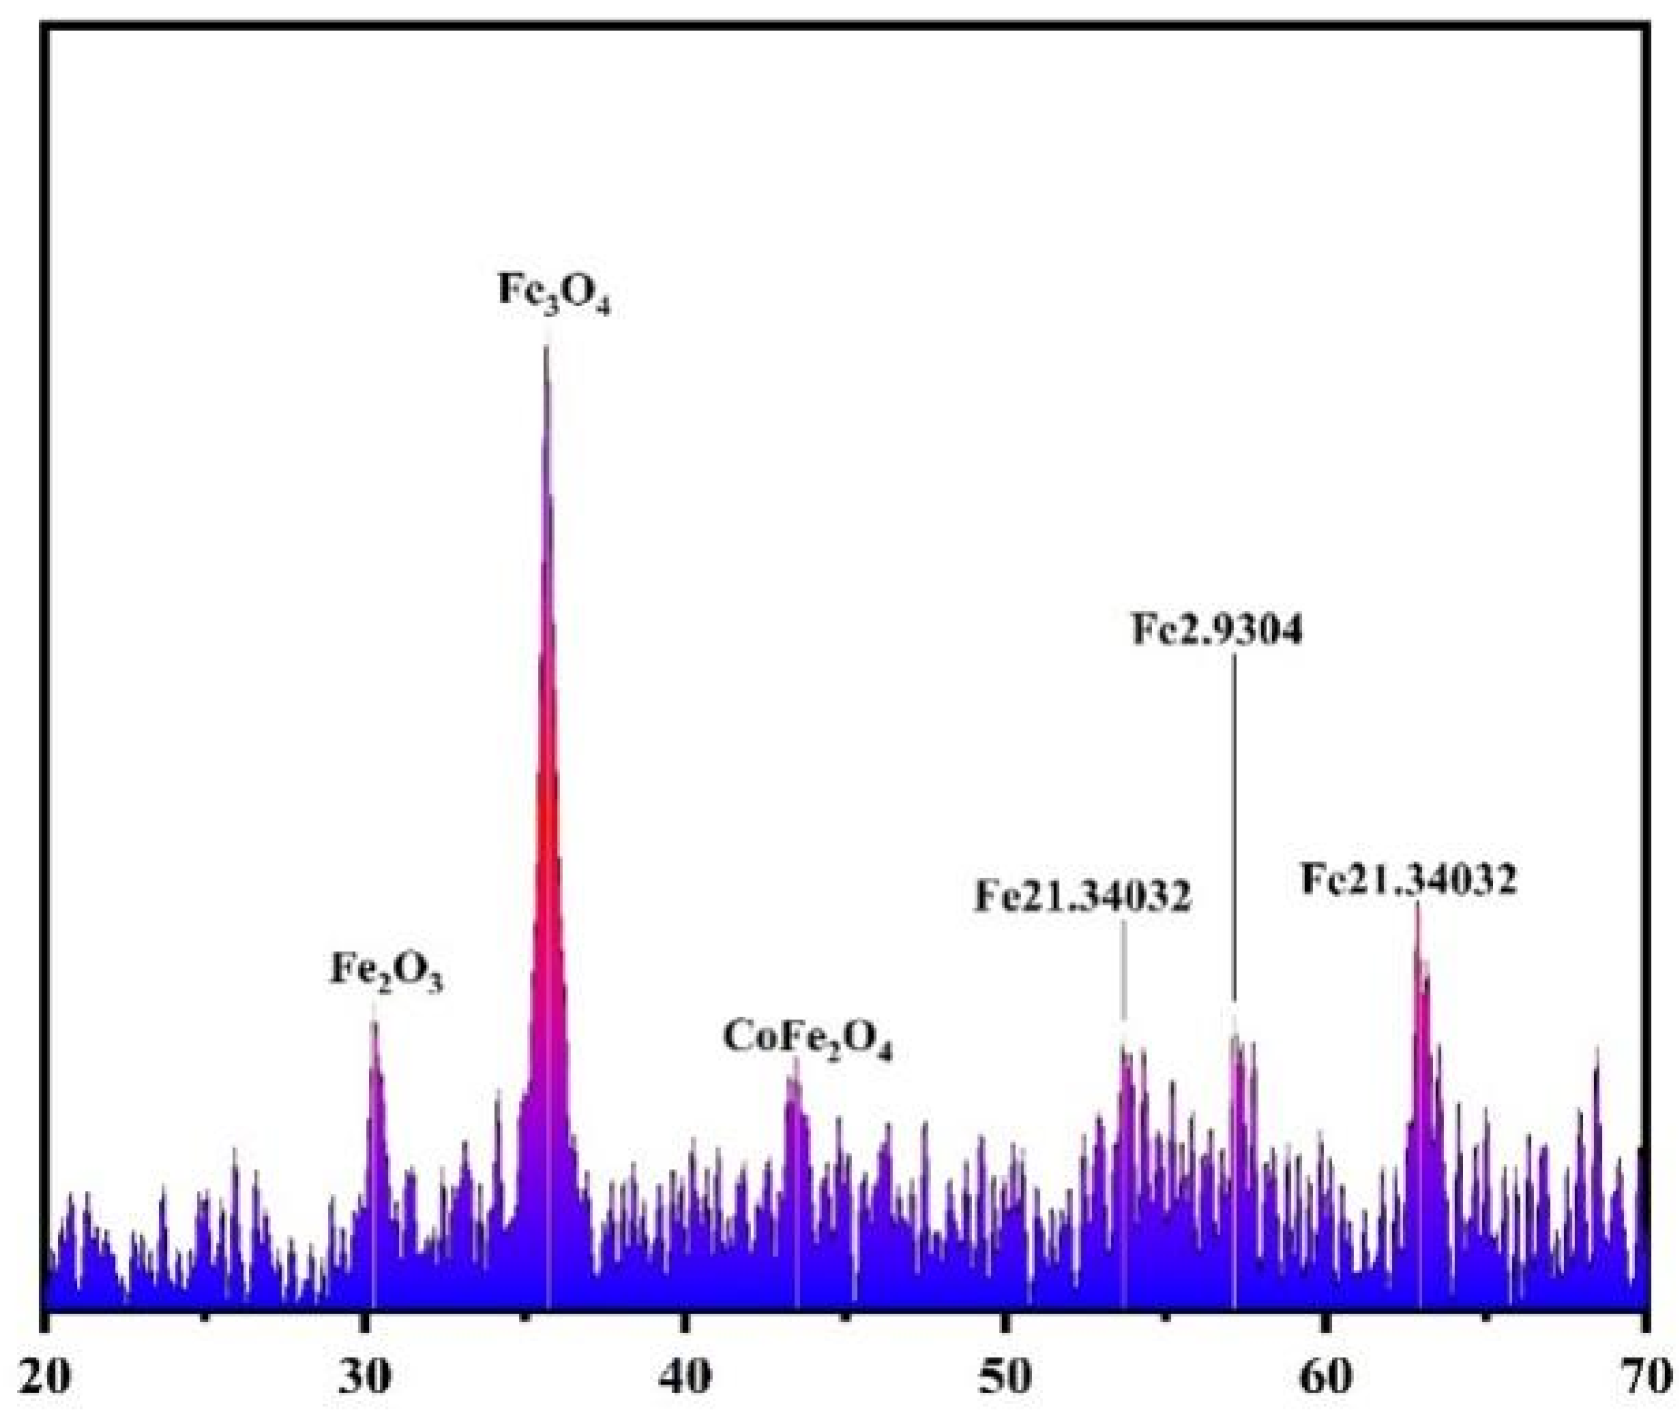
3.1. Characterization of Co-nZVI/GAC Composite

Figure 3 is the SEM output of Co-nZVI/GAC before activation. Panels a–d are SEM of Co-nZVI/GAC at different magnification. The SEM output shows that the activated carbon channels are wide and evenly distributed, thereby making them suitable for supporting nano iron or cobalt (d). Black particles on tracks were zero-valent nano iron, while the smaller particles on the nano iron were nano cobalt, which were globular, of clear outline, and evenly distributed (c). The SEM further revealed that nano iron initially occurred in chains and was oversized. This is because nano iron is magnetic and has an electronic absorption capacity. Therefore, nano iron particles were unevenly distributed and were of a relatively larger size (b). After being supported by activated carbon, the nano iron was of higher distribution and lower union such that the specific surface area and catalytic performance are increased [24]. Figure 4 shows the EDS spectrum of Co-nZVI/GAC at different positions. The iron content was 64.93%, 63.62%, and 59.72%, which was theoretically close to 60%. Iron near 0.5 eV was oxidized due to contact with air during use and during transfer.
Figure 5 shows the XRD spectrum analysis output of Co-nZVI/GAC. In the figure, the diffraction peaks at 2θ are 30.3°, 35.7°, 43.4°, 53.6°, 57.1°, and 62.8° and shows that Co-nZVI is successfully supported by activated carbon. Iron was oxidized mostly during handling, separating, and drying the material and test process. Figure 6 shows the XPS spectrum before activation (A) and after activation (B), the Fe 2p narrow-scan spectrum before activation (C) and after activation (D), and the Co narrow-scan spectrum before activation (E) and after activation (F). In (A) and (B), the characteristic peaks of iron and cobalt indicate that the activated carbon successfully supported the nano iron and nano cobalt [25]. The difference before and after activation was also highlighted. The zero-valent iron had disappeared, which was possible because iron was oxidized to its +2 or +3 oxidative state. From (C) and (D), before activation, the 726.53 eV highlights evidence of oxidation of iron to Fe3+ [26] and 724.08 eV highlights evidence of oxidation of iron to Fe2+ [26], and these results were consistent with the XRD diffraction spectrum [27]. The peaks had decreased or increased after activation because Co-nZVI/GAC had been oxidized. Based on (E) and (F), Co-nZVI/GAC supported Co during activation and generated Co2+.
Table 1 shows the specific surface area, aperture, and pore volume list for four materials. The specific surface area of nZVI was 97.25 m2·g−1, and the pore diameter was 1.12 nm. The specific surface area of Co-nZVI was 51.85 m2·g−1, and the pore diameter was 1.10 nm. The specific surface area and pore diameter decreased by 46.68% and from 1.12 nm to 1.10 nm, respectively. Co was absorbed into pores of the nano iron, combing the two metals. The specific surface area of GAC was 557.12 m2·g−1, and the pore diameter was 1.02 nm; the specific surface area of Co-nZVI/GAC was 482.61 m2·g−1, and the pore diameter was 1.01 nm. The specific surface area decreased by 13.38% because Co-nZVI had absorbed into the pores of the activated carbon and changed the structure of the pores. Thus, the results demonstrated that Co-nZVI was successfully supported by the activated carbon.
Figure 7 is the Fourier transform infrared spectrum of nZVI, GAC, and Co-nZVI/GAC. The characteristic absorption peak at approximately 3405 cm−1 was N-H’s and O-H’s tensile vibration absorption peak from the GAC surface functional group [28]. Based on a comparison between the Co-nZVI/GAC and GAC curves, the characteristic peak at approximately 3444 cm−1 extended close to 3405 cm−1, having a greater width and thickness. This change may be because the coordination reaction between iron and nitrogen at the amine (-NH2) group in GAC leads to the stretching and vibration of N-H [29]. The asymmetric vibration absorption peak of Co-nZVI/GAC was approximately 1636 cm−1 of the carboxyl (-COOC-) functional group. The characteristic peak [30] of C-H near 1130 cm−1 in Co-nZVI/GAC was more potent than that of GAC. Compared to GAC, the absorption peak is approximately 792 cm−1 and may be related to hydroxyl vibration at 889 cm−1 [31]. From this, GAC and Co-nZVI were implied to be combined successfully.

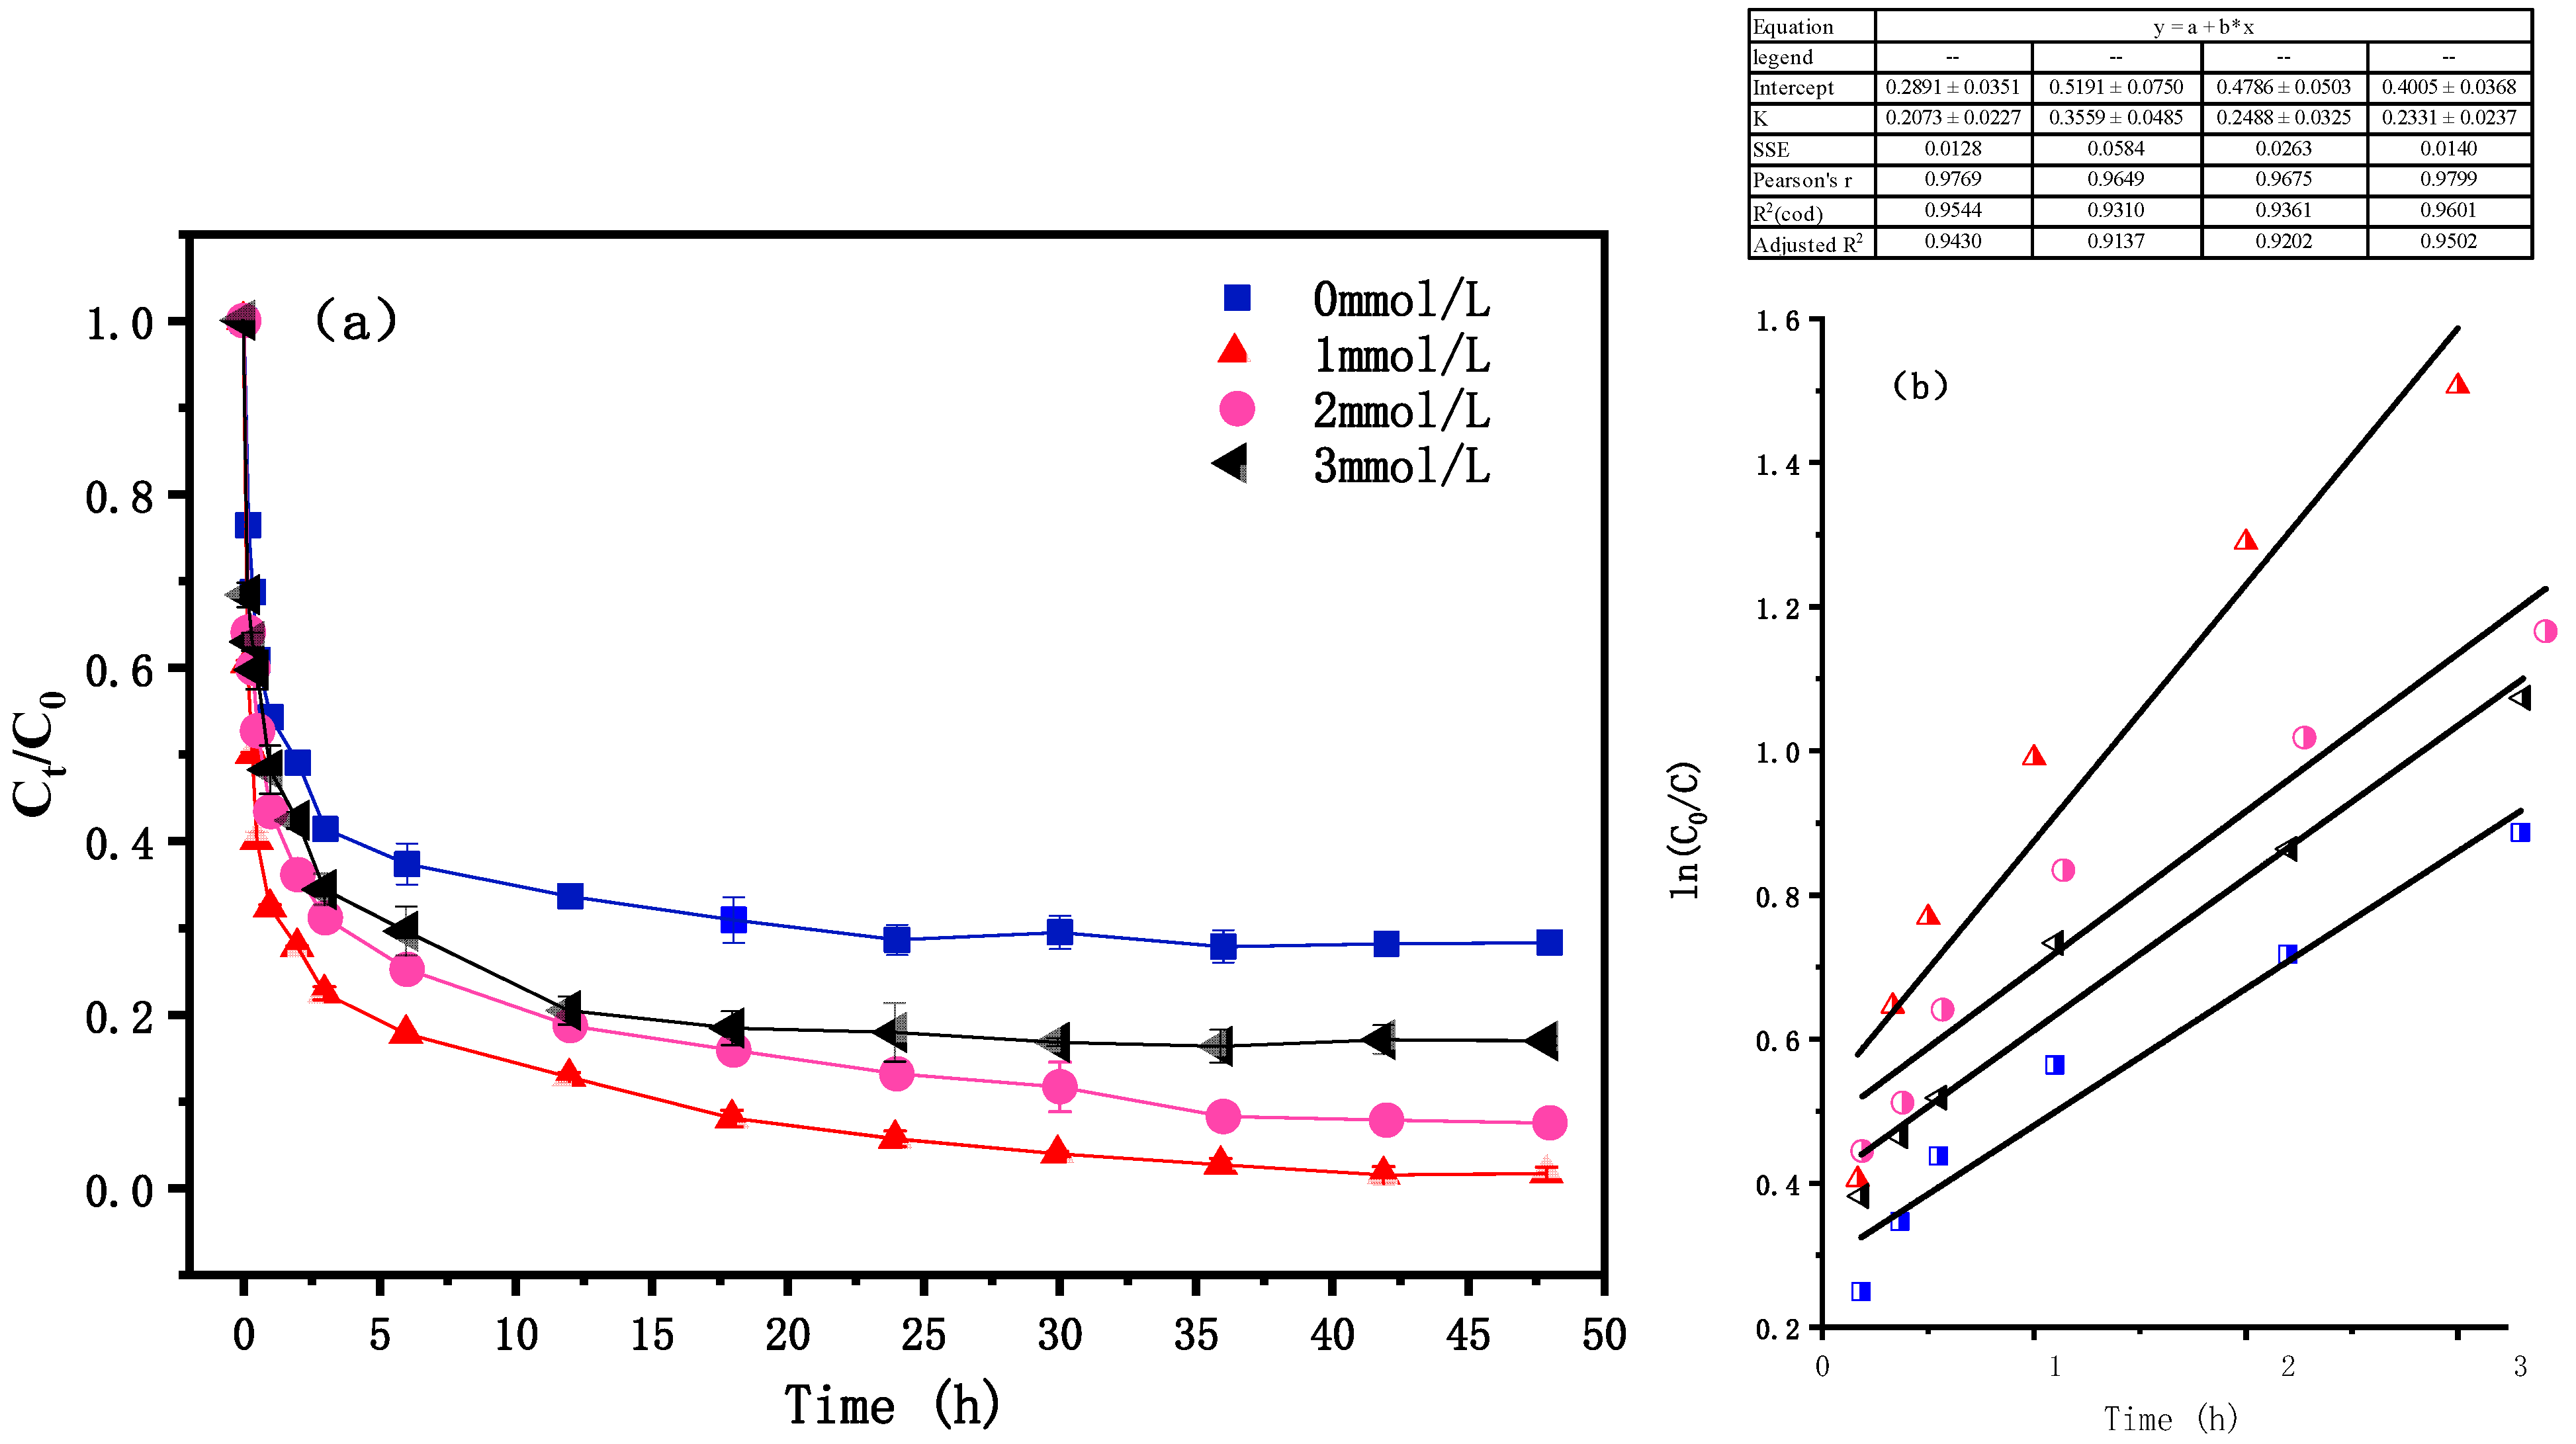
3.2. Effect of PS Concentration

Figure 8 shows the effect of PS on the PNP degradation rate. According to the degradation rate of PNP from high to low, the concentration of PS was 1 mmol/L > 2 mmol/L > 3 mmol/L > 0 mmol/L. When the concentration was 0 mmol/L, the degradation rate after 48 h was only 69.8%. When the concentration was increased to 1 mmol/L, the degradation rate after 48 h increased to 99.99%. Because of the higher concentration of PS, more reactive oxygen species were produced per unit time, increasing the degradation efficiency of the system. However, when the concentration was increased to 2 mmol/L or 3 mmol/L, the degradation rates were 92.43% and 82.43%, respectively, which was relatively lower than at 1 mmol/L. This may be because, when the concentration of PS is very high, the reaction progresses much quicker, resulting in the accumulation of free radicals. In other words, a large amount of SO4•− will undergo a self-quenching reaction to produce S2O82−. The S2O82− then reacts with excess SO4•− to produce S2O8•−, resulting in homologous quenching of SO4•−, thus reducing the utilization efficiency of PS [32]. As the optimal concentration of PS is 1 mmol/ L, this data will be applied to subsequent experiments. An interesting phenomenon is that at a PS dosage of 0 mmol/L, after the reaction, the solution pH was increased from 6 to 7.8. This may have been due to the release of a small amount of ·OH during the reaction.

3.3. Effect of Co-nZVI/GAC Dosage

Figure 9 shows the effect of Co-nZVI/GAC on the PNP degradation rate and the linear fitting. The PNP degradation rate increased with an increase in the concentration of Co-nZVI/GAC. When the concentration of Co-nZVI/GAC was low, the degradation rate of PNP was 76.67% because the common concentration catalyst could not provide a sufficient activation energy. When the Co-nZVI/GAC concentration increased to 2.0 g/L or 2.5 g/L, the PNP degradation rate was 100% efficient because more S2O82− were transferred to SO4•−. Although both concentrations could reach 100% of PNP degradation, the latter could increase the generation of SO4•− and, therefore, accelerate the PNP degradation rate. When the Co-nZVI/GAC concentration was about 2.5 g/L, the degradation rate was 99.13% after 6 h. This was because the increased Co-nZVI/GAC dosage increased the number of active sites in the system, thereby increasing the number of active oxidation species produced by activated PS and, ultimately, increasing the degradation efficiency. However, increasing the dosage of materials did not entirely remove pollutants. This was because the concentration of PS in the system is the limiting factor—too much input of activated materials will lead to the wasting of active sites and poor material utilization.

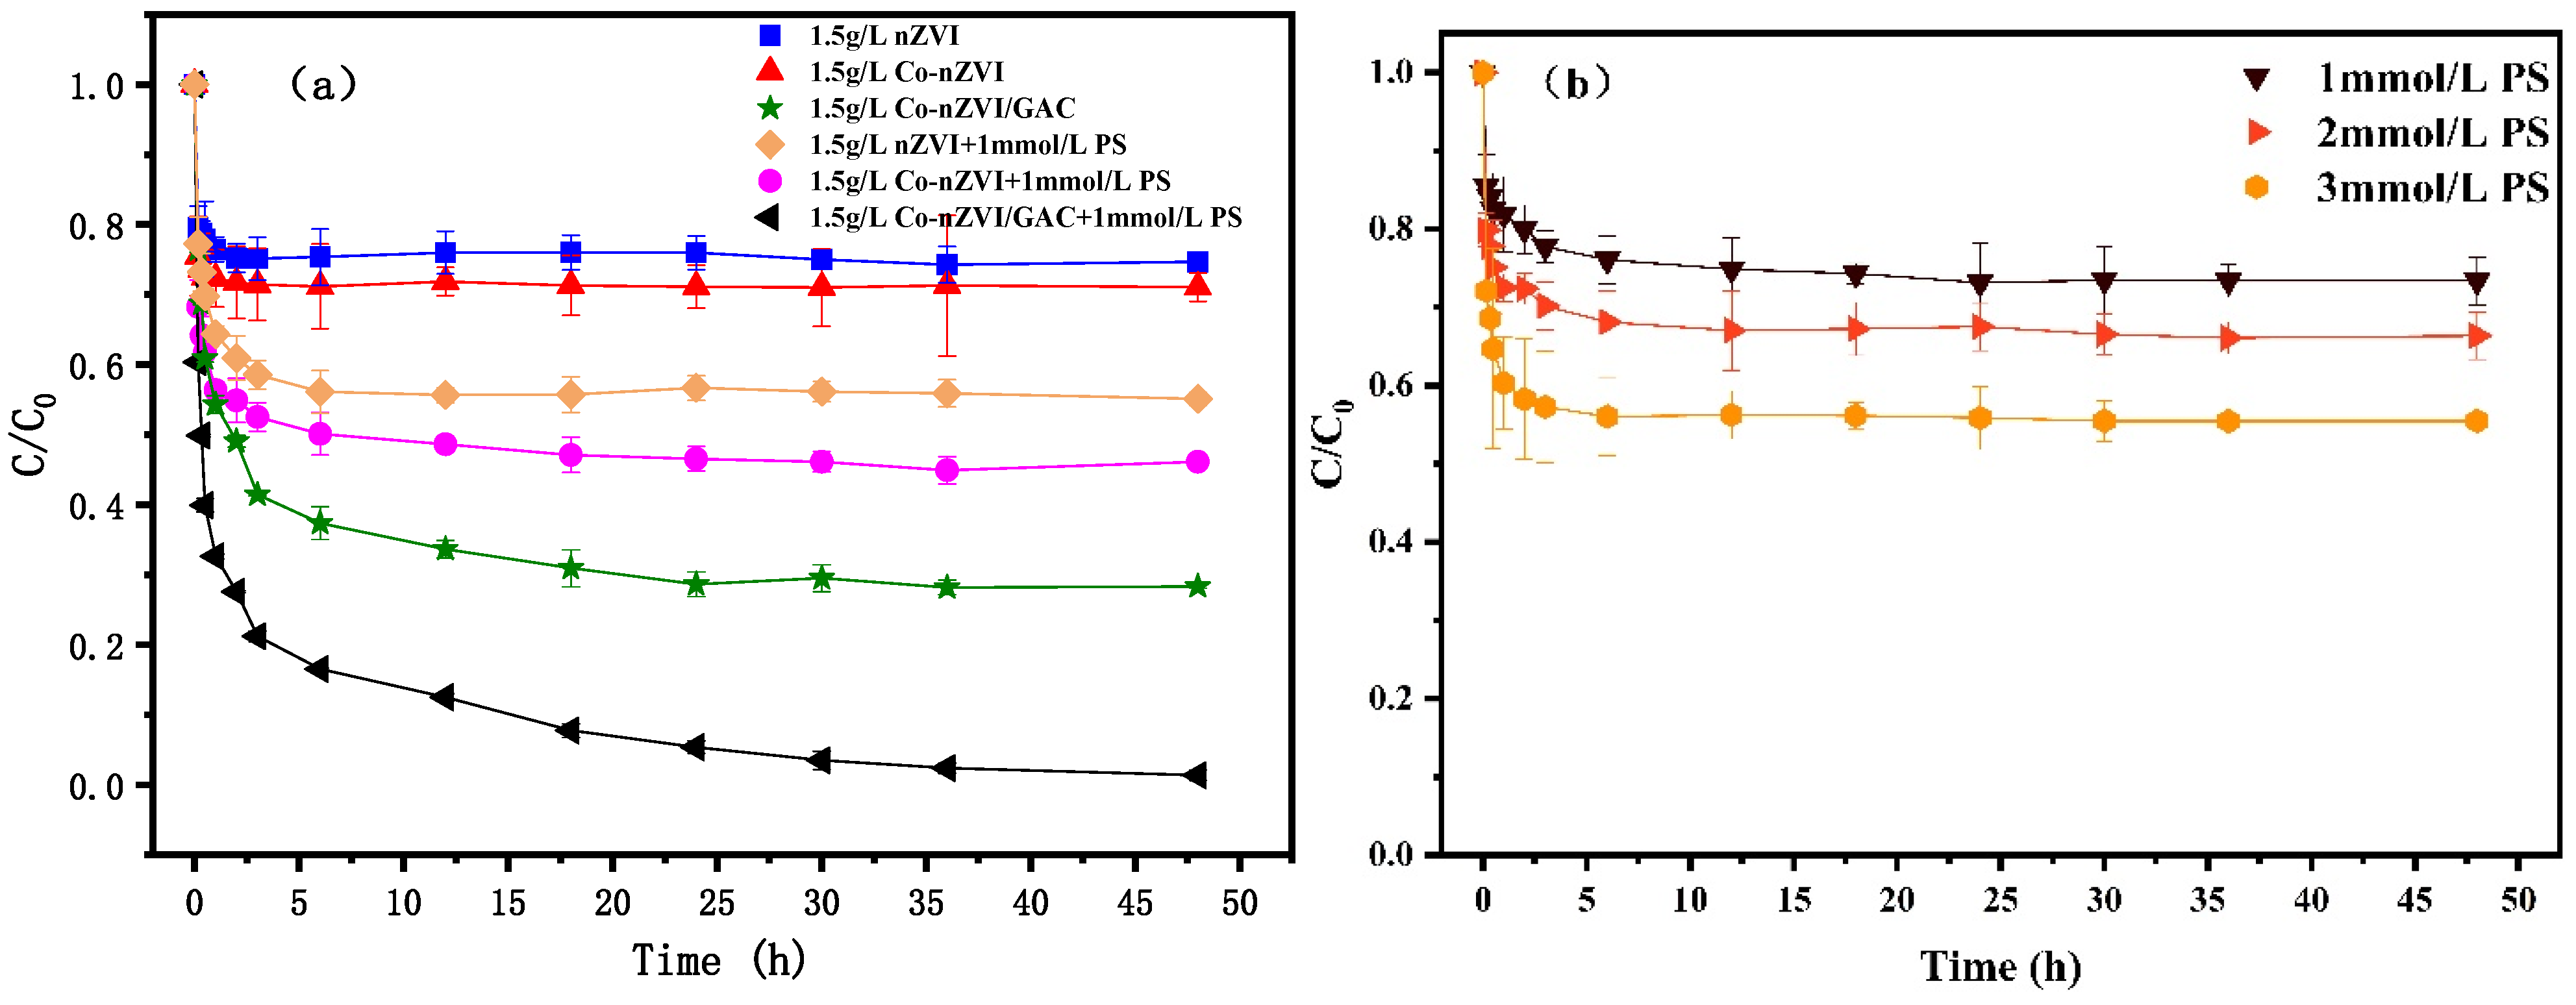
3.4. Effect of Different Material System

Figure 10 shows the PNP degradation rate for different material systems and the linear fitting. From the figure, the PNP degradation potential from the highest to lowest were as follows: Co-nZVI/GAC + PS > Co-nZVI/GAC > Co-nZVI + PS > nZVI + PS > 3 mmol/L PS > 2 mmol PS/L > 1 mmol/L PS > Co-nZVI > nZVI (a). Without PS, nZVI had a PNP degradation rate of 19.2% because the nZVI was easily oxidized and agglomerated. Co-nZVI was slightly increased to 23.13% because the cobalt had oxidized, while the two metals had higher degrees of oxidation. This, however, did not avoid the agglomeration of nZVI. The degradation rate of PNP by Co-nZVI/GAC reached up to 69.8%. When PS was added, the degradation rate of PNP was increased by up to 40.06% (3 mmol/L). When PS was activated using nZVI, the degradation rate could be increased from 20.66% to 40.53% (b). This was because nano iron could be used as catalysts to activate sulfate in PS. However, due to the existence of nano iron, sulfate was insufficient. When the nano iron and cobalt material was used as the catalyst, the degradation rate was 50.33%, with cobalt having a higher oxidizing power. However, the large amount of cobalt present in the synthesis process would block pores on the catalyst surface. Only a tiny amount of CoFe2O4 [33] was generated and, therefore, cannot function efficiently. When Co-nZVI/GAC was used as the catalyst, the degradation rate of PNP reached up to 99.10% because the activated carbon could support nZVI, which would reduce binding and oxidation and generate SO4•−.

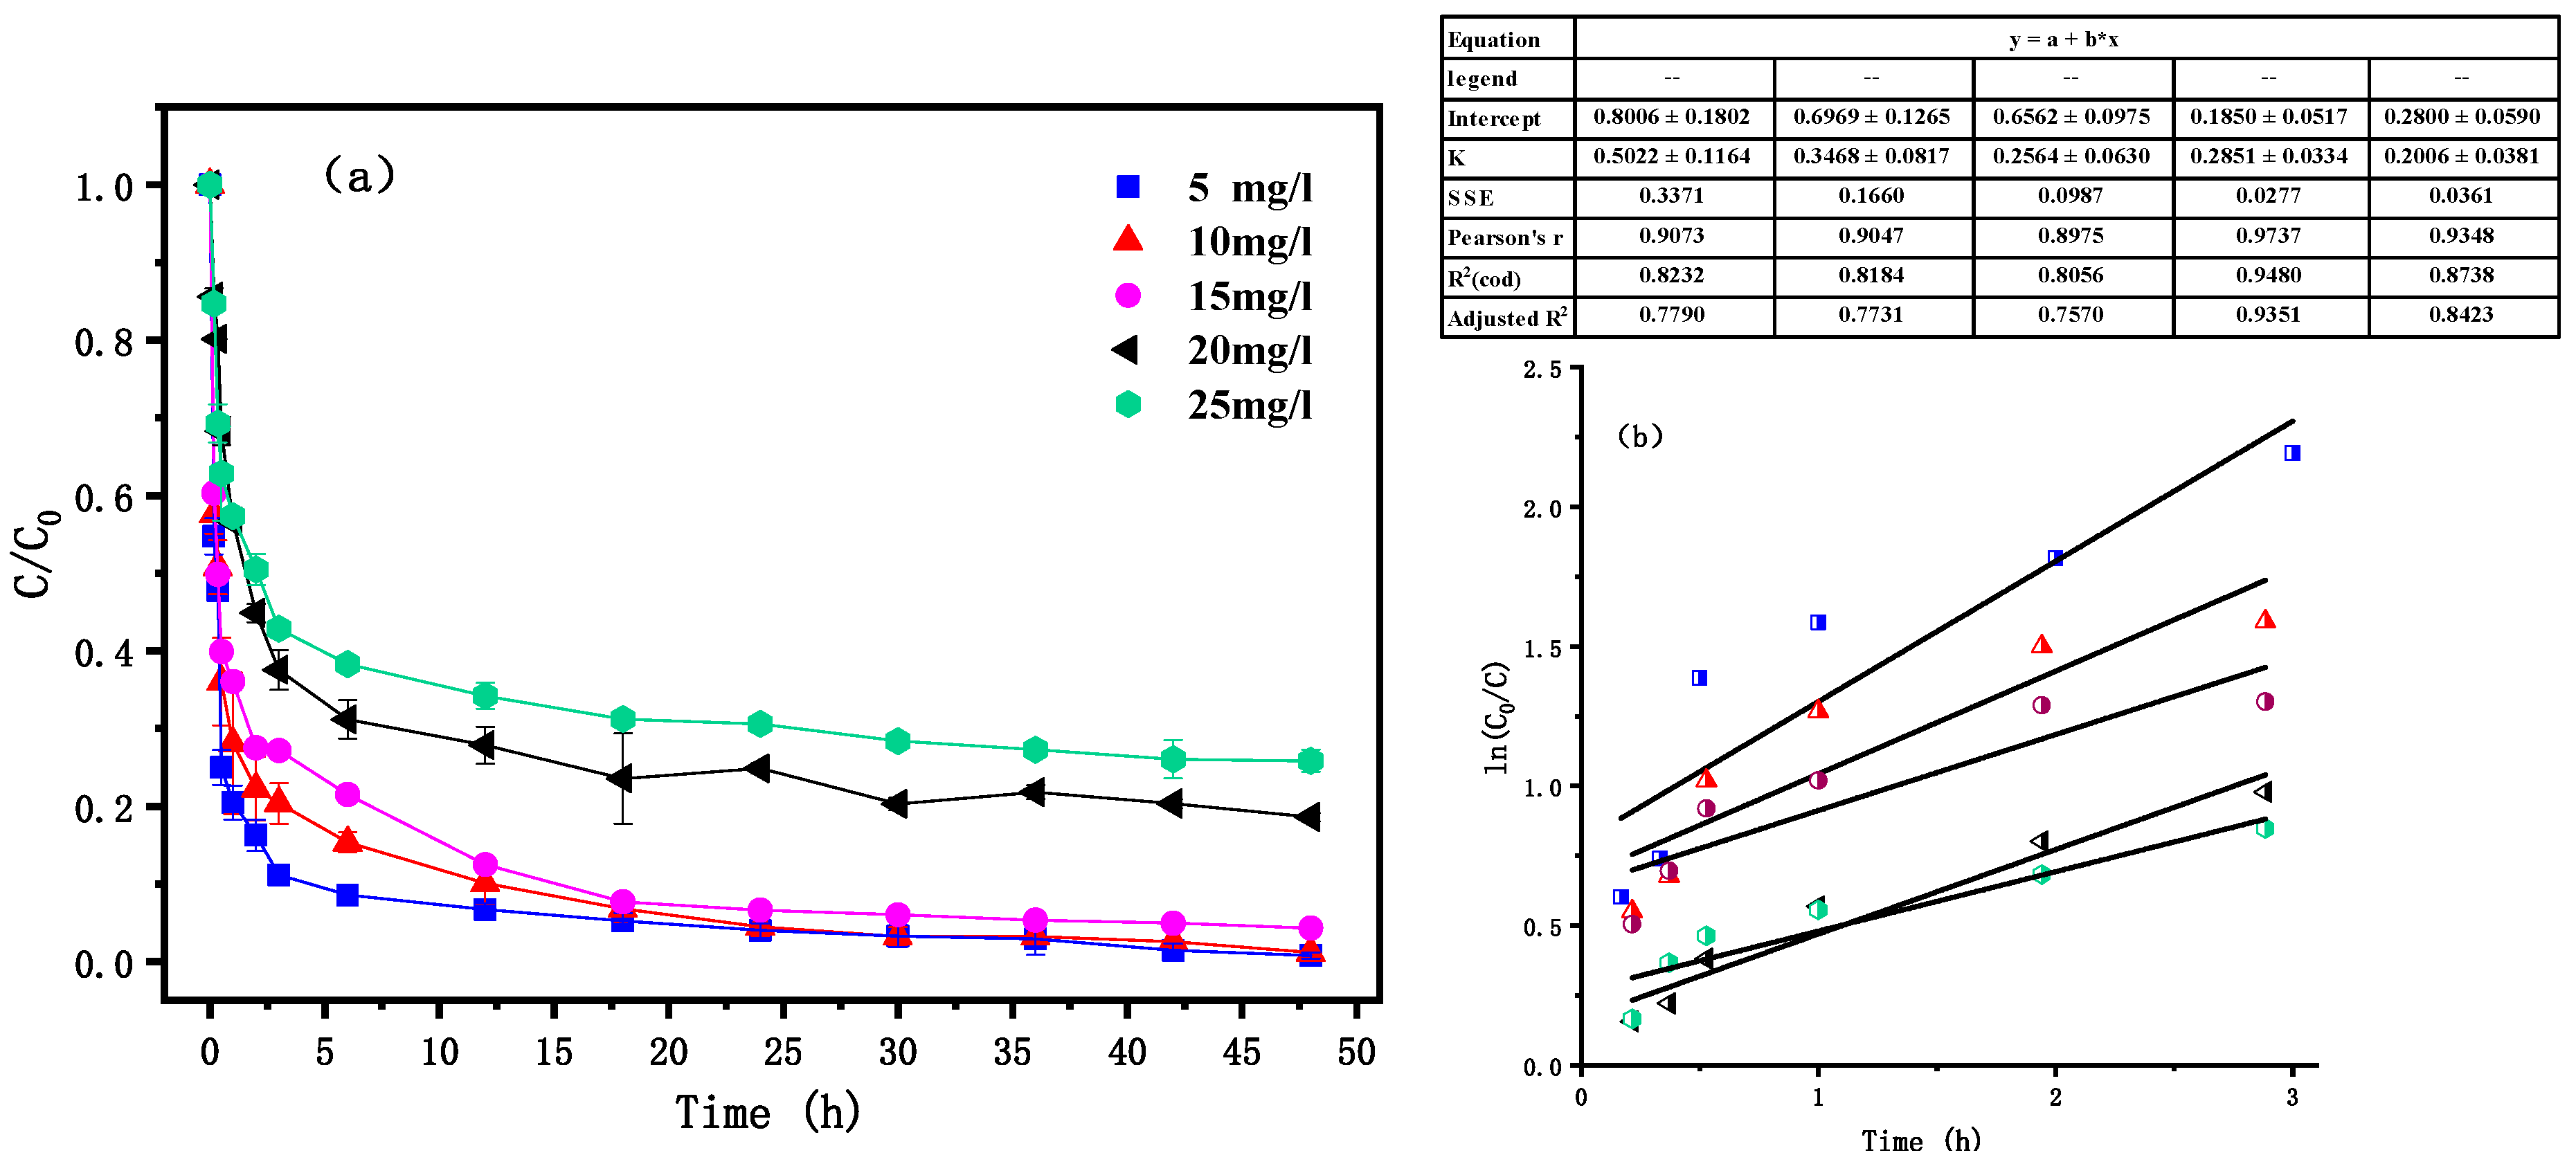
3.5. Effects of Initial PNP Concentration

Figure 11 is the degradation curve based on the concentration of PNP and the linear fitting. The degradation rate decreased with an increase in PNP concentration. When the initial concentration of PNP was increased from 5 mg/L to 25 mg/L, the degradation rate decreased from 99.2% to 83.44%. The reasons are as follows: Firstly, due to the limited activation potential of Co-nZVI/GAC, a limited amount of PS could be activated [34]. Secondly, a high concentration of pollutants would corrode Co-nZVI/GAC and generate an oxidation layer on the surface, which would reduce the activation potential and stop electron movement. Thirdly, the increase in PNP concentration would lead to the development of a slightly acid solution, which would increase the attraction force between the pollutant and the electron of the catalyzer. This would lead to competitive activation and sulfate reduction with PS. If the concentration of target pollutants was high, catalysts and oxidants would need to be added.

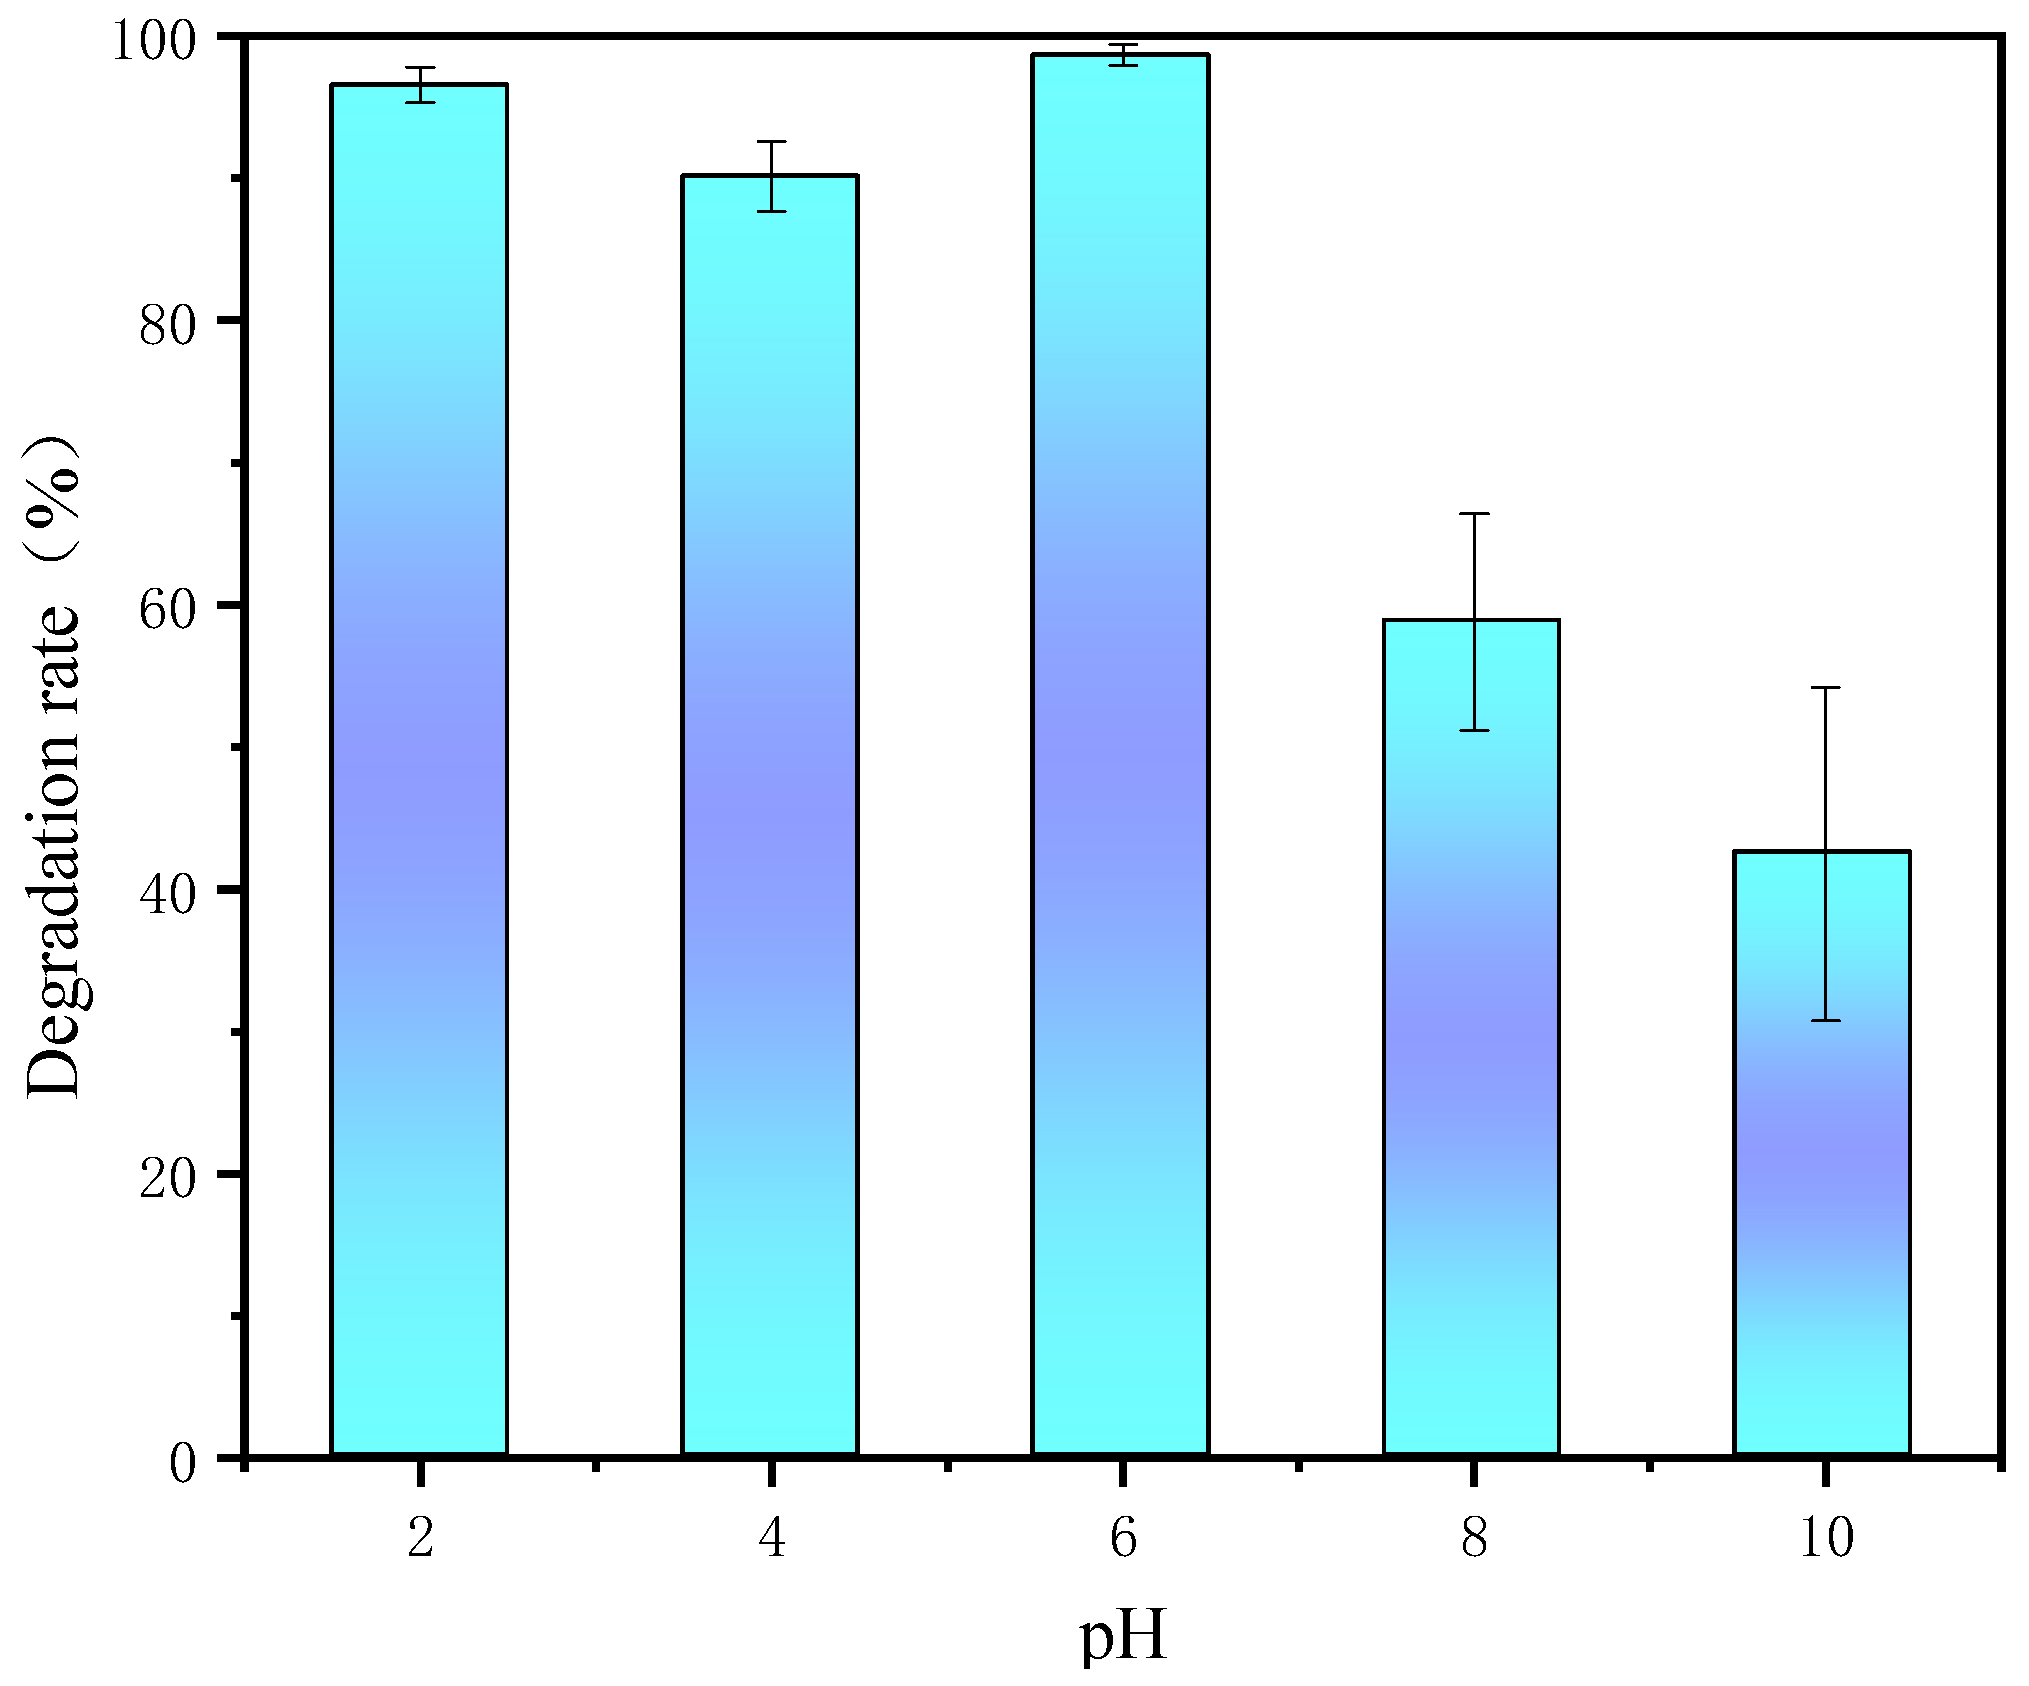
3.6. Effect of Initial pH
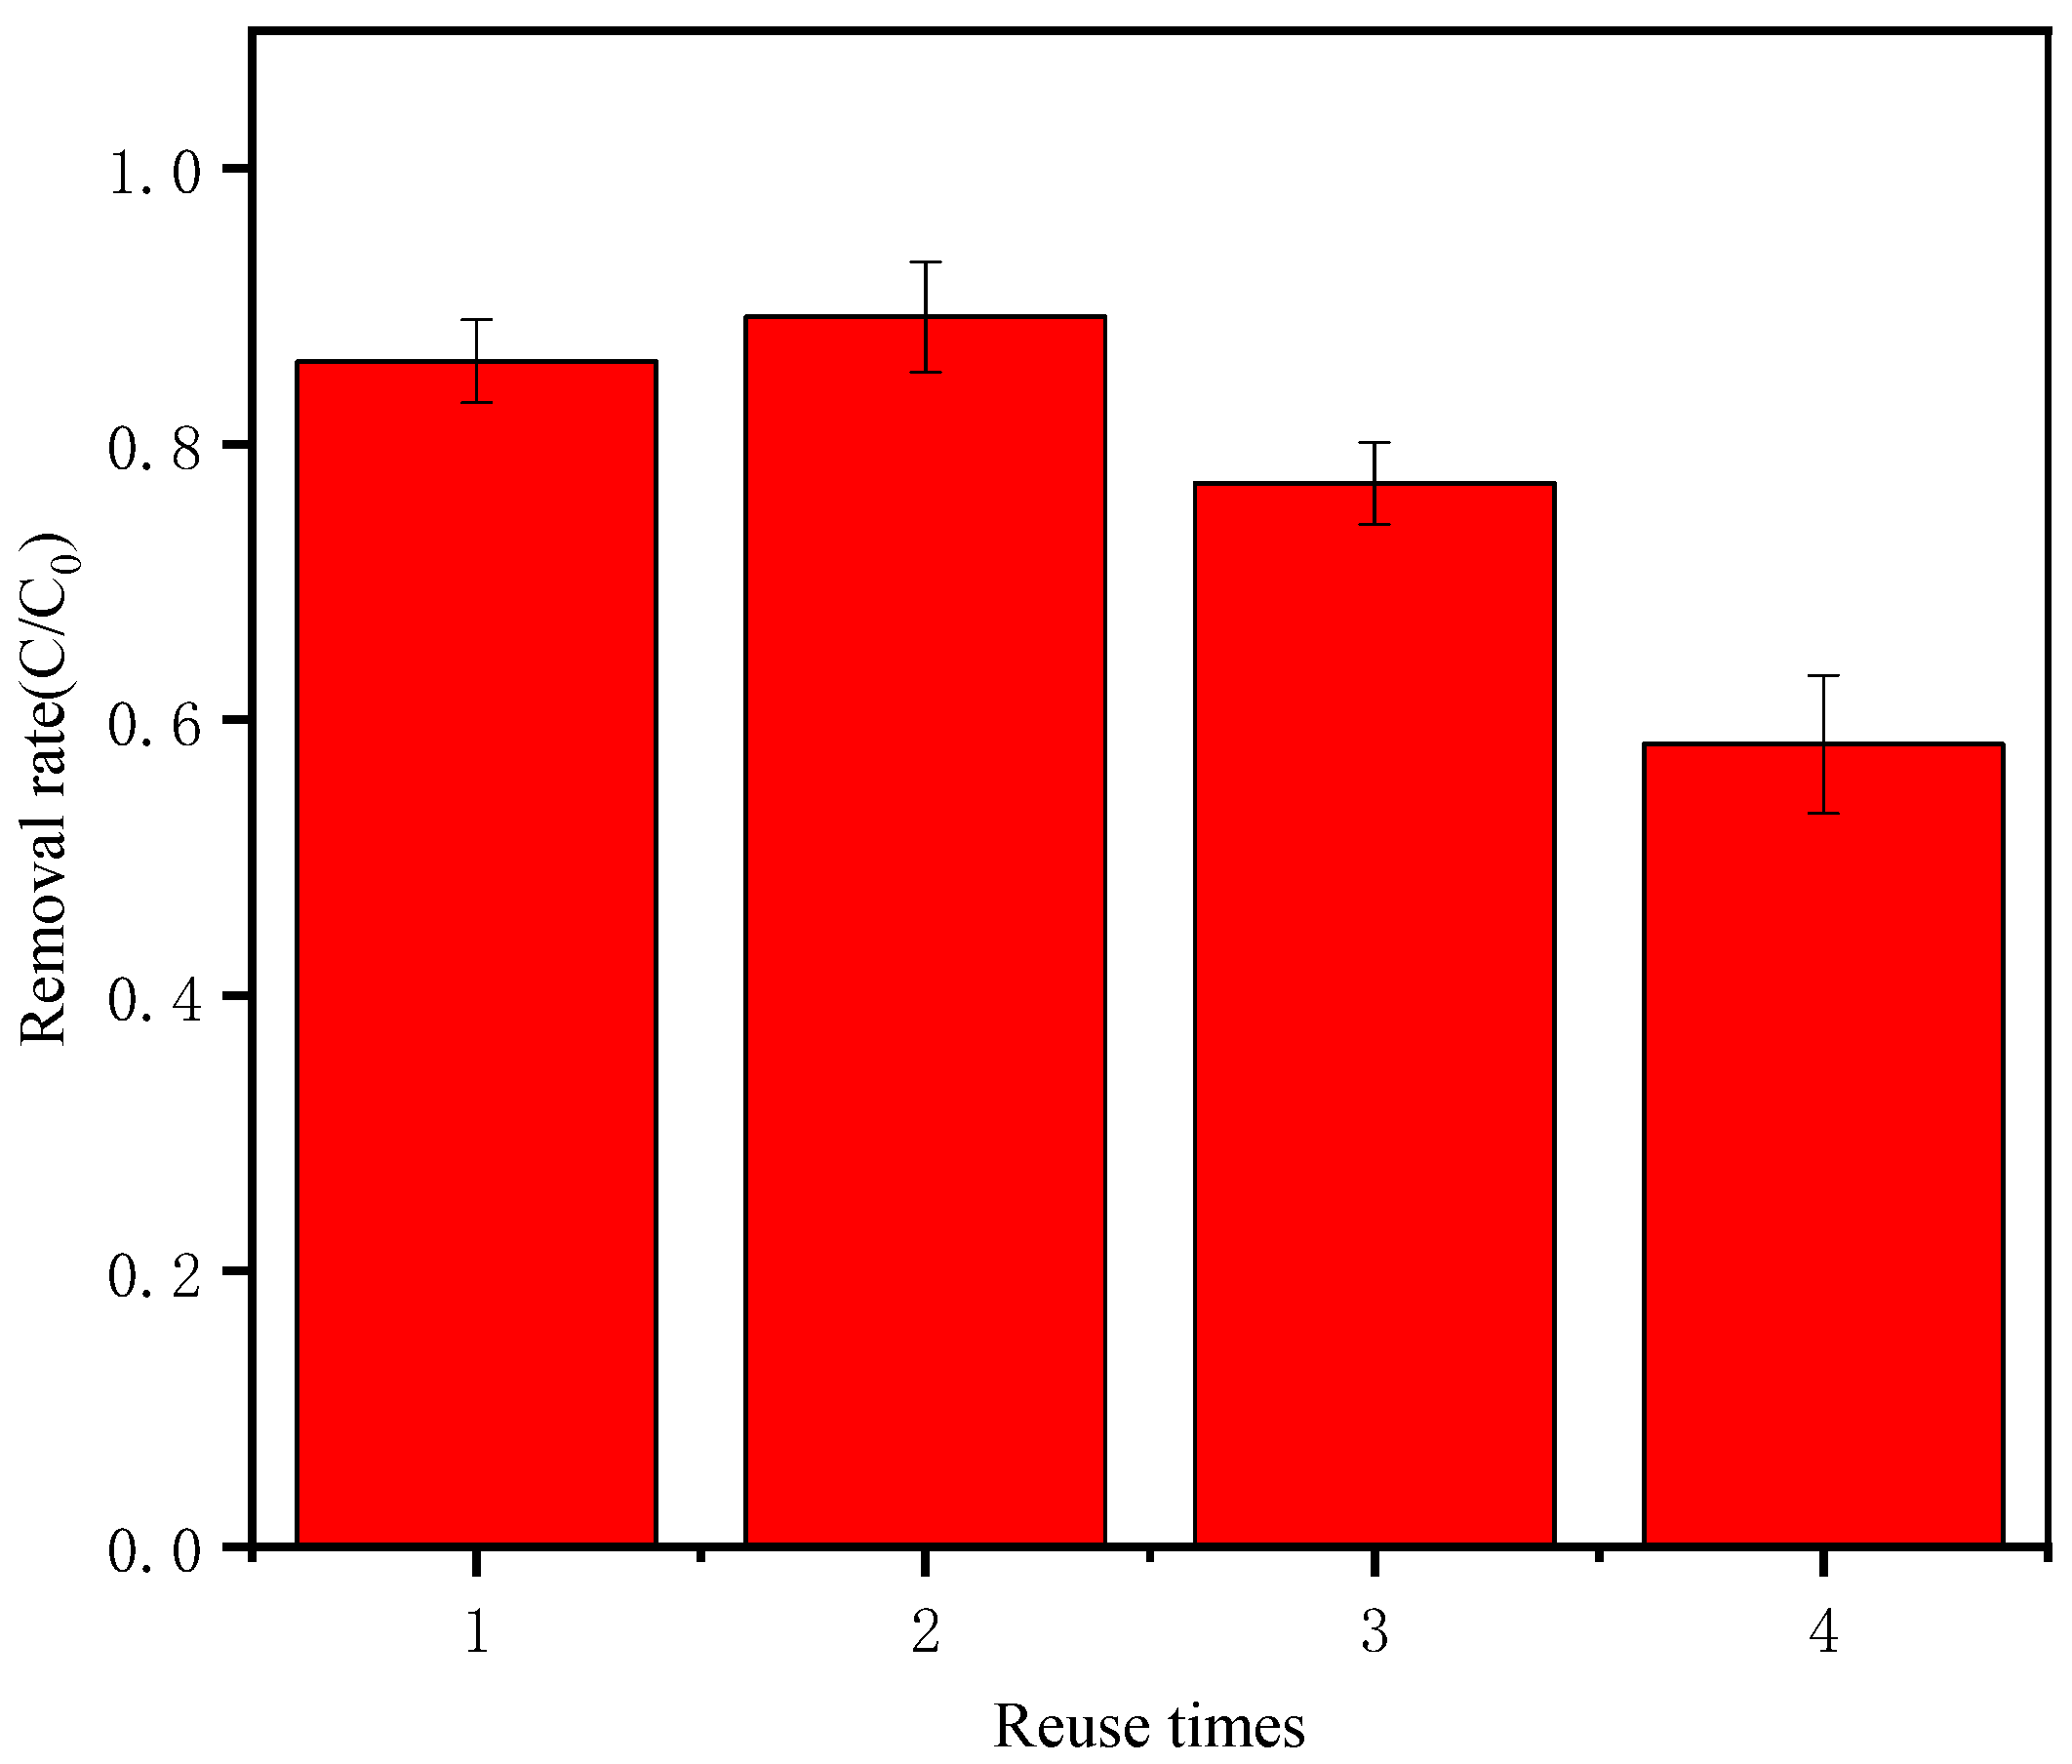
Figure 12 shows a histogram of the PNP degradation rate and the pH (2–10). The degradation rate of PNP decreased with a change in pH value as follows: pH = 6 > pH = 2 > pH = 4 > pH = 8 > pH = 10. This is because pH value affects the activation of Co-nZVI/GAC and the type of free radicals produced, which will affect catalysis. The degradation rate in an acidic solution is higher than in alkaline solution. This is because a large amount of H+ can maintain a high level of activity on the surface of Co-nZVI/GAC to activate PS and catalyze more SO4•−. The activation equations of sulfate radicals are possibly as below:
S2O82− + H+ → HS2O8
HS2O8 + e → SO42− + SO4•− + H+
Another reason for the negative impact on the degradation rate is that, when the pH value increases, the Co-NZVI/GAC surface is more likely to form an iron hydroxide layer [35], which will reduce the activation potential. The pH affected the degradation of PNP, and the optimal pH required to keep the co Co-nZVI/GAC + PS system acidic was 6. This conclusion was in line with that from Tang [36], i.e., the removal effect of PNP is the best under weakly acidic conditions.

3.7. Material Reuse

Figure 13 shows the PNP degradation rate when the catalytic material is reused. The test was performed in the following steps: Firstly, 1 mmol/L of PS was added to 1.5 g/L of Co-nZVI/GAC, and the PNP concentration was 15 mg/L. After activation, the catalytic material was separated using vacuum filtration, Co-nZVI/GAC was washed thrice with ultrapure water and ethanol and heated in a vacuum chamber. The test was repeated four times using the same catalytic material as described above. The figure shows that the catalytic material can be reused and is sound. From the first test to the fourth test, the degradation rate of PNP decreased from 86% to 59%. The reason for this is that the repeated reuse of Co-nZVI/GAC produces an oxide layer, and the intermediate material blocks the pores and reduces the activation of PS. In conclusion, reusing Co-nZVI/GAC was possible, and its activation was significantly reduced after the test was performed more than four times.

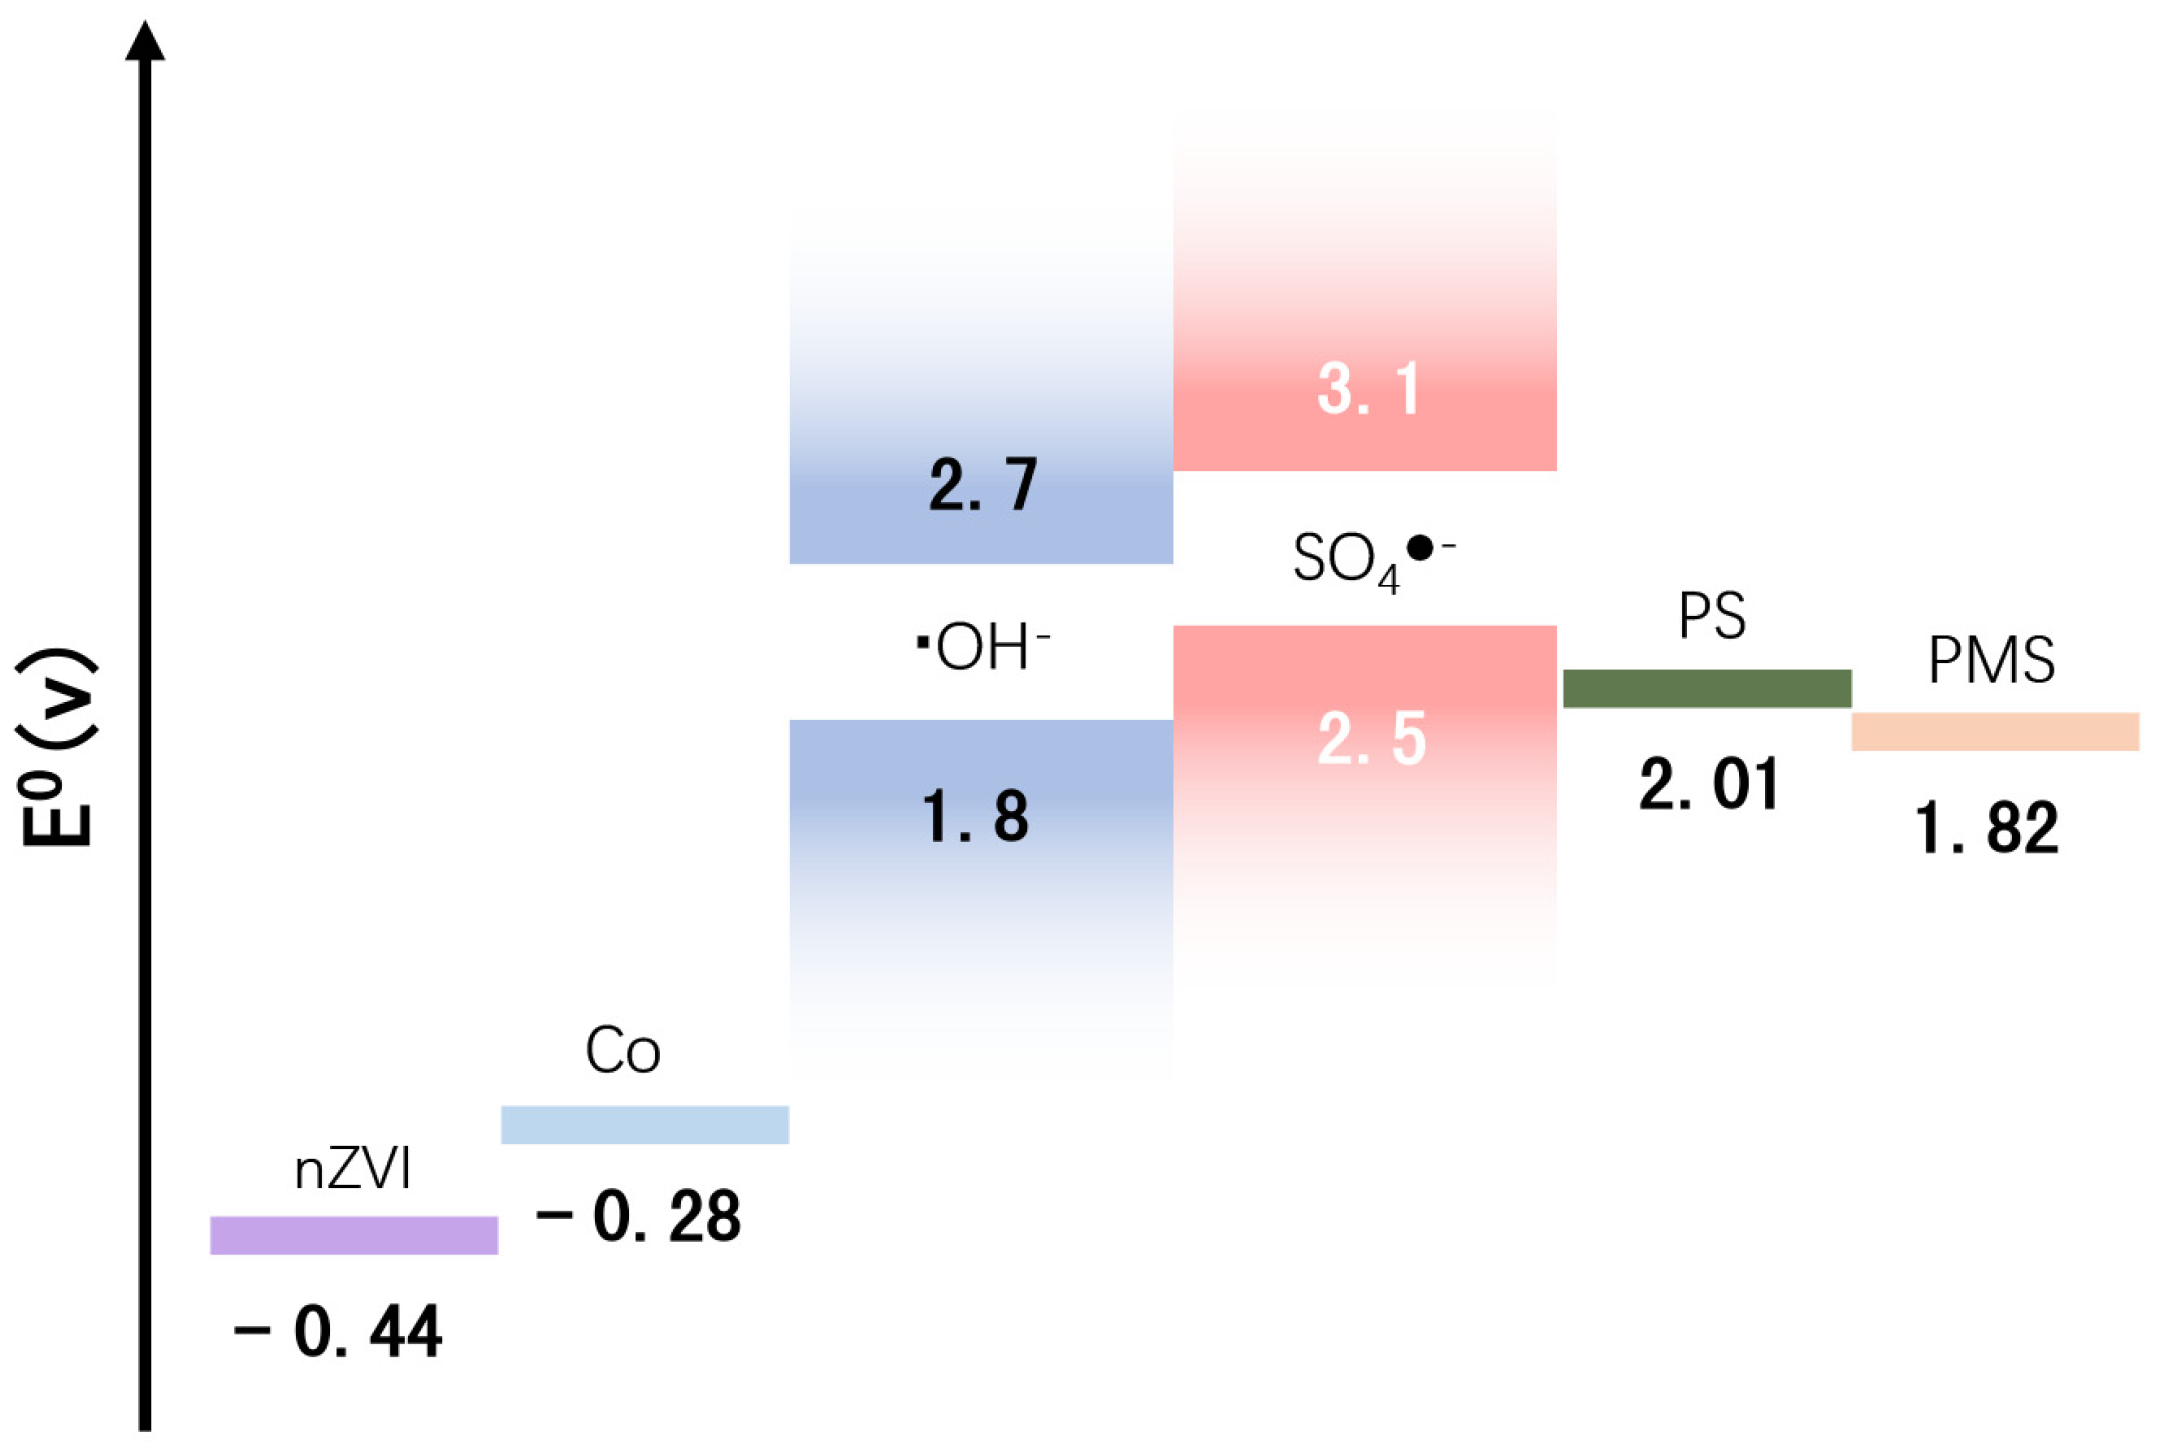
4. Degradation Mechanism

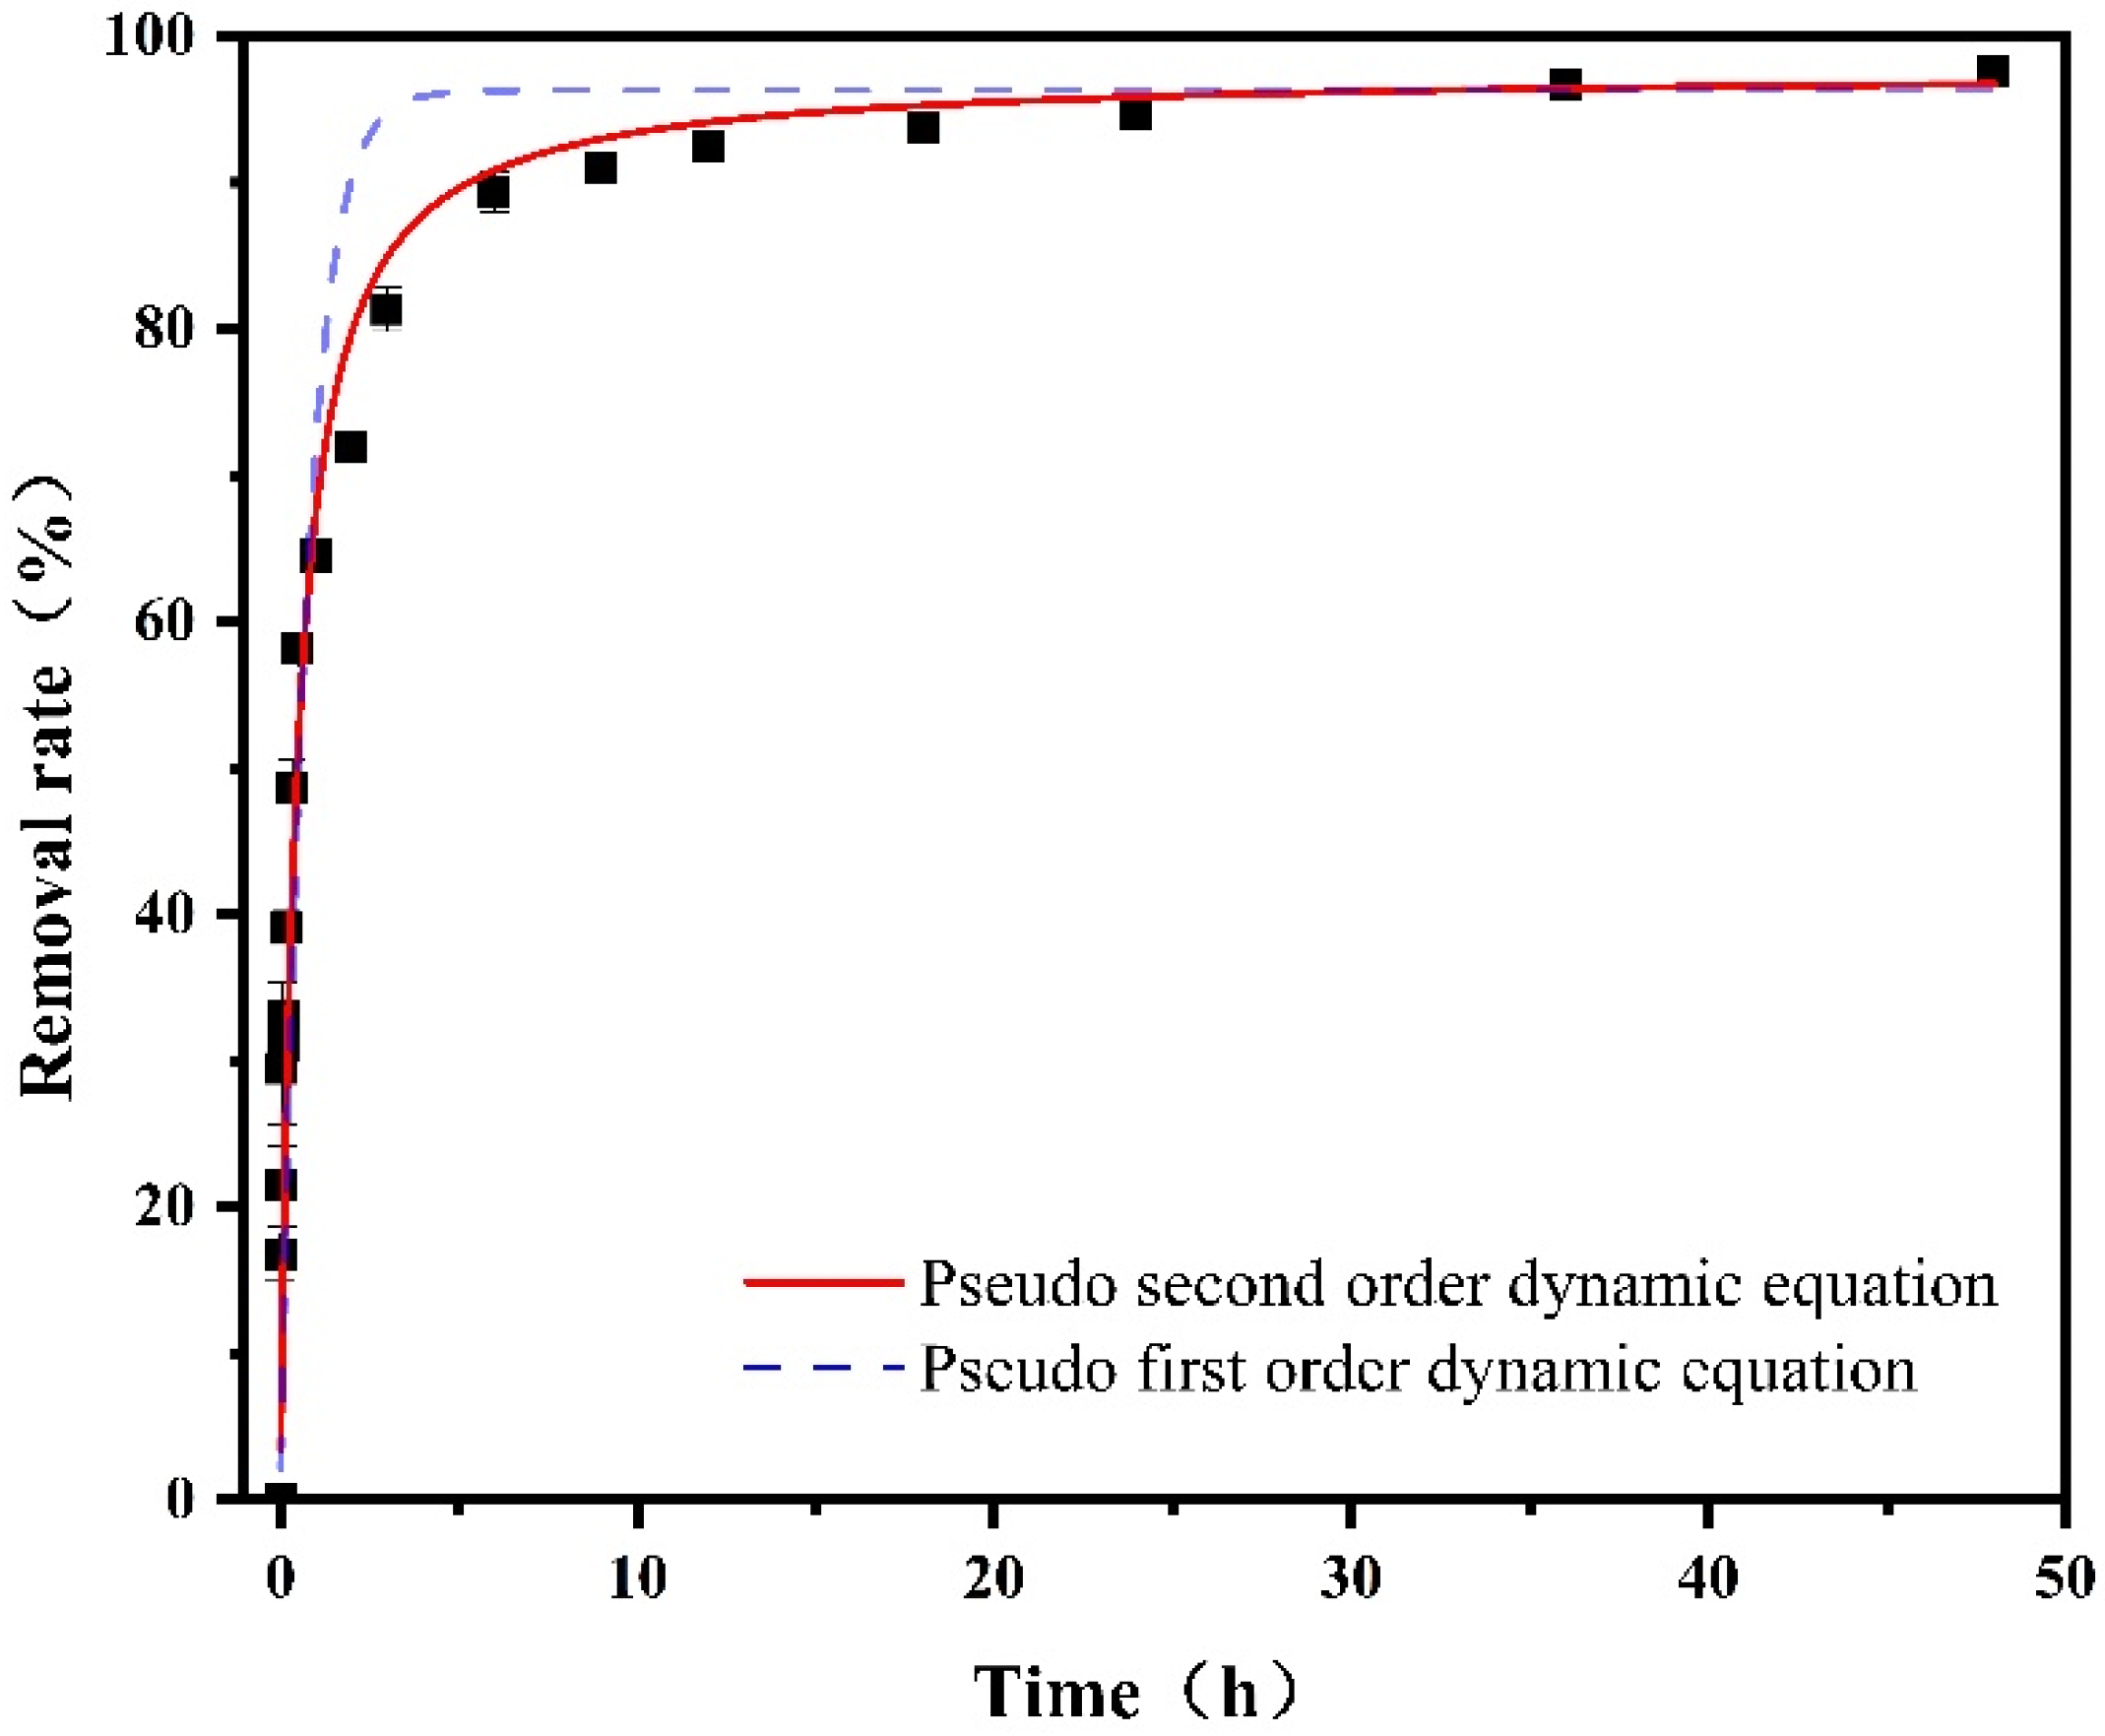
4.1. Dynamic Analysis

Pseudo first- and second-order dynamic equations were used to fit the data. The first-order kinetic model could better serve the degradation process (Table 2 and Figure 14). The coefficient of the pseudo second-order kinetics, R2, was higher than that of the pseudo first-order kinetics, and the R2 value of 0.9022 indicated a stronger correlation with the second-order kinetic model. In the degradation process, Co-nZVI/GAC will be covered with an oxide layer, which will reduce the activation potential of the surface, thereby inhibiting the movement of electrons at the surface of Co-nZVI/GAC. It will also inhibit the movement of electrons from sulfate to PNP [37]. Under the supported activated carbon and cobalt and nZVI bimetallic systems, Co-nZVI/GAC can absorb and activate sulfate radicals to reduce PNP. Simultaneously, when activation begins, PNP is adsorbed on the surface or pores by the activated carbon and then reduced by Co-nZVI to intermediate products [38]. Therefore, the degradation efficiency of PNP by PS was higher after Co-nZVI/GAC activation, which was consistent with the pseudo second-order kinetics.

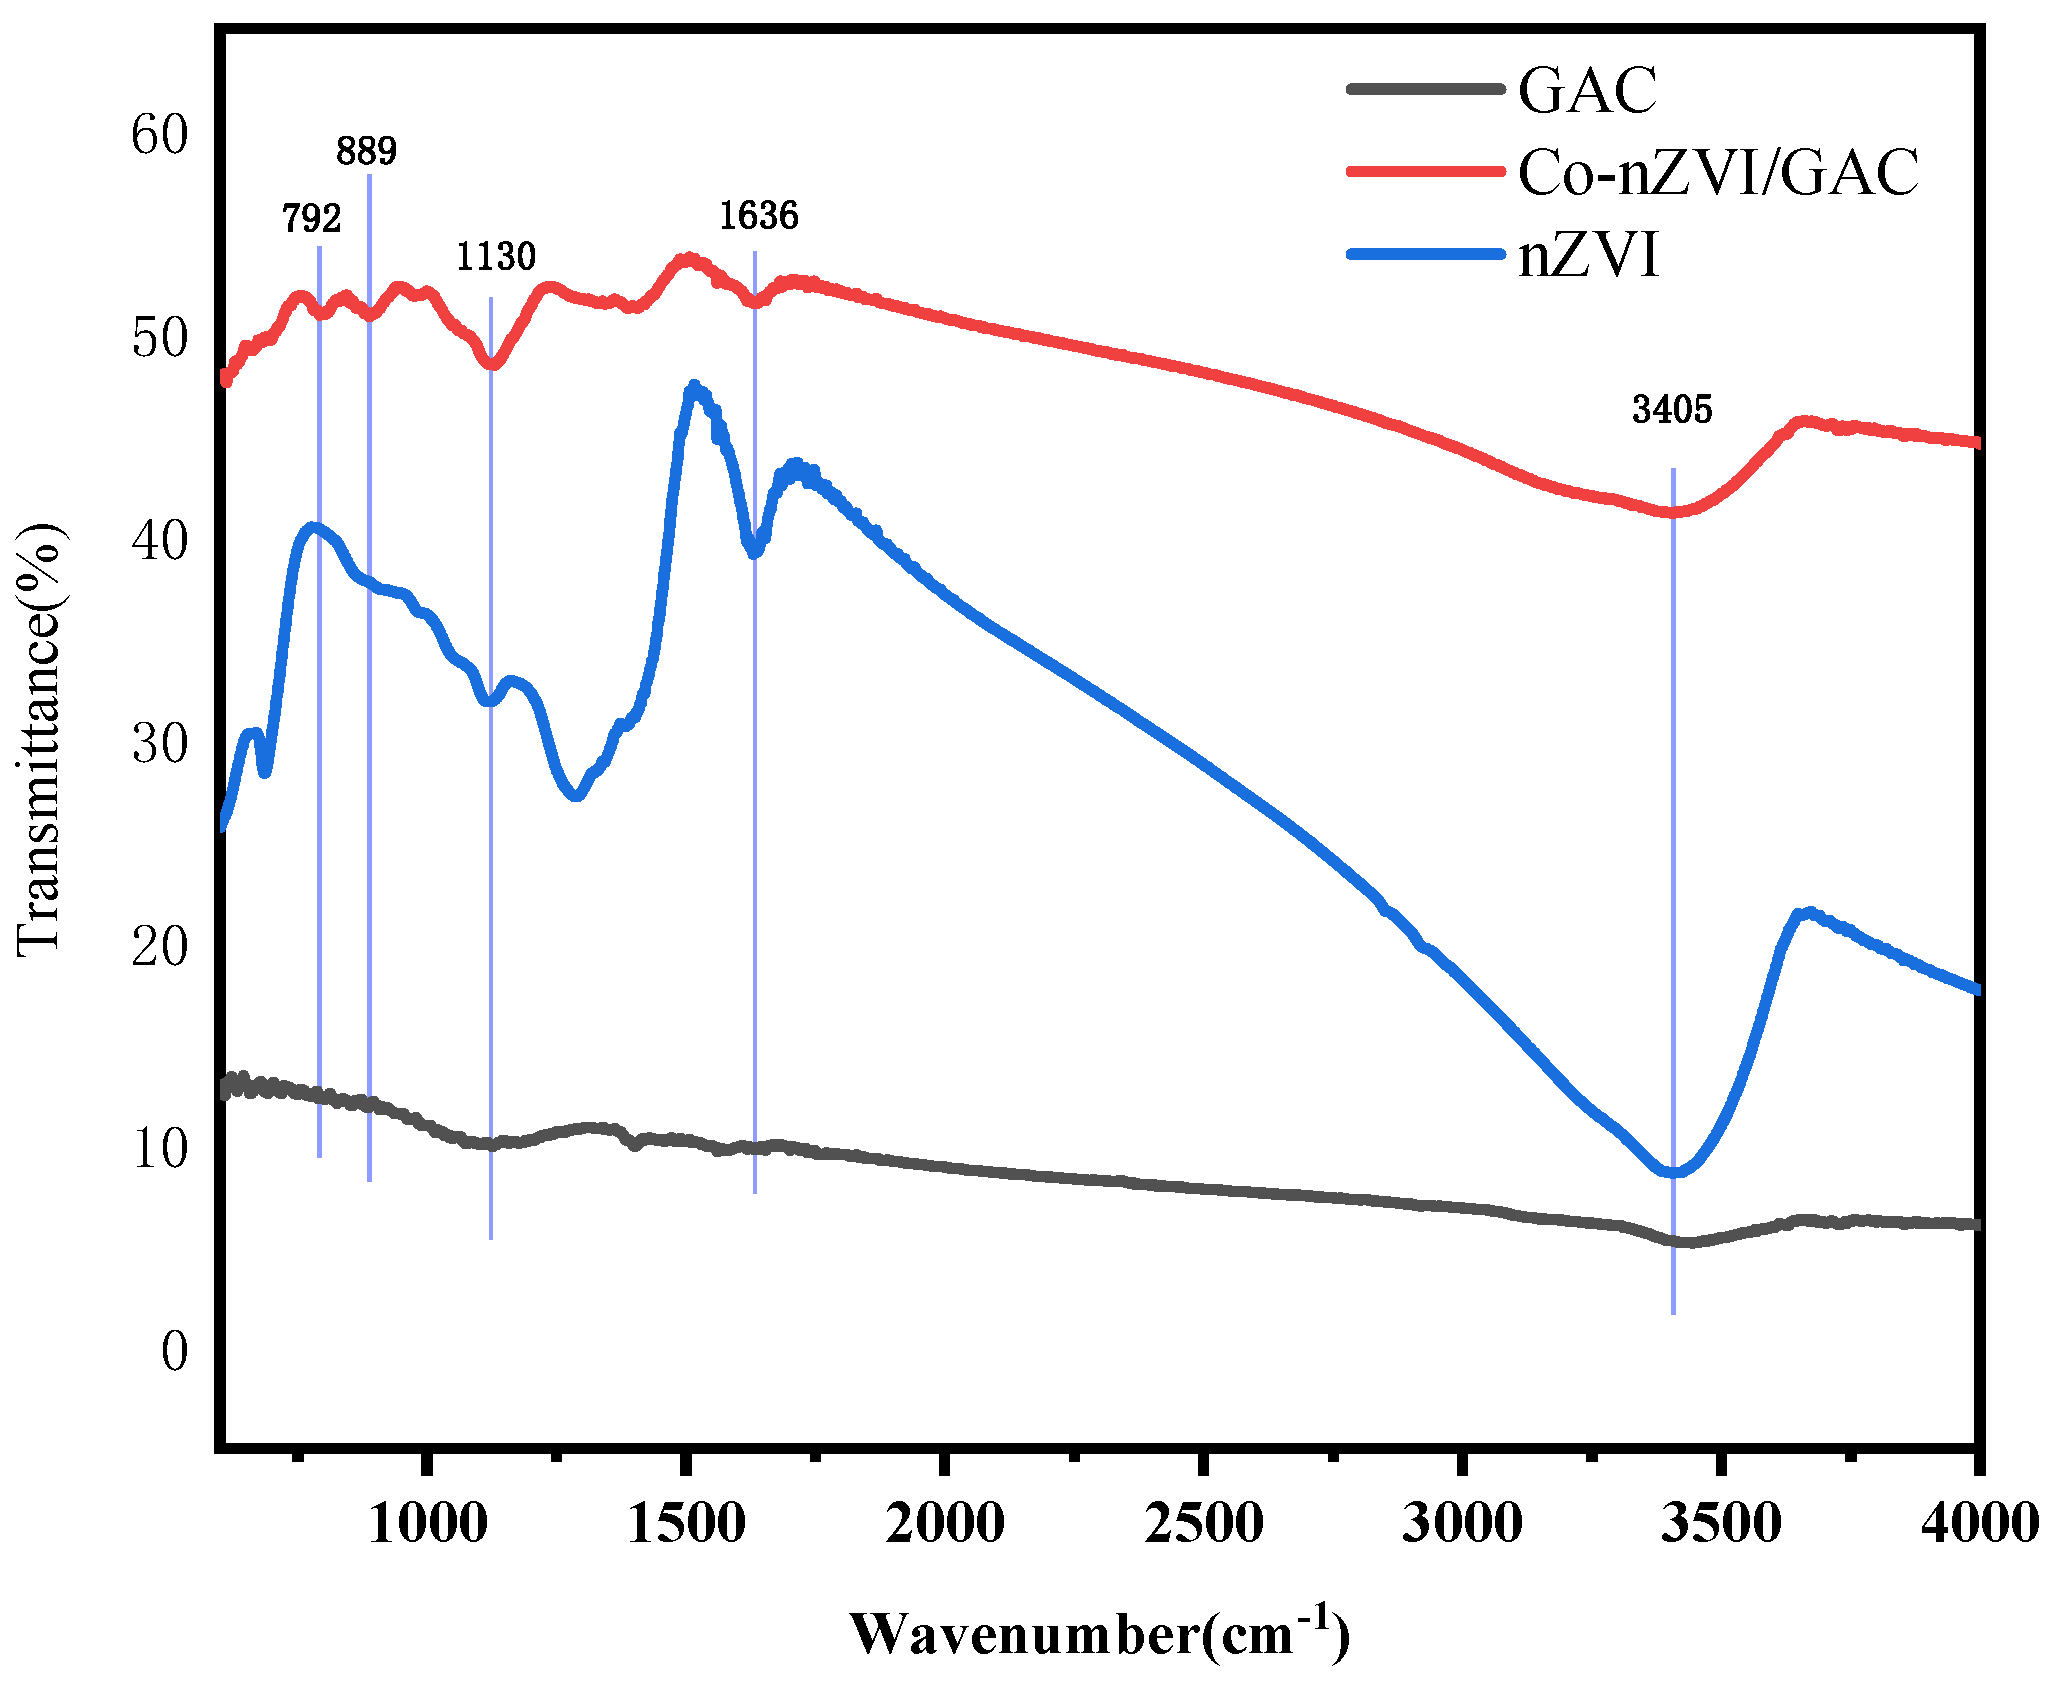
4.2. Fourier Infrared Spectroscopic Analysis
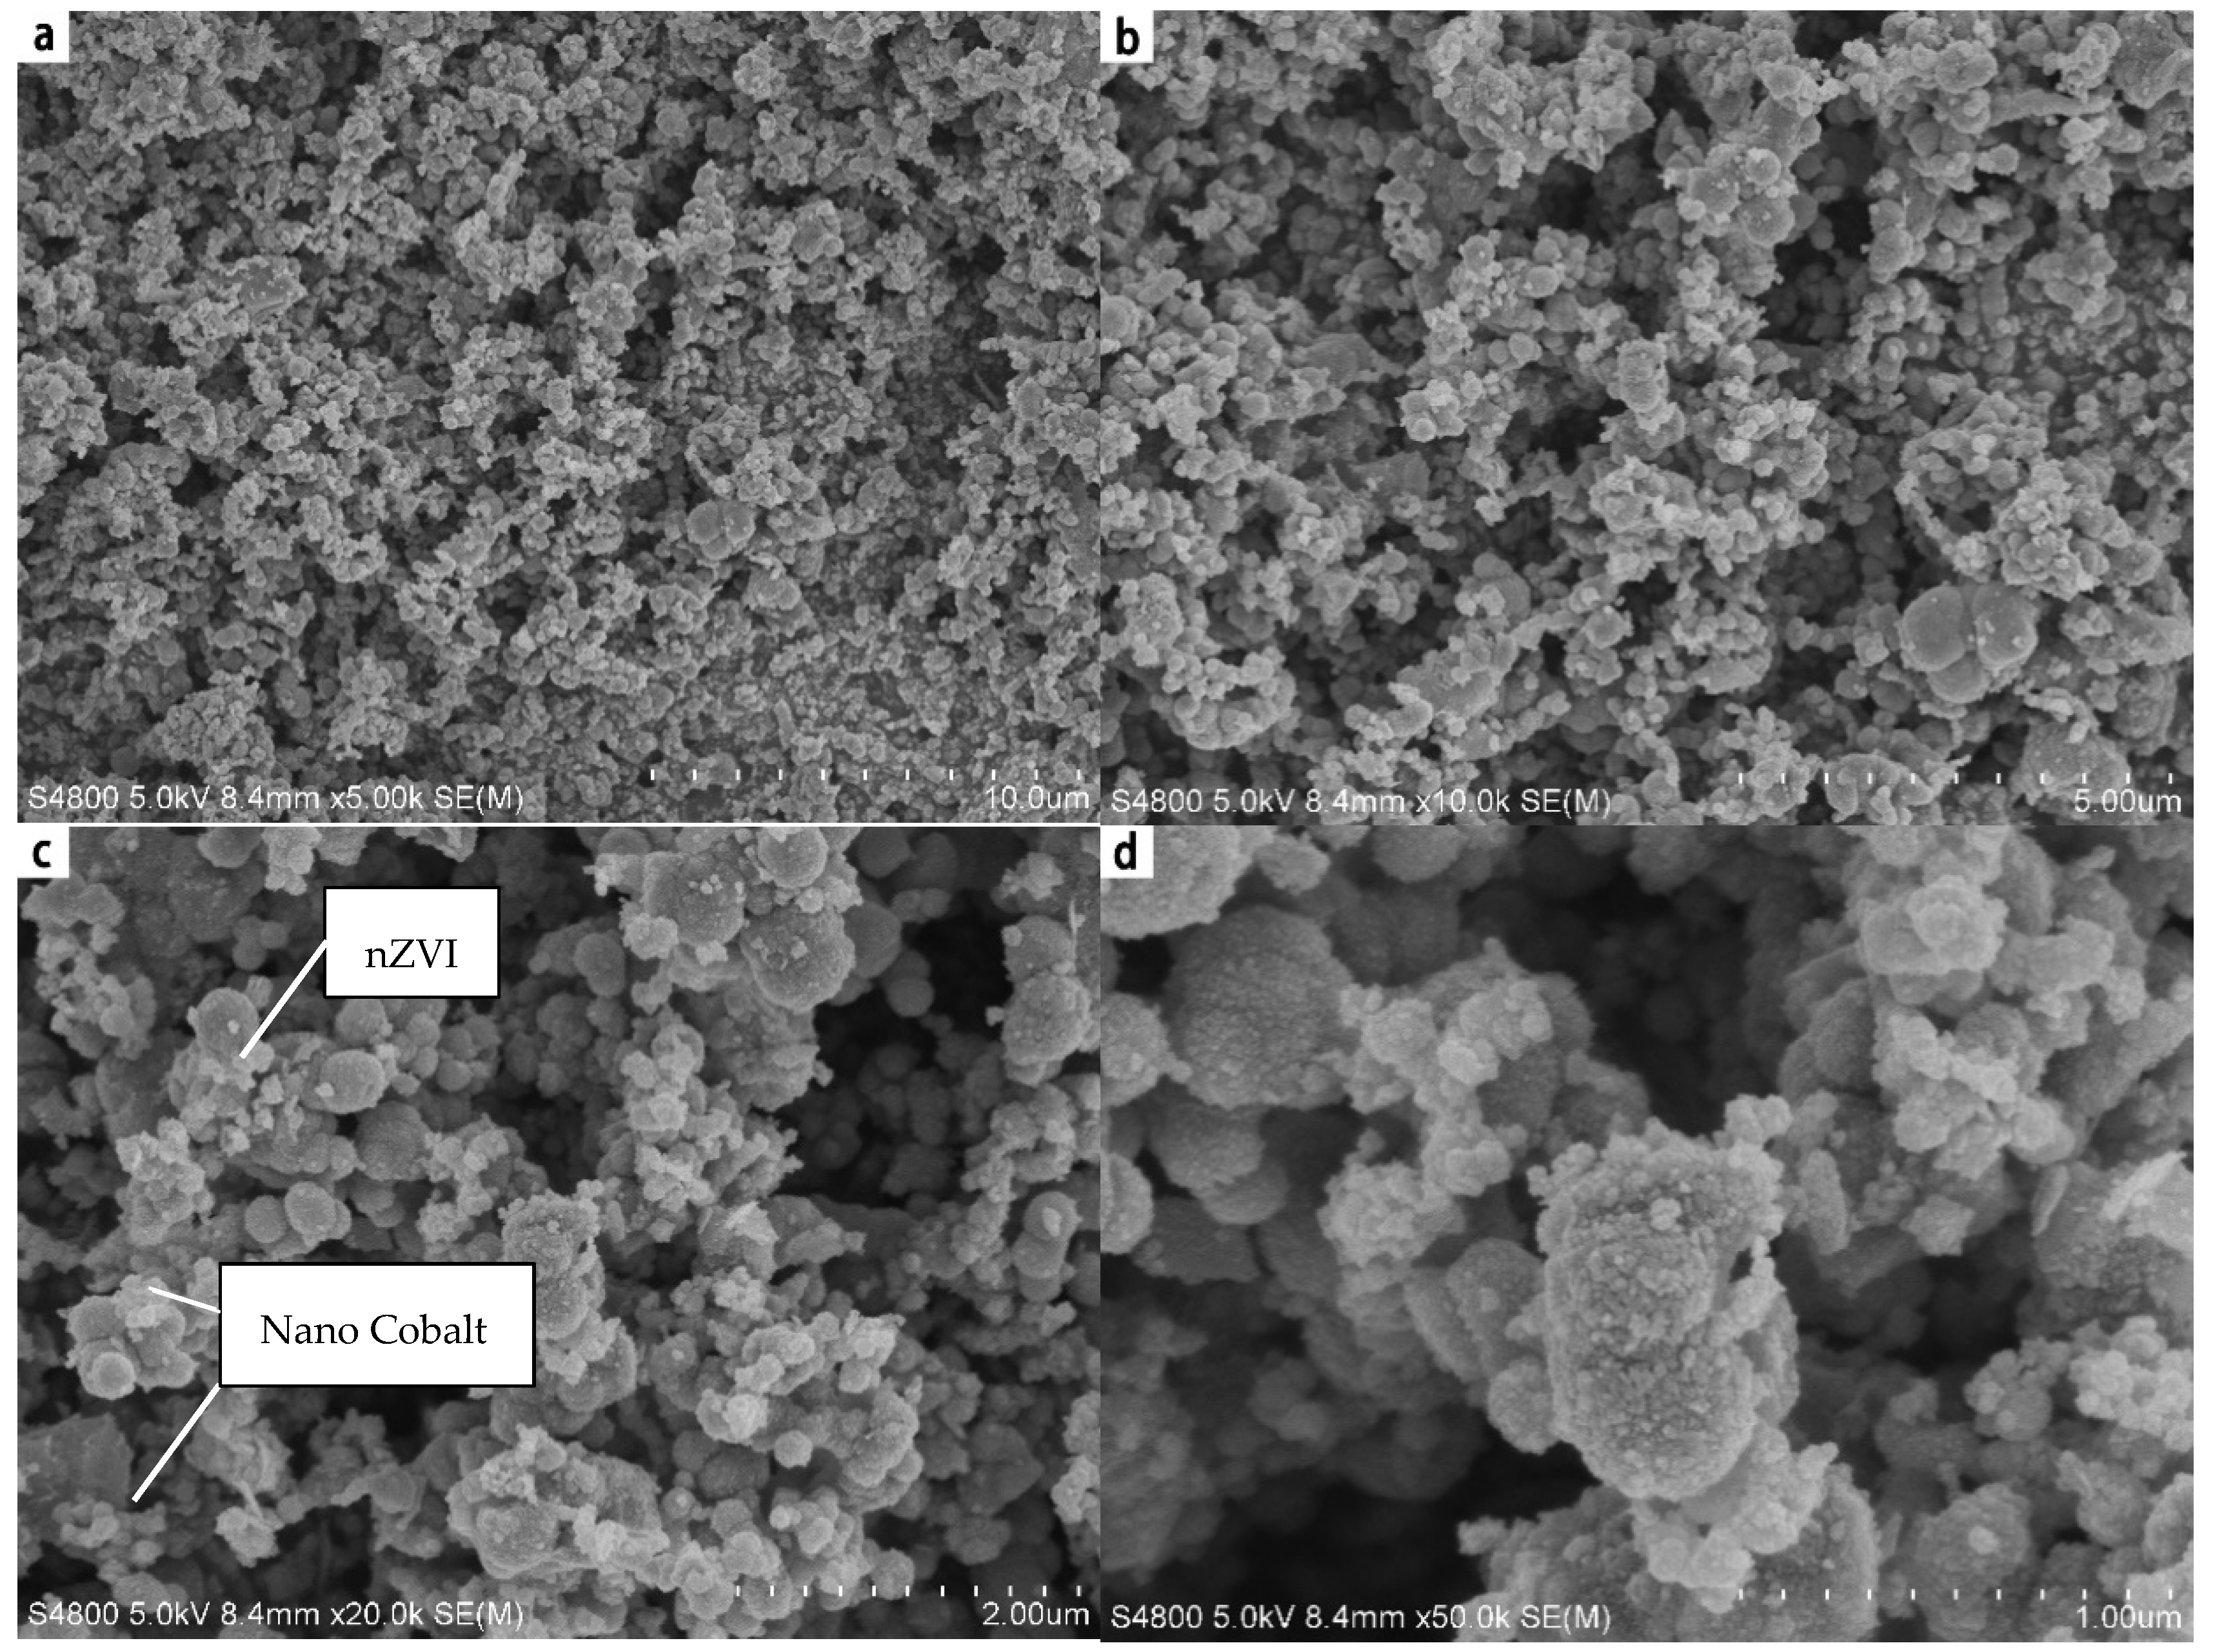
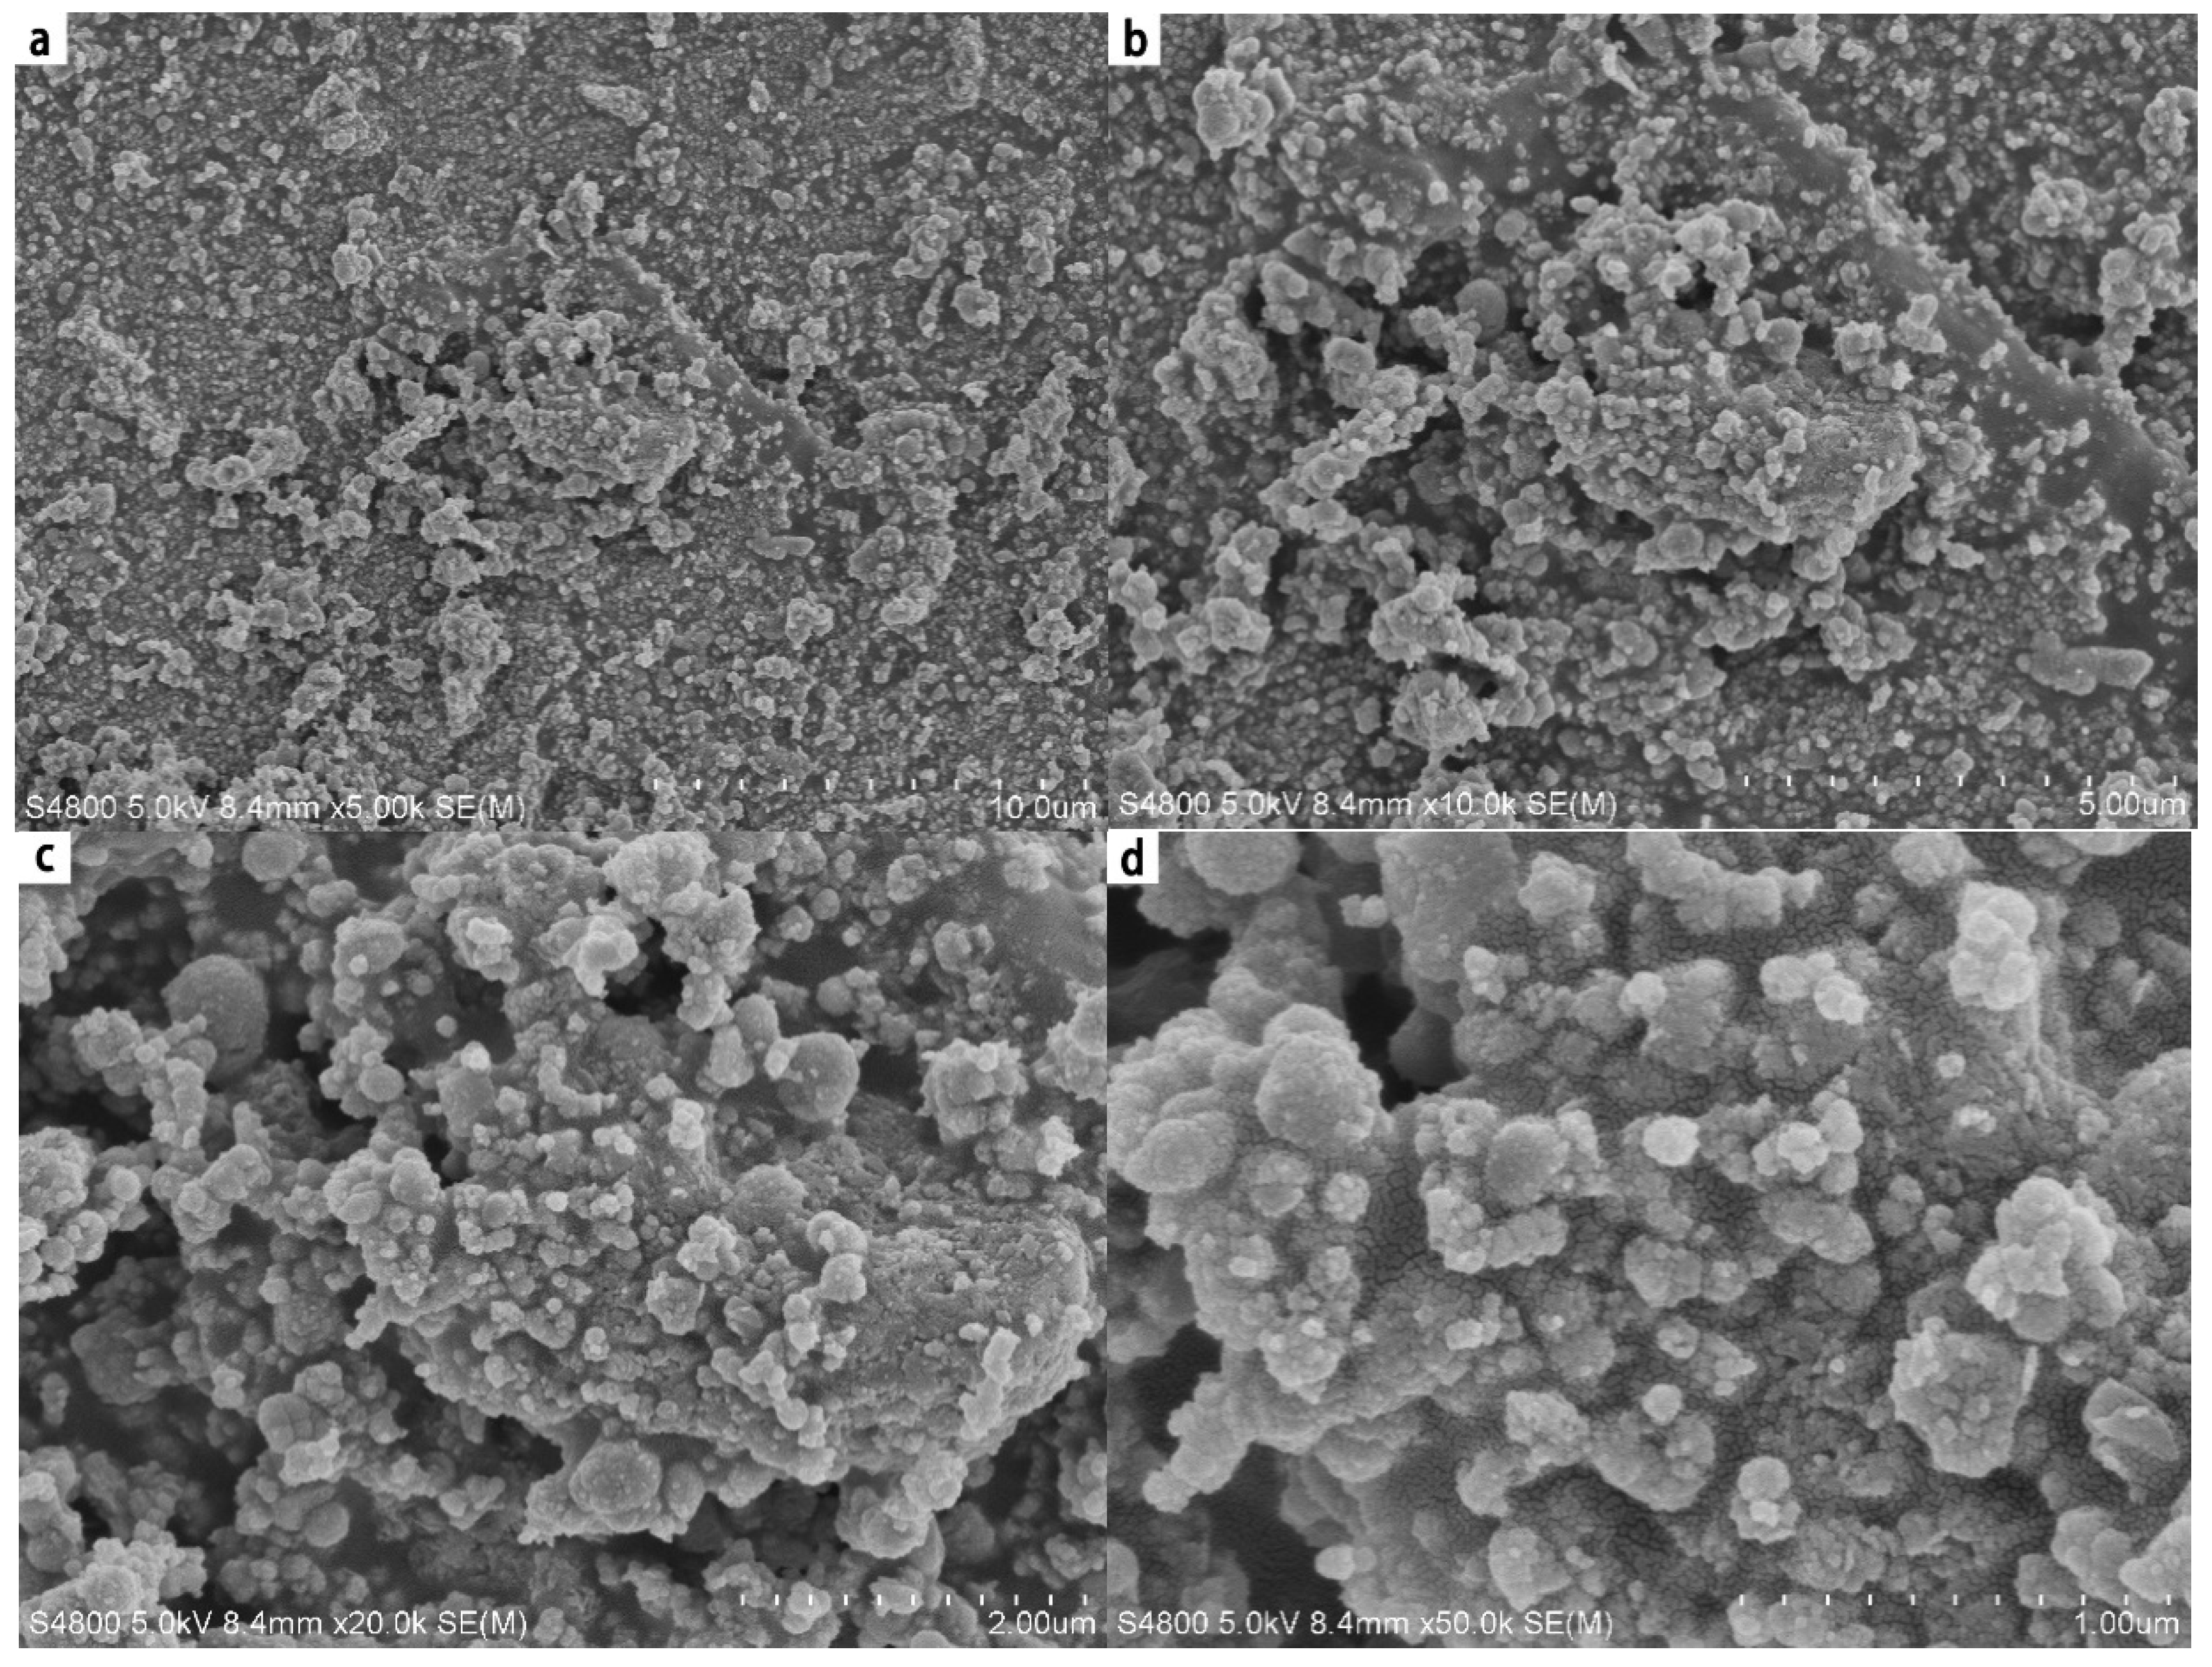
As shown in Figure 15, a characteristic absorption peak is present near 3405 cm−1. This is the tensile vibration absorption of N-H and O-H. After activation, the peak disappeared because nitrophenol was reduced to phenol. Co-nZVI/GAC has an asymmetric vibration absorption peak at –COOC– narrowed and shifted near 1636 cm−1. C-H’s characteristic peak in Co-nZVI/GAC near 1130 cm−1 almost disappears after activation [30]. The absorption peak near 1636 cm−1 is related to the skeletal vibration of C=C [39], while the absorption peaks near 792 cm−1 and 889 cm−1 relate to the hydroxyl vibration disappearing after activation, indicating that these absorption peaks are affected by the degradation of nitrophenol. The analysis showed that Co-nZVI/GAC participated in multiple activations in the degradation of PNP, effectively activated PS, and even participated in the ring-opening reactivation of benzene rings.

4.3. SEM Analysis

Figure 16 shows the SEM output after the reaction from a to d. As shown in the figure, pores on the surface of the activated carbon are filled with target pollutants and intermediates. Due to the transfer of nano iron and cobalt to iron oxide, iron hydroxide, and other oxides, the shape was irregular, and the outline was unclear. Nano iron could adsorb some small modules on its surface. Furthermore, PS activated by Co-nZVI participated in the reaction, and activated carbon could adsorb target pollutants.

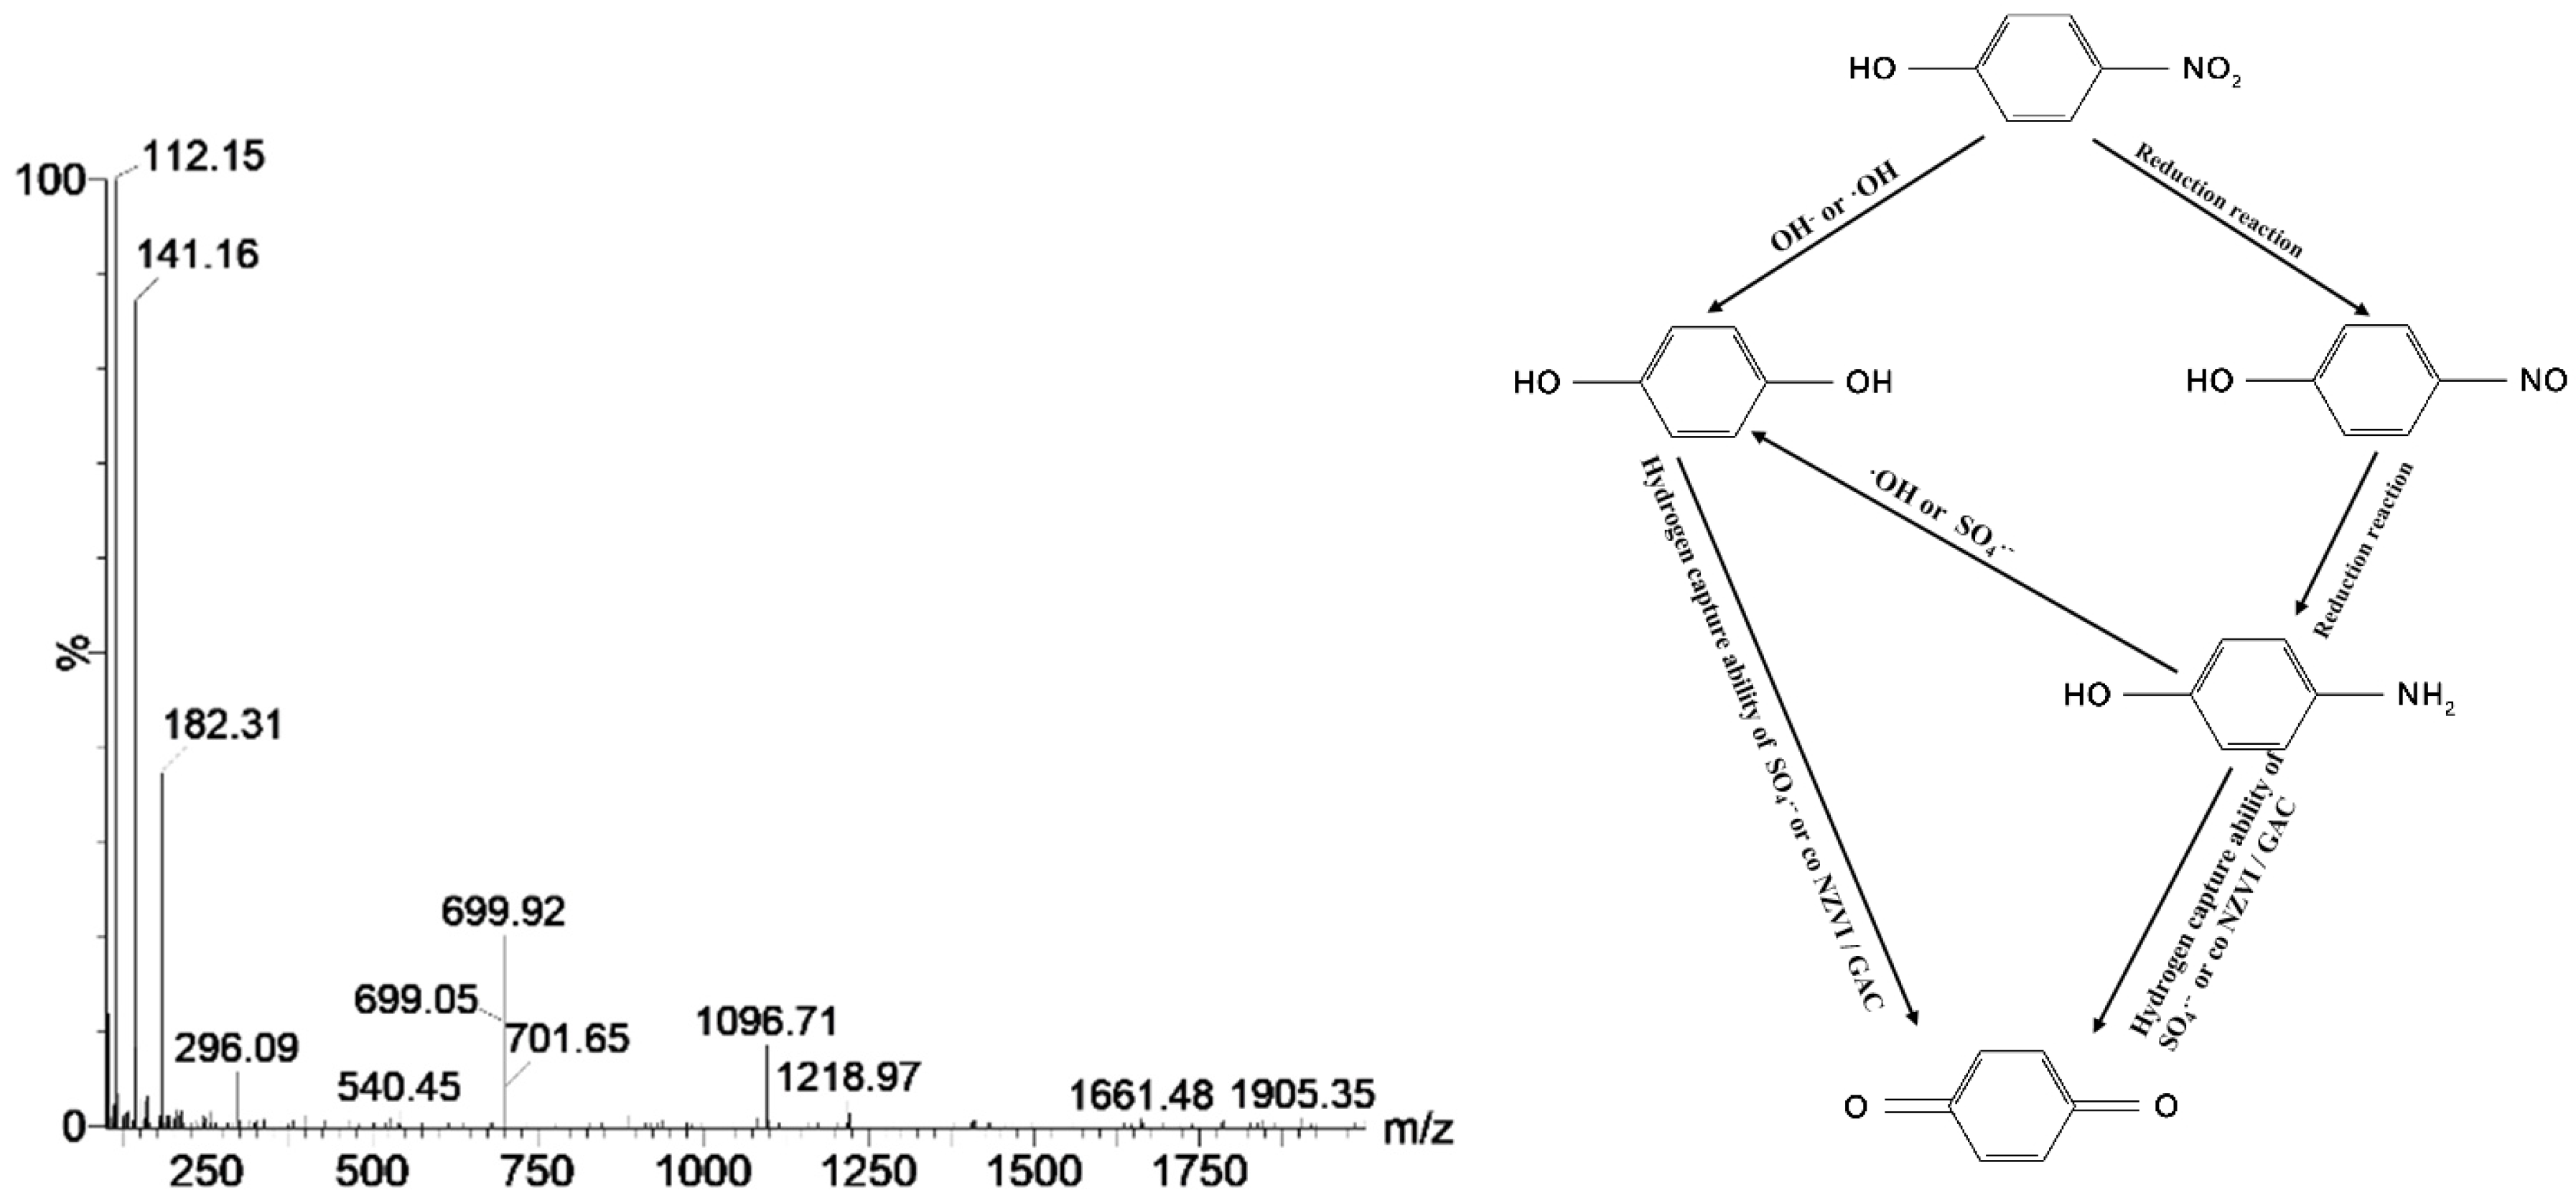
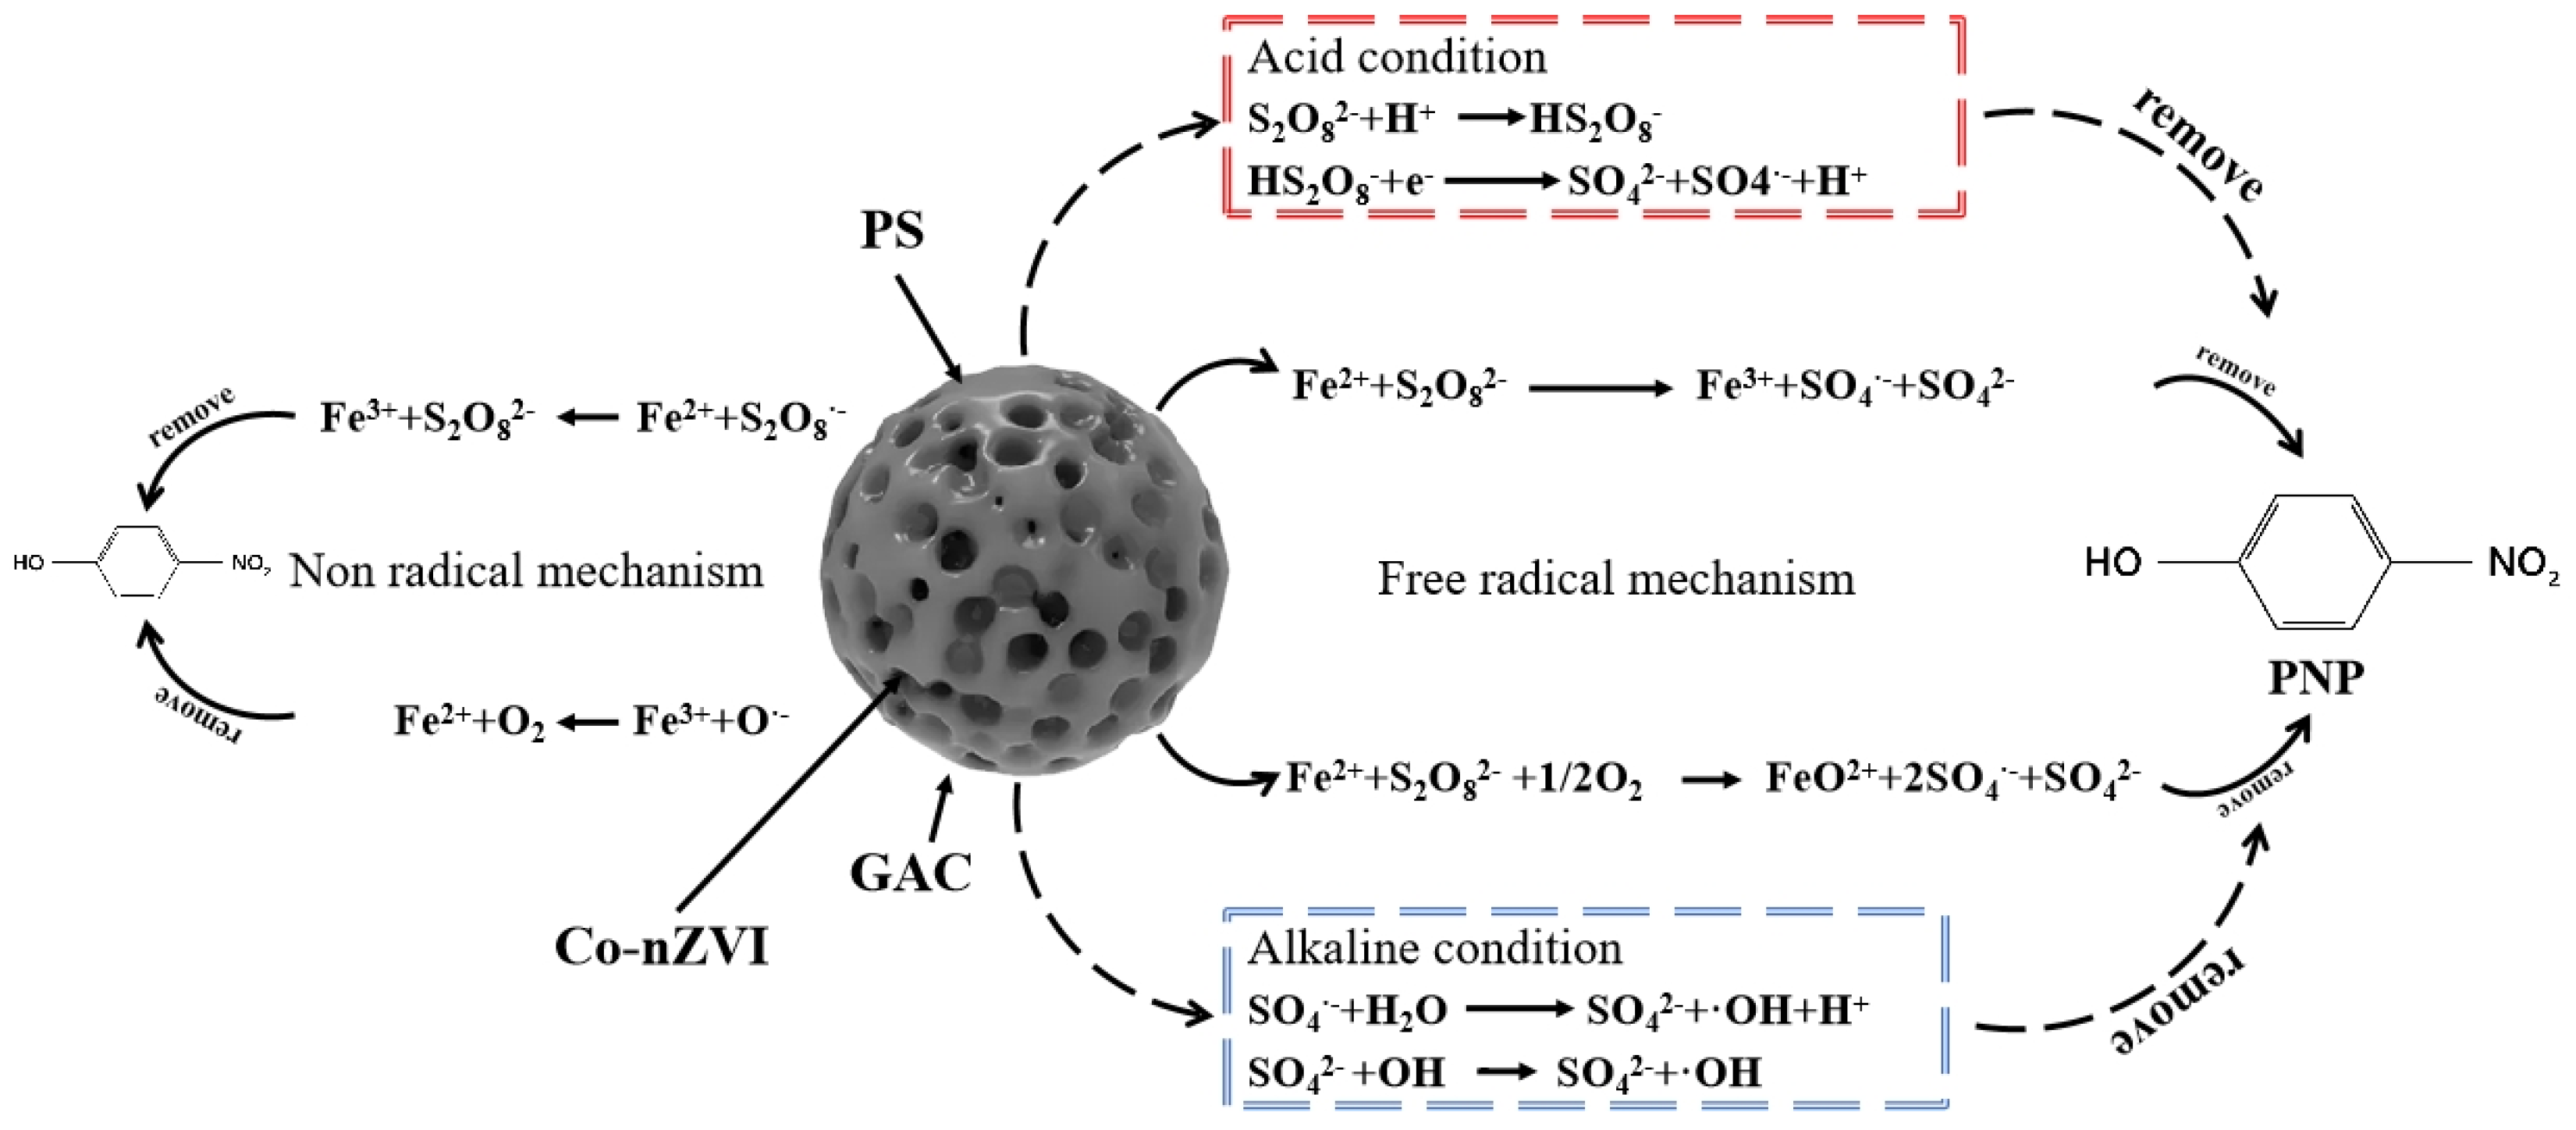
4.4. Degradation Routine and Mechanism Analysis

As shown in Figure 17, the 112.15 m/z demonstrates the intermediate product benzoquinone, C6H4O2, during PNP degradation. Although aminophenol is conventionally present, it is not detected because the concentration is too low [40]. However, the material peak formed after the benzene ring-opening could not be detected in the mass spectrum, so there was no effective result to prove whether opening of the benzene ring during the reaction occurred in this experiment. PNP is first reduced to p-nitrophenol through hydrogen reduction, then reduced to aminophenol, and then finally reduced to benzoquinone by a sulfate radical. It can also be directly reduced to phenol by a hydroxyl ion and hydroxyl radical and then reduced to benzoquinone by a sulfate radical.
Figure 18 is the mechanism analysis of PNP degradation by Co-nZVI/GAC activated PS. The mechanism analysis of PNP degradation by PS started with Co-nZVI/GAC and includes a free radical mechanism and a non-free radical mechanism. Sulfate is formed under acidic conditions, and hydroxide is formed under alkaline conditions. In the activation process as a whole, the primary ions are Fe2+ and Fe3+, oxidized by Fe0. After the reaction had reached completion, some colloidal substances, which may have been Fe(OH)3, were found at the bottom of the brown bottle. The formula for the formation of Fe(OH)3 is as follows:
Fe2+ + S2O82− + 3OH = Fe(OH)3 + SO4. + SO42−

5. Conclusions

Co-nZVI/GAC nanocomposites were synthesized as catalysts to activate PS for the degradation of PNP in this experiment. According to XRD and XPS analysis, nano iron and cobalt were successfully supported by activated carbon. The results of SEM and EDS analysis revealed that particles of two metals were adsorbed at the surface of activated carbon and provided activation energy for PS activation. Co-nZVI/GAC was an effective catalyst for PNP degradation through the transfer of PNP to p-benzoquinone. From a kinetic point of view, the reaction rate constant was 1.3856/min−1, and the degradation rate of PNP reached 89.39% within six hours. When the concentration of PS was too high, the concentration of PS harmed the reaction. With an increase in catalyst dosage, the catalytic reaction speed was accelerated, with Kobs (h−1) increasing from 0.2431 to 0.4683. The initial degradation rate of PNP by Co-nZVI/GAC was 69.8%, and the degradation rate of the activated PS was 99.19%. The degradation rate of PNP decreased with an increase in the initial concentration, the reason being that the pH of the solution had changed, affecting the oxidation of the catalyst and competing with PS. Co-nZVI/GAC could be used up to four times, after which its catalytic function decreased sharply (at a concentration of 1.5 g/L). This is a practical routine analysis based on the degradation of p-benzoquinone by LC-MS. This study provides an effective method for the degradation of PNP by Co- nZVI/GAC-activated PS.

Author Contributions

J.Z. wrote the paper, L.C. conducted the experimental operation, and X.Z. polished and modified the paper. All authors have read and agreed to the published version of the manuscript.

Funding

This research was funded by the Jiangsu construction system science and technology project, grant number 2019ZD034; the key laboratory of Jiangxi province for persistent pollutants control and resources recycle, grant number ES201980193; the significant natural science research projects of colleges and universities in Jiangsu province, grant number 21KJA610006; and the industry-university research cooperation project of Jiangsu province, grant number BY2021562.

Data Availability Statement

Not applicable.

Conflicts of Interest

The authors declare no conflict of interest.

References

  1. Kitagawa, W.; Kimura, N.; Kamagata, Y. A Novel p-Nitrophenol Degradation Gene Cluster from a Gram-Positive Bacterium, Rhodococcus opacus SAO101. J. Bacteriol. 2004, 186, 4894–4902. [Google Scholar] [CrossRef] [Green Version]
  2. Li, H.; Meng, F.; Duan, W.; Lin, Y.; Sierra, J. Biodegradation of phenol in saline or hypersaline environments by bacteria: A review. Ecotoxicol. Environ. Saf. 2019, 184, 109658. [Google Scholar] [CrossRef] [PubMed]
  3. Hai, F.I.; Yamamoto, K.; Fukushi, K. Hybrid Treatment Systems for Dye Wastewater. Crit. Rev. Environ. Sci. Technol. 2007, 37, 315–377. [Google Scholar] [CrossRef]
  4. Shen, J.; Xu, X.; Jiang, X.; Hua, C.; Zhang, L.; Sun, X.; Li, J.; Mu, Y.; Wang, L. Coupling of a bioelectrochemical system for p-nitrophenol removal in an upflow anaerobic sludge blanket reactor. Water Res. 2014, 67, 11–18. [Google Scholar] [CrossRef] [PubMed]
  5. Chen, H.M.; Zheng, C.R.; Tu, C.; Zhu, Y.G. Heavy Metal Pollution in Soils in China: Status and Countermeasures. Ambio 1999, 28, 130–134. [Google Scholar]
  6. Tummala, S.; Lee, C.H.; Ho, Y.P. Boron, and nitrogen co-doped carbon dots as a multiplexing probe for sensing of p-nitrophenol, Fe (III), and temperature. Nanotechnology 2021, 32, 265502. [Google Scholar] [CrossRef]
  7. Jin, Z.; Hu, R.; HWang Hu, J.; Ren, T. One-step impregnation method to prepare direct Z-scheme LaCoO3/g-C3N4 heterojunction photocatalysts for phenol degradation under visible light. Appl. Surf. Sci. 2019, 491, 432–442. [Google Scholar] [CrossRef]
  8. Scott, T.; Zhao, H.; Deng, W.; Feng, X.; Li, Y. Photocatalytic degradation of phenol in water under simulated sunlight by an ultrathin MgO coated Ag/TiO2 nanocomposite. Chemosphere 2019, 216, 1–8. [Google Scholar] [CrossRef]
  9. Wai-Kay, S.; Lai, C.L.; Ip, P.; James, F.; Ka-Ho, W.D.; Chi-Hang, Y.J. A Large Population Histology Study Showing the Lack of Association between ALT Elevation and Significant Fibrosis in Chronic Hepatitis B. PLoS ONE 2012, 7, e32622. [Google Scholar]
  10. Lam, S.H.; Ung, C.Y.; Hlaing, M.M.; Hu, J.; Li, Z.H.; Mathavan, S.; Gong, Z. Molecular insights into 4-nitrophenol-induced hepatotoxicity in zebrafish: Transcriptomic, histological and targeted gene expression analyses. Biochim. Biophys. Acta (BBA)-Gen. Subj. 2013, 1830, 4778–4789. [Google Scholar] [CrossRef]
  11. Brillas, E.; Garcia-Segura, S. Benchmarking recent advances and innovative technology approaches of Fenton, photo-Fenton, electro-Fenton, and related processes: A review on the relevance of phenol as model molecule. Sep. Purif. Technol. 2020, 237, 116337. [Google Scholar] [CrossRef]
  12. West, L.E. Water Quality Criteria. Am. J. Public Health Nations Health 2011, 46, 1346. [Google Scholar]
  13. Wang, T.; Qu, G.; Sun, Q.; Liang, D.; Hu, S. Evaluation of the potential of p-nitrophenol degradation in dredged sediment by pulsed discharge plasma. Water Res. 2015, 84, 18–24. [Google Scholar] [CrossRef] [PubMed]
  14. Wang, J.; Wang, S. Activation of persulfate (PS) and peroxymonosulfate (PMS) and application for the degradation of emerging contaminants. Chem. Eng. J. 2018, 334, 1502–1517. [Google Scholar] [CrossRef]
  15. Li, Y.; Baghi, R.; Filip, J.; Islam, S.; Hope-Weeks, L.J.; Yan, W. Activation of Peroxydisulfate by Ferrite Materials for Phenol Degradation. ACS Sustain. Chem. Eng. 2019, 7, 8099–8108. [Google Scholar] [CrossRef]
  16. Vansek, P. Electrochemical Series. In Handbook of Chemistry and Physics; CRC Press: Boca Raton, FL, USA, 2012. [Google Scholar]
  17. Yi, D.A.; Zl, A.; Wei, J.; By, A.; Th, A.; Lw, B. Degradation of phenol using a peroxidase mimetic catalyst through conjugating deuterohemin-peptide onto metal-organic framework with enhanced catalytic activity. Catal. Commun. 2019, 134, 105859. [Google Scholar]
  18. Matzek, L.W.; Carter, K.E. Activated persulfate for organic chemical degradation: A review. Chemosphere 2016, 151, 178–188. [Google Scholar] [CrossRef] [PubMed]
  19. Al-Shamsi, M.A.; Thomson, N.R.; Research, E.C. Treatment of Organic Compounds by Activated Persulfate Using Nanoscale Zerovalent Iron. Ind. Eng. Chem. Res. 2013, 52, 13564–13571. [Google Scholar] [CrossRef]
  20. Tang, L.; Tang, J.; Zeng, G.; Yang, G.; Xie, X.; Zhou, Y. Rapid reductive degradation of aqueous p-nitrophenol using nanoscale zero-valent iron particles immobilized on mesoporous silica with enhanced antioxidation effect. Appl. Surf. Sci. 2015, 333, 220–228. [Google Scholar] [CrossRef]
  21. Elliott, D.; Li, X.; Zhang, W. Zero-valent Iron Nanoparticles for Abatement of Environmental Pollutants. Part. Syst. Nano-Biotechnol. 2008, 31, 111–122. [Google Scholar]
  22. Shiva, M.; Atashi, H.; Tabrizi, F.F.; Mirzaei, A.A. Kinetic modeling of Fischer–Tropsch synthesis on bimetallic Fe–Co catalyst with phenomenological based approaches. J. Ind. Eng. Chem. 2012, 18, 1112–1121. [Google Scholar] [CrossRef]
  23. Wang, G.; Chen, S.; Quan, X.; Yu, H.; Zhang, Y. Enhanced activation of peroxymonosulfate by nitrogen doped porous carbon for effective removal of organic pollutants. Carbon 2017, 115, 730–739. [Google Scholar] [CrossRef]
  24. Schrick, B.; Hydutsky, B.W.; Blough, J.L.; Mallouk, T.E. Delivery Vehicles for Zerovalent Metal Nanoparticles in Soil and Groundwater. Chem. Mater. 2004, 16, 2187–2193. [Google Scholar] [CrossRef]
  25. Liang, J.; Hassan, M.; Zhu, D.; Guo, L.; Bo, X. Cobalt nanoparticles/nitrogen-doped graphene with high nitrogen doping efficiency as noble metal-free electrocatalysts for oxygen reduction reaction. J. Colloid Interface Sci. 2017, 490, 576–586. [Google Scholar] [CrossRef] [PubMed]
  26. Kong, X.; Han, Z.; Wei, Z.; Le, S.; Hui, L. Synthesis of zeolite-supported microscale zero-valent iron for the removal of Cr6+ and Cd2+ from aqueous solution. J. Environ. Manag. 2016, 169, 84–90. [Google Scholar] [CrossRef] [PubMed]
  27. Cao, Z.; Liu, X.; Xu, J.; Zhang, J.; Yang, Y.; Zhou, J. Removal of Antibiotic Florfenicol by Sulfide-Modified Nanoscale Zero-Valent Iron. Environ. Sci. Technol. 2017, 51, 11269. [Google Scholar] [CrossRef]
  28. Long, D.A. Infrared and Raman characteristic group frequencies. Tables and charts. George Socrates. J. Raman Spectrosc. 2010, 35, 905. [Google Scholar] [CrossRef]
  29. Ying, W.; Wu, H.; Yu, A.; Wen, D. Biodegradable Polylactide/Chitosan Blend Membranes. Biomacromolecules 2006, 7, 1362–1372. [Google Scholar]
  30. Puziy, A.M.; Poddubnaya, O.I.; Martínez-Alonso, A.; Suárez-García, F.; Tascón, J. Surface chemistry of phosphorus-containing carbons of lignocellulosic origin. Carbon 2005, 43, 2857–2868. [Google Scholar] [CrossRef]
  31. Singh, P.; Raiza, P.; Kumari, S.; Kumar, A.; Thakur, P. Solar-Fenton removal of malachite green with novel Fe0-activated carbon nanocomposite. Appl. Catal. A Gen. 2014, 476, 9–18. [Google Scholar] [CrossRef]
  32. Gao, J.; Han, D.; Xu, Y.; Liu, Y.; Shang, J. Persulfate activation by sulfide-modified nanoscale iron supported by biochar (S-nZVI/BC) for degradation of ciprofloxacin. Sep. Purif. Technol. 2019, 235, 116202. [Google Scholar] [CrossRef]
  33. Arsalanfar, M.; Mirzaei, A.A.; Atashi, H.; Bozorgzadeh, H.R.; Vahid, S.; Zare, A. An investigation of the kinetics and mechanism of Fischer–Tropsch synthesis on Fe–Co–Mn supported catalyst. Fuel Processing Technol. 2014, 20, 2166–2173. [Google Scholar] [CrossRef]
  34. Wang, C.; Xu, Z.; Ding, G.; Wang, X.; Zhao, M.; Ho, S.S.H. Comprehensive study on the removal of chromate from aqueous solution by synthesized kaolin supported nanoscale zero-valent iron. Desalination Water Treat. 2016, 57, 5065–5078. [Google Scholar] [CrossRef]
  35. Zhang, W.; Zhou, S.; Sun, J. Impact of Chloride Ions on UV/H2O2 and UV/Persulfate Advanced Oxidation Processes. Environ. Sci. Technol. 2018, 52, 7380–7389. [Google Scholar] [CrossRef]
  36. Tang, J.; Tang, L.; Feng, H.; Zeng, G.; Dong, H.; Zhang, C. pH-dependent degradation of p-nitrophenol by sulfidated nanoscale zerovalent iron under aerobic or anoxic conditions. J. Hazard. Mater. 2016, 320, 581–590. [Google Scholar] [CrossRef]
  37. Dong, H.; Zhang, C.; Deng, J.; Jiang, Z.; Zhang, L.; Cheng, Y. Factors influencing degradation of trichloroethylene by sulfide-modified nanoscale zero-valent iron in aqueous solution. Water Res. 2018, 135, 1–10. [Google Scholar] [CrossRef]
  38. Wang, W.; Wang, J.; Guo, Y.; Zhu, C.; Pan, F.; Wu, R. Removal of multiple nitrosamines from aqueous solution by nanoscale zero-valent iron supported on granular activated carbon: Influencing factors and reaction mechanism. Sci. Total Environ. 2018, 639, 934. [Google Scholar] [CrossRef]
  39. Tang, L.; Wang, J.; Zeng, G.; Liu, Y.; De Ng, Y.; Zhou, Y. Enhanced photocatalytic degradation of norfloxacin in aqueous Bi2WO6 dispersions containing nonionic surfactant under visible light irradiation. J. Hazard. Mater. 2016, 306, 295–304. [Google Scholar] [CrossRef]
  40. Yuan, S.; Meng, T.; Cui, Y.; Lin, L.; Lu, X. Treatment of nitrophenols by cathode reduction and electro-Fenton methods. J. Hazard. Mater. 2006, 137, 573–580. [Google Scholar] [CrossRef]
Figure 1. Redox potential of various substances.
Water 14 01387 g001
Figure 2. Preparation device of nZVI based materials.
Water 14 01387 g002
Figure 3. SEM of Co-nZVI/GAC before reaction.The sample is magnified 5000 times (a), The sample is magnified 10,000 times (b), The sample is magnified 20,000 times (c), The sample is magnified 50,000 times (d).
Water 14 01387 g003
Figure 4. EDS spectra of Co-nZVI/GAC, and SEM images of different positions on the right.
Water 14 01387 g004
Figure 5. XRD analysis of Co-nZVI/GAC.
Water 14 01387 g005
Figure 6. Full XPS of Co-nZVI /GAC reaction spectra (a,b) before and after Co-nZVI/GAC reaction; The narrow sweep spectra of Fe 2p before and after the reaction (c,d). The narrow scan patterns of Co before and after the reaction (e,f).
Water 14 01387 g006aWater 14 01387 g006b
Figure 7. Infrared spectra of GAC, nZVI, and Co-nZVI/GAC.
Water 14 01387 g007
Figure 8. Effect of PS dosage on degradation curve and linear fitting. PNP degradation curves with different PS concentrations (a), Dynamic fitting curve (b).
Water 14 01387 g008
Figure 9. Effect of Co-nZVI/GAC dose on degradation curve and linear fitting. PNP degradation curves with different Co-nZVI/GAC Dosage (a), Dynamic fitting curve (b).
Water 14 01387 g009
Figure 10. Effects of different systems and linear fitting, (a) Degradation curves of PNP by different system materials, (b), Dynamic fitting curve (c).
Water 14 01387 g010aWater 14 01387 g010b
Figure 11. Effect of initial PNP concentration and linear fitting. PNP degradation curves with different initial concentrations (a), Dynamic fitting curve (b).
Water 14 01387 g011
Figure 12. Scatter plot of pH effect on PNP removal.
Water 14 01387 g012
Figure 13. Effect of repeated use of catalyst materials on PNP removal.
Water 14 01387 g013
Figure 14. Kinetics fitting curve of PNP degradation by Co-nZVI/GAC activated PS.
Water 14 01387 g014
Figure 15. Infrared spectra of Co-nZVI/GAC activated PS before and after PNP degradation reaction.
Water 14 01387 g015
Figure 16. SEM of Co-nZVI/GAC after reaction.The sample is magnified 5000 times (a), The sample is magnified 10,000 times (b), The sample is magnified 20,000 times (c), The sample is magnified 50,000 times (d).
Water 14 01387 g016
Figure 17. Analysis of degradation process of PNP by Co-nZVI/GAC.
Water 14 01387 g017
Figure 18. Mechanism analysis of PNP degradation by Co-nZVI/GAC activated PS.
Water 14 01387 g018
Table 1. Specific surface areas of different materials.
MaterialsBET/(m2·g−1)Pore Volume/(mL·g−1)Aperture (nm)
GAC557.120.281.02
nZVI97.250.051.12
Co-nZVI51.850.021.10
Co-nZVI/GAC482.610.251.01
Table 2. Fitting parameters of kinetics equation of PNP adsorption by Co-nZVI/GAC activated PS.
ModelPseudo First-Order KineticsPseudo Second-Order Kinetics
Equation q t = q e ( 1 e k 1 t ) q t = t k 2 q e 2 1 + q e t k 2
Parameterqe/(mg·g−1)k1/(min−1)R2qe/(mg·g−1)k2/(g·mg−1·min−1)R2
Co-nZVI/GAC0.96311.38560.76250.97642.28120.9022
Publisher’s Note: MDPI stays neutral with regard to jurisdictional claims in published maps and institutional affiliations.

