Article

Comparison of Adsorptive Removal of Fluoride from Water by Different Adsorbents under Laboratory and Real Conditions

by
Agostina Chiavola
*,
Emilio D’Amato
and
Camilla Di Marcantonio
Faculty of Civil and Industrial Engineering, Department of Civil, Building and Environmental Engineering, Sapienza University of Rome, 00184 Rome, Italy
*
Author to whom correspondence should be addressed.
Water 2022, 14(9), 1423; https://doi.org/10.3390/w14091423
Submission received: 15 March 2022 / Revised: 22 April 2022 / Accepted: 24 April 2022 / Published: 29 April 2022
(This article belongs to the Special Issue Advanced Technologies and Materials for Polluted Water Remediation)

Abstract

:
The fluoride removal capability of six different adsorbents (four commercial, i.e., titanium dioxide-TiO2, ArsenXPnp-A33E, granular activated carbon (GAC) and granular ferric hydroxide (GFH), and two laboratory media, i.e., nano-fine media and nano-granular media) was determined under batch conditions using synthetic and real contaminated water containing arsenic and vanadium. The kinetic and equilibrium characteristics of the adsorption process under different operating conditions (pH value, initial fluoride concentration, adsorbent dosage, water composition) were obtained. Among the tested adsorbents, TiO2 showed the highest adsorption capacity; it was also capable of reducing fluoride concentration below the limit set for drinking water without pH control. TiO2 still remained the best adsorbent in the treatment of real contaminated groundwater, where it was also capable of efficiently removing both arsenic and vanadium. The other adsorbents were capable of achieving the same fluoride reduction, although only for acid pH. The nano-sized laboratory media showed an adsorption removal efficiency below that of TiO2 but superior to that of A33E, GAC and GFH. Among the investigated parameters, the removal efficiency was mainly affected by adsorbent dosage and pH. The pseudo-second order model best fitted the kinetic experimental data of all the media. The maximum adsorption capacity predicted by this model was in the following decreasing order: TiO2 > A33E > GAC > GFH. The removal capability of all the media drastically decreased due to the presence of competitive ions and unfavorable pH conditions. The best isotherm model changed depending on the type of adsorbent and pH conditions.

1. Introduction

Fluorine is the most chemically reactive and electronegative of all the elements, and it readily forms compounds with most of them. Small amounts of fluorine are naturally present in water, air, plants and animals. Consequently, humans are exposed to fluorine through food and drinking water and by breathing air. The element is essential for the maintenance of solidity of human bones and can also protect from dental decay. However, if fluorine is absorbed too frequently, it can cause teeth decay, osteoporosis and harm to kidneys, bones, nerves and muscles [1,2].
In aqueous solution, fluorine commonly occurs as fluoride ion F. Dissolution of fluoride-containing minerals, such as igneous and sedimentary rocks, results in notably elevated concentrations in nearby groundwater [3]. Furthermore, there are also many anthropogenic sources of contamination since inorganic fluoride is used in various industries, including aluminum, steel, glass, enamel, brick, fluorinated chemical, phosphate fertilizer, metal-casting, welding and brazing [4].
Due to its potential health hazard, the World Health Organization (WHO) has recommended a guideline daily intake of 1.5 mg/L through drinking water. This recommendation was then adopted by the European Directive 1998/83/EC, which reduced the standard limit of fluoride to 1.5 mg/L [5]. This concentration was confirmed in the last update of the drinking water directive, i.e., European Union Directive 2020/2184/EC [6]. The Italian regulation adopted the new standard in the D. Lgs. 31/2001 [7].
Several countries (e.g., parts of India, Africa, China, and Europe) are supplied by sources naturally containing concentrations above this limit, which place the communities at risk of dental and skeletal fluorosis or even more hazardous effects [8,9,10].
Therefore, it is quite urgent to implement, in these areas, an efficient, robust and affordable technology for the removal of excess fluoride from drinking water to reduce its concentration below the WHO guideline level. Several defluoridation techniques were tested for this purpose, such as adsorption [11], precipitation, dialysis and electrodialysis, nanofiltration and reverse osmosis [12], coagulation, and electro-coagulation [13,14]. All these techniques consist of a separation process and, apart from adsorption, present a main drawback represented by the production of a vast amount of sludge containing undesirable components, which need proper treatment and disposal. Furthermore, in the case of membrane separation processes, the severe fouling highly affects the operating costs [12]. Adsorption was demonstrated to be the preferable method under most conditions [15]. It represents a simple method for reducing excess fluoride from drinking water and entails less drawbacks with respect to the other techniques. A high number of adsorbents has been used for defluoridation, e.g., from natural sources (such as those derived from various biomasses), natural alternatives (such as clay-type minerals) and industry produced (e.g., activated carbon) [15,16,17,18].
The removal efficiency of each adsorbent is a function of many factors, such as chemical–physical properties, selectivity, stability and regeneration [12]. Stability is needed against aggregation and chemical transformations due to storage, safe handling and safe use [18]. Characteristics of surface such as charge, functional groups and presence of chemical elements also have influence on defluoridation capability. For instance, cations on the adsorbent surface may react with fluoride anions to form precipitates and drive an easier removal. The point of zero charge pH (pHpzc) determines how easily a substrate can adsorb the ions present in solution. Therefore, modification of adsorbents with multivalent cations was used to enhance the surface properties of the adsorption materials and their affinity for fluoride. As an example, modified/impregnated/coated alumina showed more potential for fluoride adsorption than unmodified alumina. Layered double hydroxides (LDHs) have also been studied for their fluoride adsorption potential. The structure of LDHs consists of positively charged hydroxide sheets. When fluoride is removed from aqueous solution by LDHs, the adsorption probably occurs primarily in response to Coulomb attractions between the anionic adsorbent and the positively charged external and interlayer surfaces of LDHs. The ion exchange between anions in the adsorbent and fluoride anions in water may also be another mechanism. This was the case for the Fe–Mg–La tri-metal composite, which performed well due to ion exchange between sulphate anions in the adsorbent and fluoride anions in water [18].
Beside all these factors, the behavior under real operating conditions can differ with respect to the laboratory application because of the more complex composition of the water solution [15]. Furthermore, the co-occurrence of fluoride with other pollutants of concern is quite diffused, e.g., in Italy, Europe and Latin American regions, because they arise from the same natural leaching processes of rocks [19,20,21]. Their presence together in the same solution can hinder the achievement of the required removal of all the contaminants; thus, it can cause more severe health effects [22]. It is suggested that the practical utility of any adsorbent should also be tested with real contaminated water prior to the implementation in a full-scale plant. Furthermore, it is clear that the most suitable adsorbent must be selected case by case.
In the present study, the fluoride removal capability of six adsorbents in the water environment was evaluated under different operating conditions. Four of these media, i.e., TiO2, A33E, GFH and GAC, are commercial, whereas the other two, NMF and NMG, are laboratory made. This paper presents several aspects of novelty with respect to the past literature on fluoride adsorption. First, it focuses on a higher number of adsorbent types, whereas previous studies often considered only one or a few adsorbents. Furthermore, the six media selected for the present study are characterized by different composition, size, specific surface and manufacture process; therefore, this investigation provides important data on how these properties can influence defluoridation efficiency. The investigation also considered the effects of different parameters on the adsorption process, such as adsorbent dosage, initial fluoride concentration, pH, and competitive anions. Furthermore, in a previous study carried out by the research group, the same media showed high removal efficiency for arsenic and vanadium in drinking water. Among them, TiO2 and A33E provided higher efficiency and faster kinetics, whereas nano-sized laboratory media reached the same removal, although at a slower rate. With respect to the commercial media, the nano-sized adsorbents offer the additional advantage of easily separating from the treated liquid due to the magnetic core. Therefore, it was decided to investigate, in the present study, the removal efficiency of the same adsorbents with respect to fluoride, which is commonly present above the limit for drinking water along with arsenic and/or vanadium. The final aim was to find out the best adsorbent for the removal of these common contaminants of concern present in drinking water.

2. Materials and Methods

2.1. Adsorbents

Six different adsorbents were used in the present experimental study, namely: GFH, GAC, TiO2, A33E, NMF and NMG. Table 1 lists the main properties, composition and characteristics of the media, as obtained by their technical sheets or determined experimentally. Particularly, the first four adsorbents were purchased, whereas NMF and NMG were produced internally in the laboratory with two different particle sizes [23].
These adsorbents were chosen for the study based on their composition and past research by the same group on arsenic and vanadium removal from drinking water.
A33E (ArsenXnp as commercial name) is a nano-particle-based selective resin designed to remove arsenic (arsenate and arsenite) from water. It combines a unique chemistry based on hydrous iron oxide nanoparticles that have a high affinity for arsenic with a durable, non-friable, spherical polymer substrate.
Activated carbon (GAC) is a carbon-based adsorbent; it has a relatively small adsorption capacity as well as a low affinity for inorganic pollutants, but it is widely present in water treatment plants.
TiO2 (13463-67-7 as CAS number, chemical formula TiO2) was purchased by Sigma Aldrich. TiO2 particle has become a promising material to adsorb arsenic and fluoride ions because of its low cost, non-toxic, good chemical stability and good sorption ability. Furthermore, TiO2 is an efficient photocatalyst.
Granular ferric hydroxide (GFH) was chosen since iron has a high affinity to arsenic. Adsorption is attributed to the interaction of fluoride with singly coordinated FeOH surface groups, with the adsorption mechanism being described as an exchange reaction against OH of surface groups.
Regarding NMF and NMG, they were produced with the aim to combine the properties of the best adsorbents for fluoride, arsenic and vanadium, based on previous research. For instance, a rapid arsenic reduction below the limit concentration for drinking water (i.e., 10 μg/L) was achieved by using iron-based magnetic nanoparticles [24]. Furthermore, this type of particle overcomes the problem of separation of powder adsorbents in aqueous solution, since a safe and easy removal can be achieved by using magnetic traps. The coating was functionalized with titanium dioxide to specifically eliminate the target pollutants (Chiavola et al., 2017). The SiO2 core shell was allowed to electrically isolate the core from ambient conditions to avoid degradation.
The detailed preparation process of NMF and NMG is reported in Chiavola et al. (2017). In summary, the core-shell SiO2/Fe3O4 nanoparticles (FM) were produced by using a spinning disk reactor. Nanoparticles were prepared by dispersing Fe3O4 particles in distilled water, followed by the addition dropwise of Tetraethyl ortosilicate (TEOS), preliminarily diluted in C2H5OH (Sigma Aldrich). Then, an aqueous solution of NH3 (30 wt %) was added, and TEOS hydrolysis and condensation were allowed under overnight gentle stirring. The obtained particles (FM) were washed in a centrifuge using first water/ethanol mixtures, and then distilled water. Finally, they were dried and calcinated at 450 °C for 30 min (ramp 10 °C/min). TiO2 coating was achieved by adding 8.98 g of SiO2/Fe3O4 (FM) to water and placing it in the sonicator for 5 min with 8 g of titanium isopropoxide (TTIP). After 10 min of mechanical mixing, the mixture was centrifuged and then washed two times. Finally, it was calcinated at 450 °C for 45 min (ramp of 10 °C/min). NMF and NMG had the same composition and differed only in particle size as reported in Table 1.
All the adsorbents were used without any conditioning or pretreatment. They were only rinsed with deionized water to eliminate any impurity. Then, they were dried at T = 60 °C for 12 h and finally stored until their use.

2.2. Adsorption Kinetic Experiments

Kinetics of the adsorption process of fluoride on the adsorbents were determined by using the conventional batch technique. For the experimental runs, the initial fluoride concentrations were set at C0 = 2.5, 5.0 and 10.0 mg/L in order to simulate a real case of contaminated groundwater used for drinking water supply as commonly found (e.g., as in the Lazio Region, Italy) [19,20]. A stock solution at 2 g/L F was prepared by dissolving a known amount of the KF salt in deionized water. This solution was then properly diluted to make the concentrations chosen for the experimental tests. Each adsorbent was tested at the following dosages: mass/volume = M/V = 1, 5, 10 g/L.
An effective contact between adsorbent and fluoride ions was assured by using a jar tester (ISCO, Novatech International) with the mixer rotating speed fixed at 180 rpm. Glass beakers of volume, V = 1 L were used. Periodical sampling of the liquid solution was performed until the equilibrium conditions of the mass transfer process (te = 24 h) were reached; each sample was then filtered by using a 0.2 μm glass fiber filter and the liquid phase analyzed to measure the residual fluoride concentration. The adsorption capacity of the adsorbents at any time t, Q, representing the mass of F adsorbed per unit mass of adsorbent, was calculated by the following equation:
Q t = V ( C 0 C t ) M
where C0 and Ct represent the fluoride concentrations in the liquid solution at the beginning of the test (i.e., at t = 0) and at any time t during the test, V is the liquid volume, and M indicates the mass of adsorbent added to each batch. At equilibrium (t = te), the adsorption capacity was represented as Qe, whereas the equilibrium concentration in solution was Ce.
Temperature was always maintained at T = 25 ± 2 °C. All experiments were repeated at least two times, and the data were averaged. The pH value of the solution was monitored by using a pH meter with a standard probe (HI-8418 model by Hanna Instrument).
A first series of experiments was conducted with synthetic water. The initial pH of the synthetic water was slightly below 7. Then, it could freely change depending on the specific environmental conditions. No buffer/background electrolyte was used in order to evaluate the defluoridation capability without any possible disturbance due to other ions.
A second series of experiments was run using real samples of contaminated groundwater collected at a well located in the central Lazio Region, having the following average concentrations of the main elements: 2.4 mg/L F, 9.8 mg/L Cl, 6.4 mg/L SO42−, 0.023 mg/L As, 0.064 mg/L V. In the real samples, arsenic and fluoride were both present at a concentration above their limits set for drinking water (for arsenic equal to 10 μg/L according to EU Directive 98/83/EC and Italian D. Lgs. 31/2001). Among the 6 adsorbents used with the synthetic solution, this series of tests was conducted using only TiO2, A33E and GFH, since they are reported to possess a high removal capability versus arsenic in liquid solutions [21,25,27,28,29,30,31]. Under real conditions of application, there would be the need to reduce both fluoride and arsenic concentrations below the respective limits. In this series of experiments, two solid/liquid ratios were used, i.e., M/V = 1 and 5 g/L. The pH value was not modified with respect to the initial value (equal to ≅8), in order to simulate the naturally occurring conditions of the adsorption process.
A third series of experiments was carried out using synthetic samples and maintaining the pH at fixed values: 4, 6 and 8. pH adjustment was carried out through the addition of 0.1 M HCl or 0.1 M NaOH.
Table 2 lists the main operating conditions of all the series of adsorption kinetic tests.
The results obtained by the experimental kinetic tests were fitted by the following models: zero, first, second, saturation, pseudo-first, pseudo-second-order, Weber and Morris model and Bangham model. The best-fitting model was found as that providing the higher value of the correlation coefficient (R2) between the experimental and the model-predicted data, using the linearized form of the representative equation. Then, the values of the kinetic constants of the models were calculated. Table 3 shows the nonlinear and linear forms of the kinetic models used for fitting [32].

2.3. Adsorption Isotherm Experiments

The isotherms of the adsorption process with the different materials were determined by using the jar tester at the following conditions: M/V = 1–5 g/L, C0 = 2.5–5.0–10 mg/L. The contact time between solid and liquid phases was fixed at te = 24 h. The tests were run under initial pH values and repeated under the same conditions at fixed pH equal to 4, 6 and 8 (through the addition of chemicals as highlighted above). Table 4 shows the operating conditions applied to adsorption isotherm experiments. At the end of the contact time, a sample was collected from each beaker, filtered at 0.20 μm and then analyzed to measure the residual content of F (i.e., equilibrium concentration, Ce). Then, the mass of contaminant transferred by adsorption per unit weight of adsorbent at equilibrium (i.e., the adsorption capacity), Qe, was calculated by applying Equation (1). The results from the isotherm experiments were fitted by the Freundlich, Langmuir, Brunauer–Emmett–Teller (BET) and Temkin models [21] (Table 5). The best-fitting model was considered as one providing the higher value of the correlation coefficient (R2) between the experimental and model-predicted data using the linearized form of the representative equation. Once the best model was found, the values of the model coefficients were calculated.
The experiments were repeated at least two times, and the data were averaged.

2.4. Analytical Methods

All reagents were of analytical grade and were used without any further purification.
Fluoride concentration in the liquid phase was determined by using the Model 761-IC Ion Chromatography system with a DualOne column (Metrohm). Calibration curves were built using standard solutions within the range of concentration 0–8 mg/L. The limit of quantification was 0.2 mg/L. Each sample measurement was repeated at least two times in order to ensure accuracy. The maximum standard deviation was found to be within ±3%.

3. Results and Discussion

3.1. Adsorption Kinetics and Modeling

3.1.1. Synthetic Samples and Initial pH

Figure 1 shows the results of the adsorption kinetic tests performed without pH control using all the adsorbent media listed in Table 1, at increasing initial fluoride concentration and dosage. All the tests provided a similar pattern of the specific adsorption capacity versus time, Q(t): a rapid removal at the beginning of the tests was always observed, followed by a rather constant slope profile until the end. However, the removal efficiency and equilibrium time were different depending on the type of adsorbent. Particularly, Figure 1a highlights the time profile of GAC, GFH, A33E and TiO2 at M/V = 1 g/L and initial fluoride concentration C0 = 2.5 mg/L. The removal process from the liquid solution always reached the equilibrium state for a contact time below 8 h. The highest and lowest values of the removal percentage were achieved by TiO2 and GFH, respectively. At t = 7 h, the removal efficiency was equal to 5.80%, 16.90%, 29.20% and 75.70% for GFH, GAC, A33E and TiO2, respectively. TiO2 was the only adsorbent capable of reducing F concentration to a value (i.e., 0.42 mg/L) below the limit set for drinking water use (i.e., 1.5 mg/L as established by the law in force) within the time frame of the test. Increasing the specific adsorbent dosage to M/V = 5 g/L significantly enhanced the removal rate and efficiency, as shown in Figure 1b: at t = 7 h, the efficiency was 14.60%, 35.20%, 50.40% and 98.10% for GFH, GAC, A33E and TiO2, respectively. Both TiO2 and A33E were able to reduce fluoride concentration below the limit of 1.5 mg/L by the end of the test: the equilibrium concentrations were equal to 0.04 and 1.16 mg/L, respectively. Beside the higher removal, TiO2 also carried out the fastest adsorption process, with the equilibrium time being achieved in less than 1 h.
When the initial fluoride concentration was increased to C0 = 5.0 mg/L and the dosage was maintained at M/V = 1 g/L (as shown by Figure 1c), removal efficiency was 6.80%, 39.60%, 26.90% and 64.10% for GFH, GAC, A33E and TiO2, respectively. None of the media were capable of reducing the concentration below the drinking water limit. When the dosage was increased to M/V = 5 g/L and the concentration maintained at 5.0 mg/L, TiO2 achieved a final concentration of 0.19 mg/L. The other adsorbents were unable to comply with the limit (as highlighted by Figure 1d). At the highest initial F concentration of 10 mg/L (as shown by Figure 1e), the removal efficiency at M/V = 1 g/L dosage was 0.04%, 5.30%, 20.90% and 47.60% for GFH, GAC, A33E and TiO2, respectively. None of the media were able to reach the required target. Increasing the dosage to 5 g/L produced a significant improvement in the efficiency for all adsorbents (as shown by Figure 1f): the final values were 0.30%, 26.0%, 37.90% and 94.30% for GFH, GAC, A33E and TiO2, respectively. Akin to the observation made at the lower fluoride concentrations, the higher dosage of M/V = 5 g/L more beneficially impacted the adsorption capacity of TiO2, which became the only adsorbent capable of reaching a final concentration (equal to 0.6 mg/L) below the maximum allowable concentration. At such a high fluoride concentration, a third and higher dosage was also tested, equal to M/V = 10 g/L. The efficiency at t = 7 h reached the values of 11.50%, 29.50%, 43.70% and 96.90% for GFH, GAC, A33E and TiO2, respectively (as seen in Figure 1g). Although appreciable improvement was achieved, only TiO2 led to a final concentration below 1.5 mg/L.
As far as the nanomaterials are concerned, their application at M/V = 1 g/L and C0 = 2.5 mg/L resulted in the same adsorption capacity trend as that shown by the commercial adsorbents: a rapid initial increase followed by a rather constant profile until the end of the test. Between them, NMF showed a higher adsorption capacity with a final efficiency of 69.84%, which corresponded to a concentration of 0.73 mg/L F−. This result brings NMF to a position lower than TiO2 but superior to the other adsorbents. By contrast, the adsorption capacity of NMG was much lower with respect to all: the final efficiency and concentration were 42.94% and 1.56 mg/L, respectively (as seen in Figure 1h).
The results obtained by the different adsorbents can be analyzed and explained as follows.
Activated carbon has been reported by several authors to have a relatively small adsorption capacity for fluoride and many other inorganic pollutants [15]. The low removal capacity is explained by the limited affinity between active sites on the adsorbent and metal molecules. To overcome these difficulties, recent investigations have focused on modifying activated carbons with various chemical species [15]. In the present study, activated carbon was chosen since it is widely diffused in the full-scale adsorption plants being efficient for the removal of a wide spectrum of pollutants.
Iron-based materials, such as GFH, have been extensively studied for defluoridation, due to the affinity of iron for F. It has been also widely applied to arsenic removal in the treatment of drinking water sources [19,21]. The adsorption onto GFH is attributed to the interaction of fluoride with singly coordinated FeOH surface groups, with the adsorption mechanism being described as an exchange reaction against OH of surface groups [33]. However, in the present applications, the adsorption capacity of GFH resulted to be small. This might be due to the unfavorable pH of the solutions, which without any control, was around 7, whereas the adsorption capacity of GFH is reported to be stable at a lower pH [28]. At pH > 6, fluoride removal decreases as a result of stronger competition from hydroxide ions on the adsorbent surface. The decrease is particularly sharp above pH = 8, as the surface charge becomes more negative. Hence, fluoride ions would have to overcome electrostatic forces, as there would be a higher density of negative charges near the surface and hence a greater electrostatic repulsion [28].
A33E is a proprietary hybrid ion exchange resin designed for selective removal of arsenic from water, and it is commercially known as FerrIX A33E. This highly porous anion resin is infused with iron oxide to allow for a fast and efficient adsorption of arsenic. In the process, arsenic adsorbs onto the iron oxide to create larger particles that can be filtered out of the water stream [34]. This adsorbent was included within the tested media in the framework of a combined treatment of arsenic- and fluoride-contaminated water sources, which are quite spread worldwide. The technical sheet informs that the adsorption capacity is lower at increasing pH; phosphate, silica and vanadium also negatively affect the removal efficiency by competing for the exchange sites.
Previous experiments by the same research group investigating arsenic removal capability of this hybrid media showed that it was superior to the iron oxide-based adsorbent under the selected operating conditions in the column plant application: it offered higher adsorption capacity at the breakthrough time and, after exhaustion, it could be regenerated for a certain number of cycles [25].
In the present study, the defluoridation achieved by A33E was always lower than that of TiO2, while it was superior to that of GFH and GAC. The pH level cannot be considered as responsible for the lower performance since it remained approximately at around 6.6, which is not considered particularly unfavorable.
NMF combines the advantages of a TiO2 coating, which infers a high affinity to fluoride, with the nano-size of the particles that improves the surface area, reactivity, isolation properties and selectivity for pollutants [35]. Furthermore, with respect to most of the commercial adsorbents such as those tested in the present study, NMF offers a further and important advantage: they can be easily separated from the treated liquid solution by using simple magnets [36]. The results of the kinetic experiments showed an adsorption capacity of NMF lower than that of TiO2 while higher than GFH, A33E and GAC under the same experimental conditions. Therefore, the NMF adsorbent can be considered as a good alternative to the commercial media. Different from NMF, the removal by NMG was not relevant, although the two nano-adsorbents have the same base composition; the lower efficiency of NMG was likely due to the higher particle size, which determined a lower contact surface between fluoride ions and active sites.
Different titanium-based adsorbents have been tested for fluoride removal. Gel-like titanium hydroxide-derived from titanium oxysulfate, TiO(SO4), was reported to exhibit high adsorption potential, even at low fluoride concentrations, and to have selectivity for fluoride ions with coexisting chloride, nitrate and sulphate ions.
The electrostatic interactions play an important role in fluoride removal by TiO2, and the hydroxyl groups on the adsorbent surface are involved in fluoride adsorption. Particularly, at a pH below the zero point of zeta potential (around 6), the adsorbent surface is positively charged and favorable for fluoride sorption. Therefore, the high sorption capacities of fluoride at low pH are related to the electrostatic attraction between the positive adsorbent and anionic fluoride. It was reported that maximum fluoride sorption occurred at a pH close to 3, and the adsorbent was able to remove fluoride in real water to below 0.8 mg/L [37,38]. These results could be interpreted with regard to the solubility of hydrous titanium. According to the equilibrium calculation of solubility, the formation of Ti(OH)22+ and Ti(OH)3+ occurs in the region of pH ≤ 2, the neutral species Ti(OH)4 (aqueous) coexist with Ti(OH)22+ and Ti(OH)3+ at about pH 3, and Ti(OH)4 (aqueous) is formed dominantly by hydrolysis of Ti(IV) in the region of 4 ≤ pH ≤ 10. Ti(OH)4 (aqueous) is a metastable form with active adsorption characteristics of the fluoride ion. Decreasing adsorption at pH < 3 can be explained by the change from Ti(OH)4 (aqueous) to Ti(OH)22+ and Ti(OH)3+. In addition, because HF is weakly ionized (pKa = 3.2) in solution at low pH values, the corresponding uptake of fluoride is reduced since a fraction of fluoride becomes unavailable for adsorption. In the region of pH > 3, with increasing pH of the solution, the concentration of hydroxyl ions in the solution increases to occupy the adsorption site for anion species in a metastable Ti(OH)4. Therefore, the maximum adsorption of fluoride ions on the adsorbent was found at about pH 3 [36].
In the present study, titanium dioxide always outperformed with respect to the other tested adsorbents. Different from the other tested adsorbents, after the addition of TiO2, the pH of the liquid solution rapidly dropped to acidic values (around 5), which is favorable for the fluoride adsorption process.
Based on these results, it can be concluded that a common behavior was present with all the adsorbents: fluoride removal efficiency increased with the adsorbent dosage due to the higher availability of fluoride-binding sites. Conversely, the specific adsorption capacity decreased with increasing dose. This behavior is well highlighted by the curves of Figure 2, which represent the adsorption capacity (Qads) and removal efficiency (%R) as a function of the adsorbent dose in the case of TiO2. This graph highlights that there was a threshold dose equal to about M/V = 5 g/L beyond which no significant change was achieved in the percentage removal of fluoride. Therefore, to maintain a maximum capacity along with a high removal efficiency, the surface loading (i.e., the mass ratio of fluoride to adsorbent dose) should be set at a lower value than this threshold. At such a dose, the corresponding adsorption capacity of TiO2 was equal to about 2 mg/g. Similar results are also reported by [39]. Using an aluminum oxide–manganese oxide (AOMO) composite material as adsorbent, an initial fluoride concentration of 20 mg/L and a contact time of 3 h, they found an optimal value of the dose equal to 4 g/L, corresponding to an equilibrium adsorption capacity of 4.8 mg F/g.
A distribution coefficient, Kd, for fluoride adsorbed on the adsorbent at the above conditions was also calculated by applying the following equation:
Kd (L/g) = Qads/C
where Qads and C represent the mass of fluoride on the adsorbent (mg/g) and the concentration in the liquid solution (mg/L), respectively, at t = 7 h, in the tests conducted at C0 = 10 mg/L and TiO2 dose of M/V = 1, 5, 10 g/L. The results obtained show that Kd increased almost linearly with an increase in adsorbent dose (R2 of the linear regression line equal to 0.75): the values were 0.9, 2.6 and 2.7 g/L, respectively. This may suggest the heterogeneous nature of the adsorbent surface as also reported by [40]. By contrast, it is referred that for the homogeneous surface, the Kd value should not change with the adsorbent dose.
The experimental data of the kinetic tests were fitted using different models, with the aim to achieve information about the prevalent mechanism taking place during the mass transfer process from a liquid to a solid phase. The type of model that better represents the kinetic data can be used to select the more suitable way of employment of that adsorbent in practical applications. For instance, a low adsorption rate indicates that a long hydraulic retention time (i.e., contact time between adsorbent and pollutant) is needed to achieve the required level of removal. The mechanism of the adsorption process consists of four main steps. The first one is represented by the mass transfer of the pollutant molecules from the bulk solution to the stagnant boundary layer of the adsorbent particle; then, diffusion through the layer to the external surface of the particle takes place. The third step is the intraparticle surface diffusion of the pollutant molecules through the internal porosity up to the sorption sites; finally, the fourth step consists of the sorption itself between pollutant molecules and adsorption sites [39]. Since the first and the fourth steps are fast, the total rate of the adsorption process is determined by either external film diffusion (step 2) or intraparticle surface diffusion (step 3).
The more general reaction-based kinetic models were applied, such as zeroth, first, second and saturation. In the zero-order model, the chemical reaction rate does not vary with the increase or decrease in the concentration of the reactants. The first order model assumes that the reaction proceeds at a rate that depends linearly only on one reactant concentration; for the second order, the reaction rate is proportional to the square of the concentration of a reactant or the product of the concentration of two reactants. In the saturation model, the rate of reaction first increases linearly with the reactant concentration; at a reactant concentration much above the value of the half velocity constant, the rate of reaction approximates a constant pattern.
Two internal diffusional models were also considered, i.e., Weber and Morris and Bangham, where the latter can be considered as a generalization of the former one. For these models, mass transfer through intraparticle diffusion is considered to be the slowest step [32]. If intra-particle diffusion is the only rate-limiting step, the linear plot of Qt versus t1/2 of the representative equation of the Weber and Morris model (as shown in Table 4) should pass through the origin; but, if the intercept Ci of the plots is not equal to zero, intra-particle diffusion is not the sole rate-determining step.
The pseudo-first kinetic model is simple and commonly used [41]. It assumes the sorption to be non-reversible and only occurring on localized sites without involving interaction between the adsorbed ions. Furthermore, the energy of adsorption is not dependent on surface coverage, and the maximum adsorption corresponds to a saturated mono-layer of adsorbate on the adsorbent surface. Finally, the concentration of adsorbate is considered to be constant, and its uptake on the adsorbent is governed by a first-order rate equation. The pseudo-first-order reactions are second-order reactions that are made to behave as first-order reactions. This type of reaction occurs when one reacting material is present at a great excess concentration with respect to other reactants; thus, it appears as a constant concentration compared to the concentrations of the other substances [41].
In the pseudo-second order, the reaction rate depends on the amount of solvent adsorbed on the adsorbent surface and the equilibrium adsorption amount. The pseudo-second-order rate kinetic model is based on similar assumptions. As for the pseudo-first-order model, the only difference is that ion uptake on the adsorbent is governed by a second-order rate equation. The adsorption rate is proportional to the square of the number of unoccupied surface sites; moreover, the number of occupied sites is proportional to the adsorbate concentration. The pseudo-second-order model (also known as the Lagergren model) has been widely applied in recent years to the adsorption of pollutants from aqueous solution [32].
Table S1 shows the results of the experimental data fitting by means of the above listed models for each condition and each type of adsorbent. Due to the instability of the data at a long time, the fitting was limited to t = 7 h.
Among the kinetics models, the pseudo-second-order one better represented the experimental data of the adsorption process of fluoride over all the tested adsorbent media and for all concentrations and dosages considered; only in two cases did the other models provide a better fitting (i.e., zero-order for 10 mg/L F and 10 g/L GFH, and Bangham for 5 mg/L F and 1 g/L GAC). These results highlight that the prevalent mechanism was always chemisorption. Many researchers also found that the pseudo-second-order model better represented the adsorption kinetics of fluoride removal [42,43].
The maximum adsorption capacity, Qmax, predicted by this model was in the following decreasing order: TiO2 > A33E > GAC > GFH, which is consistent with the experimental results. In Table 6, the values are reported for the case of C0 = 10 mg/L and the tree dosages: M/V = 1, 5, 10 g/L.
Therefore, TiO2 was confirmed to be the best adsorbent for the operating conditions applied to the experimental tests. Its maximum capacity decreased almost by half as the dosage increased from 1 to 5 and to 10 g/L. The same trend was also observed for A33E.
Values of Qmax determined for GFH and GAC were much lower and remained roughly constant as the dosage changed.
These results are in agreement with the values of Figure 2: it is confirmed that the optimal dose can be considered as M/V = 5 g/L since it provides high values of both removal efficiency and maximum adsorption capacity.

3.1.2. Real Samples

Fluoride removal by the selected adsorbents was also studied in real contaminated groundwater. It is known that groundwater often contains other anions, such as Cl, NO3, SO4−2, HCO3 and PO4−3, which may compete for active adsorption sites, thus reducing the removal capability for fluoride.
Figure 3a,b shows the adsorption capacity of TiO2, A33E and GFH at M/V = 1 and 5 g/L, respectively, in the real contaminated solution. The pH was not adjusted, and it remained at an initial value of about 8. GAC was excluded from these tests due to its low removal ability versus arsenic. In the same groundwater, arsenic was present at a concentration above the standard for drinking water (i.e., 10 μg/L): therefore, the aim of these experiments was also to find out an adsorbent possibly capable of reducing the concentration of both fluoride and arsenic below the respective standards.
The initial fluoride concentration in the real sample was 2.4 mg/L on average. With respect to the values obtained with the synthetically contaminated solution at similar concentrations, i.e., C0 = 2.5 mg/L, the adsorption capacity and the removal efficiency under real conditions decreased significantly with all the tested adsorbents. Particularly, at t = 7 h using M/V = 1 g/L, the average values were as follows: 0.57 mg/g and 23.59% for TiO2, 0.106 mg/g and 4.80% for A33E, 0.033 mg/g and 1.60% for GFH. None of the adsorbents were able to reduce the fluoride concentration below the limit set on fluoride for drinking water. Increasing the dosage to M/V = 5 g/L appreciably improved the removal capability. However, only TiO2 was able to reach a final concentration below the standard, i.e., 1.21 mg/L. Therefore, it still remained the best adsorbent for defluoridation under real conditions. Although there was low removal, GFH performed slightly better than A33E, whereas the reverse behavior was observed with the synthetic solution. The lower efficiency measured under real conditions can be ascribed to two main reasons: the unfavorable pH conditions and the more complex composition of the real solutions containing other competing ions. The pH value of the real samples was much higher than in the synthetic solutions. As highlighted above, the adsorption capacity of all the tested adsorbents is known to be stable and higher at a lower pH. In this case, the addition of the adsorbents did not change the pH value; by contrast, it was observed with the synthetic solution. This might be due to a higher buffer capacity of the real water because of the more complex ion composition.
Furthermore, the reduced adsorption capacity was likely due to the competition with the other ions. Fluoride ions are mainly located on the surface due to the OH/F exchange mechanism of adsorption. Therefore, the inner-spherically sorbing anions such as phosphates and sulphates significantly influence the sorption of fluoride [33]. Silica and vanadium are reported to compete for the exchange sites in the case of A33E.
About the other pollutants present in the real samples, arsenic and vanadium were 100% removed by all the tested adsorbents; the fastest rate of the process was observed in the case of TiO2, whereas GFH showed the lowest kinetics (data reported in Supplementary Materials). Chlorides, sulphates and nitrates were also partly removed by all the tested media (data not here reported).
All the commercial media showed a lower affinity for fluoride than for arsenic and vanadium.
The specific dosage confirms to be the key parameter to achieve the goal of reducing fluoride concentration below the standard, particularly when the adsorption process is applied under real conditions.

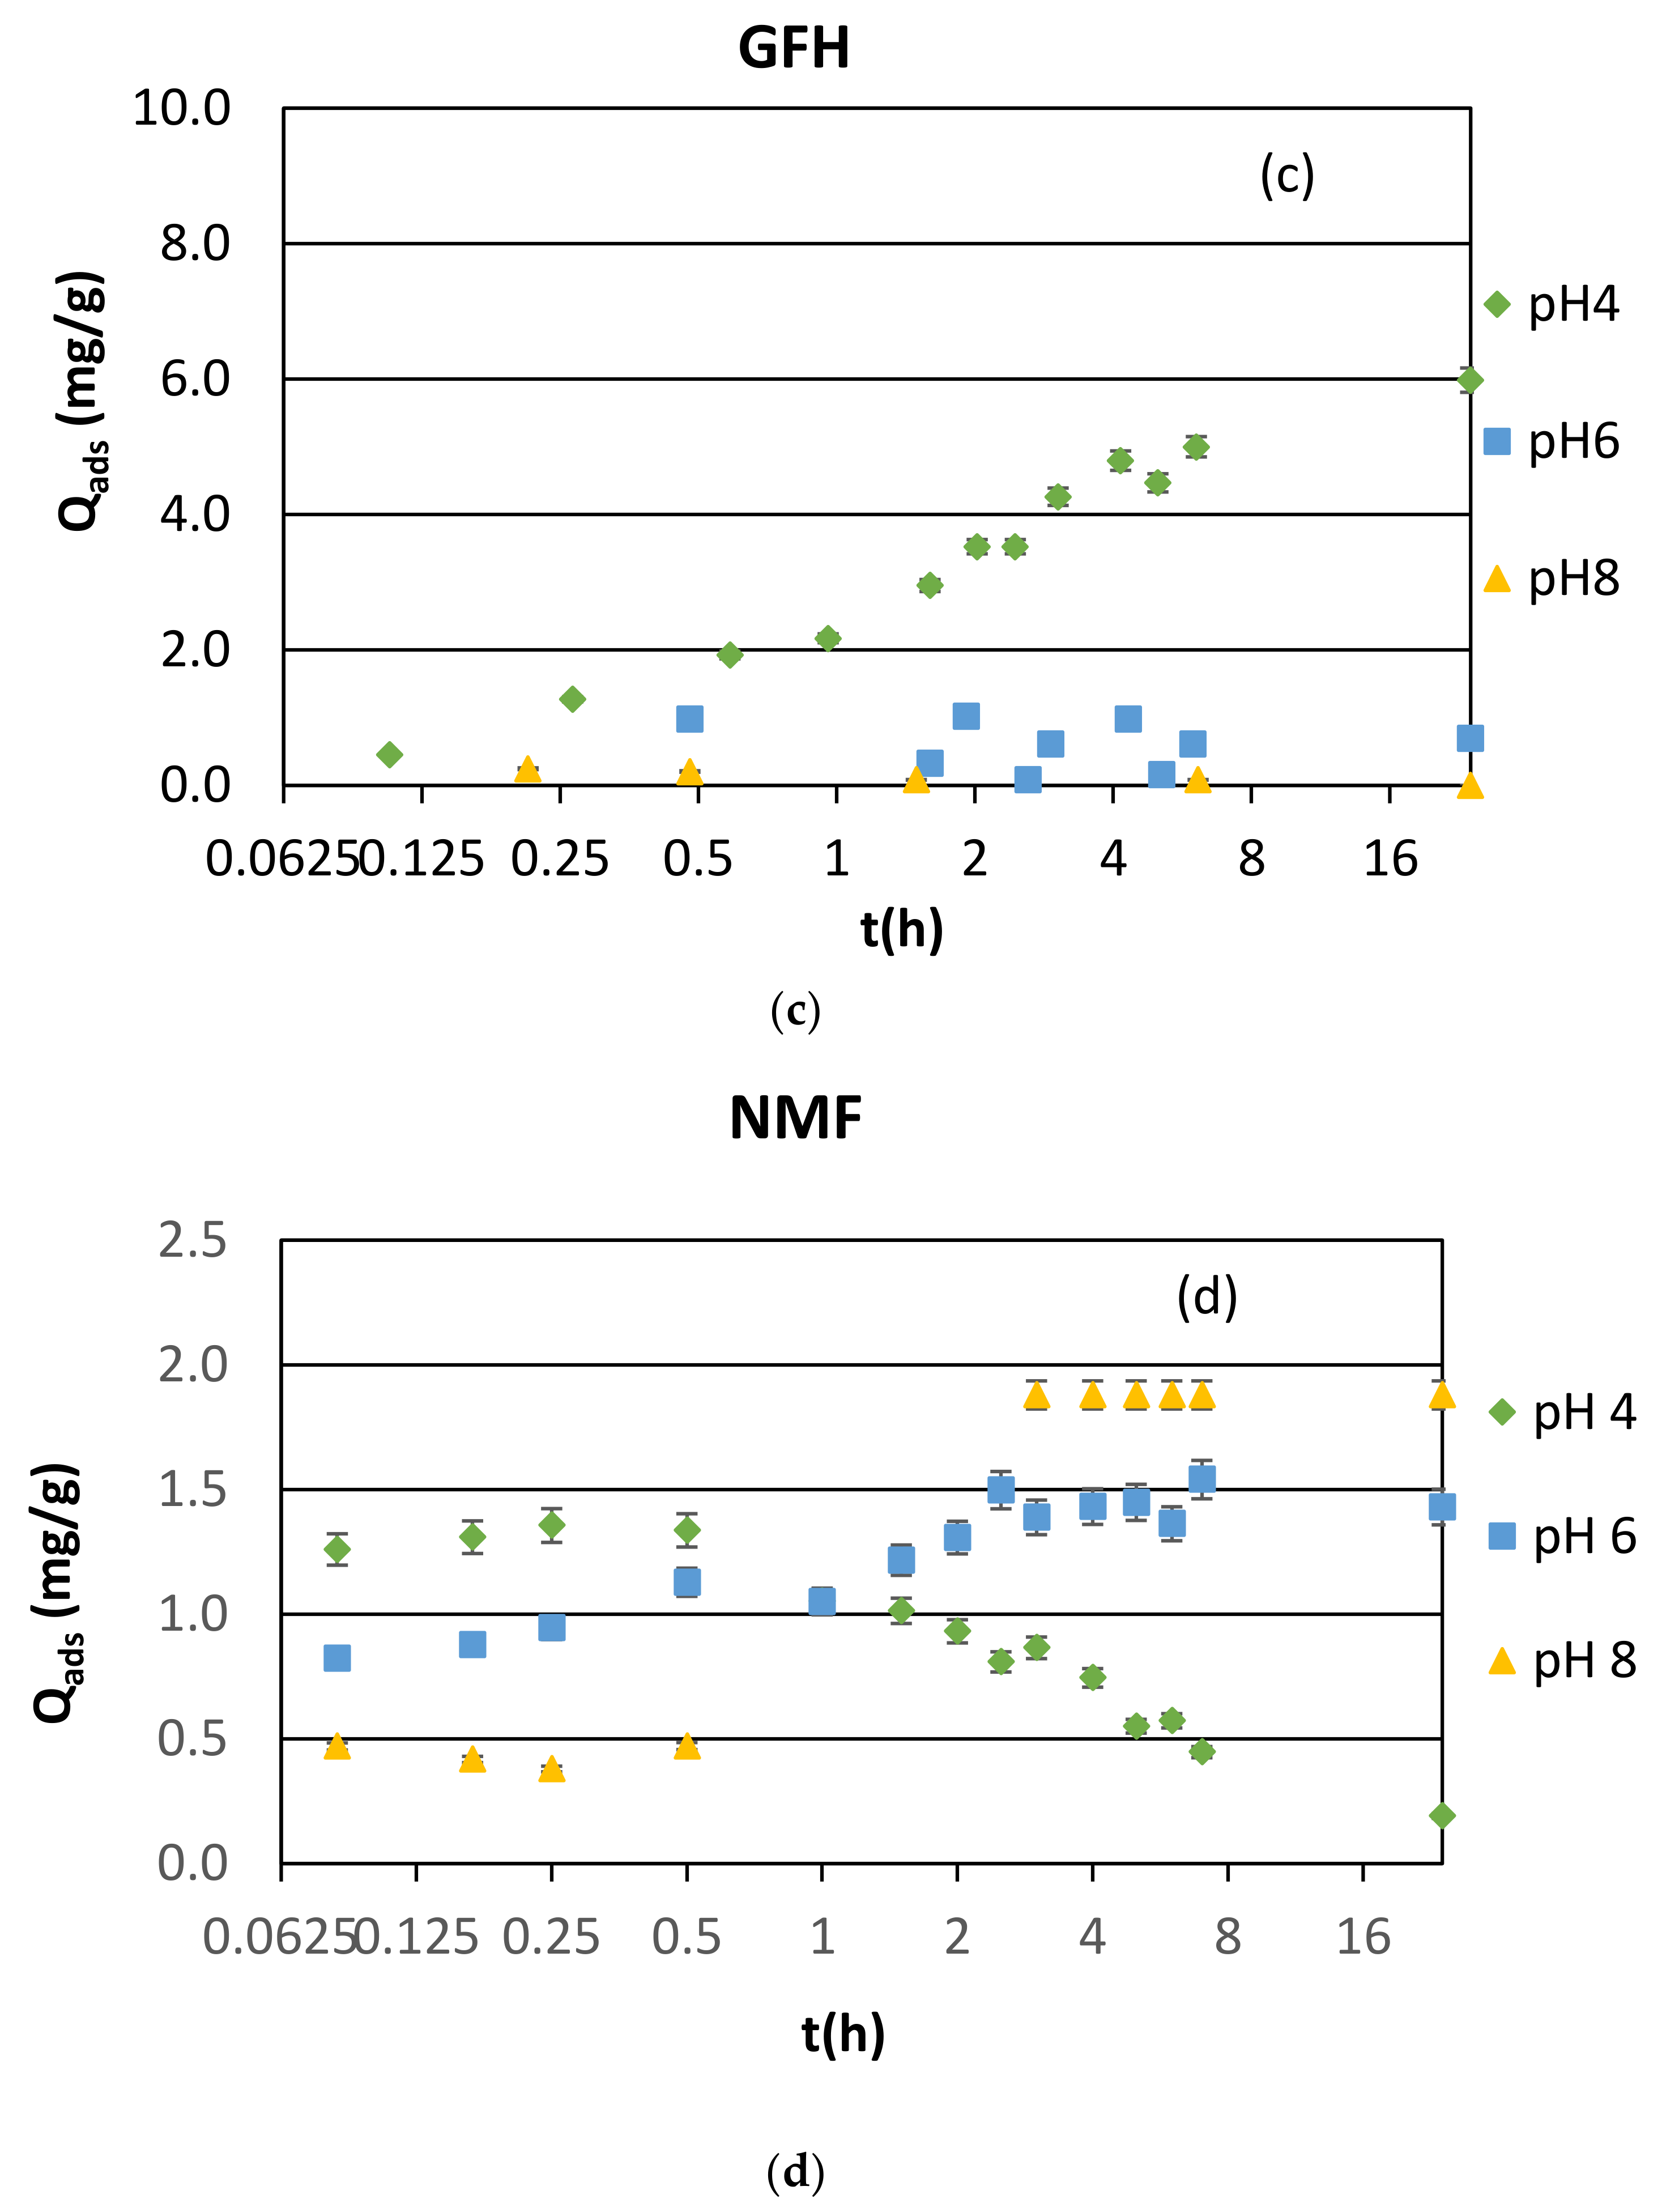
3.1.3. Synthetic Samples and Equilibrium pH

Figure 4 shows the results of the kinetic experiments conducted at controlled pH values, i.e., pH = 4–6–8, using M/V= 1 g/L dosage and initial fluoride concentrations C0 = 2.5–5–10 mg/L. A first series was carried out with all the commercial adsorbents (Figure 4a–c) at C0 = 5 mg/L.
It can be noted that GAC removal did not show any significant variation as a function of the pH value: removal efficiency was roughly 19% at all pH values. Therefore, the other series of experiments conducted under controlled pH did not include GAC. Looking at the results obtained at all the concentrations (Figure 4b,c), a common trend can be noted for GFH, TiO2 and A33E: adsorption of fluoride was strongly pH dependent, with the uptake capacity decreasing at increasing pH value. The highest uptake was observed at pH = 4, and then it became lower when pH changed from 6 to 8. These results agree with the data found in the scientific literature, although few studies compared fluoride uptake by different adsorbents as a function of pH value [28,44,45]. A different behavior was observed with NMF (Figure 4d): increasing pH fostered the uptake capacity, which reached the highest level at pH = 8.
When the same dosage and fluoride concentration (i.e., M/V = 1 g/L and C0 = 5 mg/L, respectively) were applied but pH was allowed to freely change, the addition of TiO2 to the solution determined a drop of pH to 5.2, and the final removal efficiency was of 64%. When pH was fixed at 4 and 6, the corresponding removals were 87% and 49%, respectively, thus confirming the linear increase in TiO2 uptake as pH decreased. The high removal efficiency in the acidic pH range is likely due to the existence of positive sites and neutral sites on the surface of the adsorbent that facilitates more fluoride ions to bind on the surface. The low adsorption efficiency at basic pH is likely to be attributed to the strong competition of hydroxide ions on the adsorbent surface for the active sites as well as the repulsion of fluoride ions by the negatively charged surface of the adsorbents [39]. Fluoride being strongly electronegative tends to be attracted to positively charged ions. The nature of fluoride uptake is governed by three main factors, viz., surface chemistry of the adsorbent, the degree of ionization and dissociation of fluoride during the adsorbate–adsorbent sorption process [46]. For pH values less than 6, which naturally occurred when TiO2 adsorbent was added to the liquid solution at the tested dosages, the existence of positively charge ions on the surface caused an interaction with the negatively charged fluoride ions, thus favoring the adsorption process. Above pH 7, due to the prevalence of negatively charged hydroxyl ions (OH), a notable drop in the rate of fluoride sorption was observed, which might have been due to the repulsion between the negatively charged fluoride and hydroxyl ions [17].

3.2. Adsorption Isotherms and Modeling

Adsorption isotherms are used for understanding the mechanism of the adsorption process and for quantifying the distribution of the adsorbate between the liquid phase and solid adsorbent at equilibrium and constant temperature.
Table 7 and Table 8 show the results of fitting the equilibrium experimental data by different models, at initial pH and equilibrium pH of 4–6–8, for TiO2, A33E and GFH. Particularly, the tables list the values of R2 and significant parameters related to the various isotherm models.
Data of GAC obtained could not be modeled due to the low fluoride uptake observed under the tested experimental conditions. GFH data modeling under initial pH did not provide any acceptable fitting due to the low removal.
The best fitting isotherm model resulted as being dependent upon the adsorbent type and pH value.
For A33E, both the Langmuir and Freundlich models provided good representation of the adsorption process data for freely changing pH; however, the Langmuir model was excluded due to the negative value of the constant a, which represents the maximum adsorption capacity. The Freundlich coefficient, n, resulted as being equal to 1.07, which indicates a favorable adsorption (n > 1). For pH = 4, the highest value of R2 was obtained by the Langmuir model, although the other three models also showed good fitting of the experimental data. The Langmuir coefficient, b, was positive, and the Freundlich constant, n, was above 1, thus indicating a favorable adsorption. The maximum adsorption capacity predicted by the Langmuir model was Qmax = 4 mg/g, which was close to the experimental result (5 mg/g). At pH = 8, BET was the only model suitable to represent the adsorption process. The predicted maximum adsorption capacity was Qmax = 0.53 mg/g: the low value is indicative of the reduced uptake under basic pH conditions, as already observed in the kinetic tests. At pH = 6, the Langmuir, Freundlich and Temkin models were all suitable to predict the adsorption equilibrium data. Since the pH value without control was about 6 and the resulting better model was Freundlich, for pH fixed at 6, it was assumed to be the same model as the best fitting one. The values obtained for the model constants Kf (mg/g) and n, related to adsorption capacity and adsorption intensity, respectively, were also similar. It is reported that, if the value of n in the Freundlich isotherm model falls in the range of 1–10, the adsorption of fluoride is favorable [9]: in the present case, the n value was approximated as 1 in both free and fixed pH conditions. The adsorption capacity at equilibrium predicted by the Freundlich model was 1.56 mg/g for free pH, whereas it was 2.76 mg/g at pH = 6, which is similar to the experimental values of 2.11 mg/g at the same pH and equilibrium concentration in solution. Under more favorable acidic pH conditions (i.e., pH = 4), the maximum adsorption capacity predicted by the best fitting Langmuir model was Qmax = 4 mg/g. The high pH determined a drastic drop in the adsorption capacity to 0.53 mg/g, confirming the strong dependence on the pH value of A33E uptake capacity versus fluoride.
In the case of TiO2, all the models gave good fitting for free pH conditions, with the highest R2 value found with BET. The maximum adsorption capacity predicted by this model was Qmax = 5.72 mg/g, which is a slightly higher than the experimental value of 4.96 mg/g, whereas a more similar value was obtained by the Langmuir model at 4.19 mg/g. The Langmuir constant, b, had a positive value, and the Freundlich constant, n, was 2.24 (>1); both factors indicate that adsorption was favorited. At pH = 4 and 6, the highest R2 value was found with Temkin, whereas at pH = 8, only the BET model gave a value of R2 above 0.900. The maximum adsorption capacity at this pH was low, i.e., Qmax = 0.04 mg/g, being the conditions unfavorable for the adsorption process as highlighted above; at pH = 6, the value predicted by the BET model increased to Qmax = 4.97 mg/g, which is close to that found under uncontrolled pH.
The adsorption isotherms for GFH were better fitted by the BET model at pH = 4, 6 and 8. The corresponding maximum adsorption capacities were found to be Qmax = 7.36, 0.87, 0.16 mg/g, respectively. The literature data indicate that fluoride adsorption onto GFH is strongly pH dependent. Using schwertmannite, the maximum adsorption of fluoride was achieved at pH 3.7, and it decreased as pH rose [45].
The results of the isotherm experiments confirm that, under the applied operating conditions, TiO2 possesses the greatest adsorption capacity under freely changing pH: this is likely due to a pH value around 5, which naturally establishes within the solution when dosing this adsorbent, and which is favorable for the adsorption process of fluoride. Under fixed pH, all the tested adsorbents showed a poor removal at pH = 8, whereas GFH, A33E and TiO2 all became competitive for pH in the range of 4–6.
Comparison of the tested media with other various adsorbents for fluoride removal displays similar maximum adsorption capacities at pH = 6–7 [43].

4. Conclusions

The purpose of the present work was to find an adsorbent suitable to reduce fluoride, arsenic, and vanadium concentrations below the standard limits set for drinking water.
Among the tested adsorbents, TiO2 showed the highest adsorption capacity and the fastest process under simulated and real conditions. It was also capable of 100% removal of arsenic and vanadium at the fastest rate in the real samples.
Better performance of all adsorbents was achieved under acidic conditions. However, in the full-scale applications, much concern must be posed to pH modification since it must always remain within the range recommended for drinking water (approximately equal to 7).
The adsorbent dosage required to achieve fluoride reduction below the standard strongly depended on initial fluoride concentration.
The pseudo-second-order model best fitted the kinetic experimental results, whereas the best isotherm model changed depending on the operative conditions.
The TiO2-coated magnetic nanoparticles at the smaller size was demonstrated to be a promising alternative to the commercial adsorbents; therefore, more studies will be carried out to better understand its potentiality.
The results obtained by the present work can be used to select the most suitable adsorbent and to carry the preliminary design of the batch adsorption plant where it can be used. The contact time obtained by the kinetic experiments provides the minimum retention time needed to reach equilibrium; based on this, the required volume of the batch reactor can be calculated as a function of the volumetric influent flow rate to treat. Furthermore, the values of the maximum adsorption capacity and model coefficient provided by the best fitting isotherm model can be used to calculate the amount of adsorbent needed to treat a specific volume of contaminated water.

Supplementary Materials

The following supporting information can be downloaded at: https://www.mdpi.com/article/10.3390/w14091423/s1, Figure S1: Adsorption of arsenic and vanadium under uncontrolled pH for real samples and different adsorbent dosages. (C0 Arsenic = 23 µg/L; C0 Vanadium = 64 µg/L); Table S1: Results of the kinetic experiment modeling. The best fitting model for each condition is highlighted in italic.

Author Contributions

Conceptualization, A.C. and E.D.; methodology, A.C. and E.D.; software, E.D.; validation, E.D.; formal analysis, C.D.M.; investigation, E.D.; resources, A.C.; data curation, E.D.; writing—original draft preparation, A.C.; writing—review and editing, C.D.M. All authors have read and agreed to the published version of the manuscript.

Funding

This research received no external funding.

Institutional Review Board Statement

Not applicable.

Informed Consent Statement

Not applicable.

Data Availability Statement

The authors confirm that the data supporting the findings of this study are available, and there is no restriction on sharing due to data ownership or the inclusion of personally identifiable information.

Acknowledgments

The authors wish to thank Marco Stoller and Luca Di Palma of the Department of Chemical Materials Environmental Engineering of Sapienza University of Rome for supplying NMF and NMG adsorbents.

Conflicts of Interest

The authors declare no conflict of interest.

References

  1. Bharti, V. Fluoride Sources, Toxicity and Its Amelioration: A Review. Peertechz J. Environ. Sci. Toxicol. 2017, 2, 021–032. [Google Scholar] [CrossRef]
  2. Scientific Committee on Health and Environmental Risks (SCHER). Critical Review of Any New Evidence on the Hazard Profile, Health Effects, and Human Exposure to Fluoride and the Fluoridating Agents of Drinking Water; European Union: Brussels, Belgium, 2010; ISSN 1831-4775. [Google Scholar] [CrossRef]
  3. WHO. Guidelines for Drinking Water Quality, 4th ed; World Health Organization: Geneva, Switzerland, 2011; Volume 1, ISBN 978-92-4-154815-1. [Google Scholar]
  4. Biswas, G.; Kumari, M.; Adhikari, K.; Dutta, S. A Critical Review on Occurrence of Fluoride and Its Removal through Adsorption with an Emphasis on Natural Minerals. Curr. Pollut. Rep. 2017, 3, 104–119. [Google Scholar] [CrossRef]
  5. European Commission EU. Directive 98/83/EC Council Directive of 3 November 1998 on the Quality of Water Intended for Human Consumption. Off. J. Eur. Union 1998, L330, 32–54. [Google Scholar]
  6. The European Parliament and the Council of the European Union. Directive (Eu) 2020/2184 of the European Parliament and of the Council of 16 December 2020 on the Quality of Water Intended for Human Consumption. Off. J. Eur. Union 2020, 435, 1–62. Available online: https://eur-lex.europa.eu/eli/dir/2020/2184/oj (accessed on 3 April 2022).
  7. Lgs. D. 31/2001 Decreto Legislativo 2 Febbraio 2001. n. 31. Attuazione Della Direttiva 98/83/CE Relativa Alla Qualità Delle Acque Destinate Al Consumo Umano. Gazzetta Ufficiale n. 52 del 3 marzo 2001—Supplemento Ordinario n. 41. Available online: https://web.camera.it/parlam/leggi/deleghe/01031dl.htm (accessed on 3 April 2022).
  8. Fawell, J.; Bailey, K.; Chilton, J.; Dahi, E.; Fewtrell, L.; Magara, Y. Fluoride in Drinking Water; WHO Drinking; IWA Publishing: London, UK; Alliance House: London, UK, 2006; ISBN 1900222965. [Google Scholar]
  9. Solanki, Y.S.; Agarwal, M.; Maheshwari, K.; Gupta, S.; Shukla, P.; Gupta, A.B. Removal of Fluoride from Water by Using a Coagulant (Inorganic Polymeric Coagulant). Environ. Sci. Pollut. Res. 2021, 28, 3897–3905. [Google Scholar] [CrossRef] [PubMed]
  10. Fawell, J.K.; Ohanian, E.; Giddings, M.; Toft, P.; Magara, Y.; Jackson, P. Fluoride in Drinking-Water. Background Document for Development of WHO Guidelines for Drinking-Water Quality; World Health Organization: Geneva, Switzerland, 2004. [Google Scholar]
  11. Habuda-Stanić, M.; Ravančić, M.; Flanagan, A. A Review on Adsorption of Fluoride from Aqueous Solution. Materials 2014, 7, 6317–6366. [Google Scholar] [CrossRef]
  12. Pillai, P.; Dharaskar, S.; Pandian, S.; Panchal, H. Overview of Fluoride Removal from Water Using Separation Techniques. Environ. Technol. Innov. 2021, 21, 101246. [Google Scholar] [CrossRef]
  13. Ghosh, D.; Medhi, C.R.; Purkait, M.K. Treatment of Fluoride Containing Drinking Water by Electrocoagulation Using Monopolar and Bipolar Electrode Connections. Chemosphere 2008, 73, 1393–1400. [Google Scholar] [CrossRef]
  14. Das, D.; Nandi, B.K. Simultaneous Removal of Fluoride and Fe (II) Ions from Drinking Water by Electrocoagulation. J. Environ. Chem. Eng. 2020, 8, 103643. [Google Scholar] [CrossRef]
  15. He, J.; Yang, Y.; Wu, Z.; Xie, C.; Zhang, K.; Kong, L.; Liu, J. Review of Fluoride Removal from Water Environment by Adsorption. J. Environ. Chem. Eng. 2020, 8, 104516. [Google Scholar] [CrossRef]
  16. Ramdani, A.; Taleb, S.; Benghalem, A.; Ghaffour, N. Removal of Excess Fluoride Ions from Saharan Brackish Water by Adsorption on Natural Materials. Desalination 2010, 250, 408–413. [Google Scholar] [CrossRef]
  17. Mukherjee, S.; Dutta, S.; Ray, S.; Halder, G. A Comparative Study on Defluoridation Capabilities of Biosorbents: Isotherm, Kinetics, Thermodynamics, Cost Estimation, and Eco-Toxicological Study. Environ. Sci. Pollut. Res. 2018, 25, 17473–17489. [Google Scholar] [CrossRef] [PubMed]
  18. Yadav, K.K.; Gupta, N.; Kumar, V.; Khan, S.A.; Kumar, A. A Review of Emerging Adsorbents and Current Demand for Defluoridation of Water: Bright Future in Water Sustainability. Environ. Int. 2018, 111, 80–108. [Google Scholar] [CrossRef] [PubMed]
  19. Dinelli, E.; Lima, A.; Albanese, S.; Birke, M.; Cicchella, D.; Giaccio, L.; Valera, P.; De Vivo, B. Major and Trace Elements in Tap Water from Italy. J. Geochem. Explor. 2012, 112, 54–75. [Google Scholar] [CrossRef]
  20. Ergul, S.; Ferranti, F.; Sappa, G. Arsenic in the Aquifer Systems of Viterbo Region. Central Italy: Distribution and Geochemistry. Rend. Online Della Soc. Geol. Ital. 2013, 24, 116–118. [Google Scholar]
  21. Chiavola, A.; D’Amato, E.; Boni, M.R. Comparison of different iron oxide adsorbents for combined arsenic, vanadium and fluoride removal from drinking water. Int. J. Environ. Sci. Technol. 2019, 16, 6053–6064. [Google Scholar] [CrossRef]
  22. López-Guzmán, M.; Alarcón-Herrera, M.T.; Irigoyen-Campuzano, J.R.; Torres-Castañón, L.A.; Reynoso-Cuevas, L. Simultaneous Removal of Fluoride and Arsenic from Well Water by Electrocoagulation. Sci. Total Environ. 2019, 678, 181–187. [Google Scholar] [CrossRef]
  23. Chiavola, A.; Stoller, M.; Di Palma, L.; Boni, M.R. Magnetic Core Nanoparticles Coated by Titania and Alumina for Water and Wastewater Remediation from Metal Contaminants. Chem. Eng. Trans. 2017, 60, 205–210. [Google Scholar] [CrossRef]
  24. Chiavola, A.; D’Amato, E.; Stoller, M.; Chianese, A.; Boni, M.R. Application of Iron Based Nanoparticles as Adsorbents for Arsenic Removal from Water. Chem. Eng. Trans. 2016, 47, 325–330. [Google Scholar] [CrossRef]
  25. Chiavola, A.; D’Amato, E.; Sirini, P.; Caretti, C.; Gori, R. Arsenic Removal from a Highly Contaminated Groundwater by a Combined Coagulation-Filtration-Adsorption Process. Water Air Soil Pollut. 2019, 230, 87. [Google Scholar] [CrossRef]
  26. Li, Z.; Xu, S.; Li, Y.; Arai, Y. Novel Application of Hybrid Anion Exchange Resin for Phosphate Desorption Kinetics in Soils: Minimizing Re-Adsorption of Desorbed Ions. Soil Syst. 2020, 4, 36. [Google Scholar] [CrossRef]
  27. USEPA. Technologies and Costs for Removal of Arsenic from Drinking Water EPA 815-R-00-028; United States Environmental Protection Agency: Washington, DC, USA, 2000.
  28. Streat, M.; Hellgardt, K.; Newton, N.L.R. Hydrous Ferric Oxide as an Adsorbent in Water Treatment. Process Saf. Environ. Prot. 2008, 86, 21–30. [Google Scholar] [CrossRef]
  29. Pirilä, M.; Martikainen, M.; Ainassaari, K.; Kuokkanen, T.; Keiski, R.L. Removal of Aqueous As(III) and As(V) by Hydrous Titanium Dioxide. J. Colloid Interface Sci. 2011, 353, 257–262. [Google Scholar] [CrossRef] [PubMed]
  30. Usman, M.; Katsoyiannis, I.; Mitrakas, M.; Zouboulis, A.; Ernst, M. Performance Evaluation of Small Sized Powdered Ferric Hydroxide as Arsenic Adsorbent. Water 2018, 10, 957. [Google Scholar] [CrossRef] [Green Version]
  31. Usman, M.; Belkasmi, A.I.; Kastoyiannis, I.A.; Ernst, M. Pre-Deposited Dynamic Membrane Adsorber Formed of Microscale Conventional Iron Oxide-Based Adsorbents to Remove Arsenic from Water: Application Study and Mathematical Modeling. J. Chem. Technol. Biotechnol. 2021, 96, 1504–1514. [Google Scholar] [CrossRef]
  32. Largitte, L.; Pasquier, R. A Review of the Kinetics Adsorption Models and Their Application to the Adsorption of Lead by an Activated Carbon. Chem. Eng. Res. Des. 2016, 109, 495–504. [Google Scholar] [CrossRef]
  33. Kumar, E.; Bhatnagar, A.; Ji, M.; Jung, W.; Lee, S.-H.; Kim, S.-J.; Lee, G.; Song, H.; Choi, J.-Y.; Yang, J.-S.; et al. Defluoridation from Aqueous Solutions by Granular Ferric Hydroxide (GFH). Water Res. 2009, 43, 490–498. [Google Scholar] [CrossRef]
  34. Purolite. Engineering Bulletin-Arsenic Removal for Commercial and Residential Applications Using Purolite FerrIXTM A33E. 2018. Available online: www.purolite.com (accessed on 3 April 2022).
  35. Naser, J.A.; Ahmed, Z.W.; Ali, E.H. Nanomaterials Usage as Adsorbents for the Pollutants Removal from Wastewater; A Review. Mater. Today Proc. 2021, 42, 2590–2595. [Google Scholar] [CrossRef]
  36. Vuppala, S.; Stoller, M.; Chiavola, A.; Kanaev, A.; Cheng, K. Synthesis of Core-Shell Nanoparticles for the Removal of Toxic Pollutants in Aqueous Medium. Chem. Eng. Trans. 2018, 70, 1819–1824. [Google Scholar] [CrossRef]
  37. Wajima, T.; Umeta, Y.; Narita, S.; Sugawara, K. Adsorption Behavior of Fluoride Ions Using a Titanium Hydroxide-Derived Adsorbent. Desalination 2009, 249, 323–330. [Google Scholar] [CrossRef]
  38. Li, Z.; Deng, S.; Zhang, X.; Zhou, W.; Huang, J.; Yu, G. Removal of Fluoride from Water Using Titanium-Based Adsorbents. Front. Environ. Sci. Eng. China 2010, 4, 414–420. [Google Scholar] [CrossRef]
  39. Alemu, S.; Mulugeta, E.; Zewge, F.; Chandravanshi, B.S. Water Defluoridation by Aluminium Oxide–Manganese Oxide Composite Material. Environ. Technol. 2014, 35, 1893–1903. [Google Scholar] [CrossRef] [PubMed]
  40. Usman, M.; Zarebanadkouki, M.; Waseem, M.; Katsoyiannis, I.A.; Ernst, M. Mathematical Modeling of Arsenic(V) Adsorption onto Iron Oxyhydroxides in an Adsorption-Submerged Membrane Hybrid System. J. Hazard. Mater. 2020, 400, 123221. [Google Scholar] [CrossRef] [PubMed]
  41. Ohs, B.; Krödel, M.; Wessling, M. Adsorption of Carbon Dioxide on Solid Amine-Functionalized Sorbents: A Dual Kinetic Model. Sep. Purif. Technol. 2018, 204, 13–20. [Google Scholar] [CrossRef]
  42. Wang, M.; Yu, X.; Yang, C.; Yang, X.; Lin, M.; Guan, L.; Ge, M. Removal of Fluoride from Aqueous Solution by Mg-Al-Zr Triple-Metal Composite. Chem. Eng. J. 2017, 322, 246–253. [Google Scholar] [CrossRef]
  43. Wang, J.; Chen, N.; Feng, C.; Li, M. Performance and Mechanism of Fluoride Adsorption from Groundwater by Lanthanum-Modified Pomelo Peel Biochar. Environ. Sci. Pollut. Res. 2018, 25, 15326–15335. [Google Scholar] [CrossRef]
  44. Bhatnagar, A.; Kumar, E.; Sillanpää, M. Fluoride Removal from Water by Adsorption-A Review. Chem. Eng. J. 2011, 171, 811–840. [Google Scholar] [CrossRef]
  45. Eskandarpour, A.; Onyango, M.S.; Ochieng, A.; Asai, S. Removal of Fluoride Ions from Aqueous Solution at Low PH Using Schwertmannite. J. Hazard. Mater. 2008, 152, 571–579. [Google Scholar] [CrossRef]
  46. Mukherjee, S.; Mondal, M.; Banerjee, S.; Halder, G. Elucidation of the Sorptive Uptake of Fluoride by Ca 2+ -Treated and Untreated Algal Biomass of Nostoc Sp. (BTA394): Isotherm, Kinetics, Thermodynamics and Safe Disposal. Process Saf. Environ. Prot. 2017, 107, 334–345. [Google Scholar] [CrossRef]
Figure 1. Adsorption capacity under uncontrolled pH for different initial fluoride concentrations and adsorbent dosages. (a) C0 = 2.5 mg/L; M/V = 1 g/L; (b) C0 = 2.5 mg/L; M/V = 5 g/L; (c) C0 = 5 mg/L; M/V = 1 g/L; (d) C0 = 5 mg/L; M/V = 5 g/L; (e) C0 = 10 mg/L; M/V = 1 g/L; (f) C0 = 10 mg/L; M/V = 5 g/L; (g) C0 = 10 mg/L; M/V = 10 g/L; (h) C0 = 2.5 mg/L; M/V = 1 g/L. Equilibrium pH: 6.6 for A33E, 5.0 for TiO2, 6.9 for GFH, 6.4 for GAC. The error bars indicate the standard deviation of the analytical method.
Water 14 01423 g001aWater 14 01423 g001bWater 14 01423 g001c
Figure 2. Adsorption capacity and % removal efficiency of TiO2 as a function of adsorbent dose (C0 = 10 mg/L, contact time = 7 h, measured pH = 5.0). The error bars indicate the standard deviation of the analytical method.
Water 14 01423 g002
Figure 3. Adsorption capacity in real samples at different adsorbent dosages: (a) M/V = 1 g/L; (b) M/V = 5 g/L (measured pH = 8.0). The error bars indicate the standard deviation of the analytical method.
Water 14 01423 g003aWater 14 01423 g003b
Figure 4. Adsorption capacity at pH = 4, 6, 8 for different initial fluoride concentrations and fixed adsorbent dosage equal to M/V = 1 g/L. (a) C0 = 5 mg/L, GAC, A33E, TiO2 and GFH; (b) C0 = 2.5 mg/L, A33E, TiO2 and GFH; (c) C0 = 10 mg/L, A33E, TiO2 and GFH; (d) C0 = 2.5 mg/L, NMF. The error bars indicate the standard deviation of the analytical method.
Water 14 01423 g004aWater 14 01423 g004bWater 14 01423 g004cWater 14 01423 g004d
Table 1. Main characteristics of the investigated adsorbents.
NameComposition and ProductionAverage Size
(mm)
Bulk Density
(g/cm3)
Specific Surface
(m2/g)
GFH, Granular Ferric HydroxideMade by 50–60% Fe2O30.2–21.6250–300
GAC, Granular Activated CarbonProduced by steam activation of coal0.6–0.70.47500–1100
TiO2, Titanium dioxideTitanium oxide-based granulation0.25–20.705200–300
A33E, Hybrid Ion Exchange AdsorberPolystyrene crosslinked with divinylbenzene hybrid ion exchange resin (Cl form) infused with iron oxide nanoparticles [25]0.3–1.20.79–0.98 810.4 9 ± 38.2 [26]
NMF, Fine Magnetic NanomaterialFerromagnetic nanoparticles with a SiO2 core shell and titanium dioxide coating (37.5% by weight of TiO2)11.8 × 10⁻³ND110
NMG, Granular Magnetic MaterialFerromagnetic nanoparticles with a SiO2 core shell and titanium dioxide coating (37.5% by weight of TiO2)1–2ND110
ND: not determined.
Table 2. Main operating conditions of kinetic experiments.
TestC0 (mg/L F)M/V (g/L)pH (Unit)Adsorbent Type
1a2.51initialGAC, GFH, A33E, TiO2
1b2.55
1c51
1d55
1e101
1f105
1g1010
1h2.51NMF, NMG
2a2.4 (real samples)1initialGHF, A33E, TiO2,
2b2.4 (real samples)5
3a514–6–8GAC, GFH, A33E, TiO2
3b2.5GFH, A33E, TiO2
3c10GFH, A33E, TiO2
3d2.5NMF
Table 3. Kinetic models of adsorption.
Kinetic ModelNonlinear FormLinear FormLinear Plot
Zeroth C t = C 0 k 0 t C t = C 0 k 0 t C t = f ( t )
First C t = C 0 e k 1 t LnC t = lnC 0 k 1 t LnC t = f ( t )
Second C t = C 0 1 + C 0 k 2 t 1 C t = 1 C 0 + k 2 t 1 C t = f ( t )
Saturation 1 t Ln C 0 C t = 1 K s C 0 C t t + k s K s 1 t Ln C 0 C t = f ( C 0 C t t )
Pseudo-first Q t = Q e ( 1 e k 1 t ) Ln ( 1 ( Q t Q e ) ) = k 1 t Ln ( 1 ( Q t Q e ) ) = f ( t )
Pseudo-second Q t = ( k 2 Q e 2 ) t ( 1 + k 2 Q e t ) t Q t = t Q e + ( 1 k 2 Q e 2 ) t Q t = f ( t )
Weber and Morris Q t = k i t 1 2 + C i Q t = f ( t 1 2 )
Bangham Q t = kt θ LnQ t = θ Lnt + Lnk LnQ t = f ( Lnt )
Legend: k0 = rate constant of the zeroth-order; k1 = rate constant of the first-order; k2 = rate constant of the second-order; ks = rate constant of the saturation-order; Ks = half-velocity constant; k’1 = rate constant of the pseudo-first order; k’2 = rate constant of the pseudo-second order; ki = rate constant of the intraparticle diffusion model (i.e., Weber and Morris); Ci = constant of the intraparticle diffusion model (i.e., Weber and Morris) related to the thickness of the interface layer; k and θ = constants of the Bangham model.
Table 4. Main operating conditions of isotherm experiments.
C0 (mg/L)M/V (g/L)pH (Unit)Adsorbent
2.5–5–101–5initialGAC, GFH, A33E, TiO2
2.5–5–1014–6–8GFH, A33E, TiO2
Table 5. Isotherm models of adsorption.
Isotherm ModelNonlinear FormLinear FormLinear Plot
Langmuir Q e = Q max bC e 1 + bC e 1 Q e = 1 Q max b 1 C e + 1 Q max 1 Q e = f ( 1 C e )
Freundlich Q e = K f C e 1 n LnQ e = LnK f + 1 n LnC e LnQ e = f ( LnC e )
BET Q e = K b · C e · Q max ( C s C e ) [ 1 + ( K b 1 ) C e C s ] C e ( C s C e ) Q e = 1 K b · Q max + K b 1 K b · Q max C e C s C e ( C s C e ) Q e = f ( C e C s )
Temkin Q e = RT b ( lnAC e ) Q e = B · lnA + B · lnC e Q e = f ( lnC e )
Legend: Qmax = maximum adsorption capacity (i.e., the amount of fluoride adsorbed per unit weight of adsorbent in forming a complete monolayer on the surface); b = Langmuir constant (indirectly related to the energy or net enthalpy of adsorption); Kf = Freundlich equilibrium constant (indicative of adsorption capacity); n = adsorption equilibrium constant of the Freundlich isotherm (reciprocal number is indicative of the heterogeneity of surface sorbent); Kb = constant related to the interaction energy between solute and adsorbent; Cs = saturation concentration of fluoride in the liquid solution; B = Temkin’s constant related to the adsorption process heat = RT/b; R = universal gas constant; T = absolute temperature; b = variation in adsorption energy; A = constant of the Temkin equation, indicating the equilibrium binding constant corresponding to the maximum binding energy.
Table 6. Maximum adsorption capacity at C0 = 10 mg/L.
Qmax (mg/g)
Dose (g/L)/1510
Adsorbent
A33E2.07410.80300.4167
TiO25.11512.02181.0373
GFH0.10710.15640.1379
GAC0.54460.55530.2942
Table 7. Significant parameters related to the various isotherm models for initial pH.
A33ER2b (L/mg)Kf (mg/g)nKbQmax (mg/g)BA (L/mg)
Langmuir0.8089−0.0071 −27.9330
Freundlich0.7756 0.22371.0676
BET0.0314 26.08007.6687
Temkin0.6597 0.74750.9750
TiO2R2b (L/mg)Kf (mg/g)nKbQmax (mg/g)BA (L/mg)
Langmuir0.98262.0400 4.1900
Freundlich0.9798 2.49002.2400
BET0.9900 874.50005.7200
Temkin0.9747 2.860013.6600
Note: Italics is used to indicate the highest R2; grey shadow shows the highest adsorption capacity.
Table 8. Significant parameters related to the various isotherm models for fixed pH at 4–6–8.
A33ER2b (L/mg)Kf (mg/g)nKbQmax (mg/g)BA (L/mg)
pH = 4
Langmuir0.982532.9761 4.0000
Freundlich0.8571 2.43002.6500
BET0.8206 506,334.30006.5800
Temkin0.7908 1.20848.5844
pH = 6
Langmuir0.9825−1.5738 −5.9400
Freundlich0.9880 0.28000.9100
BET0.2663 −15,324.0000−16.3100
Temkin0.9883 1.45950.7438
pH = 8
Langmuir0.00295.4603 7.3584
Freundlich0.0236 0.8638−11.7600
BET0.9453 −943,598.99990.5299
Temkin0.0197 0.000−0.0696
TiO2R2b (L/mg)Kf (mg/g)nKb Qmax (mg/g)BA (L/mg)
pH = 4
Langmuir0.7952−92.5523 −19.4175
Freundlich0.8785 5.99100.9553
BET0.0165 −48,999−102.04
Temkin0.9771 3.76645.1332
pH = 6
Langmuir0.92287.8827 8.3612
Freundlich0.8730 1.00351.6474
BET0.9103 223,778.7774.9700
Temkin0.9565 2.13531.1572
Note: Italics is used to indicate highest R2; grey shadow shows the highest adsorption capacity.
Publisher’s Note: MDPI stays neutral with regard to jurisdictional claims in published maps and institutional affiliations.

