
The Influencing Factors of Water Uses in the Yellow River Basin: A Physical, Production-Based, and Consumption-Based Water Footprint Analysis by the Random Forest Model

Abstract
:1. Introduction
2. Materials and Methods
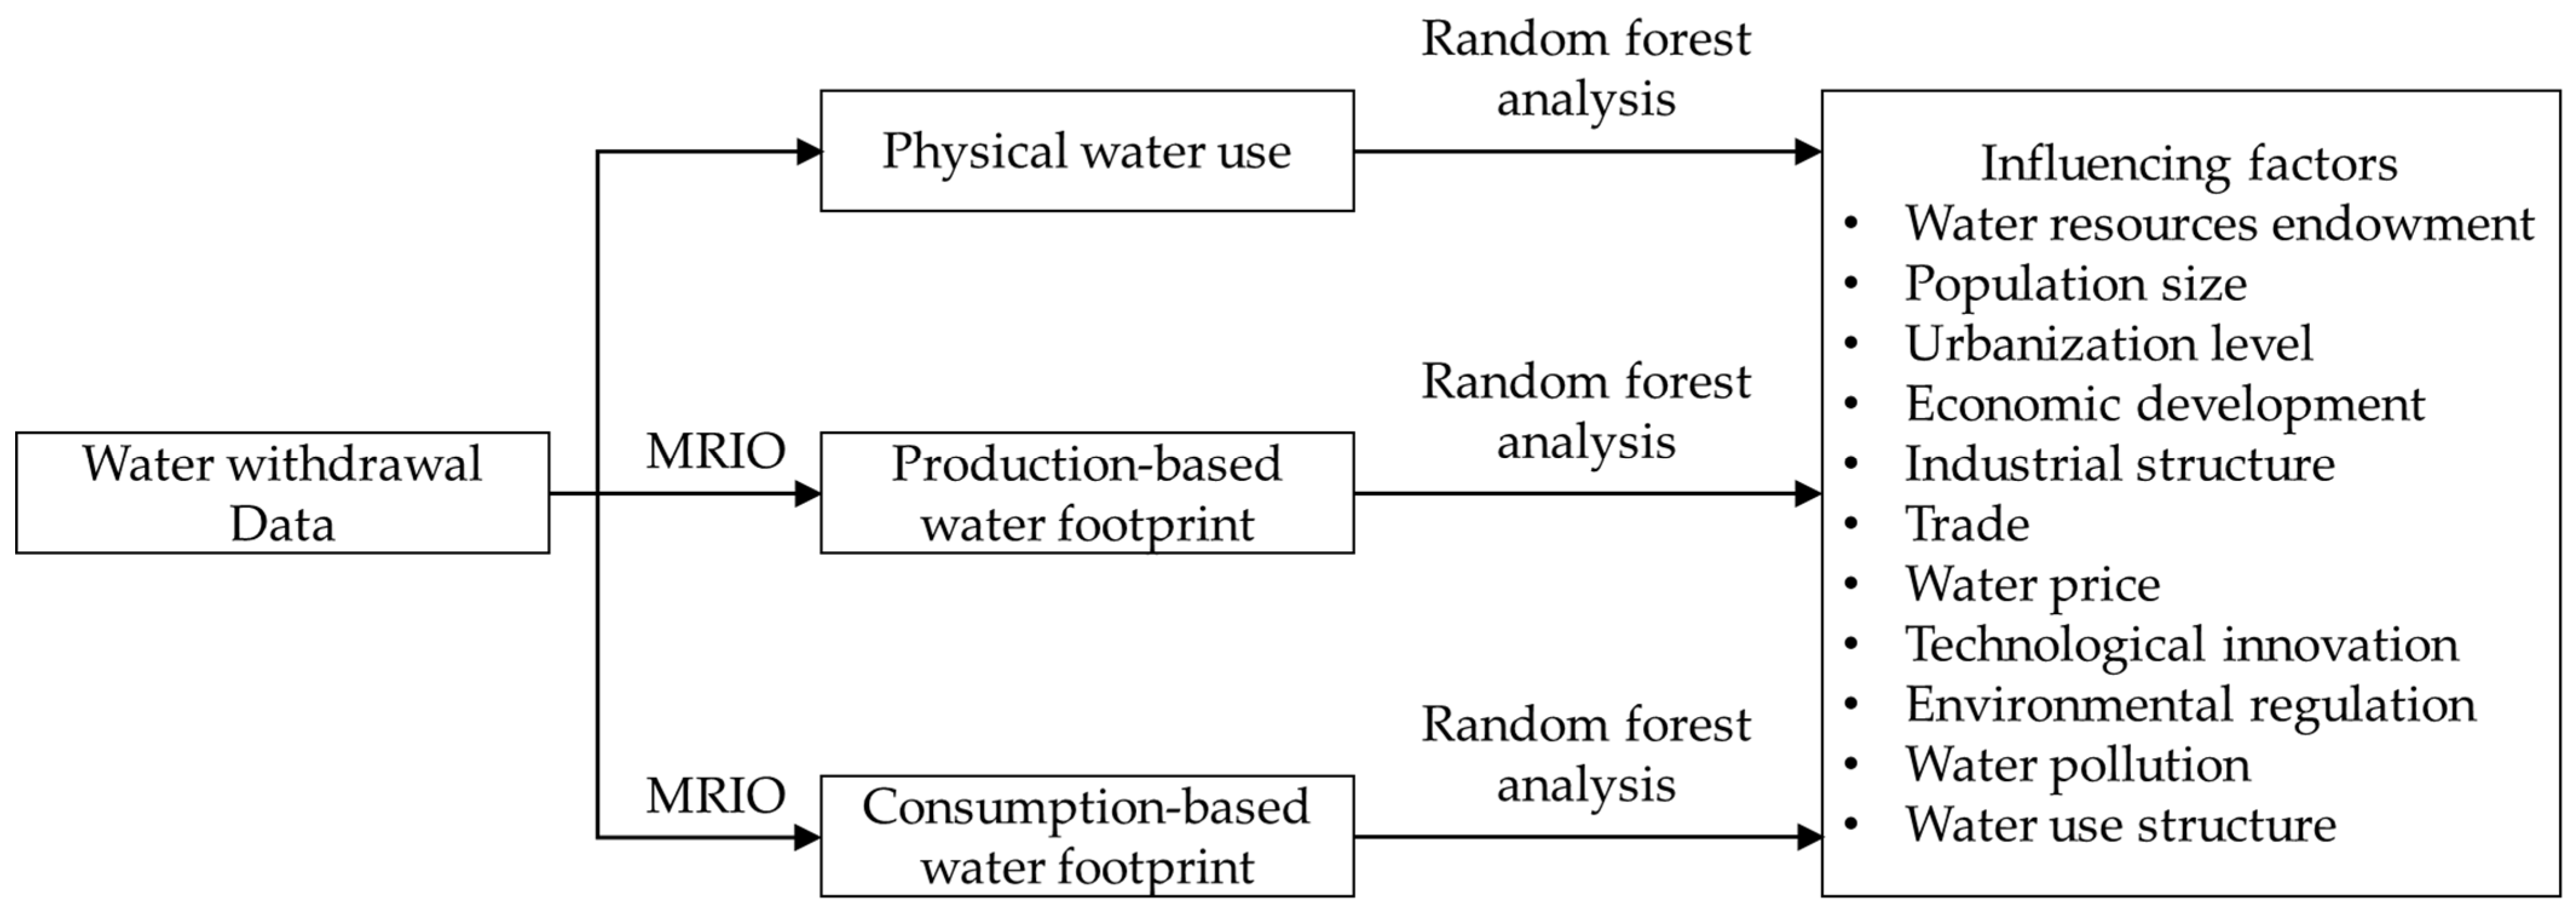
2.1. Production-Based and Consumption-Based Water Footprints
2.2. Random Forest Model
2.3. Factors That Influence Water Resource Utilization
2.4. Data Resources
3. Results
3.1. Water Use in the Yellow River Basin
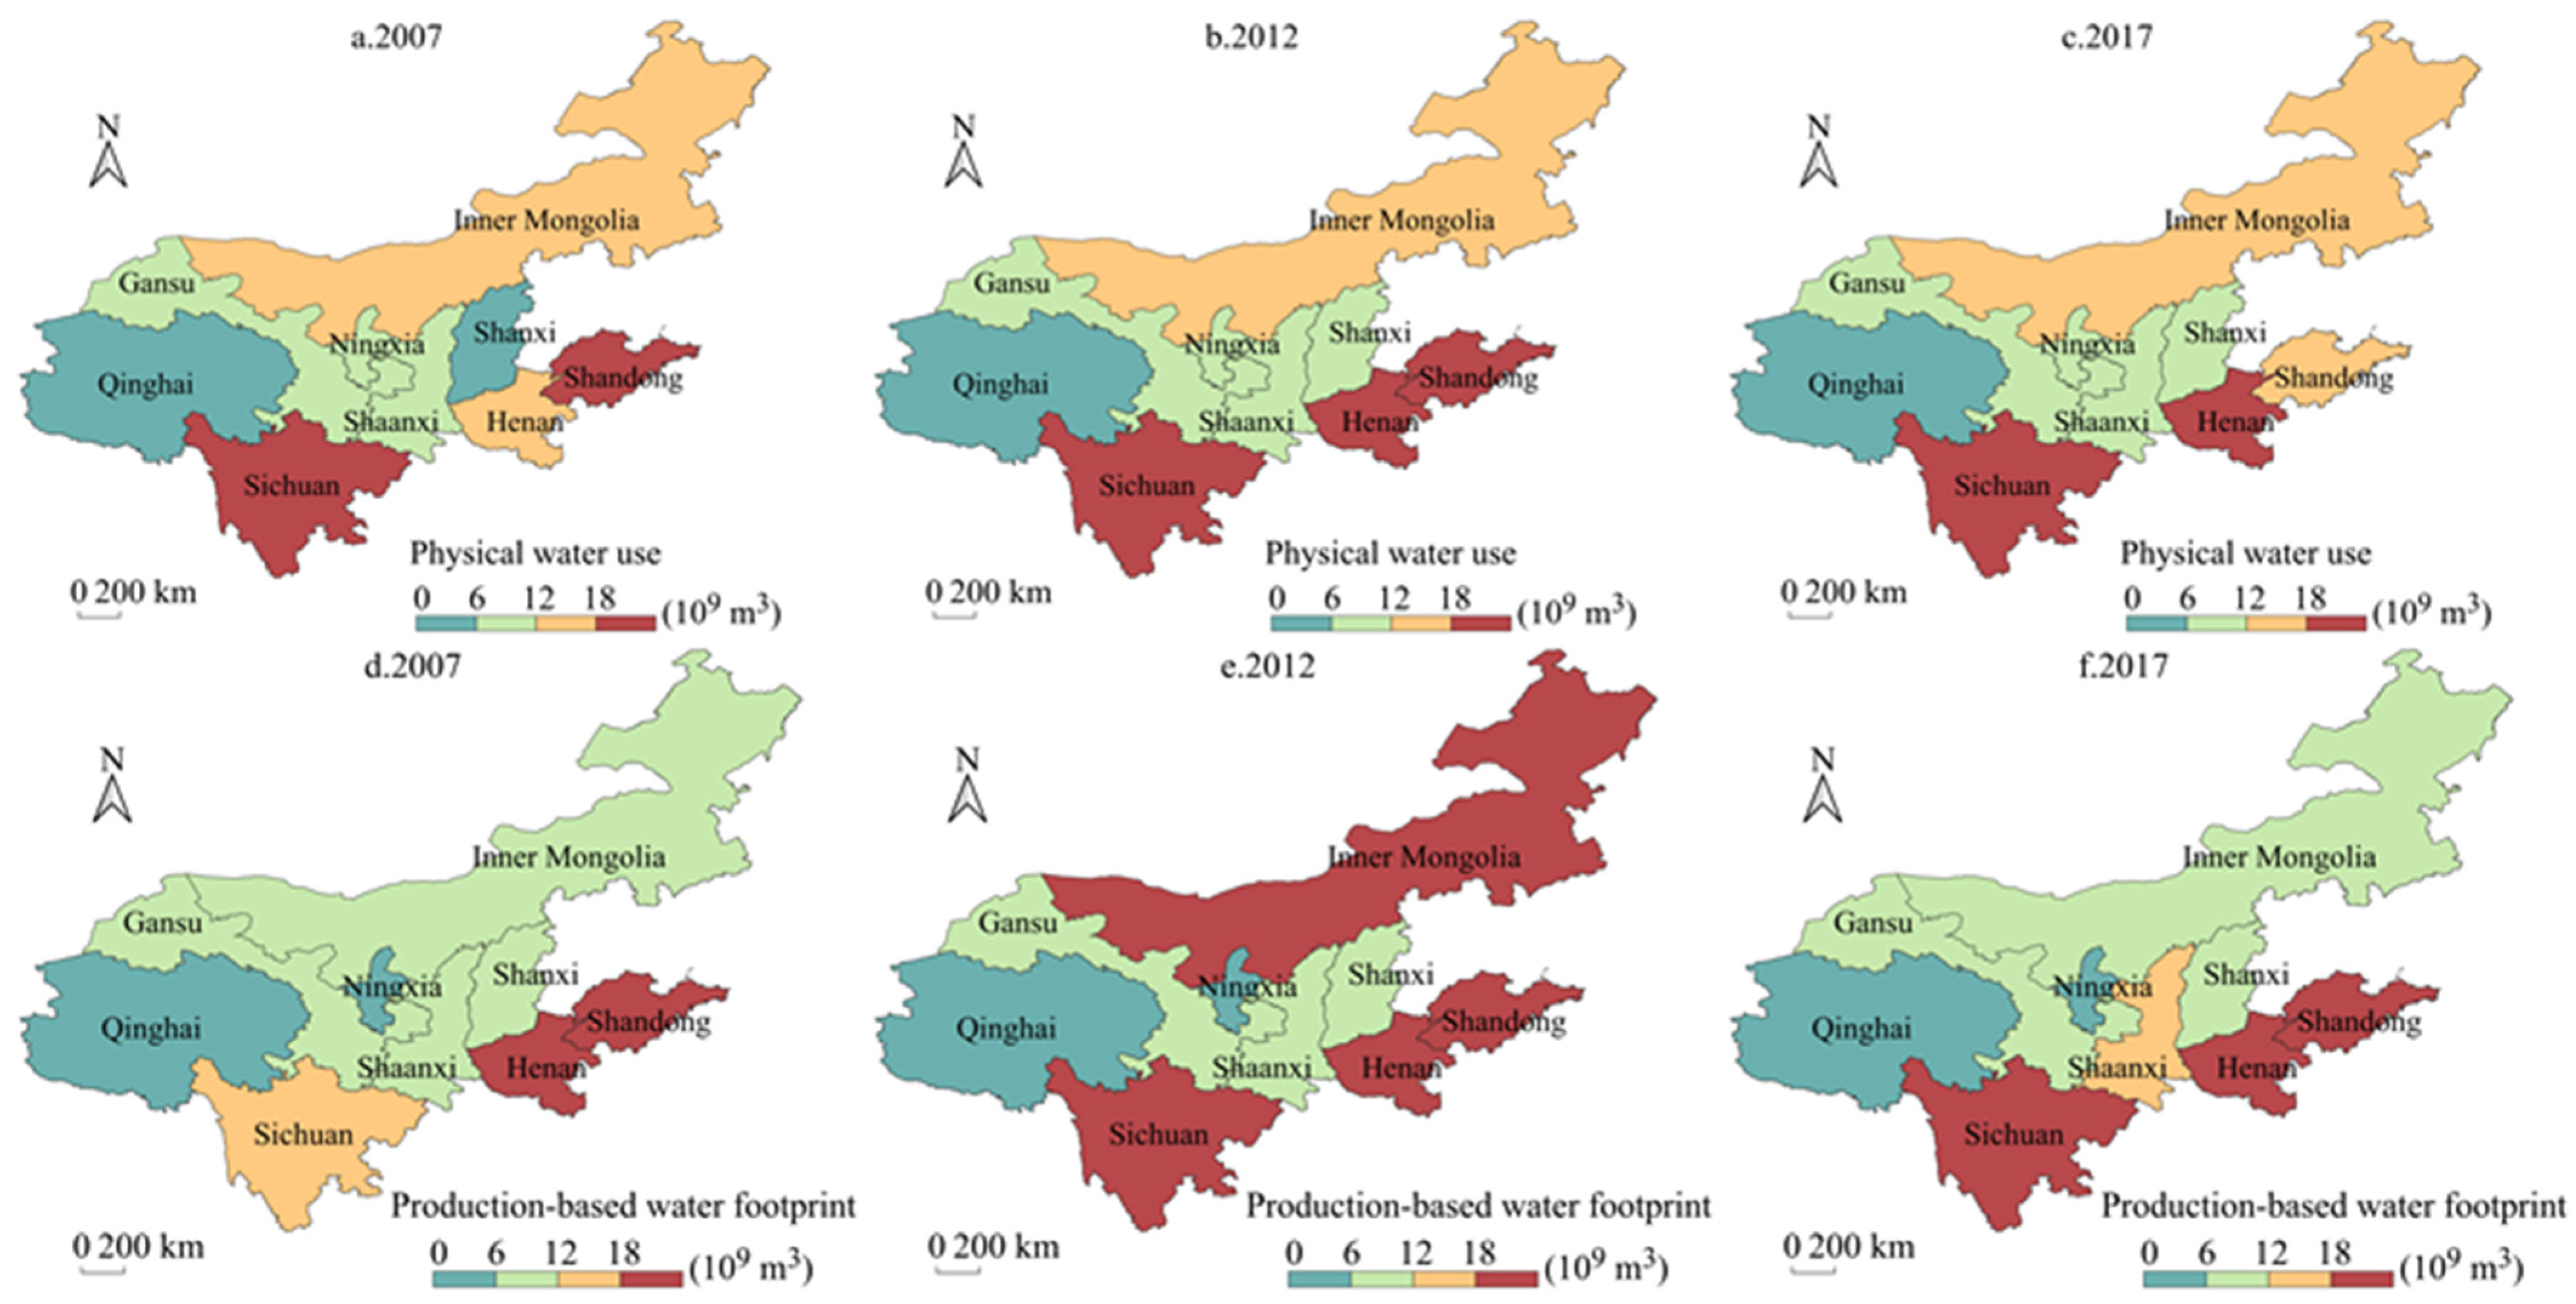
3.1.1. Spatial and Temporal Evolution of Physical Water Use
3.1.2. Spatial and Temporal Evolution of the Production-Based Water Footprint
3.1.3. Spatial and Temporal Evolution of the Consumption-Based Water Footprint
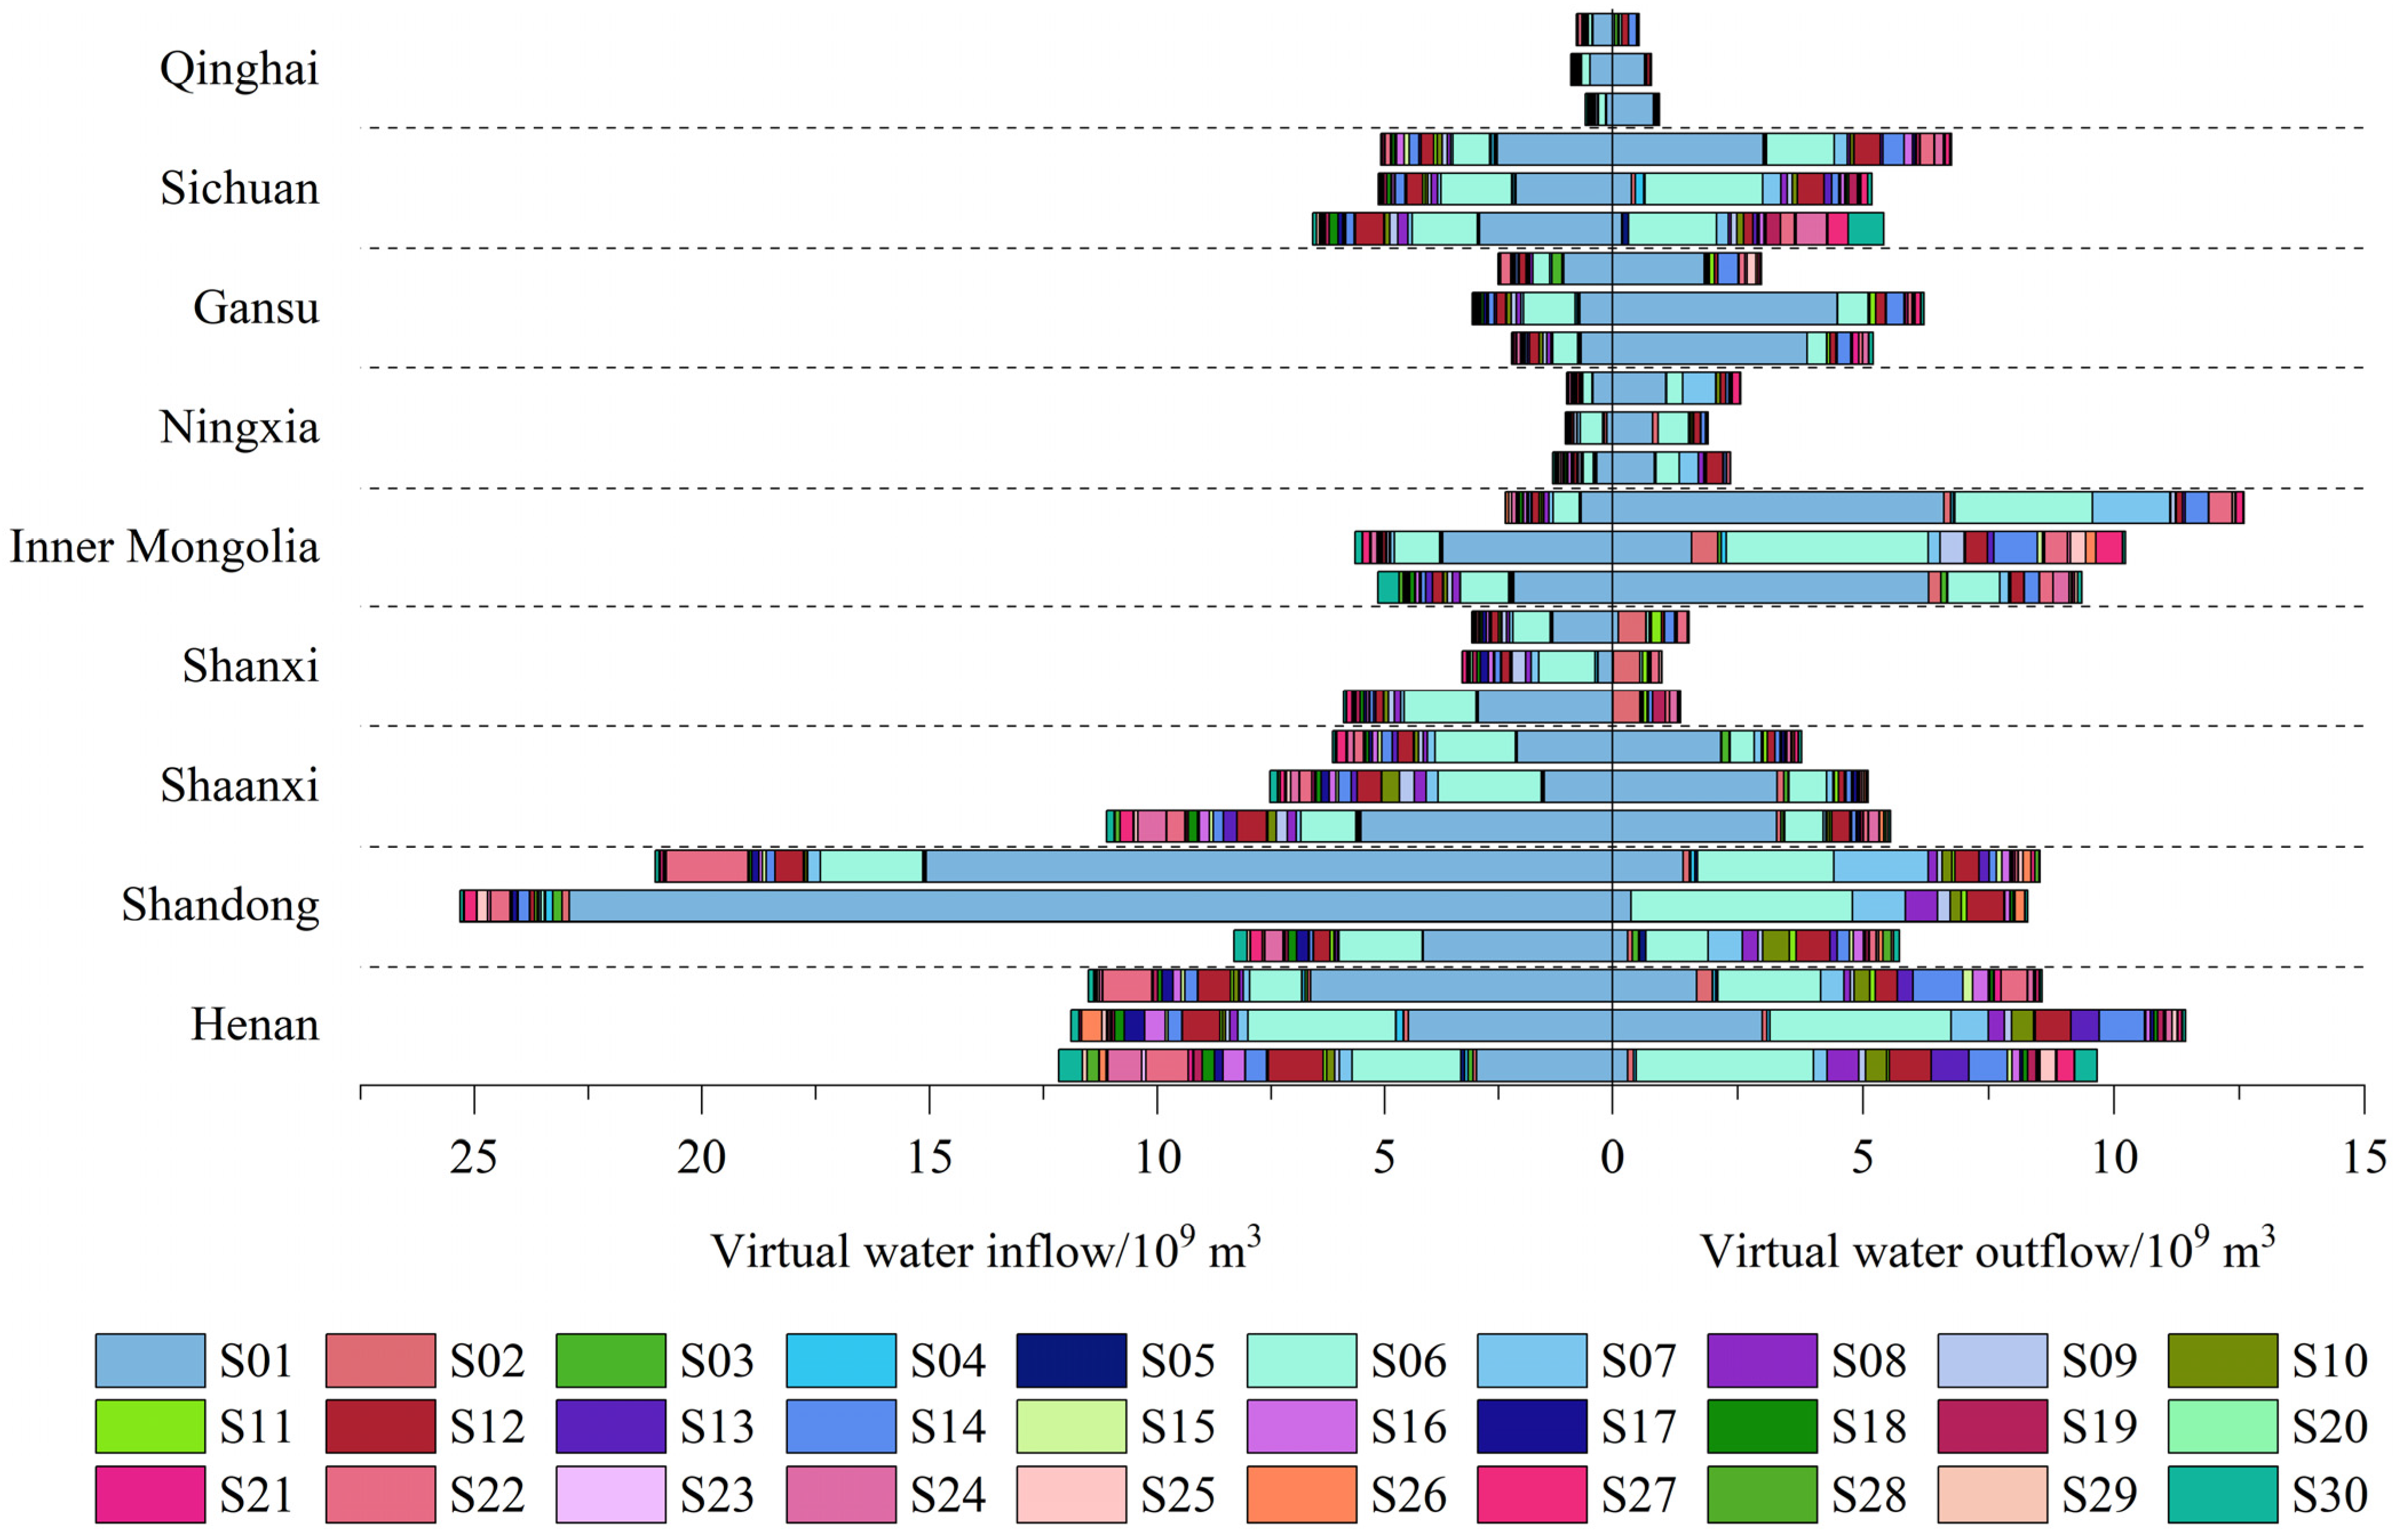
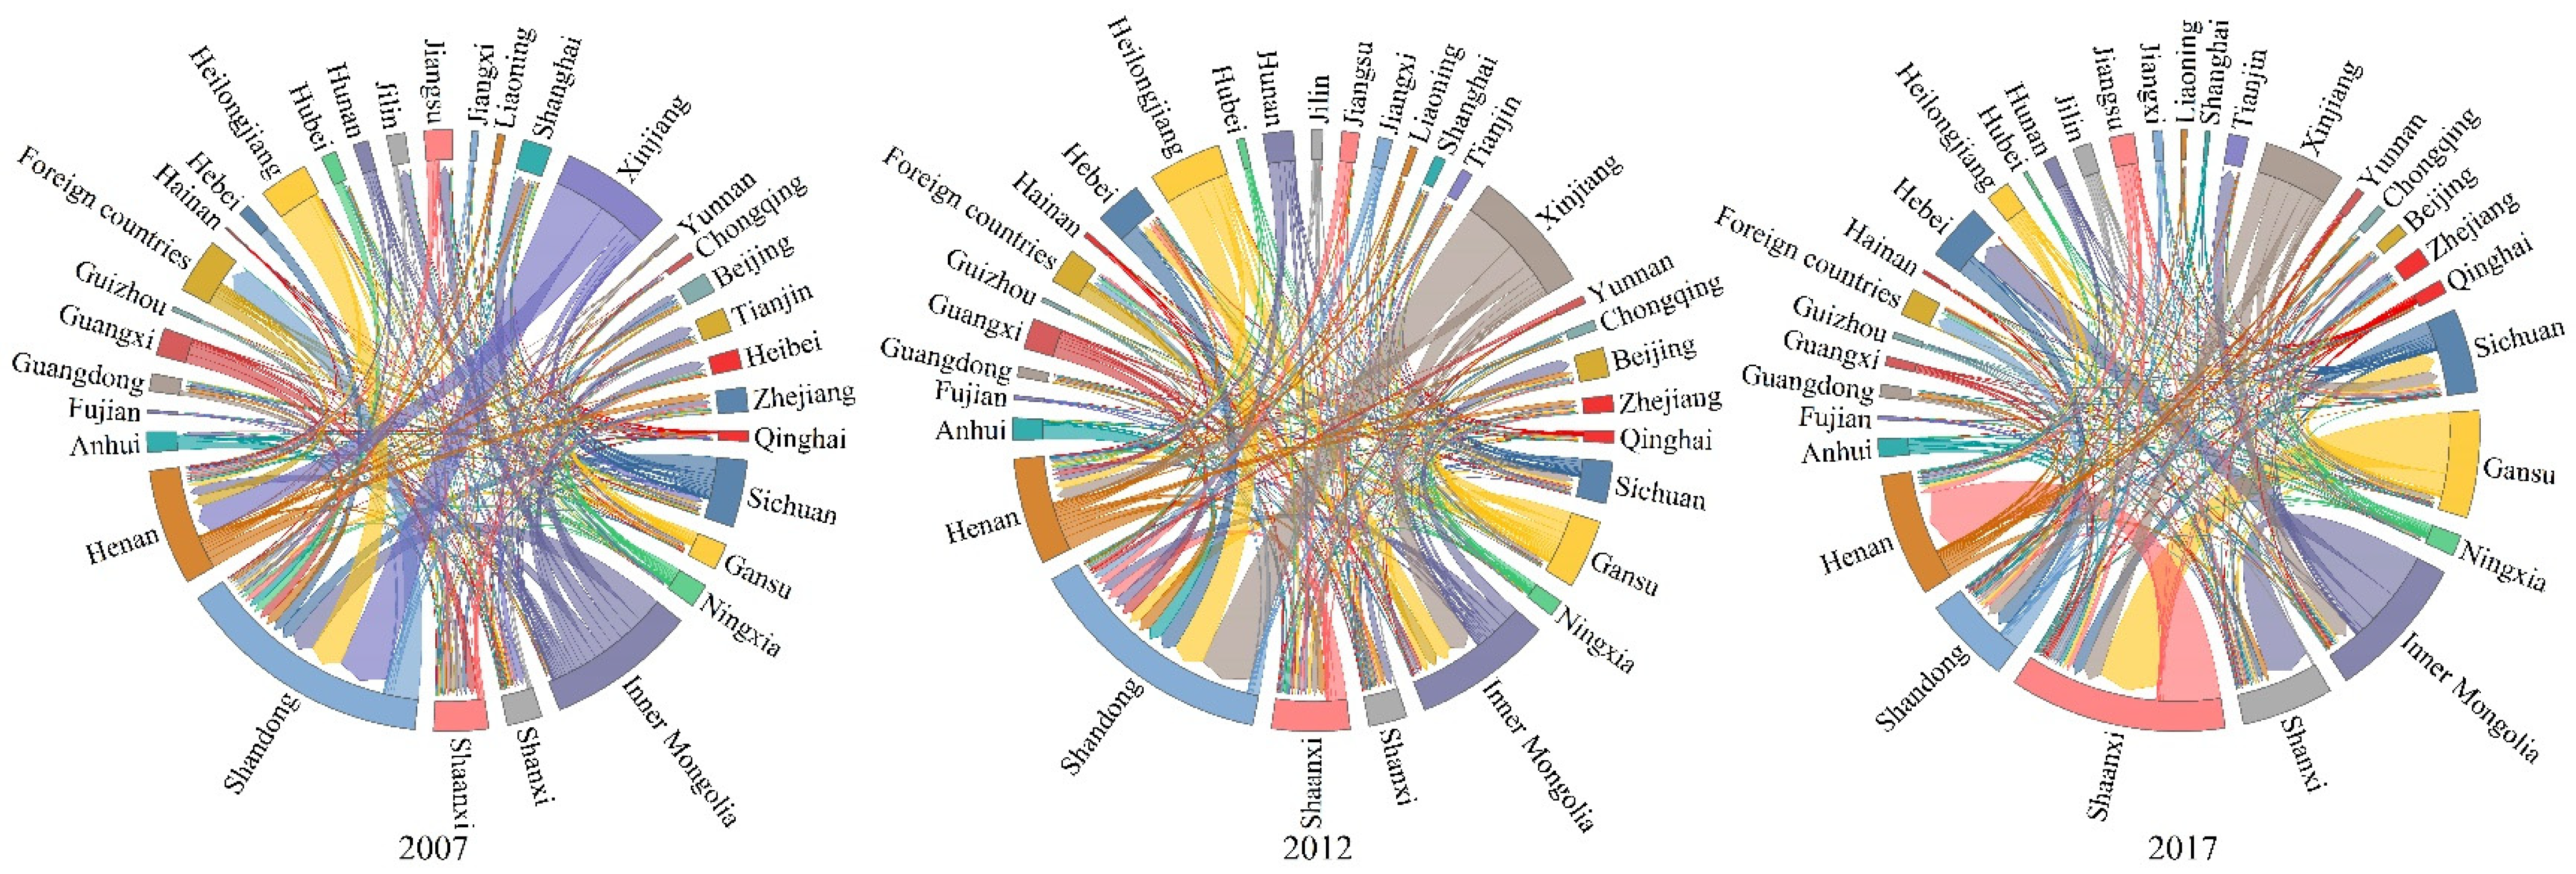
3.1.4. Virtual Water Flow
3.2. The Key Influencing Factors of Water Use
3.2.1. Influencing Factors of Physical Water Use
3.2.2. Influencing Factors of the Production-Based Water Footprint
3.2.3. Influencing Factors of the Consumption-Based Water Footprint
4. Discussion
4.1. Comparison with the Literature
4.2. Policy Implications
- (1)
- Population size control. For provinces with large populations, such as Sichuan, Shandong, and Henan, certain population policies can be formulated to control the size of the population and prevent the rapid growth of the population from leading to a sharp increase in water consumption.
- (2)
- Water use structure adjustment. Agricultural water consumption should be restricted, and the scale of low-water consumption and drought-tolerant crops should be expanded. Implementing the total control of agricultural water use, advancing comprehensive price reform, and setting differentiated water prices by level and classification. Increasing industrial water resource input is beneficial for reducing agricultural water consumption, but attention should be paid to limiting water use in high-water consumption sectors. Measures such as the over-quota progressive increase in the water price can be taken for the orderly exit of high-water consumption industries.
- (3)
- Trade structure optimization. For provinces with large virtual water outflows, such as Inner Mongolia, Gansu, Shaanxi, Shandong, and Henan, the existing export structure can be changed by, for example, charging taxes on commodity exports or stimulating local consumption to reduce virtual water exports, thus easing the pressure on water resources caused by virtual water exports. For regions with large virtual water inflows, such as Shanxi, Shaanxi, Shandong, and Henan, measures can be taken, such as importing high-consumption water products from regions with high water resource utilization levels and giving compensation to the virtual water source areas to help upstream regions reduce their water consumption, thus reducing the dependence on external water resources.
- (4)
- Technological innovation. Increasing investment in technological innovation, intensifying research on water resource utilization, and supporting technological innovation in agriculture and animal husbandry in the Yellow River basin. Accelerating the deployment of technology infrastructure facilities and conducting overall planning for the development of several state key laboratories, industry innovation centers, engineering research centers, and other platforms for technological innovation. Strengthening the training and introduction of personnel of science and technology, engineering, promoting the transformation and application of innovation, and enabling the fundamental transformation of water use from inefficient to economical and intensive.
- (5)
- Investment in pollution control. Promoting the development of sewage treatment, strengthening technical research and financial investment in advanced technology, equipment, and technology, such as industrial pollution prevention, and improving the overall sewage treatment capacity of the region. Based on existing sewage treatment plants, reasonably laying out sewage recycling facilities, promoting the resourceful use of sewage, and ultimately reducing the amount of wastewater discharge and water consumption.
- (6)
- Industrial structure upgrade. Under the premise of safeguarding food security, based on resources, factor endowment, and development foundation to develop the characteristic industry. Actively supporting the development of water-saving facility agriculture, accelerating new and old kinetic energy conversion, and promoting the high-quality development of manufacturing and transformation of resource-based industries. Implementing strict access to high water-consuming industries, supporting the development of high value-added industries with low water consumption, building a modern industrial system that takes advantage of local strengths, and to a certain extent, easing the pressure of water resources brought by rapid economic growth.
4.3. Limitations of the Study
5. Conclusions
- (1)
- Physical water use, the production-based water footprint, and the consumption-based water footprint in the Yellow River basin increased and then decreased from 2007 to 2017. The upper and lower reaches had large water use, while the middle reach had small water use. Provinces with relatively developed agriculture and a large economic scale have large water usages, such as Shandong, Henan, and Sichuan.
- (2)
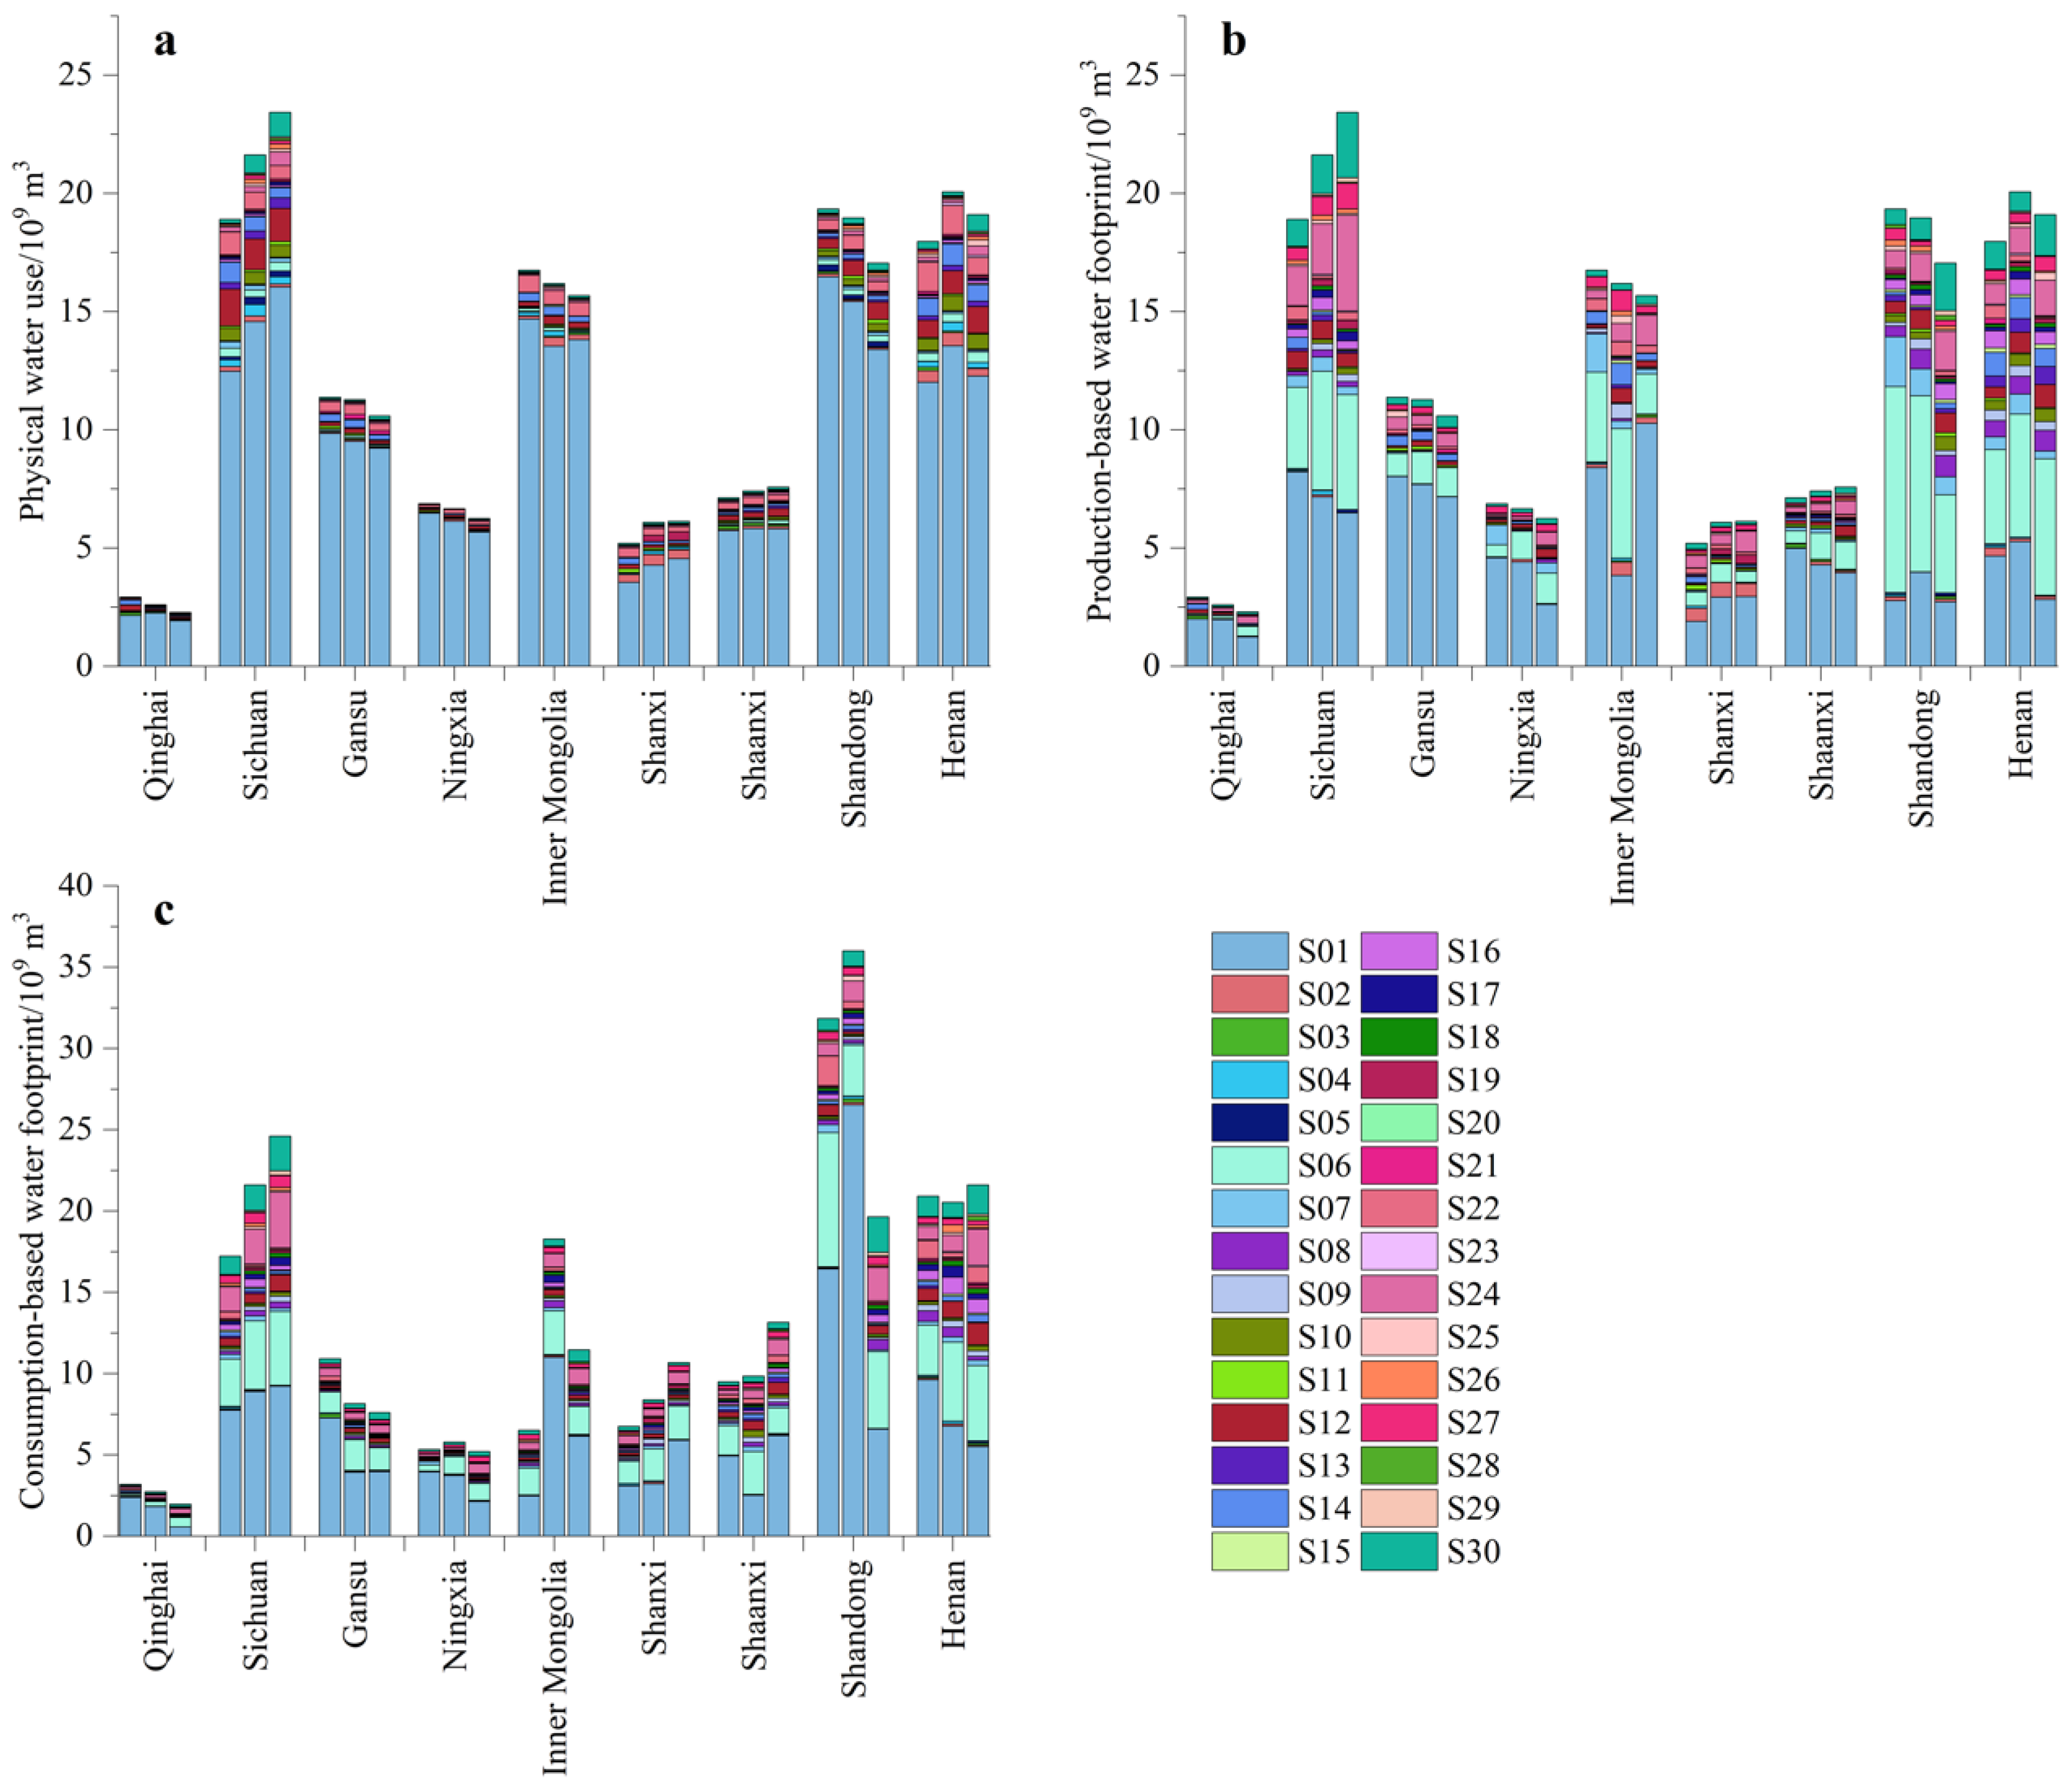
- Physical water use in the Yellow River basin was dominated by high-water consumption industries. Agriculture, forestry, animal husbandry, and fisheries consumed the biggest amount of water, followed by electricity, hot water production, supply, and chemicals. The production-based water footprint in the Yellow River basin was dominated by agriculture and related industries. Agriculture, forestry, animal husbandry, and fisheries were the largest sectors, followed by food and tobacco processing, construction, other services, textiles, and chemicals. Demand from downstream industries accounted for about half of physical water use in agriculture, forestry, animal husbandry, and fisheries. The consumption-based water footprint in the Yellow River basin is also dominated by agriculture and related industries. Agriculture, forestry, animal husbandry, fisheries, food and tobacco processing, construction, other services, and chemicals were the main sectors. Overall, achieving high-quality development goals in the Yellow River basin remains a challenge.
- (3)
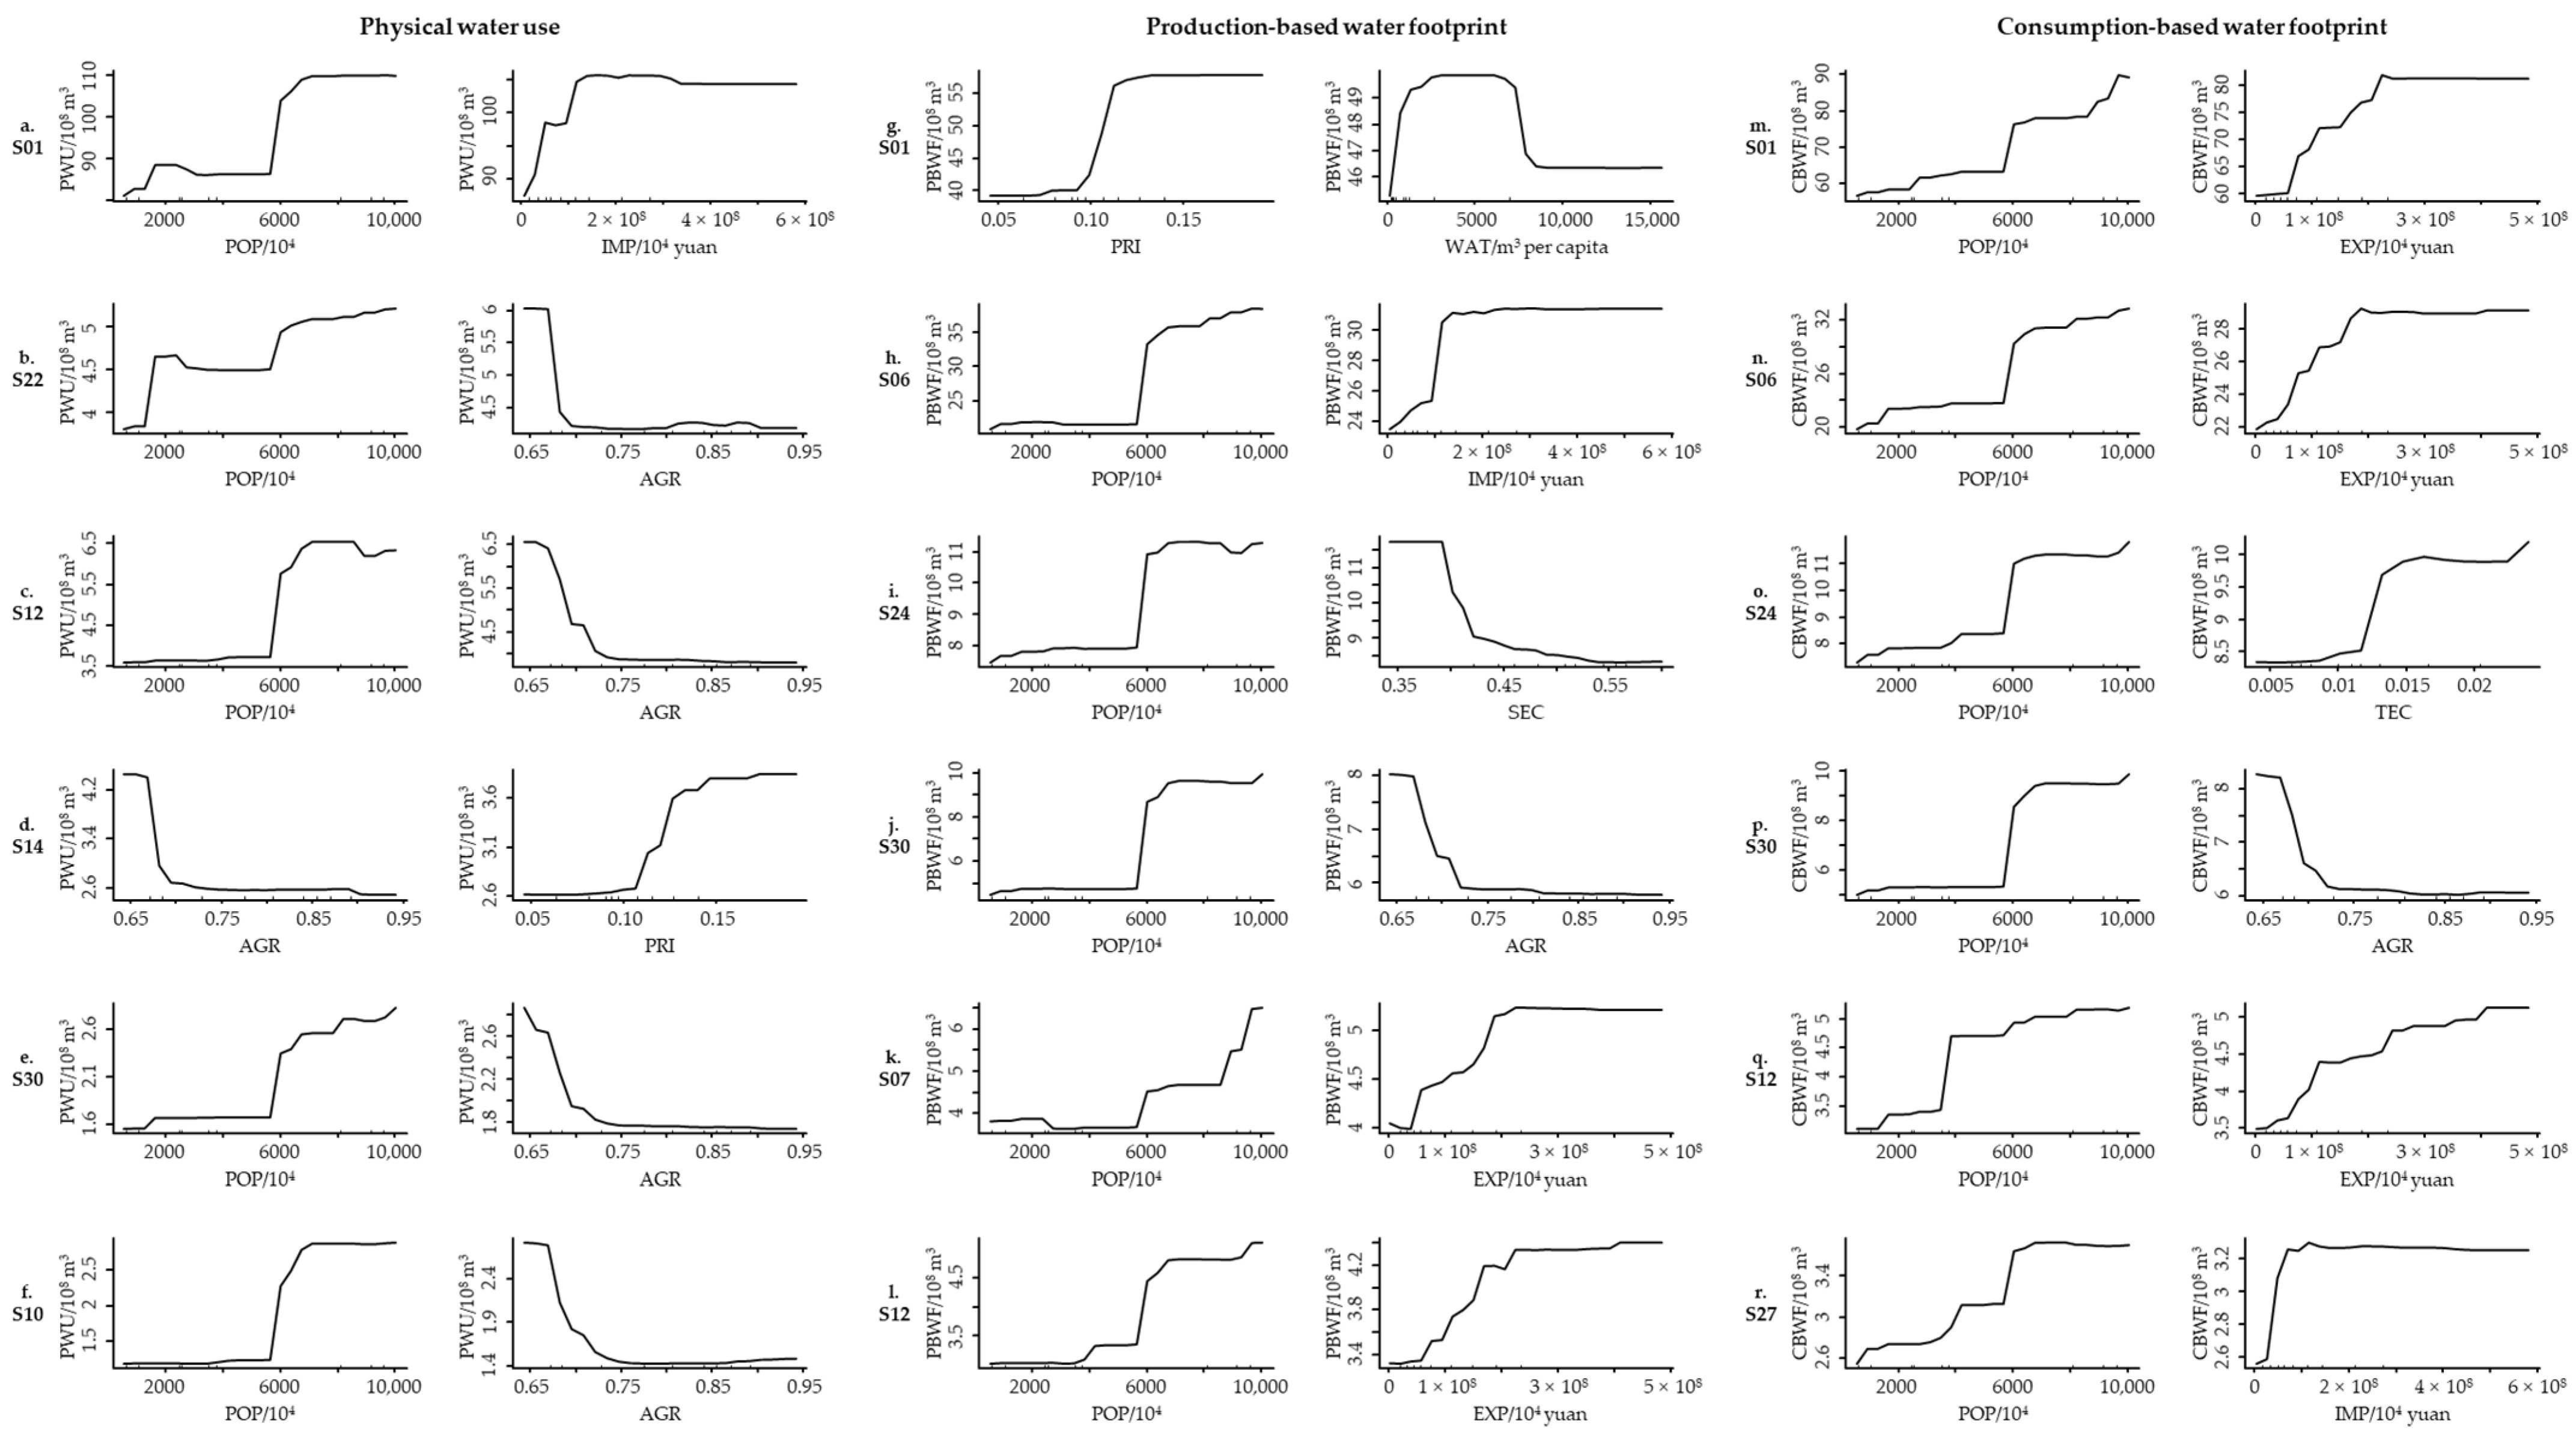
- According to the results of the random forest model, physical water uses in the first six sectors is mainly affected by total population, the proportion of agricultural water use to total regional water use, total inflow, and the proportion of value added of the primary industry to regional GDP. Production-based water footprints in the first six sectors are mainly affected by total population, the proportion of value added by the primary industry to regional GDP, the proportion of value added by the secondary industry to regional GDP, total inflow, total outflow, water resources per capita, and the proportion of agricultural water use to total regional water use. Consumption-based water footprints in the first six sectors are mainly affected by total population, total inflow, total outflow, the proportion of R&D investment to regional GDP, and the proportion of agricultural water use to total regional water use. The key influencing factors have an obvious linear or nonlinear relationship with the three kinds of water uses. There are also differences in the influencing factors of water use among the three perspectives due to the differences in water resource utilization.
Author Contributions
Funding
Data Availability Statement
Conflicts of Interest
References
- Yin, Y.Y.; Tang, Q.H.; Liu, X.C.; Zhang, X.J. Water scarcity under various socio-economic pathways and its potential effects on food production in the Yellow River basin. Hydrol. Earth Syst. Sci. 2017, 21, 791–804. [Google Scholar] [CrossRef] [Green Version]
- Allan, T. Fortunately there are substitutes for water: Otherwise our hydropolitical futures would be impossible. In: ODA, Priorities for Water Resources Allocation and Management. Lond. Overseas Dev. Adm. 1993, 13, 13–26. [Google Scholar]
- Zhang, C.J.; Zhao, Y.; Shi, C.F.; Chiu, Y.-H. Can China achieve its water use peaking in 2030? A scenario analysis based on LMDI and Monte Carlo method. J. Clean. Prod. 2021, 278, 123214. [Google Scholar] [CrossRef]
- Xu, H.; Yang, R.; Song, J.F. Agricultural Water Use Efficiency and Rebound Effect: A Study for China. Int. J. Environ. Res. Public Health 2021, 18, 7151. [Google Scholar] [CrossRef] [PubMed]
- Wang, H.R.; Liu, H.L.; Wang, C.; Bai, Y.; Fan, L.L. A study of industrial relative water use efficiency of Beijing: An application of data envelopment analysis. Water Policy 2019, 21, 326–343. [Google Scholar] [CrossRef]
- Dong, R.; Noman, R.; Wu, G.Y.; Gao, Q. Agricultural water use efficiency and spatial spillover effect considering undesired output in China. Water Policy 2022, 24, 1658–1675. [Google Scholar] [CrossRef]
- Zhang, C.; Zhong, L.J.; Wang, J. Decoupling between water use and thermoelectric power generation growth in China. Nat. Energy 2018, 3, 792–799. [Google Scholar] [CrossRef]
- Liu, J.; Bao, Z.X.; Liu, C.S.; Wang, G.Q.; Liu, Y.; Wang, J.; Guan, X.X. Change law and cause analysis of water resources and water consumption in China in past 20 years. Hydro-Sci. Eng. 2019, 4, 31–41. (In Chinese) [Google Scholar]
- Wu, F.; Zhang, X.F.; Cui, X.F. Characteristics and Future Trends of Water Resources Utilization in China. J. Yangtze River Sci. Res. Inst. 2017, 34, 30–39. (In Chinese) [Google Scholar] [CrossRef]
- Yan, Z.Q.; Zhou, Z.H.; Liu, J.J.; Wang, H.; Li, D. Water use characteristics and impact factors in the Yellow River basin, China. Water Int. 2020, 45, 148–168. [Google Scholar] [CrossRef]
- Zuo, Q.T.; Zhang, Z.Z.; Ma, J.X. Relationship between water resource utilization level and socio⁃economic development in the Yellow River Basin. Chin. J. Popul. Resour. Environ. 2021, 31, 29–38. (In Chinese) [Google Scholar]
- Dong, H.J.; Geng, Y.; Fujita, T.; Fujii, M.; Hao, D.; Yu, X.M. Uncovering regional disparity of China’s water footprint and inter-provincial virtual water flows. Sci. Total Environ. 2014, 500–501, 120–130. [Google Scholar] [CrossRef] [PubMed]
- Chapagain, A.K.; Hoekstra, A.Y. Value of Water Research Report Series (No.16). IHE Delft 2004, 16, 1–80. [Google Scholar]
- Zhao, D.D.; Tang, Y.; Liu, J.G.; Tillotson, M.R. Water footprint of Jing-Jin-Ji urban agglomeration in China. J. Clean. Prod. 2017, 167, 919–928. [Google Scholar] [CrossRef]
- Feng, K.S.; Chapagain, A.; Suh, S.; Pfister, S.; Hubacek, K. Comparison of bottom-up and top-down approaches to calculating the water footprints of nations. Econ. Syst. Res. 2011, 23, 371–385. [Google Scholar] [CrossRef]
- Zhao, X.; Tillotson, M.; Yang, Z.F.; Yang, H.; Liu, J.G. Reduction and reallocation of water use of products in Beijing. Ecol. Indic. 2016, 61, 893–898. [Google Scholar] [CrossRef] [Green Version]
- Lovarelli, D.; Bacenetti, J.; Fiala, M. Water Footprint of crop productions: A review. Sci. Total Environ. 2016, 548–549, 236–251. [Google Scholar] [CrossRef]
- Li, H.Y.; Qin, L.J.; He, H.S. Characteristics of the water footprint of rice production under different rainfall years in Jilin Province, China. J. Sci. Food Agric. 2018, 98, 3001–3013. [Google Scholar] [CrossRef]
- Chen, Z.M.; Chen, G.Q. Virtual water accounting for the globalized world economy: National water footprint and international virtual water trade. Ecol. Indic. 2013, 28, 142–149. [Google Scholar] [CrossRef]
- Feng, K.S.; Siu, Y.L.; Guan, D.B.; Hubacek, K. Assessing regional virtual water flows and water footprints in the Yellow River Basin, China: A consumption based approach. Appl. Geogr. 2012, 32, 691–701. [Google Scholar] [CrossRef]
- Deng, G.Y.; Ma, Y.; Li, X. Regional water footprint evaluation and trend analysis of China-based on interregional input- output model. J. Clean. Prod. 2016, 112, 4674–4682. [Google Scholar] [CrossRef]
- Feng, L.; Chen, B.; Hayat, T.; Alsaedi, A.; Ahmad, B. The driving force of water footprint under the rapid urbanization process: A structural decomposition analysis for Zhangye city in China. J. Clean. Prod. 2017, 163, S322–S328. [Google Scholar] [CrossRef]
- Wu, Z.D.; Wang, Z.Q.; Upmanu, L. Spatial difference of water footprint in China in the production perspective based on the analytical hierarchy of economic regions. Resour. Sci. 2015, 37, 2039–2050. (In Chinese) [Google Scholar]
- Wu, Z.D.; Wu, Z.L.; Zhang, C.Z. Regional comparison of water footprint in China based on the multi-regional input-output analysis: In the analytical level of economic regions. J. Glaciol. Geocryol. 2017, 39, 207–219. (In Chinese) [Google Scholar]
- Chen, W.M.; Wu, S.M.; Lei, Y.L.; Li, S.T. China’s water footprint by province, and inter-provincial transfer of virtual water. Ecol. Indic. 2017, 74, 321–333. [Google Scholar] [CrossRef]
- Deng, G.Y.; Li, L.; Song, Y.N. Provincial water use efficiency measurement and factor analysis in China: Based on SBM-DEA model. Ecol. Indic. 2016, 69, 12–18. [Google Scholar] [CrossRef]
- Zhong, Z.Q.; Chen, Z.L.; Deng, X.J. Dynamic change of inter-regional virtual water transfers in China: Driving factors and economic benefits. Water Resour. Econ. 2022, 39, 100203. [Google Scholar] [CrossRef]
- Zhou, F.; Bo, Y.; Ciais, P.; Dumas, P.; Tang, Q.H.; Wang, X.H.; Liu, J.G.; Zheng, C.M.; Polcher, J.; Yin, Z.; et al. Deceleration of China’s human water use and its key drivers. Proc. Natl. Acad. Sci. USA 2020, 117, 7702–7711. [Google Scholar] [CrossRef]
- Song, M.L.; Wang, R.; Zeng, X.Q. Water resources utilization efficiency and influence factors under environmental restrictions. J. Clean. Prod. 2018, 184, 611–621. [Google Scholar] [CrossRef]
- Zhao, C.F.; Chen, B.; Hayat, T.; Alsaedi, A.; Ahmad, B. Driving force analysis of water footprint change based on extended STIRPAT model: Evidence from the Chinese agricultural sector. Ecol. Indic. 2014, 47, 43–49. [Google Scholar] [CrossRef]
- Yang, J.; Chen, X.H. Quantification of the Driving Factors of Water Use in the Productive Sector Change Using Various Decomposition Methods. Water Resour. Manag. 2019, 33, 4105–4121. [Google Scholar] [CrossRef]
- Ma, H.L.; Shi, C.L.; Chou, N.T. China’s Water Utilization Efficiency: An Analysis with Environmental Considerations. Sustainability 2016, 8, 516. [Google Scholar] [CrossRef] [Green Version]
- Zhang, X.X.; Liu, J.G.; Zhao, X.; Yang, H.; Deng, X.Z.; Jiang, X.H.; Li, Y.P. Linking physical water consumption with virtual water consumption: Methodology, application and implications. J. Clean. Prod. 2019, 228, 1206–1217. [Google Scholar] [CrossRef]
- Zhao, X.; Liao, X.W.; Chen, B.; Tillotson, M.R.; Guo, W.; Li, Y.P. Accounting global grey water footprint from both consumption and production perspectives. J. Clean. Prod. 2019, 225, 963–971. [Google Scholar] [CrossRef]
- Hoekstra, A.Y.; Mekonnen, M.M. The water footprint of humanity. Proc. Natl. Acad. Sci. USA 2012, 109, 3232–3237. [Google Scholar] [CrossRef] [Green Version]
- Breiman, L. Random Forests. Mach. Learn. 2001, 45, 5–32. [Google Scholar] [CrossRef]
- Wang, C.; Kan, A.K.; Zeng, Y.L.; Li, G.Q.; Wang, M.; Ci, R. Population distribution pattern and influencing factors in Tibet based on random forest model. Acta Geogr. Sin. 2019, 74, 664–680. (In Chinese) [Google Scholar] [CrossRef]
- Yu, W.M.; Zhang, T.T.; Shen, D.J. County-level spatial pattern and influencing factors evolution of carbon emission intensity in China: A random forest model analysis. China Environ. Sci. 2022, 42, 2788–2798. (In Chinese) [Google Scholar] [CrossRef]
- Park, J.; Lim, B.; Lee, J. Analysis of Factors Influencing Forest Loss in South Korea: Statistical Models and Machine-Learning Model. Forests 2021, 12, 1636. [Google Scholar] [CrossRef]
- Liang, X.D.; Li, J.C.; Guo, G.X.; Li, S.P.; Gong, Q.X. Evaluation for water resource system efficiency and influencing factors in western China: A two-stage network DEA-Tobit model. J. Clean. Prod. 2021, 328, 129674. [Google Scholar] [CrossRef]
- Fang, S.B.; Jia, R.F.; Tu, W.R.; Sun, Z.L. Assessing Factors Driving the Change of Irrigation Water-Use Efficiency in China Based on Geographical Features. Water 2017, 9, 759. [Google Scholar] [CrossRef] [Green Version]
- Yang, Y. Evaluation of China’s water-resource utilization efficiency based on a DEA-Tobit two-stage model. Water Supply 2020, 21, 1764–1777. [Google Scholar] [CrossRef]
- Zhao, X.L.; Fan, X.H.; Liang, J.C. Kuznets type relationship between water use and economic growth in China. J. Clean. Prod. 2017, 168, 1091–1100. [Google Scholar] [CrossRef]
- Xie, C.Y.; Feng, J.C.; Zhang, K.; Zhou, H.W.; Xue, S. Water Use Efficiency and Influencing Factors in the Mekong River Basin Region Based on Grey Relational Analysis. J. Grey Syst. 2018, 30, 28–41. [Google Scholar]
- Wang, Y.; Su, Z.X.; Zhang, Q.Q. A Study on Spatial-Temporal Differentiation and Influencing Factors of Agricultural Water Footprint in the Main Grain-Producing Areas in China. Processes 2022, 10, 2105. [Google Scholar] [CrossRef]
- Qian, W.J.; He, C.F. China’s Regional Difference of Water Resource Use Efficiency and Influencing Factors. Chin. J. Popul. Resour. Environ. 2011, 21, 54–60. (In Chinese) [Google Scholar] [CrossRef]
- Fan, L.X.; Gai, L.T.; Tong, Y.; Li, R.H. Urban water consumption and its influencing factors in China: Evidence from 286 cities. J. Clean. Prod. 2017, 166, 124–133. [Google Scholar] [CrossRef]
- He, W.; Wang, Y.L. Calculation of urban water resources utilization efficiency in the Yellow River basin and analysis of its influencing factors. Acta Sci. Circumstantiae 2021, 41, 4760–4770. (In Chinese) [Google Scholar]
- Bao, C.; Chen, X.J.; Liang, G.L. Analysis on the Influencing Factors of Water Use Efficiency in Henan Province Based on Spatial Econometric Models. J. Nat. Resour. 2016, 31, 1138–1148. (In Chinese) [Google Scholar] [CrossRef]
- National Bureau of Statistics of China. Chinese Environmental Statistics Yearbook; China Statistics Press: Beijing, China, 2008, 2013 and 2018. (In Chinese)
- Ministry of Water Resources of China. Provincial Water Resource Bulletin; China Water Power Press: Beijing, China, 2008, 2013 and 2018. (In Chinese)
- National Bureau of Statistics of China. China Statistical Yearbook; China Statistics Press: Beijing, China, 2008, 2013 and 2018. (In Chinese)
- Mi, Z.F.; Meng, J.; Guan, D.B.; Shan, Y.L.; Song, M.L.; Wei, Y.M.; Liu, Z.; Hubacek, K. Chinese CO2 emission flows have reversed since the global financial crisis. Nat. Commun. 2017, 8, 1712. [Google Scholar] [CrossRef] [Green Version]
- Zheng, H.R.; Zhang, Z.K.; Wei, W.D.; Song, M.L.; Dietzenbacher, E.; Wang, X.Y.; Meng, J.; Shan, Y.L.; Ou, J.M.; Guan, D.B. Regional determinants of China’s consumption-based emissions in the economic transition. Environ. Res. Lett. 2020, 15, 074001. [Google Scholar] [CrossRef]
- Liu, W.; Tang, Z.; Chen, J.; Yang, B. Multi-Regional Input-Output Model for 30 Provinces of China in 2007; China Statistics Press: Beijing, China, 2014. (In Chinese) [Google Scholar]
- Zhao, D.D.; Liu, J.G.; Sun, L.X.; Ye, B.; Hubacek, K.; Feng, K.S.; Varis, O. Quantifying economic-social-environmental trade-offs and synergies of water-supply constraints: An application to the capital region of China. Water Res. 2021, 195, 116986. [Google Scholar] [CrossRef] [PubMed]
- National Bureau of Statistics of China. China Economic Census Yearbook; China Statistics Press: Beijing, China, 2008. (In Chinese) [Google Scholar]
- Cai, B.M.; Wang, C.C.; Zhang, B. Worse than imagined: Unidentified virtual water flows in China. J. Environ. Manag. 2017, 196, 681–691. [Google Scholar] [CrossRef] [PubMed] [Green Version]
- Zhao, X.; Liu, J.G.; Liu, Q.Y.; Tillotson, M.R.; Guan, D.B.; Hubacek, K. Physical and virtual water transfers for regional water stress alleviation in China. Proc. Natl. Acad. Sci. USA 2015, 112, 1031–1035. [Google Scholar] [CrossRef] [PubMed] [Green Version]
- Xu, J.R.; Huang, D.C.; Fang, J.M. Regional Total Factor Water Resources Utilization Efficiency and Its Influencing Factors in China. J. Hohai Univ. (Philos. Soc. Sci.) 2021, 23, 77–84. (In Chinese) [Google Scholar] [CrossRef]
- Sun, C.Z.; Liu, S.B. Water footprint and space transfer at provincial level of China based on MRIO model. J. Nat. Resour. 2019, 34, 945–956. (In Chinese) [Google Scholar] [CrossRef]
- Xiong, Y.L.; Tian, X.; Liu, S.W.; Tang, Z.P. New patterns in China’s water footprint: Analysis of spatial and structural transitions from a regional perspective. J. Clean. Prod. 2020, 245, 118942. [Google Scholar] [CrossRef]
- Zhang, C.J.; Zhao, C.X.; Lin, L.; Yu, X.Y. Driving effect of spatial-temporal differences in water consumption in the Yangtze River Delta. Resour. Sci. 2018, 40, 89–103. (In Chinese) [Google Scholar] [CrossRef]
- Zhao, J.; Wang, Y.; Zhang, X.; Liu, Q. Industrial and Agricultural Water Use Efficiency and Influencing Factors in the Process of Urbanization in the Middle and Lower Reaches of the Yellow River Basin, China. Land 2022, 11, 1248. [Google Scholar] [CrossRef]
- Feng, Y.; Zhu, A. Spatiotemporal differentiation and driving patterns of water utilization intensity in Yellow River Basin of China: Comprehensive perspective on the water quantity and quality. J. Clean. Prod. 2022, 369, 133395. [Google Scholar] [CrossRef]
- Xing, X.; Xiu, C.B.; Liu, Y.C. Water Security Assessment of Yellow River Basin Based on Water Footprint Theory. J. China Agric. Resour. Reg. Plan. 2022, 43, 250–258. (In Chinese) [Google Scholar]
- Yang, Y.Y.; Wang, Y.Y.; Xu, Q.Y. Decoupling analysis of water utilization and economic development in the Yellow River Basin: Based on quantity and quality of water resources. J. Water Resour. Water Eng. 2022, 33, 1–10. (In Chinese) [Google Scholar] [CrossRef]
- Zhang, C.; Xu, J.; Chiu, Y.-H. Driving factors of water use change based on production and domestic dimensions in Jiangsu, China. Environ. Sci. Pollut. Res. 2020, 27, 33351–33361. [Google Scholar] [CrossRef] [PubMed]
- Wang, S.; Zhou, L.; Wang, H.; Li, X. Water Use Efficiency and Its Influencing Factors in China: Based on the Data Envelopment Analysis (DEA)—Tobit Model. Water 2018, 10, 832. [Google Scholar] [CrossRef] [Green Version]
- Liu, L.; Deng, O.P.; Deng, L.J.; Gu, L.J. Agricultural Water Footprint Space-Time Change and Driving Factors Research of Various Cities in Sichuan Province from 2003 TO 2011. Resour. Environ. Yangtze Basin 2015, 24, 1133–1141. (In Chinese) [Google Scholar]
- Zhang, F.F.; Zhang, Q.N.; Li, F.D.; Fu, H.Y.; Yang, X.H. The spatial correlation pattern of water footprint intensity and its driving factors in China. J. Nat. Resour. 2019, 34, 934–944. [Google Scholar] [CrossRef]
- Zhao, D.; Hubacek, K.; Feng, K.; Sun, L.; Liu, J. Explaining virtual water trade: A spatial-temporal analysis of the comparative advantage of land, labor and water in China. Water Res. 2019, 153, 304–314. [Google Scholar] [CrossRef]


| Code | Sector Name | Code | Sector Name |
|---|---|---|---|
| S01 | Agriculture, forestry, animal husbandry, fisheries | S16 | General and specialized machinery |
| S02 | Coal mining, and processing | S17 | Transport equipment |
| S03 | Crude petroleum and natural gas extracting | S18 | Electric equipment and machinery |
| S04 | Metallic mining | S19 | Electronic and telecommunications equipment |
| S05 | Non-metallic and other minerals mining | S20 | Instruments, meters, cultural, and office machinery |
| S06 | Food and tobacco processing | S21 | Other manufacturing |
| S07 | Textiles | S22 | Electricity and hot water production and supply |
| S08 | Garments, leather, furs, and down | S23 | Gas and water production and supply |
| S09 | Timber processing and furniture manufacturing | S24 | Construction |
| S10 | Papermaking and cultural articles | S25 | Transport and storage |
| S11 | Petroleum processing and coking | S26 | Wholesale and retailing |
| S12 | Chemicals | S27 | Hotel and restaurant |
| S13 | Non-metal mineral products | S28 | Leasing and commercial services |
| S14 | Metal smelting and processing | S29 | Scientific research |
| S15 | Metal products | S30 | Other services |
| Water Use Type | Sector | Rank 1 | Rank 2 | Rank 3 | Rank 4 | Rank 5 | Rank 6 |
|---|---|---|---|---|---|---|---|
| Physical water use | S01 | POP | IMP | PRI | EXP | WAT | AGR |
| S22 | POP | AGR | IND | PRI | EXP | IMP | |
| S12 | POP | AGR | REG | TEC | IND | PRI | |
| S14 | AGR | PRI | IND | POP | REG | URB | |
| S30 | POP | AGR | REG | TEC | EXP | POL | |
| S10 | POP | AGR | IND | TEC | REG | IMP | |
| Production-based water footprint | S01 | PRI | WAT | POP | SEC | IMP | GDP |
| S06 | POP | IMP | EXP | WAT | AGR | GDP | |
| S24 | POP | SEC | REG | PRICE | IMP | GDP | |
| S30 | POP | AGR | TEC | IND | REG | EXP | |
| S07 | POP | EXP | AGR | IMP | URB | IND | |
| S12 | POP | EXP | AGR | IMP | GDP | TEC | |
| Consumption-based water footprint | S01 | POP | EXP | IMP | IND | PRICE | AGR |
| S06 | POP | EXP | IMP | AGR | TEC | GDP | |
| S24 | POP | TEC | PRICE | AGR | GDP | REG | |
| S30 | POP | AGR | IMP | EXP | TEC | REG | |
| S12 | POP | EXP | IMP | AGR | IND | TEC | |
| S27 | POP | IMP | WAT | EXP | TEC | PRICE |
Disclaimer/Publisher’s Note: The statements, opinions and data contained in all publications are solely those of the individual author(s) and contributor(s) and not of MDPI and/or the editor(s). MDPI and/or the editor(s) disclaim responsibility for any injury to people or property resulting from any ideas, methods, instructions or products referred to in the content. |
© 2022 by the authors. Licensee MDPI, Basel, Switzerland. This article is an open access article distributed under the terms and conditions of the Creative Commons Attribution (CC BY) license (https://creativecommons.org/licenses/by/4.0/).
Share and Cite
Zhang, X.; Yu, W.; Zhang, T.; Shen, D. The Influencing Factors of Water Uses in the Yellow River Basin: A Physical, Production-Based, and Consumption-Based Water Footprint Analysis by the Random Forest Model. Water 2023, 15, 170. https://doi.org/10.3390/w15010170
Zhang X, Yu W, Zhang T, Shen D. The Influencing Factors of Water Uses in the Yellow River Basin: A Physical, Production-Based, and Consumption-Based Water Footprint Analysis by the Random Forest Model. Water. 2023; 15(1):170. https://doi.org/10.3390/w15010170
Chicago/Turabian StyleZhang, Xiaomeng, Wenmeng Yu, Tingting Zhang, and Dajun Shen. 2023. "The Influencing Factors of Water Uses in the Yellow River Basin: A Physical, Production-Based, and Consumption-Based Water Footprint Analysis by the Random Forest Model" Water 15, no. 1: 170. https://doi.org/10.3390/w15010170
APA StyleZhang, X., Yu, W., Zhang, T., & Shen, D. (2023). The Influencing Factors of Water Uses in the Yellow River Basin: A Physical, Production-Based, and Consumption-Based Water Footprint Analysis by the Random Forest Model. Water, 15(1), 170. https://doi.org/10.3390/w15010170