Article

Determining Aquifer Hydrogeological Parameters in Coastal Aquifers from Tidal Attenuation Analysis, Case Study: The Malta Mean Sea Level Aquifer System

1
The Energy and Water Agency, Pinto Business Centre, Triq Il-Mitħna, 3104 Ħal Qormi, Malta
2
National Research Council Water Research Institute (IRSA-CNR), 70132 Bari, Italy
3
Environmental Management & Planning Division, Institute of Earth Systems, University of Malta, 2080 Msida, Malta
4
Institute of Applied Geosciences, Technical University of Darmstadt, 64287 Darmstadt, Germany
*
Author to whom correspondence should be addressed.
Water 2023, 15(1), 177; https://doi.org/10.3390/w15010177
Submission received: 16 November 2022 / Revised: 19 December 2022 / Accepted: 27 December 2022 / Published: 1 January 2023
(This article belongs to the Section Hydrogeology)

Abstract

:
The coastal and carbonate Mean Sea Level Aquifer (MSLA) of Malta is characterised by high anisotropy and heterogeneity, which together make evaluating the aquifer system parameters a challenging task. In this paper, we present an approach for the determination of the hydrogeological parameters of this coastal aquifer based on tidal-induced groundwater fluctuations that can be applied in other similar contexts. This work presents an analysis of data undertaken on monitoring boreholes located in the Malta MSLA exhibiting tidal-induced groundwater fluctuations. This allowed us to determine the values of three main hydrogeological parameters: hydraulic diffusivity, transmissivity and hydraulic conductivity. These will subsequently be used as an input for groundwater flow and reactive transport modelling purposes. In this study, a methodology based on the fast Fourier transform (FFT) is proposed to improve the applicability of the Jacob–Ferris method to the observed groundwater level and sea level fluctuations. The FFT reproduced signals allowed us to isolate the component induced by sea tides, thus eliminating short- and long-term variations of the water table induced by other disruptive factors. Results showed high variability of hydrogeological parameters within a short distance, reflecting the high anisotropy and heterogeneity of the aquifer system. The transmissivity values derived from the Jacob–Ferris method are complemented with results derived from the pumping tests with the aim of estimating the spatial distribution of the aquifer transmissivity for the study area. The spatial variability of transmissivity values is analysed by means of geostatistics tools for estimating uncertainty, correlation and variation in space through the use of semi-variograms.

1. Introduction

Due to the lack of economically exploitable surface water resources such as rivers, lakes and mountains, the Maltese Islands rely on groundwater supply for around 60% of the total national water demand, supplying the domestic (municipal supply), commercial and agricultural demand [1]. The availability of freshwater has, in the past, been a key limiting factor in the socio-economic development of the islands until alternative water supplies, such as seawater desalination, began to be utilised [2]. Other than the availability of alternative water sources (seawater desalination and wastewater reclamation), Malta has limited natural freshwater resources when compared to the demand from the growing population, industry and agriculture. Without proper care and management, challenges such as seawater intrusion and contamination of coastal aquifers may become more pressing. The challenge of increasing demand coming from an increasing population in Mediterranean coastal areas provides an opportunity for the development of alternative water supplies that supplement natural water resources. Managed aquifer recharge (MAR) has been proposed as one of the potential solutions to sustain groundwater supplies and help to ensure that groundwater can keep playing this important role well into the future, in terms of providing significant sustainable yields whilst maintaining good quality status [3,4]. Furthermore, in the Second Water Catchment Management Plan (2nd WCMP) for the Malta Water Catchment District 2015–2021 [1], the development of MAR schemes has been identified as one of the measures required to address the efficient use of water resources in the Malta Water Catchment District and thus contribute to the achievement of the Water Framework Directive’s good status objectives for groundwater resources.
In order to implement MAR schemes, a thorough understanding of the groundwater body and flow mechanisms needs to be developed to assess the sustainability of the project in the study area. Furthermore, the effects of extreme scenarios such as drought, excess rainfall, increasing well abstraction rates, etc., as well as the effects of the implementation of different MAR schemes can be predicted by implementing numerical models. The development of numerical models for groundwater flow and reactive transport relies on the assessment of hydrogeological parameters characterising the aquifer system [5,6].
This study aims at supplementing results derived from the interpretation of pumping tests undertaken during the 1990′s by BRGM [7] for the assessment of the following hydrogeological parameters for the Malta Mean Sea Level Aquifer (MSLA): hydraulic diffusivity, transmissivity and hydraulic conductivity. This objective can be achieved in island/coastal aquifers by analysing tidal-induced groundwater fluctuations.
The estimation of hydrogeological parameters has been extensively studied in coastal aquifers where tidal oscillations affect groundwater head measurements [8]. Accurate characterisation of aquifer properties, particularly transmissivity and hydraulic conductivity, is fundamental to understanding and predicting aquifer responses to development and management. These parameters are essential elements of dynamic models, which are becoming standard tools for sustainable development and optimal resource management [9]. The most commonly used methodology to calculate parameters through tidal influence was introduced by Jacob [10] and Ferris [11]. However, the original method assumes that the measured head is a static level, neglecting the effect of external driving forces which produce interference with the tidal oscillations. Sánchez-Úbeda et al. [8] proposed a method based on continuous wavelet transform (CWT), a technique widely used in tide studies [12], for filtering the groundwater head measurements and extracting the tidal influence. Srzić et al. [13] carried out an extensive hydrogeological characterisation of a coastal aquifer system by detrending procedures and using the Rahi method [14], thus enabling the use of tidal methods once only tidal components exist in the groundwater level time-series. Although Srzić et al. [13] determined only the hydraulic diffusivity through tidal analysis, they extended the range of hydrogeological parameters to define aquifer specific storage and hydraulic conductivity whose values well corresponded to in situ investigations. Similarly to Srzić et al. [13], Ayers and Clayshulte [15] determined hydraulic diffusivities using tidal analysis and wrote a short FORTRAN program to solve for the hydraulic conductivity assuming parameters of specific yield and saturated thickness. Furthermore, Trefry and Bekele [16] applied one-dimensional tidal propagation models in an island aquifer, yielding estimates of aquifer transmissivities and storage coefficients; testing a theory involving composite heterogeneity accounted well for spatial biases. Maréchal et al. [17] applied tidal unimodal analysis to calculate hydrodynamic parameters in gauging boreholes located in the atoll island of Rangiroa.
Temporal variations of observed groundwater level signals are influenced by: (i) sea tides, (ii) barometric pressure, (iii) tectonic activity, (iv) human-induced activities, (v) infiltration from the surface, (vi) high-frequency noise. Sea tides induce significant periodic groundwater level fluctuations in those boreholes located near the coastline. The induced fluctuations are reduced as the distance from the coastline increases and/or the transmissivity decreases with the same period of oscillation of about 12 h (Figure 1). Barometric pressure can be explained as the result of the spatial displacement of air mass [18] and diurnal and semidiurnal barometric changes because of air heating and cooling following the transition from day to night [19]. The groundwater response to Earth tides and atmospheric pressure changes can be used to understand subsurface processes and estimate hydraulic and hydro-mechanical properties [20] characterised using the concept of barometric efficiency [19]. Although barometric and groundwater pressure records enable rapid assessment of subsurface processes and properties [18,21,22], the proximity to the Mediterranean Sea of the Maltese Islands leads us to assume that sea tides are more influential to groundwater level fluctuations than barometric response functions. Tectonic activity can induce changes in the hydraulic heads even if they are characterised by low-magnitude fluctuations because of rock displacement. Human-induced activities can be associated with two main factors: (i) withdrawal from nearby pumping wells laying within the radius of influence of the monitoring borehole, (ii) aquifer recharge that can be either intended if the source of water is intentionally injected into the aquifer system through MAR schemes or unintended such as leakage from freshwater distribution or sewerage system networks. Infiltration from the surface into the subsurface depends greatly on a number of factors including variability of precipitation, baseflow originating either from the low permeability volume of the phreatic zone [23,24,25] or from the epikarst storage [26,27,28], soil and vadose zone characteristics and saturation, land cover, the slope of the land and evapotranspiration. High-frequency noise may be linked to errors of the gauging water level device.
Tidal methods to define coastal aquifer parameters were introduced by Jacob [10] and Ferris [11]. Although techniques to analytically calculate tidally influenced groundwater levels have become more sophisticated [29,30], the relatively simple Jacob–Ferris model remains useful for understanding aquifer hydraulic properties from measured groundwater level fluctuations if there is no interference from other factors [9].
In highly populated coastal areas, external forces on piezometric fluctuations may be relevant, and therefore, they may be responsible for disrupting the undisturbed sinusoidal water level fluctuations induced over time by sea tides. These anthropogenic factors may make the tidal attenuation method difficult to apply and, depending on the nature of the disturbance, prone to uncertain estimations. This study proposes a methodology for improving the applicability of the Jacob–Ferris method by means of applying fast Fourier transform (FFT) filtering to the observed groundwater level and sea level fluctuations. The FFT-reproduced signals allow the isolation of the component induced by sea tides, thus eliminating short- and long-term variations of the water table induced by external driving forces.

2. Materials and Methods

2.1. Study Area

The Maltese Archipelago is located in the central part of the Mediterranean Sea at a distance of about 90 km south of Sicily (Italy), 300 km east of Tunisia and 350 km north of Libya. The archipelago consists of 3 main islands, which are Malta, Gozo and Comino, and a few other uninhabited islets. The islands have a total land area of 316 km2 and a coastline of about 190 km. The length of the whole archipelago is 45 km; Malta being 27 km long, Gozo 14.5 km and Comino 2.5 km [31].
The only exposed geological formations on the Maltese Islands are of Tertiary and Quaternary age. A brief description of the formations is given hereunder [7]:
  • Plio-Quaternary; having little or no hydrogeological importance except possibly in alluvial valleys;
  • Upper Coralline Limestone (UCL); characterised by fissured aquifers associated with a porous matrix. The UCL is a porous massive formation which outcrops over the western and northern zones of the Island and forms the highest parts of the topography. Well-developed karst phenomena can be found with dolines, sinkholes, weathered and corroded outcrops and fissures, dry valleys and dissolution figures;
  • Greensand; a porous aquifer formation but of limited extent and usually very thin (less than 1 or 2 m);
  • Blue Clay (BC); an aquitard formation sustaining an aquifer in the Greensand and UCL with possible vertical leakage enhanced by fissuration and faulting;
  • Globigerina Limestone (GL); generally a massive and porous formation which is rather homogeneous all over the island;
  • Lower Coralline Limestone (LCL); a fissured and fractured formation with a porous matrix. In the LCL, the main water body is in equilibrium with brackish and seawater. If compared to the GL formation, LCL is more fissured and entails higher heterogeneity due to a different deposition environment.
Different members of the same formations can be found in borehole drillings. For instance, the Attard Member of the LCL formation is worth mentioning because of its extremely permeable properties developed under shoal conditions. The material of these reefal formations is indeed more porous than in the main part of this geological unit [32]. From a hydrogeological point of view, the heterogeneity they create in the aquifer must be kept in mind when assessing the results of hydrodynamic tests.
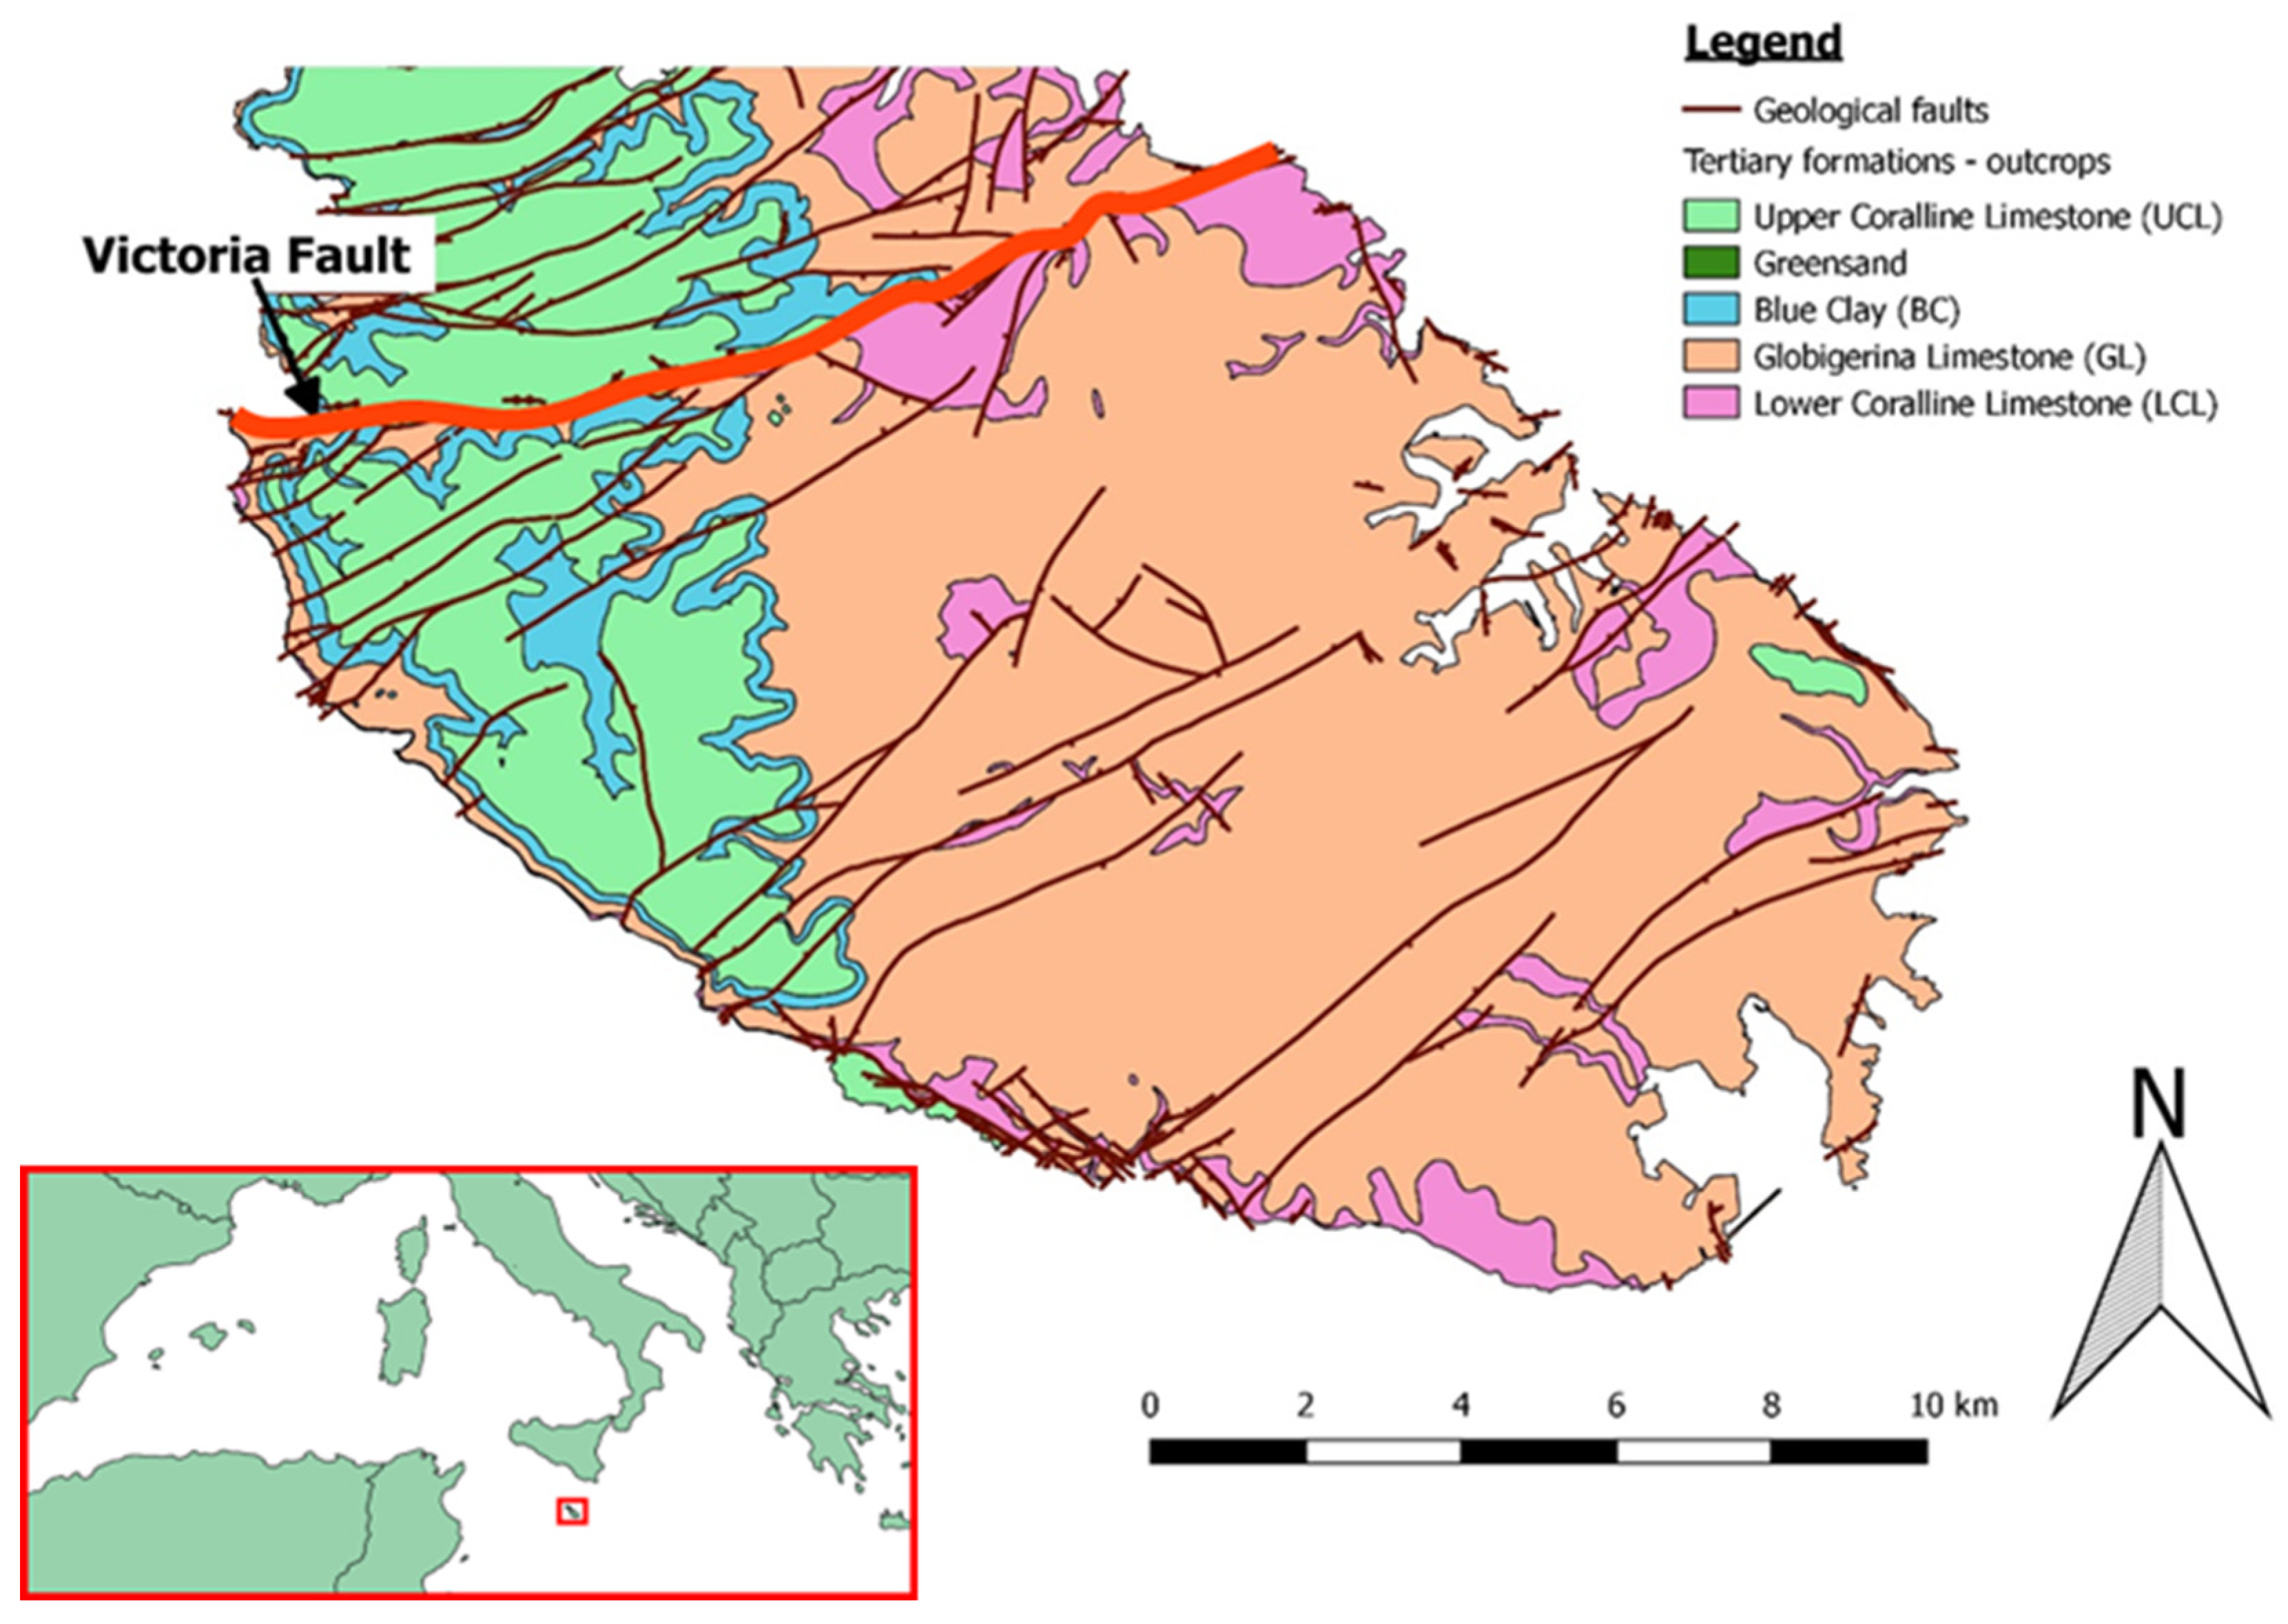
Furthermore, the quasi-horizontal attitude of the strata was literally broken up by two main direction fault systems, whose orientations are N. 50°–70° for one system and N. 120°–130° for the second by earth movements that were probably initiated in the Pleistocene period and continue to the present time [33] (Figure 2). Shearing is produced breccia with a fine-grained matrix which is clay-like in nature. The clay is derived from the marly composition of the limestones in small faults and from the BC formation in the large faults. Because clay is invariably present in the breccia, the faults act as water barriers which are partially or completely tight, depending on their openness [34].
The Victoria Fault (Figure 2) is the longest fault in the Maltese Islands and its displacement was responsible for dividing Malta into two distinct geomorphological parts: (i) the northern part which is a downthrown block characterised by horst and graben structures and (ii) the southern part which is an upthrown block where the Perched Aquifer (PA) takes place. This aquifer is sustained by the BC formation in the west side of the island, overlying the Mean Sea Level Aquifer (MSLA) developed throughout the extension of Malta South up to Victoria Fault when the latter is assumed as an impermeable barrier. A conceptual model of the MSLA system for a generic cross section-oriented NW—SE is provided in Figure 3.
The MSLA is a carbonate aquifer system in bodily continuity with water of Mediterranean salinity marginally and at depth, and its upper surface level is graded to the sea level around the coast. A real basement of the freshwater lens system does not exist, as the freshwater body is floating on the water of higher salinity. This body of freshwater owes its existence to winter rainfall, adding more freshwater to the underground storage [7]. In karst aquifers, an important role is played by the epikarst zone, as it largely contributes to groundwater storage, distributing groundwater into vadose flow through fissures and conduits, and baseflow through the rock matrix in the unsaturated zone [36].
The area has a Mediterranean climate, with strong inter-annual variability and a marked annual seasonality. The mean yearly precipitation is 550 mm/year [1]. Precipitation is distributed quite irregularly over the year, with peaks in winter seasons, whilst sporadic and intense precipitation occur during the arid summer seasons with a duration of a few hours.
The long-term natural recharge to the aquifer systems is a measure of effective rainfall, which is assumed to account for 35% of the mean annual precipitation, where losses due to evapotranspiration and runoff are estimated to account for 63% and 2%, respectively. Nevertheless, the quantity of irrigation water that recharges groundwater is usually significant relative to recharge from precipitation. The return flow from irrigation is assumed at 20% of the net irrigation water applied over the surface catchment area of the aquifer system [1]. In both cases, groundwater recharge is expected to be highly seasonal and therefore not relevant to high-frequency tidal fluctuation of the groundwater table during the arid period.
Groundwater abstraction assessment was undertaken as part of the quantitative status assessment under the 2nd WCMP [1]. This indicated that, cumulatively, the MSLA is being over-abstracted. The sector with the highest dependence on groundwater resources is the agricultural sector, which accounts for almost half of the total groundwater abstraction in the Maltese Islands.

2.2. Monitoring System and Data Collection

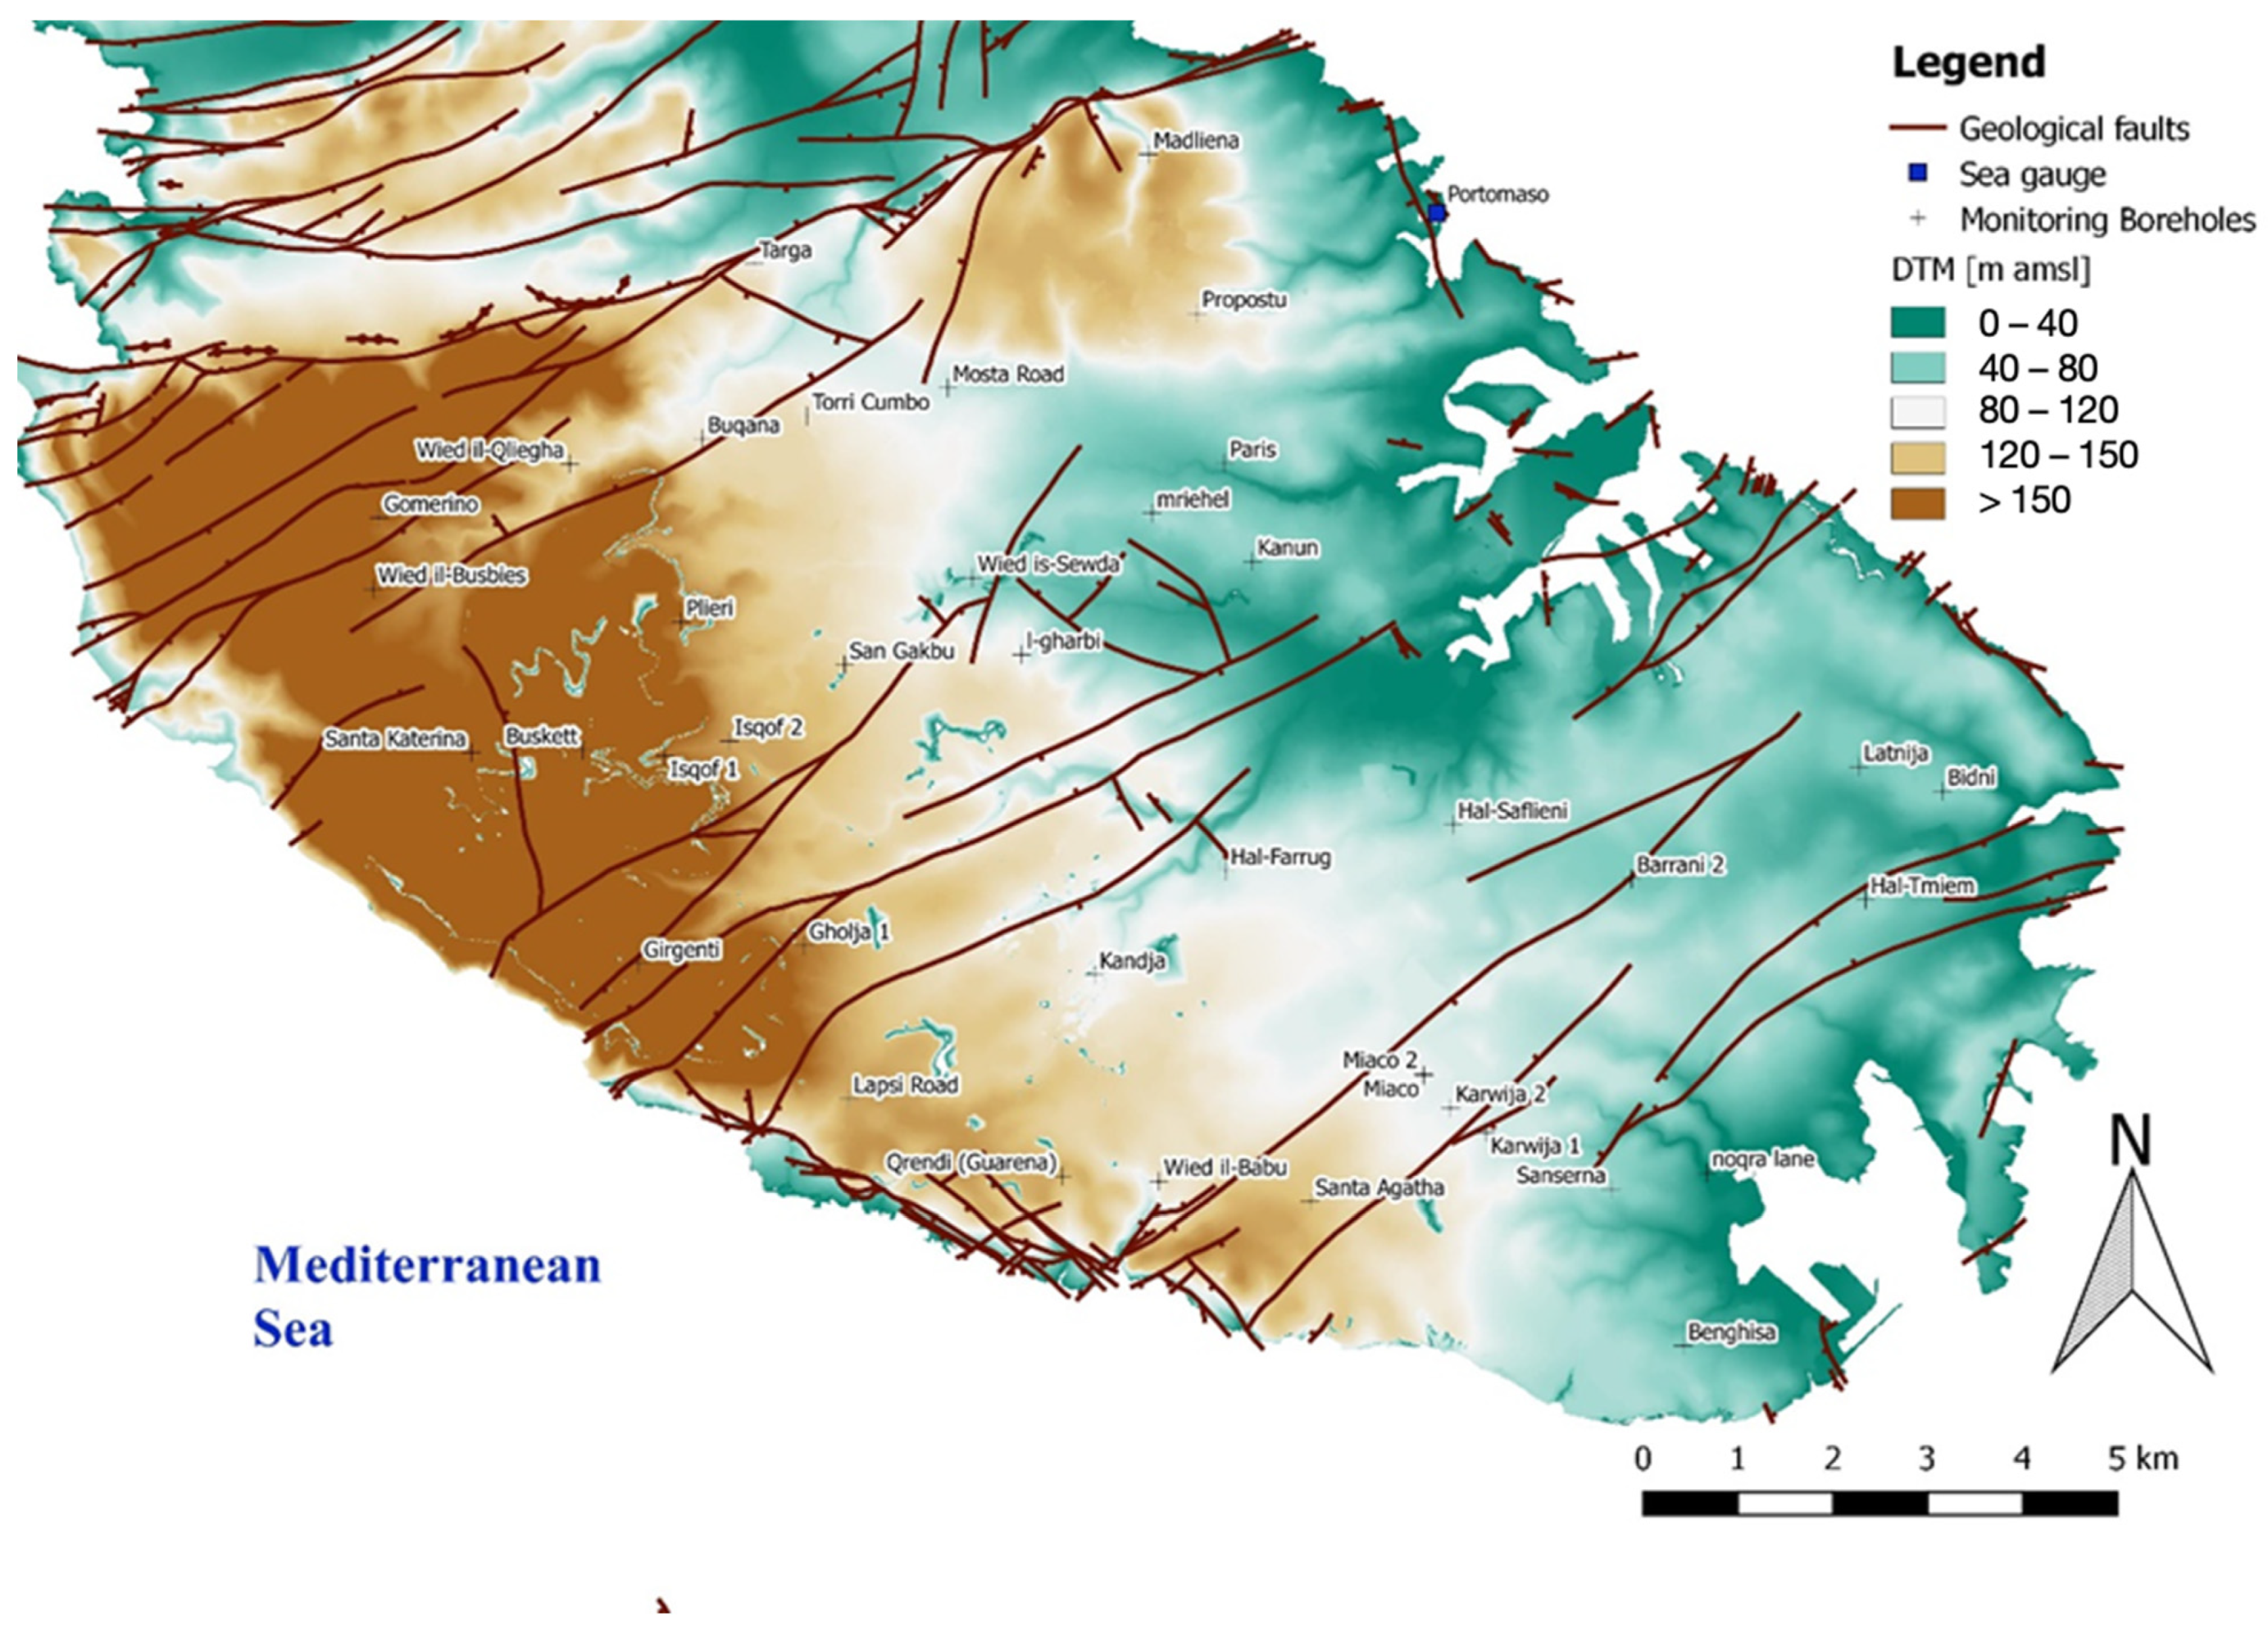
The MSLA monitoring system of piezometric heads and groundwater quality status was established in the late 1940s. In the last decades, improvements have been made by commissioning new gauging stations and installing new piezometers equipped with float-operated Shaft Encoder Thalimedes devices (Figure 4). The measuring range of the instrument is +/−19.999 m with a resolution of 0.001 m and an accuracy of +/−0.002 m. Moreover, water table heights were recorded every 30 min. Sea level states have been observed every 60 min, collecting one value per hour, and installed in the Portomaso marina since February 2001. The sea level gauge is managed by the Mediterranean regional subsystem of the Global Sea Level Observing System (MedGLOSS), which is a real-time monitoring network for systematic measurements of the sea level in the Mediterranean and Black Seas. It follows GLOSS requirements and methodology, aiming to provide high-quality standardised sea-level data [37].
The hydraulic heads are measured in every monitoring borehole; however, only nine boreholes exhibit tidal-induced groundwater fluctuations. Ten monitoring boreholes do not show water level fluctuations, with four of them (Gomerino, Wied Il-Qliegha, Buskett and Santa Katerina) located in the western area, where transmissivity is potentially lower than 1 × 10⁻⁵ m2/s. Five monitoring boreholes (Torri Cumbo, Targa, Paris, Latnija and Qrendi Guarena) are strongly impacted by nearby pumping wells, which makes observed signals impossible to analyse for the purposes of this study. Water level heights of Lapsi Road and Miaco are recorded quasi-steadily at 7 m amsl because of a clay lens found up to 2 m amsl [7].
The datasets used within this paper include a 3-month period from 1st May to 31st July 2011, and the mean values for the selected time period are shown in Table 1.
A number of pumping tests (23) were conducted by BRGM [7] in the MSLA of Malta. The results from the interpretation of these pumping tests return two main parameters to be considered in this analysis: transmissivity and storage coefficient (or storativity). The latter is equal to the specific yield for phreatic aquifers. Pumping tests provided storage coefficient values ranging between 1 × 10⁻⁴ and 1 × 10⁻³ [-]. Usually, such values are typical of confined aquifers, which is not the case in Malta. However, in fissured aquifers, such values are registered for two main reasons that must be taken into account [7]: (i) the permeability between the fissure and the rock is so different that the water contained in a fissure is under pressure and reacts as a confined aquifer; (ii) during a variation of the water level, either natural (tide effect) or artificial (pumping test), the water reacts instantaneously through fissures, while the water contained in the matrix porosity of the formation is only involved after a long test. Although tracing tests may provide us with reliable assessments of storage coefficients in the carbonate MSLA of Malta [38], this technique cannot be undertaken on the island. This is because of the intensive abstraction accounted for both by irrigation and drinkable groundwater supply from pumping boreholes which would diverge the natural groundwater flow. Tracing tests were not attempted in Malta, except once in a study cited by ATIGA [39], which yielded inconsistent results. Due to the high uncertainty entailed, storage coefficients obtained from pumping tests are not representative of storage coefficients of the aquifer. However, in order to carry on the analysis, an average value between the maximum and minimum tested storage coefficients of 5 × 10⁻⁴ [-] is considered.
According to Morris [40], the capacity of the Maltese limestone for containing water, and for permitting its movement in the body of the rock, varies considerably and rapidly within one and the same formation. The fact that a rock has a high porosity and permeability does not necessarily indicate that it will yield a conspicuous supply. Much depends on the shape and size of the individual grains which compose the rock and on the amount of argillaceous material which is present. Consequently, the regional analysis of hydrogeological parameters shall be encouraged.

2.3. Tidal Attenuation

In the MSLA of Malta, the major component which induces water table fluctuations is sea tides. It is possible to detrend and scale the observed groundwater and sea level signals to zero in order to obtain fluctuations that can be analysed as explained hereunder.
The proposed method is based on a prior filtering process of observed groundwater level and sea tide signals so that the tidal oscillation reproduced from the original time series is compared with the tide oscillation that produced it. Observed groundwater level and sea tides signals can be modelled as a sum of windowed sinusoids. In theory, the number of sinusoids, which represents the real potentiometric and sea-surface over time, is infinite. In practice, by considering limited time-series, the observed signals can be expressed as the sum of a finite number of sinusoids with fixed amplitude and frequency in the spectral domain [41]. In order to transform observed signals from the temporal to the spectral domain, a fast Fourier transform (FFT) algorithm is applied using Python’s Numpy library. The original sea tides spectrum is characterised by high magnitudes in correspondence to the expected frequency of 2 waves/d, with peaks usually occurring at midday and midnight. Afterwards, the frequency range is maintained at around 2 waves/d and cut off (i.e., turn to zero) higher and lower frequencies that correspond to the long-term variation of the signal and to aperiodic variations driven by external forces. The choice of selecting either a wider or tighter frequency range of around two waves/d is arbitrary, and it is usually driven by the magnitude of driving forces disrupting the observed signal, i.e., the greater the magnitude of the external forces is, the lower the chosen frequency range might be. Finally, the inverse FFT will return the reproduced signal over time, which is now clean of trends and high-frequency effects. The same methodology can be applied to the observed groundwater level fluctuations.
Assuming a one-dimensional, homogeneous, isotropic, confined and semi-infinite aquifer with a sharp boundary subject to oscillating force, it is possible to apply the Jacob–Ferris analytical solution [10,11] to assess hydrogeological parameters. The solution reads:
h ( x , t ) = h 0   e x π   S τ   T   s i n ( ω   τ x π   S τ   T ) ,
where h is the hydraulic head [m], x is the distance to the sea [m], t is time [d], h0 is the amplitude of the sea tide [m], T is transmissivity [m2/d] which is equal to hydraulic conductivity (K [m/d]) times aquifer thickness (b [m]), S is specific yield (or storage coefficient) [-], ω is the frequency of the oscillation [d−1] and τ period of the oscillation [d].
In Malta, the aquifers bearing freshwater are carbonate in type. Consequently, the low permeability rock matrix forces the groundwater flow predominantly into fissures [42]; thus, the Jacob–Ferris method can be applied, neglecting the hydrogeological role of the relatively low matrix porosity. Moreover, as the aquifer length over which tidal influence is long (kilometres), slope effects at the boundary can be negligible [9]. The equation for hydraulic diffusivity from amplitude attenuation, [m2/d], can be expressed as:
D a m p = x 2 π ( l n A ) 2 τ = T S ,
where A is the amplitude attenuation factor [-] given by the ratio of the amplitude of the oscillation in a monitoring borehole to the amplitude in the sea tides, T is transmissivity [m2/d]. The latter parameter can be assessed in an island/coastal aquifer system by applying the well-known Ghyben–Herzberg equation [43,44]:
z = ρ f ( ρ s ρ f ) h = α   h ,
where the freshwater/seawater interface depth below the mean sea level is represented as z [m bmsl], h is the water table height [m amsl], ρs and ρf are the density of saltwater and freshwater, respectively [g/cm3]. It must be noted that the Ghyben–Herzberg approach to freshwater thickness has to be used with caution due to the possible thick mixing zone. However, this is irrelevant for relatively fast forcing factors, such as tides and short pumping tests, when a large aquifer thickness is active, irrespective of the fresh-, mixed- and marine-water content. Unpublished analysis undertaken on salinity profiles measured in the Malta MSLA revealed that maximum freshwater thicknesses are not greater than 100 m, while the Ghyben–Herzberg formula (Equation ((3)) is well suited to estimate aquifer thickness in this study area.
Groundwater level fluctuations induced by sea tides tend to remain sinusoidal with the period identical to the driving force (sea level), but with an exponential decrease in Tidal Efficiency (TE) and linear increase of time lag (ΔT) [10,11]. According to Srzić et al. [13], TE can be calculated directly from the observed signals as the ratio of the standard deviations of piezometric head and sea level. By amplifying the reproduced water level signal and shifting the amplified signal by a time equal to ΔT, it is possible to fit sea level fluctuations and therefore verify that groundwater and sea level time series are comparable for tidal attenuation analysis.
The methodology we propose based on fast Fourier transformation leads to simplifying the evaluation of peak-to-peak positions between sea tides and groundwater head time series, reducing the uncertainty inherent in observed signals where external driving forces are not filtered. Hereby, the sought hydrogeological parameters (hydraulic diffusivity, transmissivity and hydraulic conductivity) are determined in Microsoft Excel with a manual peak-to-peak detection. The obtained results are therefore statistically analysed and the mean value of each dataset is assumed to be representative of the calculated hydrogeological parameters for each borehole exhibiting groundwater level fluctuations induced by sea tides.
Finally, the assessed transmissivity values are joined to the ones derived from pumping tests’ interpretation and then analysed by means of geostatistical tools for estimating uncertainty, correlation and variation in space through the use of semi-variograms with the aim of generating a transmissivity spatial distribution map of the MSLA of Malta.

2.4. Geostatistical Analysis

In order to analyse and predict values of transmissivity in space, such values are implicitly assumed to be spatially correlated with each other, and the study of such correlation is usually called “variogram modelling” [45]. Sequential Gaussian simulation would generate realisations with a given mean and a given covariance. The realisations generated with this algorithm will have all the Gaussian features associated with a multi-Gaussian distribution, provided that all univariate distributions are normal [46].
The univariate statistical analysis of environmental values often shows that frequency distributions have high positive or negative values of skewness and the mean, the median and the mode are never coincident; thus, suggesting that the data are not from a normal (Gaussian) distribution, so a transformation into Gaussian space is necessary [45]. There are many types of data transformation that are used in statistical and geostatistical analyses. Among them, the normal scores transformation is applied in this work for the application of the sequential Gaussian simulation method. The normal score data transformation is a non-parametric method which is used to transform the data into the normal space and to back-transform the data after the estimation and/or simulation calculations [47]. The normal distribution can be defined by mean and standard deviation, which for a standard cumulative density function are zero and one, respectively. The transformation of experimental values will generally produce results that are similar to the Gaussian theoretical ones. However, it is unlikely to match exactly the theoretical zero mean and unit standard deviation. Generally, the closer these values are to the theoretical ones, the closer the Gaussian transformed distribution is to the standard Gaussian cumulative density function [45].
Geostatistical data analysis of the normal score transformed transmissivity estimates involves the derivation of the empirical variogram, fitting by a model variogram, cross-validation of the model variogram and interpolation by kriging to generate a map of the predicted transformed transmissivity values and its uncertainty spatial distribution [47]. The empirical variogram measures the average spatial variability between values separated by a vector h named lag-distance. It can be calculated in a standard way by the average square difference of each pair of values as follows:
γ ( h ) = 1 2 n ( h ) i = 1 n ( h ) [ z ( x i ) z ( x i + h ) ] 2 ,
where γ is the variogram or semi-variance, z(xi) and z(xi + h) are values of the same regionalised variable separated by the lag-distance h. These models of the variability are then used to simulate realisations of the random variable at unsampled locations. The empirical variogram will be fitted by a spherical model:
γ ( h ) = { n + s [ 3 2 ( x r ) 1 2 ( x r ) 3 ] ,     i f   x r n + s ,                                                                 i f   x > r ,
where n is the nugget effect, s the partial sill, r the range and x the distance. In fact, the three main parameters of the variogram, namely the nugget, the partial sill and the range, embed the major information needed for an effective prediction of variable estimates [48]. The model parameters n, s and r are estimated using the fit.variogram function of the gstat package for Spatial and Spatio-Temporal Geostatistical Modelling, Prediction and Simulation [49] in RStudio software. The variogram model is verified by cross-validation using krige.cv function of gstat, whereby the leave-one-out method [50] is applied, which consists of iteratively removing z(xi) from the dataset and estimating it on the basis of the variogram model and the remaining observed data [48].
For prediction of the normal score transformed transmissivity, ordinary kriging is used [51], which is a least-squares linear regression estimator, so
z ( h ) = i = 1 n ( h ) λ i z ( x i ) ,
where n is now the number of data points selected within the neighbourhood of x and λi are the kriging weights determined so that the estimation is unbiased and minimises the error variance. A map of the predicted normal score transformed transmissivity is derived with the krige function of the gstat package in RStudio and then the estimates are back-transformed from the normal to the real space. The resulting map is finally georeferenced using QGIS tools. The resulting minimum error variance can be determined as:
σ E 2 ( x ) = i = 1 n ( h ) λ i γ ( x x i ) μ ,
where σE2 error (or kriging) variance and μ is a Langrage multiplier.

3. Results

3.1. Tidal Analysis

The tidal attenuation method has been applied to groundwater levels recorded on nine boreholes monitoring the quantitative status of the MSLA exhibiting piezometric fluctuations induced by sea-tides for a 3-month period from 1st May until 31st July 2011. The analysed time period was chosen because it follows the summer season usually characterised by a lack of rainfall. On the other hand, a number of monitoring boreholes were removed from the analysis because they were highly impacted by abstraction wells lying within their radius of influence. Only the analysis of Madliena borehole between the 1st and 13th of May 2011 (300 h time-series) is shown in this paper because of its low amplitudes, despite its position at a short distance from the shoreline, compared to the other monitoring boreholes. The same considerations explained hereunder can be outlined for the other monitoring boreholes subject of this study.
The Madliena dataset used for the purpose of this study is shown in Figure 5a, whilst the Portomaso sea tides dataset is shown in Figure 5b.
Although the observed piezometric signal is clearly affected by external driving forces, diurnal and semidiurnal fluctuations induced by sea tides can be inferred.
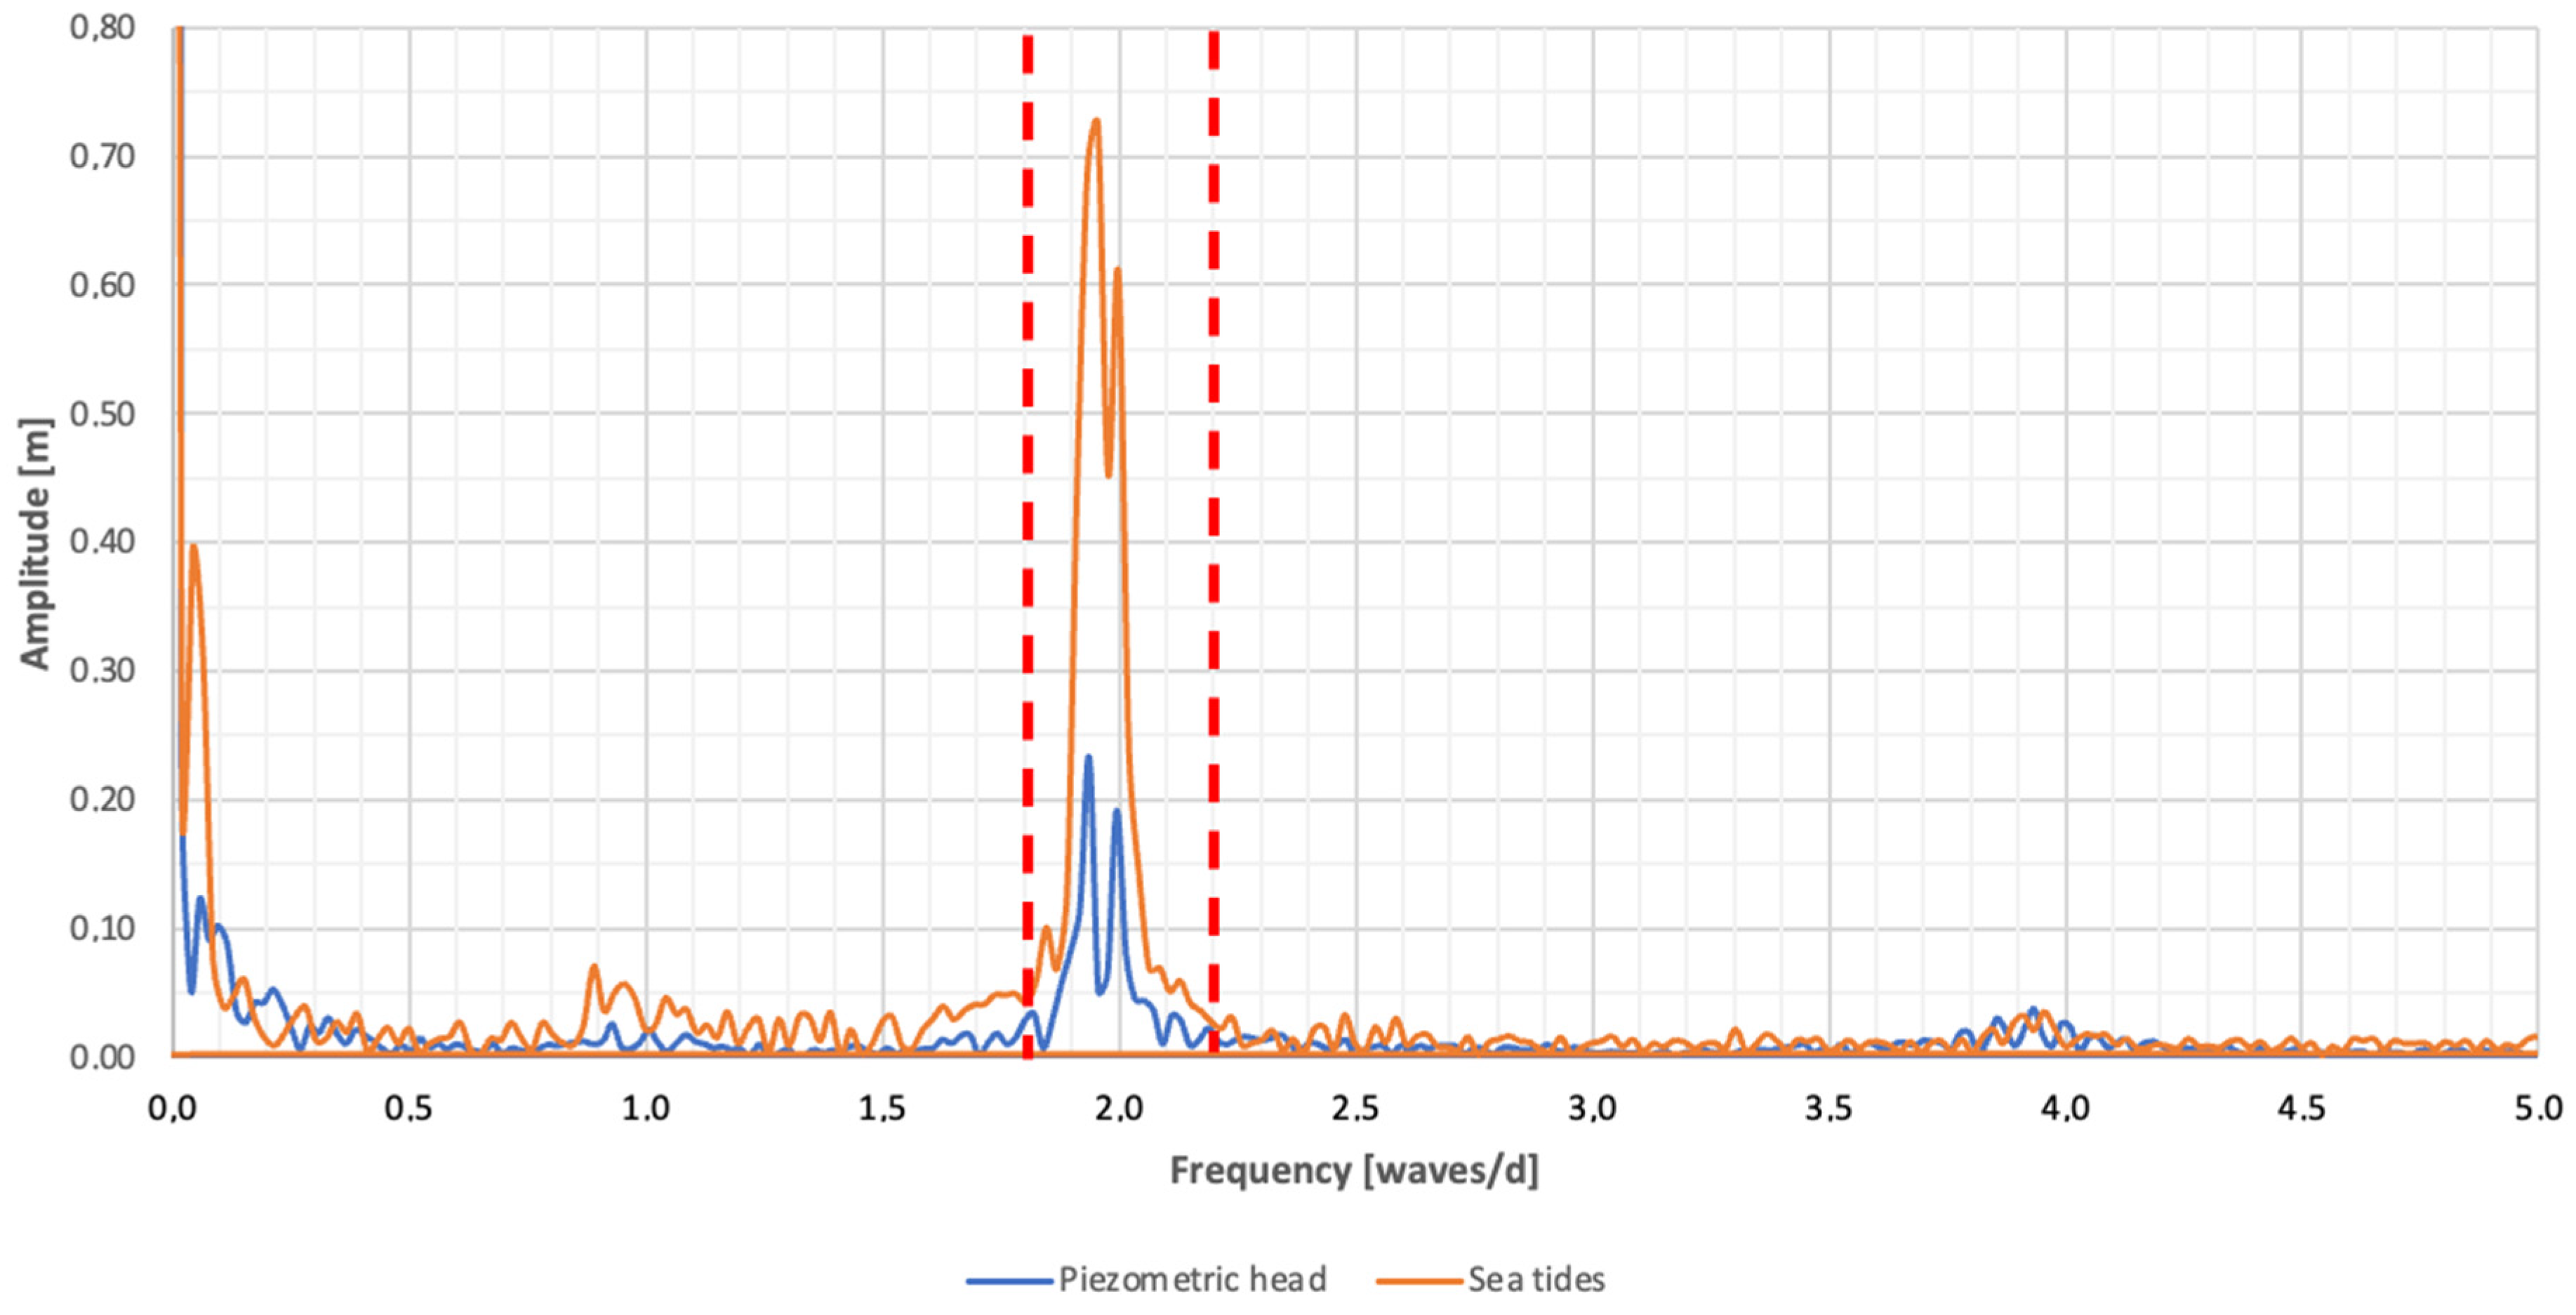
To enable separation of the effect of tidal components on the water table fluctuation from the available time series, FFT is applied and a cut-off range from 1.8 to 2.2 waves/d is selected (Figure 6).
Figure 6 highlights two amplitude peaks in correspondence with the frequency of two waves per day of both the piezometric head and the sea tides dataset, thus emphasising the connection between the aquifer and the sea. The observed water level fluctuations are a compound of solar and lunar originating from tides, with the solar component more intense than the lunar one in the open ocean.
Subsequently, we obtained the detrended and scaled to zero signals for both hydraulic head and sea tides by applying the inverse FFT (Figure 7a) and the reproduced water level signal amplified by the TE and shifted by a time equal to about 3.5 h (ΔT) (Figure 7b).
Through Figure 7a we can notice the largest amplitudes characterising the sea level and mixed semidiurnal character for both the reproduced signals. The 14-day envelope is retained in the reconstructed signals as it is encoded in the spectra seen in Figure 6 as a splitting of the peak centred around two waves/d. The piezometric head observed in Madliena shows the lower amplitude and temporal delay in peak values compared to the sea level signal. These two main differences can be explained as the aquifer diffusivity filtering effect to hydraulic heads observed inland from the sea level boundary condition. Moreover, it is possible to assess the time-lag by shifting over the timespan the reproduced signal of the piezometric head. The evaluation of this time-lag was conducted by observation and matching of the two signals. A more rigorous approach for the determination of the time-lag between the two signals was attempted using cross-correlation. The cross-correlation of the two signals was obtained and the result was then scaled using the autocorrelation of a rectangular signal of the same length. In theory, the maximal value of the scaled cross-correlation function should yield the time-lag between the two signals, as it occurs at the lag where the two signals are most similar. The results were inconclusive for the data analysed, and therefore, a result for the time-lag based on expert knowledge was considered as more appropriate.
Following reproduced signals of detrended and filtered sea level and hydraulic head, the Jacob–Ferris methodology is applied for each sine wave of the dataset characterised by a specific amplitude and period with a manual peak-to-peak detection of sea tide and induced groundwater level oscillation. Tidal attenuation analysis undertaken on the three months’ time-series of Madliena water level fluctuations dataset leads us to calculate a number of 114 values of the sought hydrogeological parameters which are lower than the expected number of values within the three months’ time-series because of data gaps in both the groundwater level and sea tides dataset.
Average values of hydraulic diffusivity, transmissivity, saturated thickness and hydraulic conductivity for the analysed monitoring boreholes are shown in Table 2. It is worth mentioning that the contents of Table 2 are affected by significant uncertainties related to the determination of transmissivity (T), freshwater thickness (b) and hydraulic conductivity (K). This uncertainty is due to a number of reasons: (i) the 1-D Jacob–Ferris solution is applied, although the actual geometry of the aquifer system is quasi-elliptical (Figure 4); (ii) the determined transmissivity parameter is obtained using an average storativity, however, storativity is site dependent and varies according to anisotropy, ratio of fissure water to matrix water and duration of the forcing; (iii) the aquifer thickness calculated through the Ghyben–Herzberg formula (Equation (3)) may not be representative of the actual freshwater thickness of the aquifer system; (iv) in turn, the estimated hydraulic conductivity may be affected by significant uncertainties also related to the nature of the carbonate type aquifer. Hydrodynamics parameters in carbonate aquifers may vary significantly according to the tertiary porosity of the rock formation, even through the vertical aquifer extension. Ideally, the tidal analysis undertaken on monitoring boreholes subject to hydrodynamic tests would enable us to calculate reliable site-specific values of storativity (i.e., [16]), but none of the gauging boreholes in this study have been tested for hydrodynamic characterisation due to economic reasons. Therefore, in accordance with Ayers and Clayshulte [15], the assumption of an average value of storativity was considered adequate for determining aquifer hydrogeological parameters. Faced with this dilemma, the essential point here is that although storativity and aquifer thickness may not be real, due to the present limited dataset, we present, in Table 2, estimated parameters noting that other combinations of storativity and aquifer thickness that preserve the local diffusivities are possible.
Due to the high anisotropy and heterogeneity in the aquifer system, a relationship between hydrogeological parameters and distance to the sea cannot be identified except for hydraulic diffusivity. Indeed, the methodology considers the regional conditions of the aquifer encompassed within the distance between the sea and the monitoring borehole under investigation. On the other hand, pumping tests usually obtain local hydrogeological conditions and represent an expensive solution if compared to installing a water-level device into a suitable well for tidal responses.
Hydraulic diffusivities estimated from tidal water level data in monitoring boreholes near the coast yielded one less order of magnitude values than those estimated in monitoring boreholes within 2 and 5 km away from the coastline and two lower than those located at a distance greater than 5 km from the shoreline.
In general, calculated mean transmissivity values range from 2.8 × 10⁻⁴ to 1.6 × 10⁻¹ m2/s. The wide range of variability of transmissivity was expected due to the different geological formations depicted in the MSLA of Malta and the numerous impermeable faults either sealing or reducing the bodily continuity between the groundwater body and the Mediterranean Sea.
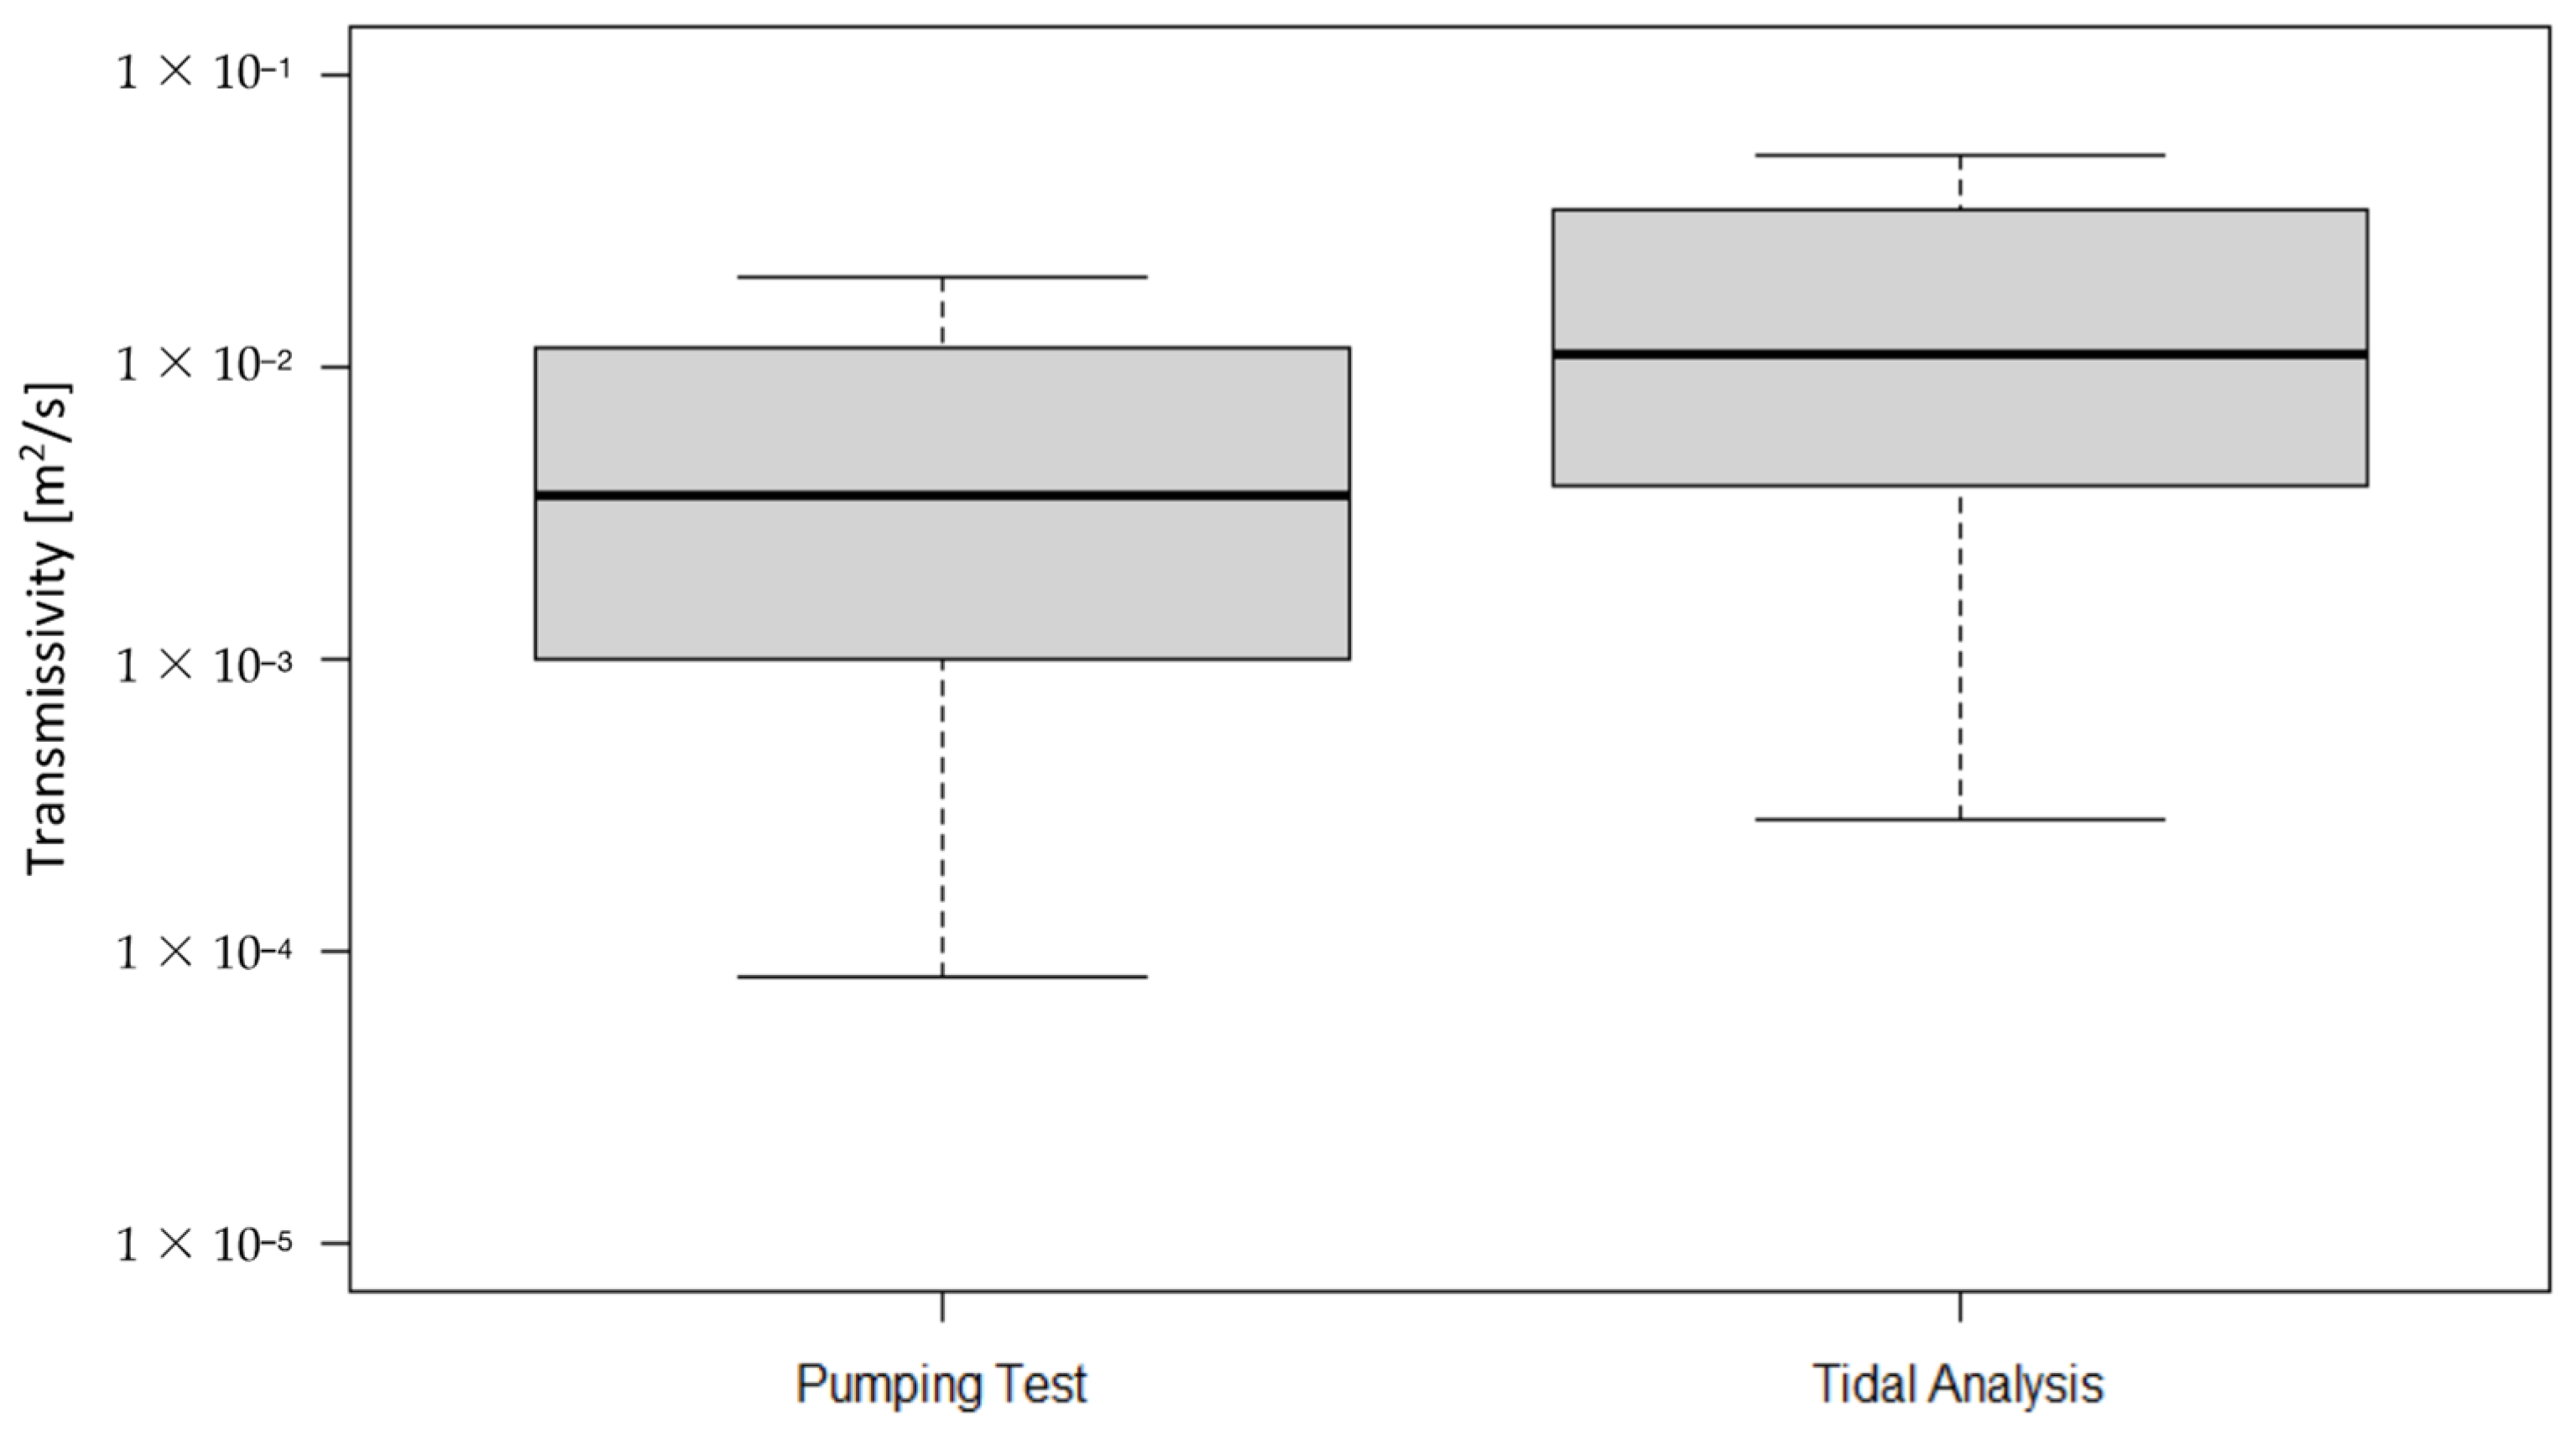
Finally, the calculated transmissivity values are joined to the ones derived from pumping tests interpretation (Figure 8). This was performed with the aim of spatially analysing the entire dataset and developing the transmissivity spatial distribution and its uncertainty map through the use of semi-variograms.
Figure 8 highlights a shift equal to about half an order of magnitude of average transmissivity between Pumping Tests and the Tidal Attenuation method, the latter is slightly larger than Pumping Tests. This may be associated with two main factors: (i) the Jacob–Ferris methodology assumes a sharp boundary subject to oscillating force, therefore, part of the energy transmitted from the sea boundary is naturally dissipated through the transition zone, damping the actual signal recorded in monitoring boreholes; (ii) while Pumping Tests lead to an assessment of transmissivities in the area surrounding the borehole, the transmissivity values calculated with the Tidal Attenuation method represent an average value of the geological formations crossed from the coastline to the monitoring point.
It must be noted that a rigorous approach should be limited to the development of a diffusivity spatial distribution map because the determination of transmissivity using an average storativity is not valid. However, diffusivity values calculated through the tidal attenuation method cannot be supplemented by other tests, such as tracing tests, because the latter cannot be applied in Malta. Given the limited dataset of nine calculated diffusivity values, geostatistical tools yielded inconsistent results when applied.

3.2. Geostatistical Analysis of Transmissivity

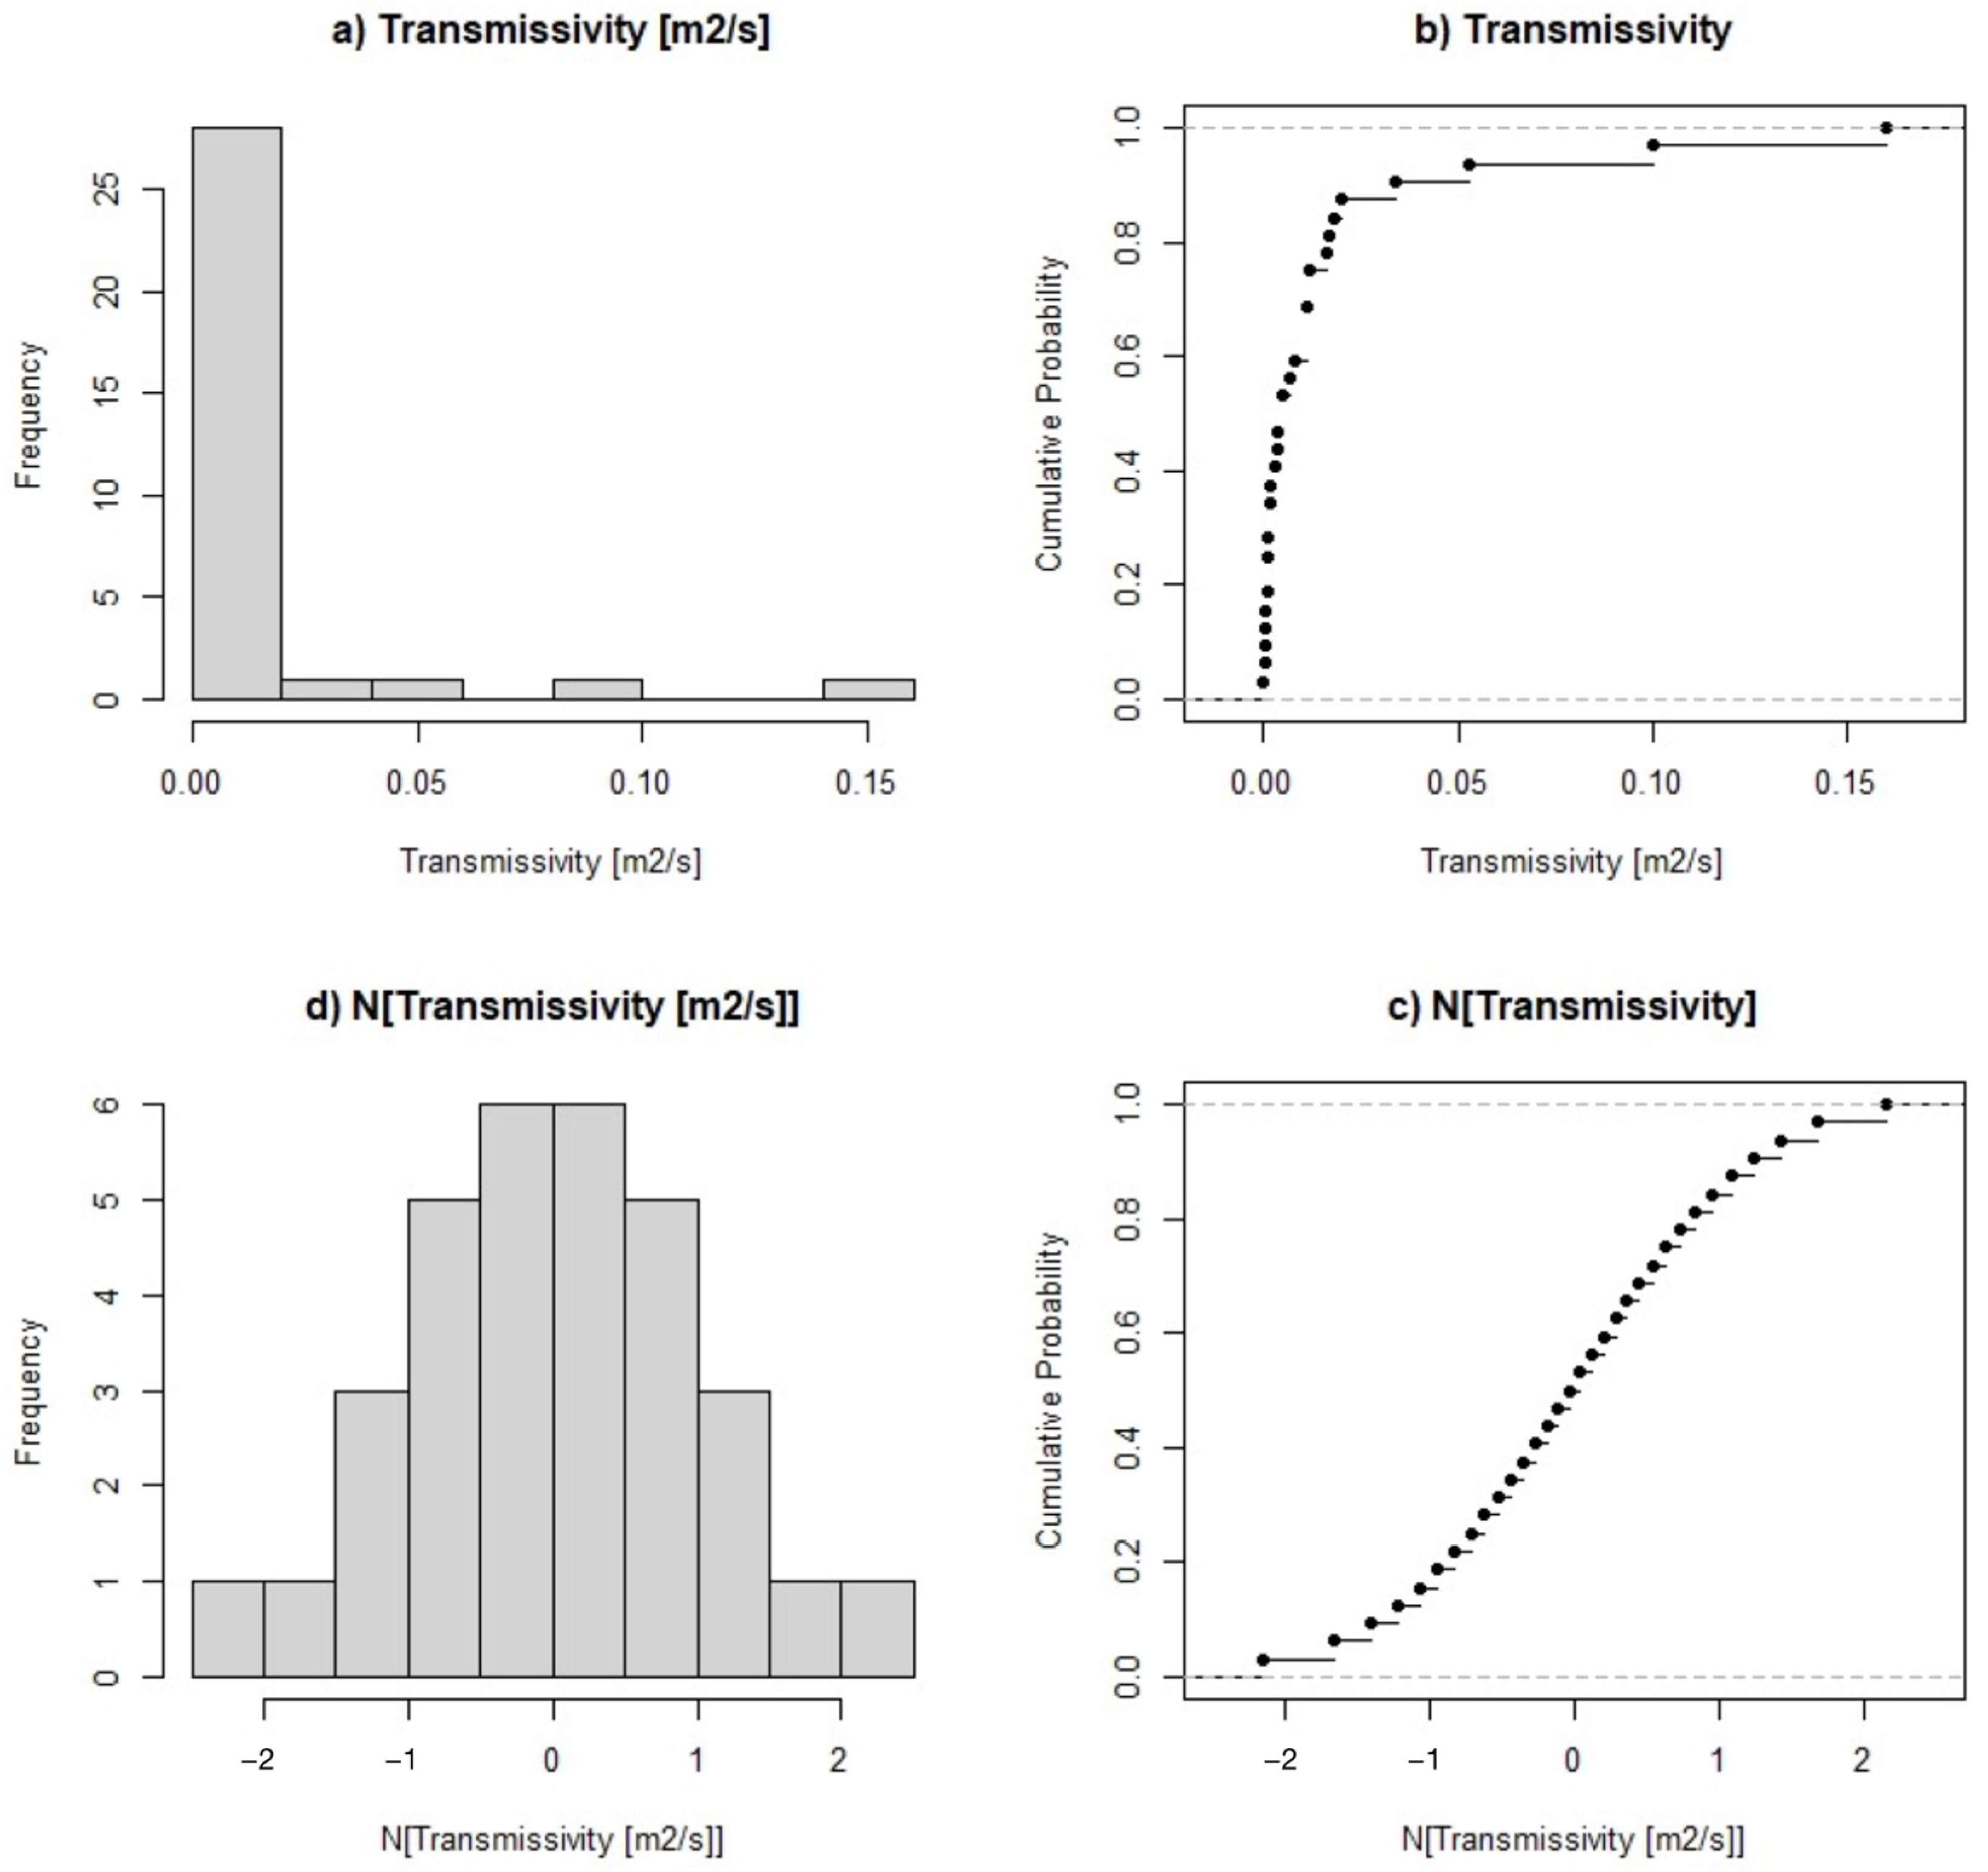
Figure 9 shows the frequency distribution and normal probability plot of transmissivity in real space and in normal space, with parameters listed in Table 3. The Gaussianity of the normal scores’ transformed transmissivity values were verified and the normal score transformation of the dataset is therefore acceptable.
Figure 10 shows omnidirectional empirical variograms of the normal scores transformed transmissivity calculated with a lag-distance of 1.3 km through a spherical model. The figure leads us to understand that the dataset is not very autocorrelated and does not allow us to fit the variogram model with a small nugget, which obviously generates relatively high levels of semi-variance.
A preferential isotropic direction (N135 or NW–SE) was assessed through hydrogeology expertise on the study area based on the main fault system strike and shape of the island. Afterwards, a directional variogram was calibrated. Restricted maximum likelihood was used to fit the directional variogram models resulting in model parameters as listed in Table 3.
The range indicates that the transmissivity is spatially correlated over a distance of approximately 4 km. The nugget represents about 80% of the sill and can be attributed to measurement errors, high heterogeneity and anisotropy entailed by the carbonate type aquifer system and inconstant sampling distance. The average of the standardised errors of the omnidirectional variogram is 0.052 and the variance is 1.029, which indicate the validity of the variogram model.
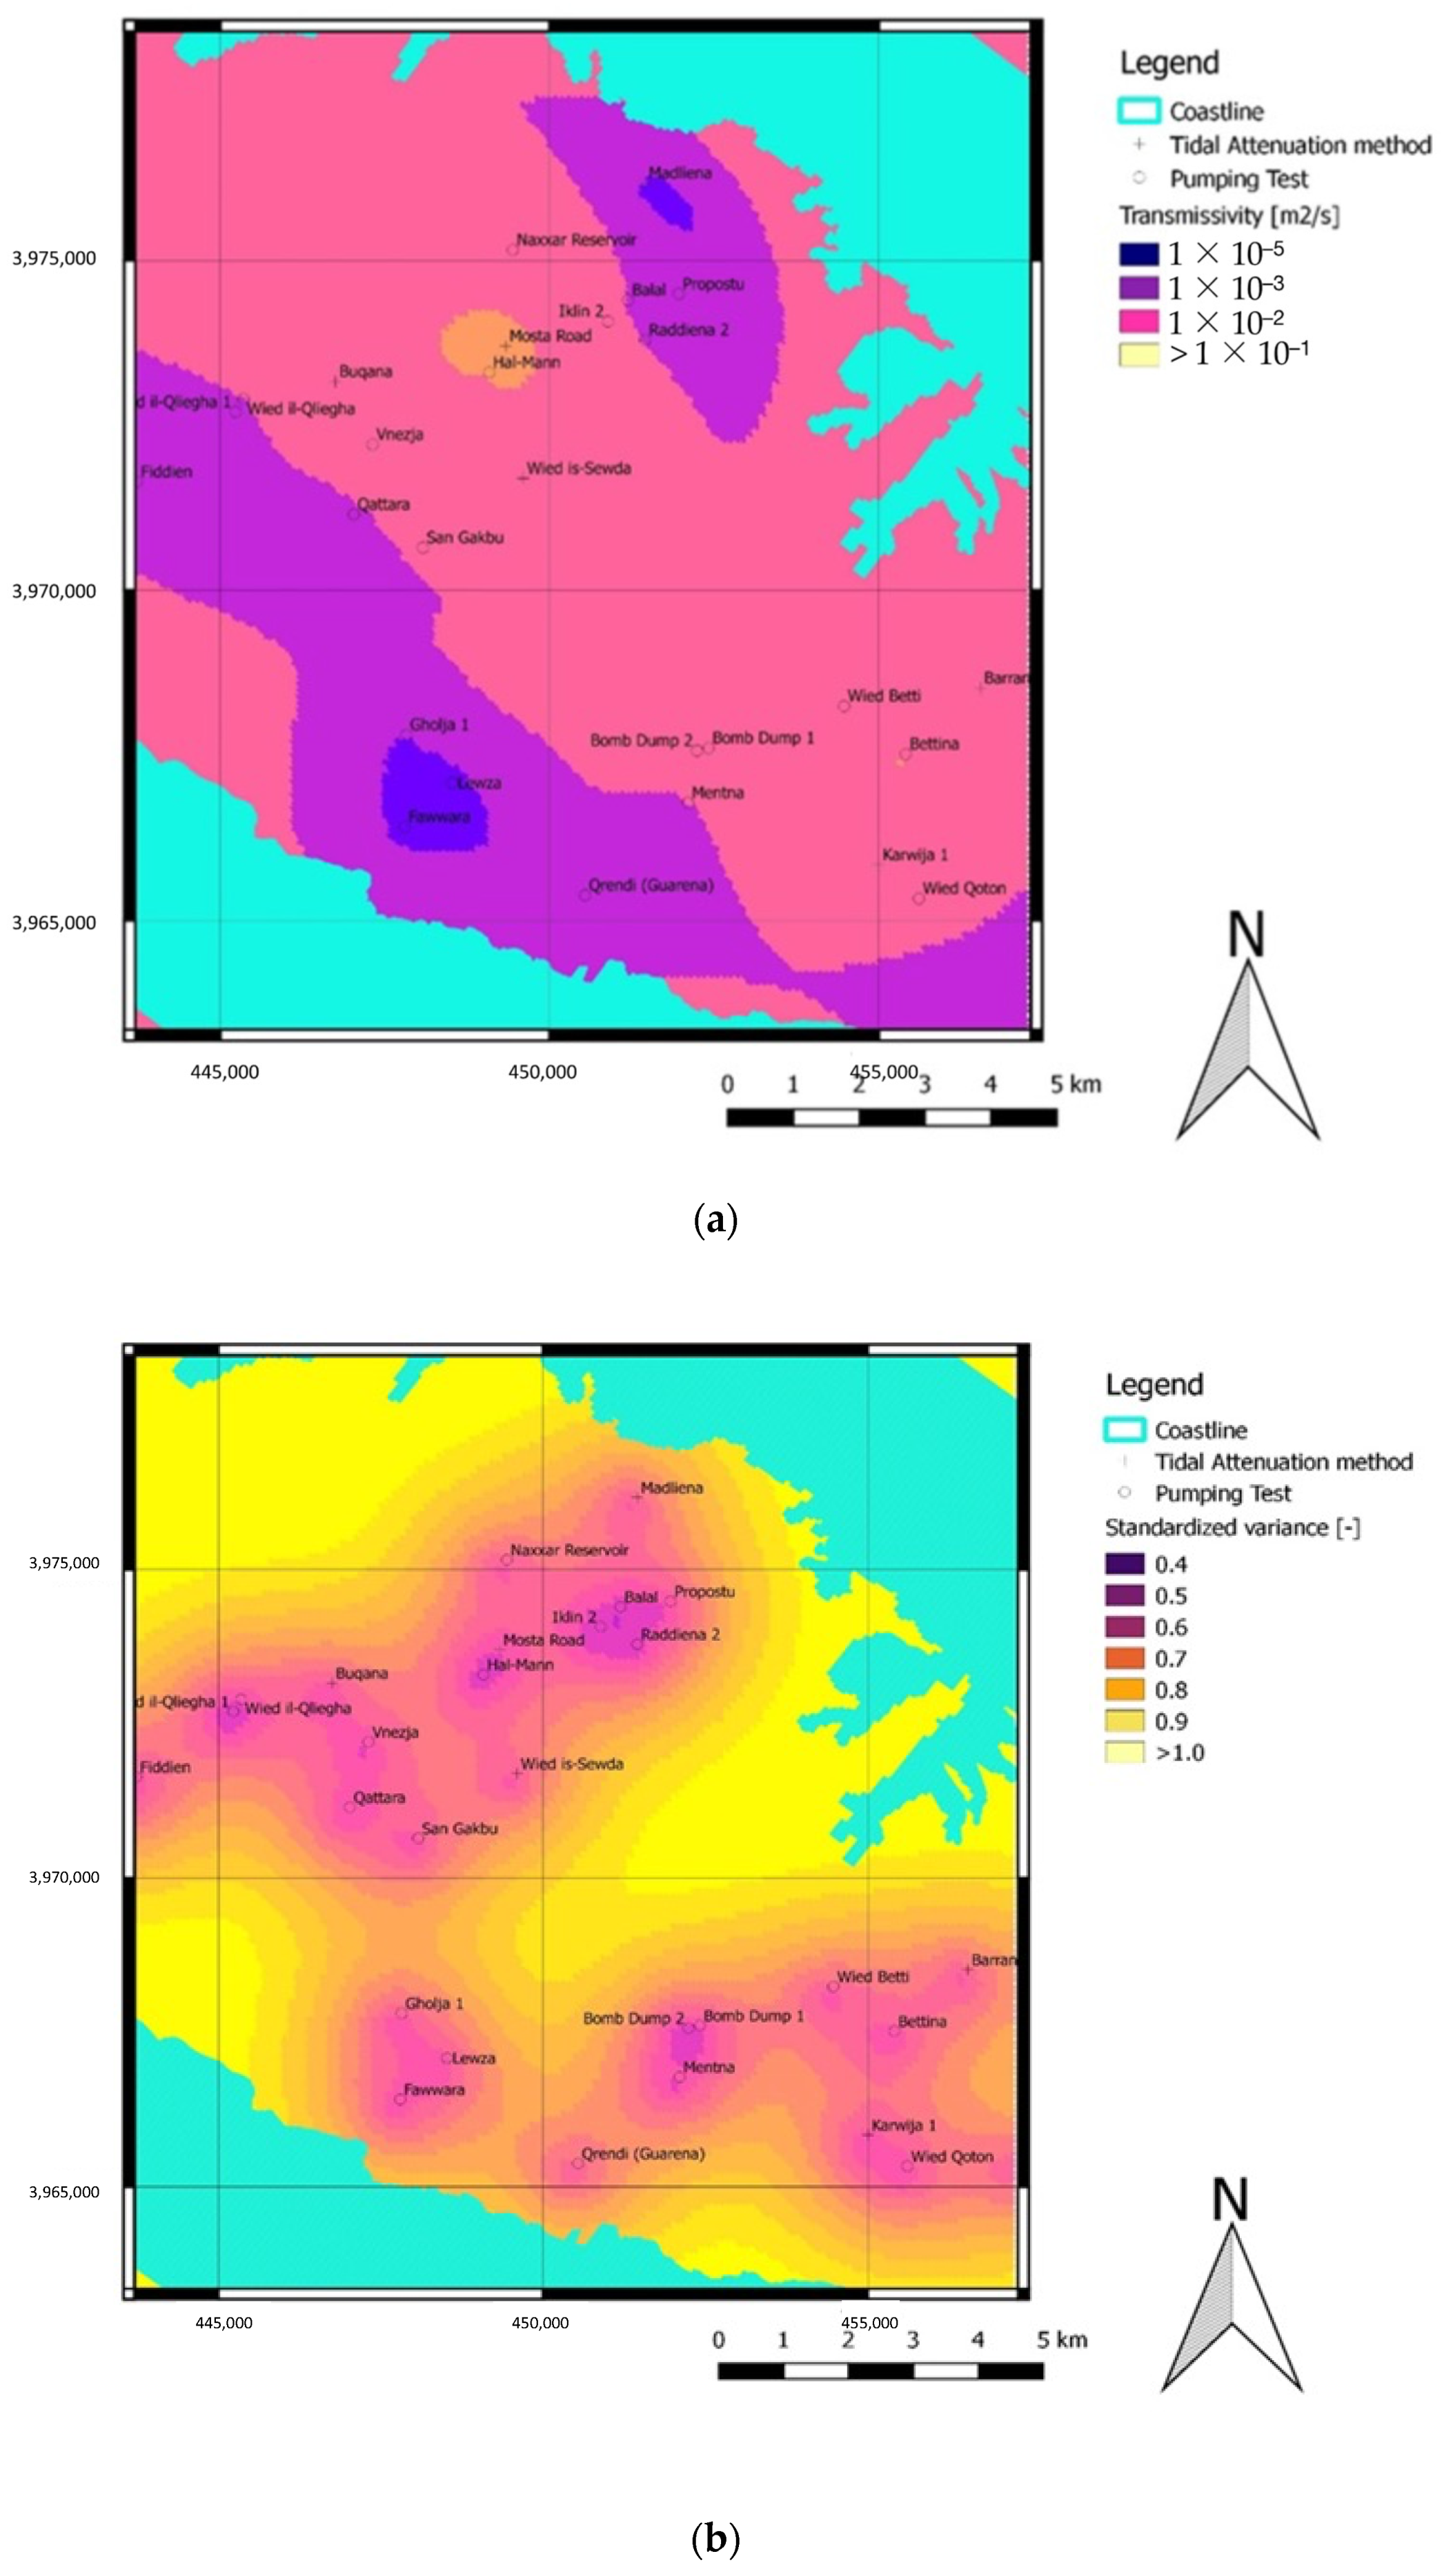
Figure 11 shows the spatial distribution map of the transmissivity of the Malta MSLA obtained by ordinary kriging interpolation and the associated error map with the spatial distribution of the kriging variance divided by the sample variance.

4. Discussion

The geological structure of the aquifer system at the sea level shows the succession of two main formations: Globigerina Limestone (GL) and Lower Coralline Limestone (LCL). The LCL is found at the sea level in the middle part of Malta where the highest values of transmissivity are assessed.
The LCL highly permeable formation dips below the sea level towards the east [7]; therefore, the GL formation takes place at the sea level originating low transmissivity values typical of the compact limestone formation. The western part of the island shows the lowest transmissivity values despite the presence of LCL: this is because the overlying Blue Clay (BC) formation which gives birth to the Perched Aquifer (PA) allows a relatively low infiltration to the MSLA. Hence, fine grain materials of BC fill the fissures of the LCL inducing a decrease of transmissivity. However, clay infilling is not only encountered under the PA but also to the east. The difference between the two regions may be explained by the fact that not all the fissures encountered in the eastern side are filled with fine grain materials. Another theory that will be further investigated is related to the origin of clay infilling. While the clay infilling on the west side originates from percolation through the BC layer, the one found in the east mainly originates from carbonate dissolution. Two high transmissivity regions can be identified; in the north where the Mosta Road borehole is located, and in the south, at the site of Bettina borehole. The latter suggests that undertaking further analysis of transmissivity in this region might be useful because the actual extension of this highly permeable area cannot be computed by geostatistical means due to lack of sampling data. The two individual high transmissivity peaks are separated by the Hamrun syncline which is responsible for the deepening of the top of the LCL below the sea level in the Valletta graben. In spite of the existence of the LCL above the sea level, in the middle part of the island and in between the two peaks of high transmissivity, the low transmissivity values may be either the result of faults acting as semi-pervious barriers or the result of a lack of data in this region. Moreover, the existence of numerous faults breaking the quasi-horizontal attitude of the formations in the west coast leads to highlighting the potential permeable pathways leaving the aquifer, thus inferring that faults are not impermeable throughout their extension. The highest values of transmissivity found in Bettina and Mosta Road lead us to understand that the mentioned boreholes have been dug through the most permeable member of the LCL formation, locally called the Attard member. However, since nothing is known about the vertical and horizontal extension of the Attard members of the LCL formation, or about their interconnection [7], more attention shall be dedicated to these values, because they may compromise the quality of the regional scale of analysis.
The proposed methodology based on FFT to eliminate external driving forces disrupting the sinusoidal tidally-induced groundwater level fluctuations typical of exploited coastal aquifers was revealed to be effective in improving the conceptualisation of the Malta MSLA freshwater lens system. It must be emphasised that an estimate of the precision of the determined hydrogeological parameters is not possible because those boreholes used for hydrodynamic tests during the 1990s are nowadays exploited for groundwater abstraction, making impossible to measure groundwater fluctuations induced by sea tides. It is tempting to suggest that the steps defined for determining aquifer hydrogeological parameters followed in this work are valid to be generalised in other similar study areas. However, it must be taken into account that, without a detailed field study focused on the same objectives in other coastal/island aquifers, it is not possible to assess to what extent the results obtained in the present case study can be generalised or are related to the particular natural site-specific conditions prevailing in the Malta MSLA.
Overall, the calculated transmissivity values are in the same range of variability of the ones obtained by pumping tests’ interpretation, suggesting that the simple Jacob–Ferris model is sufficient but not exhaustive for a thorough hydrogeological characterisation.

5. Conclusions

This paper recommends an improvement and application of the Jacob–Ferris method to determine hydrogeological parameters useful to implement groundwater flow and reactive transport models in coastal aquifers. The transformation from the temporal domain to the spectral domain of the observed signals by applying FFT allows the removal of the effect of external driving forces, highlighting fluctuations induced by sea tides. The identification of singular waves characterised by a specific amplitude and period is therefore simplified.
The determined hydrogeological parameters show a wide range of variability without any apparent linearity at increasing distances from the coastline, except for hydraulic diffusivity. In fact, the little autocorrelation of the sampled parameters was expected because of the high anisotropy and heterogeneity of the carbonate aquifer system, the succession of different diagenetic formations at the sea level and the numerous geological faults breaking up the quasi-horizontal attitude of the geological formations.
Analysis of tidal signal data and pumping tests in an array of monitoring boreholes widely distributed across the MSLA of Malta shows that lower-conductivity limestone can explain the significant tidal damping effect measured at increasing distance from the shoreline. Inland monitoring boreholes which are dug into the LCL formation at the sea level exhibit higher transmissivity than monitoring boreholes in the more compact GL formation found to the east at the sea level. Although the LCL can also be found in the west, clay infilling of fissures originating from the percolation through the overlying BC layer may be considered as the main factor in reducing the transmissivity in that region. Two individual high transmissivity peaks depicted inland are separated by the Hamrun syncline in which a number of faults most likely act as semi-pervious barriers.
The results from this study can be used to enhance the reliability of regional numerical density-dependent groundwater flow and solute transport models that allow the investigation of the effect of the implementation of MAR schemes in the MSLA of Malta under various recharge and abstraction conditions. Nonetheless, the variance spatial distribution map is of support to water management decisions for deciding where to allocate new gauging boreholes.

Author Contributions

Conceptualisation, F.D., M.S. (Michael Schembri) and M.S. (Manuel Sapiano); methodology, F.D., F.M. and I.P.; software, F.D. and F.M.; formal analysis, F.D. and F.M.; investigation, J.A.M., F.M., M.S. (Michael Schembri) and M.S. (Manuel Sapiano); resources, J.A.M., M.S. (Michael Schembri) and M.S. (Manuel Sapiano); data curation, I.P.; writing—original draft preparation, F.D.; writing—review and editing, I.P., J.A.M., M.S. (Michael Schembri), M.S. (Manuel Sapiano) and C.S.; supervision, M.S. (Michael Schembri), M.S. (Manuel Sapiano) and C.S.; funding acquisition, M.S. (Manuel Sapiano) and C.S. All authors have read and agreed to the published version of the manuscript.

Funding

The research leading to these results has received funding from the European Union’s Horizon 2020 research and innovation programme under the Marie Sklodowska-Curie grant agreement no. 814066 (Managed Aquifer Recharge Solutions Training Network–MARSoluT).

Data Availability Statement

The data presented in this study are partly available in the current article.

Acknowledgments

This work was carried out at the Energy and Water Agency, Malta. We thank Aldo Drago from the University of Malta for providing the sea tide data. The authors acknowledge the funding through the MARSoluT project (https://www.marsolut-itn.eu/ (accessed on 29 December 2022)).

Conflicts of Interest

The authors declare no conflict of interest.

References

  1. SEWCU (Sustainable Energy and Water Conservation Unit); ERA (Environmental and Resources Authority). The 2nd Water Catchment Management Plan for the Malta Water Catchment District 2015–2021; Government of Malta: Valletta, Malta, 2015; pp. 41–65, 107–124. [Google Scholar]
  2. Sapiano, M. Integrated Water Resources Management in the Maltese Islands. Acque Sotter. Ital. J. Groundw. 2020, 9. [Google Scholar] [CrossRef]
  3. Ortuño, F.; Molinero, J.; Custodio, E.; Juárez, I.; Garrido, T.; Fraile, J. Seawater intrusion barrier in the deltaic Llobregat aquifer (Barcelona, Spain): Performance and pilot phase results. In Proceedings of the SWIM21—21st Salt Water Intrusion Meeting, Barcelona, Spain, 21–26 June 2010; pp. 1–4. Available online: Swim-site.nl/pdf/swim21/pages_135_138.pdf (accessed on 15 November 2022).
  4. Javadi, A.A.; Hussain, M.S.; Abd-Elhamid, H.F.; Sherif, M.M. Numerical modelling and control of seawater intrusion in coastal aquifers. In Proceedings of the 18th International Conference on Soil Mechanics and Geotechnical Engineering, Paris, France, 6–9 September 2013; pp. 1–4. Available online: Cfms-sols.org/sites/default/files/Actes/739-742.pdf (accessed on 15 November 2022).
  5. Sinclair, K.M. ; National Centre for Groundwater Research and Training. Australian Groundwater Modelling Guidelines; Australian Government, National Water Commission: Turner, Australia, 2012; pp. 11–35. [Google Scholar]
  6. National Resource Management Ministerial Council; Environment Protection and Heritage Council; National Health and Medical Research Council. Australian Guidelines for Water Recycling, Managed Aquifer Recharge; National Water Quality Management Strategy Document No 24; Biotext: Canberra, Australia, 2009; pp. 33–52. ISBN 1921173475. [Google Scholar]
  7. BRGM. Study of the Fresh Water Resources of Malta; Services sol et sous-sol, Departement EAU: Paris, France, 1991; pp. 6, 74–77. [Google Scholar]
  8. Sánchez-Úbeda, J.P.; Calvache, M.L.; Duque, C.; López-Chicano, M. Estimation of hydraulic diffusivity using tidal-extracted oscillations from groundwater head affected by tide. In Proceedings of the 24th Salt Water Intrusion Meeting and the 4th Asia-Pacific Coastal Aquifer Management Meeting, Cairns, Australia, 4–8 July 2016; pp. 1–2. [Google Scholar]
  9. Rotzoll, K.; Gingerich, S.B.; Jenson, J.W.; El-Kadi, A. Estimating hydraulic properties from tidal attenuation in the Northern Guam Lens Aquifer, territory of Guam, USA. Appl. Hydrogeol. 2013, 21, 643–654. [Google Scholar] [CrossRef]
  10. Jacob, C.E. Flow of Groundwater. In Engineering Hydraulics; Rouse, H., Ed.; Wiley: Hoboken, NJ, USA, 1950; pp. 321–386. [Google Scholar]
  11. Ferris, J.G. Cyclic fluctuations of water level as a basis for determining aquifer transmissivity. Assoc. Int. Hydrol. Sci. 1951, 33, 148–155. [Google Scholar]
  12. Flinchem, E.P.; Jay, D.A. An introduction to Wavelet Transform Tidal Analysis Methods. Estuar. Coast. Shelf Sci. 2000, 51, 177–200. [Google Scholar] [CrossRef] [Green Version]
  13. Srzić, V.; Lovrinović, I.; Racetin, I.; Pletikosić, F. Hydrogeological Characterization of Coastal Aquifer on the Basis of Observed Sea Level and Groundwater Level Fluctuations: Neretva Valley Aquifer, Croatia. Water 2020, 12, 348. [Google Scholar] [CrossRef] [Green Version]
  14. Rahi, K.A. Estimating the Hydraulic Parameters of the Arbuckle-Simpson Aquifer by Analysis of Naturally-Induced Stresses. Ph.D. Thesis, Oklahoma State University, Stillwater, OK, USA, 2010. [Google Scholar]
  15. Ayers, J.F.; Clayshulte, R.N. A Preliminary Study of the Hydrogeology of Northern Guam; Technical Report No. 56; University of Guam, Water and Energy Research Institute of the Western Pacific: Mangilao, Guam, USA, 1984. [Google Scholar]
  16. Trefry, M.G.; Bekele, E. Structural characterization of an island aquifer via tidal methods. Water Resour. Res. 2004, 40, W01505. [Google Scholar] [CrossRef]
  17. Maréchal, J.C.; Hakoun, V.; Corbier, P. Role of Reef-Flat Plate on the Hydrogeology of an Atoll Island: Example of Rangiroa. Water 2022, 14, 2695. [Google Scholar] [CrossRef]
  18. Clark, W.E. Computing the barometric efficiency of a well. J. Hydraul. Div. 1967, 93, 93–98. [Google Scholar] [CrossRef]
  19. Turnadge, C.; Crosbie, R.S.; Barron, O.; Rau, G.C. Comparing Methods of Barometric Efficiency Characterization for Specific Storage Estimation. Groundwater 2019, 57, 844–859. [Google Scholar] [CrossRef]
  20. Rau, G.C.; Cuthbert, M.O.; Acworth, R.I.; Blum, P. Technical note: Disentangling the groundwater response to Earth and atmospheric tides to improve subsurface characterisation. Hydrol. Earth Syst. Sci. 2020, 24, 6033–6046. [Google Scholar] [CrossRef]
  21. McMillan, T.C.; Rau, G.C.; Timms, W.A.; Andersen, M.S. Utilizing the Impact of Earth and Atmospheric Tides on Groundwater Systems: A Review Reveals the Future Potential. Rev. Geophys. 2019, 57, 281–315. [Google Scholar] [CrossRef]
  22. Davis, D.R.; Rasmussen, T.C. A comparison of linear regression with Clark’s Method for estimating barometric efficiency of confined aquifers. Water Resour. Res. 1993, 29, 1849–1854. [Google Scholar] [CrossRef]
  23. Drogue, C. Coefficient D’infiltration ou Infiltration Efficace, sur les Roches Calcaires; Actes Colloque D’hydrologie en Pays Calcaire: Besançon, France, 1971; pp. 121–131. [Google Scholar]
  24. Mangin, A. Contribution à L’étude hydrodynamique des aquifères karstiques. Thèse Univ. Dijon. Ann. De Spéléologie 1975, 30, 21–124. [Google Scholar]
  25. Kiraly, L.; Müller, I. Hétérogénéité de la Perméabilité et de L’alimentation dans le Karst: Effet sur la Variation du Chimisme des Sources Karstiques [Heterogeneity of the Permeability and the Infiltration in the Karst: Effect on the Karstic Springs Water Chemistry Variations]; Bulletin du Centre d’Hydrogéologie: Neuchâtel, Switzerland, 1979; pp. 237–285. [Google Scholar]
  26. Williams, P.W. The role of the subcutaneous zone in karst hydrology. J. Hydrol. 1983, 61, 45–67. [Google Scholar] [CrossRef]
  27. Sauter, M. Quantification and Forecasting of Regional Groundwater Flow and Transport in a Karst Aquifer (Gallusquelle, SW Germany). Ph.D. Thesis, University of Tübingen, Tübingen, Germany, 1992. [Google Scholar]
  28. Klimchouk, A.B. ; The Formation of Epikarst and Its Role in Vadose Speleogenesis; National Speleological Society: Huntsville, AL, USA, 2000; pp. 91–99. [Google Scholar]
  29. Guo, H.; Jiao, J.J.; Li, H. Groundwater response to tidal fluctuation in a two-zone aquifer. J. Hydrol. 2010, 381, 364–371. [Google Scholar] [CrossRef]
  30. Rotzoll, K.; El-Kadi, A.I.; Gingerich, S.B. Estimating hydraulic properties of coastal aquifers using wave setup. J. Hydrol. 2008, 353, 201–221. [Google Scholar] [CrossRef]
  31. Magri, O. A geological and Geomorphological Review of the Maltese Islands with Special Reference to Coastal Zone; Territoris 4; Territoris Universitat de les Illes Belears: Palma, Spain, 2006. [Google Scholar]
  32. Herbert, P.T. The Geology of the Maltese Islands; Malta College of Arts, Science & Technology: Paola, Malta, 1955; pp. 22–33. [Google Scholar]
  33. Pedley, H.M. Syndepositional Tectonics Affecting Cenozoic and Mesozoic Deposition in the Malta and SE Sicily Areas (Central Mediterranean) and Their Bearing on Mesozoic Reservoir Development in the N Malta Offshore Region; Butterworth & Co, (Publishers) Ltd.: London, UK, 1989; pp. 171–178. [Google Scholar]
  34. Newbery, J. The Perched Water Table in the Upper Limestone Aquifer of Malta; Government of Malta: Valletta, Malta, 1968; pp. 551–570. [Google Scholar]
  35. OED (Oil Exploration Directorate, Office of the Prime Minister). Geological Map of the Maltese Islands: Sheet 1; Government of Malta: Valletta, Malta, 1993. [Google Scholar]
  36. Perrin, J. A Conceptual Model of Flow and Transport in a Karst Aquifer Based on Spatial and Temporal Variations of Natural tracers. Ph.D. Thesis, Centre of Hydrogeology, Universite de Neuchatel Faculte des Sciences Institute de Geologie, Neuchâtel, Switzerland, 2003; pp. 9–44. [Google Scholar]
  37. Real Time Stations @ Malta PORTOMASO. Available online: Ioi.research.um.edu.mt/capemalta/stations@malta/PORTOMASO/ (accessed on 19 November 2020).
  38. Backalowicz, M. Isotope Technology for Groundwater Development Hydrogeology of the Two Main Aquifers of Malta Island; Government of Malta: Valletta, Malta, 2001; Volume 3–6, pp. 13–14. [Google Scholar]
  39. ATIGA. Wastes Disposal and Water Supply Project, Malta; Interim Report on the Hydrology of Malta; ATIGA Consortium: Valletta, Malta, 1970. [Google Scholar]
  40. Morris, T. The Water Supply Resources of Malta; Government of Malta: Valletta, Malta, 1955; pp. 60–103. [Google Scholar]
  41. Tomasicchio, U. Manuale di Ingegneria Portuale e Costiera; Ulrico Hoepli Editore S.p.A.: Milan, Italy, 2015; pp. 76–82. [Google Scholar]
  42. Fidelibus, M.D.; Balacco, G.; Gioia, A.; Iacobellis, V.; Spilotro, G. Mass transport triggered by heavy rainfall: The role of endorheic basins and epikarst in a regional karst aquifer. Hydrol. Process. 2016, 31, 394–408. [Google Scholar] [CrossRef]
  43. Ghyben, B.W. Nota in Verband met de Voorgenomen Putboring Nabij Amsterdam. Tijdschr. Kon. Inst. Ing. 1888, 9, 8–22. [Google Scholar]
  44. Herzberg, A. Die Wasserversorgung einiger Nordseebäder. J. Gasbeleucht Wasserversorg 1901, 44, 815–819, 842–844. [Google Scholar]
  45. Guastaldi, E. Geostatistical Modeling of Uncertainty for the Risk Analysis of a Contaminated Site. J. Water Resour. Prot. 2011, 3, 563–583. [Google Scholar] [CrossRef] [Green Version]
  46. Gómez-Hernández, J.J.; Srivastava, R.M. One Step at a Time: The Origins of Sequential Simulation and Beyond. Math. Geosci. 2021, 53, 193–209. [Google Scholar] [CrossRef]
  47. Goovaerts, P. Geostatistics for Natural Resources Evaluation; Applied Geostatistics Series; Oxford University Press: Oxford, UK, 1997; Volume 14, p. 483. [Google Scholar]
  48. Barca, E.; Porcu, E.; Bruno, D.; Passarella, G. An automated decision support system for aided assessment of variogram models. Environ. Model. Softw. 2016, 87, 72–83. [Google Scholar] [CrossRef]
  49. Pebesma, E.; Graeler, B. Package ‘Gstat’. R News. 2021. Available online: Cran.r-project.org/web/packages/gstat/gstat.pdf (accessed on 15 November 2022).
  50. Isaaks, E.H.; Srivastava, R.M. An Introduction to Applied Geostatistics; Oxford University Press: Oxford, UK, 1989. [Google Scholar]
  51. El-Rawy, M.; De Smedt, F. Estimation and Mapping of the Transmissivity of the Nubian Sandstone Aquifer in the Kharga Oasis, Egypt. Water 2020, 12, 604. [Google Scholar] [CrossRef]
Figure 1. Conceptual diagram of tidally-induced groundwater level signals over space and tide fluctuation over time in a schematic coastal aquifer, where x is the distance of the monitoring borehole from the coastline, h is the hydraulic head, z is the depth of the freshwater/seawater interface from mean sea level, and T is the period of the wave length.
Water 15 00177 g001
Figure 2. Simplified lithology and geological fault systems of the Maltese Island (modified after [35]).
Water 15 00177 g002
Figure 3. Conceptual cross section of the Mean Sea Level Aquifer (MSLA) and the Perched Aquifer (PA) of Malta (modified after [1]). The vertical scale is highly exaggerated, with the scale above sea level greater than the scale below sea level.
Water 15 00177 g003
Figure 4. Digital Terrain Model and geological fault systems showing monitoring boreholes’ locations in the MSLA of Malta.
Water 15 00177 g004
Figure 5. (a) observed groundwater level fluctuations in Madliena monitoring borehole; (b) observed sea tides in Portomaso sea gauge.
Water 15 00177 g005
Figure 6. Plot of piezometric heads of Madliena gauging borehole and sea tides in spectral domain; the cut-off frequency range is shown in red dashed lines.
Water 15 00177 g006
Figure 7. Reproduced water levels and sea tides signal obtained by applying the inverse FFT on the selected frequency range of the spectra from 1.8 to 2.2 waves/d (a) and reproduced sea tides signal plotted with the reproduced piezometric signal amplified by TE and shifted by ΔT equal to about 3.5 h (b).
Water 15 00177 g007
Figure 8. Comparison of calculated transmissivity [m2/s] values from pumping tests interpretations and tidal attenuation method through Box and Whisker plots.
Water 15 00177 g008
Figure 9. (a) Frequency distribution of raw transmissivity values; (b) cumulative probability plot of raw transmissivity values; (c) normal probability plot of normal scores’ transformed values of transmissivity; (d) frequency distribution of normal scores’ transformed values of transmissivity.
Water 15 00177 g009
Figure 10. Omnidirectional variogram fitted with directional spherical model variogram by cross-validation.
Water 15 00177 g010
Figure 11. Map with the spatial distribution of the transmissivity of the Malta MSLA obtained by ordinary kriging interpolation (a) and the corresponding error map showing the spatial distribution of the estimated kriging variance divided by sample variance (b).
Water 15 00177 g011
Table 1. Average values of analysed monitoring boreholes during the period of analysis (from 1st May until 31st July 2011).
Borehole NameLocalityDistance to Sea [m]Mean
Hydraulic Head
[m amsl]
Mean Depth to Water Level
[m bGL]
Mean
Amplitude [m]
Mean Period [hours]
PortomasoSea gauge00.04200.06912.43
Noqra LaneBirzebugga2600.3931.560.02411.96
MadlienaGharghur11001.80274.130.00912.38
Hal-TmiemZejtun16802.49846.120.01412.34
KarwijaSafi26001.55376.680.01612.37
Wied BusbiesRabat26752.115158.930.01012.27
BarraniGhaxaq45001.95338.790.01212.10
Wied SewdaAttard46002.10755.290.01312.30
Mosta RoadMosta51501.95568.540.03212.39
BuqanaMosta77502.34787.830.01012.15
Table 2. Average values of analysed monitoring boreholes during the period of analysis (from 1st May until 31st July 2011).
Borehole NameLocalityDistance to Sea [m]D [m2/s]T [m2/s]b [m]K [m/s]
Noqra LaneBirzebugga26072.8 × 10−4142.1 × 10−5
MadlienaGharghur1100291.5 × 10−3612.4 × 10−5
Hal-TmiemZejtun1680783.9 × 10−3924.3 × 10−5
KarwijaSafi26002211.1 × 10−2571.9 × 10−4
Wied BusbiesRabat26751396.9 × 10−3788.9 × 10−5
BarraniGhaxaq45003231.6 × 10−2722.3 × 10−4
Wied SewdaAttard46006853.4 × 10−2774.4 × 10−4
Mosta RoadMosta515044311.6 × 10−1722.2 × 10−3
BuqanaMosta775010695.3 × 10−2866.2 × 10−4
Table 3. Average values of analysed monitoring boreholes during the period of analysis (from 1 May until 31 July 2011).
ParameterSymbolUnitsValue
Mean μ m2/s0.016
Variance σ 2 -0.001
Nugget n -0.480
Sill s -0.600
Range r m4005
Disclaimer/Publisher’s Note: The statements, opinions and data contained in all publications are solely those of the individual author(s) and contributor(s) and not of MDPI and/or the editor(s). MDPI and/or the editor(s) disclaim responsibility for any injury to people or property resulting from any ideas, methods, instructions or products referred to in the content.