Article

Driving Forces and Influences of Flood Diversion on Discharge Fraction and Peak Water Levels at an H-Shaped Compound River Node in the Pearl River Delta, South China

1
School of Geography and Planning, Sun Yat-sen University, Guangzhou 510275, China
2
Southern Marine Science and Engineering Guangdong Laboratory (Zhuhai), Zhuhai 519082, China
3
Guangdong Provincial Engineering Research Center for Public Security and Disasters, Guangzhou 510275, China
4
School of Marine Sciences, Sun Yat-sen University, Zhuhai 519082, China
5
School of Earth Sciences and Engineering, Sun Yat-sen University, Zhuhai 519082, China
*
Authors to whom correspondence should be addressed.
Water 2023, 15(11), 1970; https://doi.org/10.3390/w15111970
Submission received: 26 March 2023 / Revised: 17 May 2023 / Accepted: 18 May 2023 / Published: 23 May 2023
(This article belongs to the Special Issue A Safer Future—Prediction of Water-Related Disasters)

Abstract

:
The SiXianJiao (SXJ) is the first-order exchange node of the West River and the North River and redistributes water (mass) to the downstream river network in the Pearl River Delta (PRD), South China. The lateral SXJ waterway plays a critical role in flow (mass) diversion between the West River and the North River, forming a unique H-shaped compound river node. Previous studies mainly focused on Y-shaped bifurcation and confluence nodes, and there is a lack of research on deltaic H-shaped river nodes. This study established the Delft3D model to investigate the driving forces and influences of flood diversion at the SXJ node. The results showed that the H-shaped SXJ river node was usually in hydraulic equilibrium but was often disturbed by large water level differences between the two rivers, due to unbalanced and asynchronous upstream flood waves. The large water level differences drove mutual flood diversion through the lateral SXJ waterway, which synchronized the downstream discharge and reduced the peak water levels (flood hazards), resulting in similar water levels or hydraulic equilibrium in the two rivers. There exists a critical flow fraction—about 75.9% (West River)—at which the incoming flow from both rivers presents similar water levels at the SXJ node, resulting in little flood diversion. Above the threshold, the flood water will divert from the West River to the North River with a maximum rate of −11,900 m3/s, accounting for 20% of the West River, reducing the peak water level up to 1.48 m at Makou. Below the threshold, the flood water will divert from the North River to the West River with a maximum rate of 11,990 m3/s, accounting for 55% of the North River, reducing the peak water level up to 6.63 m at Sanshui. Meanwhile, the discharge fraction at downstream Makou (Sanshui) maintained a near-constant value during individual floods and fluctuated around 76.6% (23.4%). This critical discharge fraction and the analytical approach are of significance in flood-risk management and hydraulic engineering design in the PRD. The concept model of the H-shaped compound river node clearly elucidates the flood diversion mechanism via the lateral SXJ waterway and may work for other similar river nodes as well.

1. Introduction

River bifurcations divide water, sediment, and, indirectly, flood risk over downstream river branches [1]. Many river bifurcations are asymmetrical [2]. Such asymmetries include different channel directions, bending, widths, and depths with respect to the upstream river channel and the downstream branches [3]. Asymmetrical bifurcations are always unstable because of the erodible banks and river bed and a larger share of flow and sediment developed in one of the downstream branches [4]. Even symmetrical river bifurcations always turn asymmetrical in allocating flow and sediment after decades or centuries, depending on the integrated effects of various factors, including regional factors and local factors [5]. Regional factors are external boundary conditions in the upstream feeding rivers and the downstream branches. Local factors are internal features such as bar and meander dynamics [1]. When a bifurcation is affected by tides in coastal river deltas, the flow and sediment distribution become more complicated [4,6,7,8].
From the view of topology, the river nodes include a Y-shaped confluence node, an inverse Y-shaped bifurcation node, and an X-shaped compound river node [9,10,11]. A wide range of studies have been carried out by researchers to investigate the flow field characteristics at the Y-shaped confluence node through field monitoring, hydraulic experiments. And numerical simulations [12,13,14]. The inverse Y-shaped bifurcation node is the most common one for a single upstream river, where the allocation of water and sediments over the two downstream branches is mainly controlled by the channel dimensions and the hydraulic roughness and can greatly reduce the flood hazard [1,15,16]. Many researchers have systematically studied water and sand distribution in inverse Y-shaped bifurcation channels and developed 1D and 2D theoretical models for water and sand distribution, channel evolution, and stability [2,15,17]. The X-shaped river node is a compound node consisting of a Y-shaped confluence and an inverse Y-shaped bifurcation node, where flow confluence and division occur nearly simultaneously and water in two branches can freely exchange and redistribute [9,10,11,18,19].
At the northwestern apex of the Pearl River Delta (PRD), South China, the lateral SiXianJiao (SXJ) waterway connects the West River and the North River and forms a unique H-shaped compound river node, which also consists of two Y-shaped river nodes. Water exchanges via the lateral SXJ waterway between both rivers take place in two steps—first diverting from the West (or the North) River at an inverse Y-shaped bifurcation node, then converging to the North (or the West) River at a Y-shaped confluence node. The mutual exchange of flow and sediment through the lateral SXJ waterway affects the flood hazard along the downstream river network and eventually the estuary development in the PRD [20,21,22,23].
Most previous studies focused on flow and sediment division at regular Y-shaped bifurcation nodes for a single river [1,4,5,15,16,24,25], while few studies investigated how the flow exchange occurred at an H-shaped compound node for both rivers [26,27,28]. The H-shaped compound river node creates an unstable state (i.e., a large water level difference) between the two rivers, due to the different ratios of upstream inflow and the asynchronous tide in downstream branches, while always approaching hydraulic equilibrium (a small water level difference) by mutual flow diversion via the lateral SXJ waterway, which plays a crucial role in flood diversion and mass redistribution for the West River, the North River, and the downstream river network [29,30].
Divisions of flow and sediment at waterways in the PRD have been changing over the past half century, resulting in varying fractions of flow and sediment draining into the South China Sea through eight outlets [31]. Before the early 1990s, the discharge fraction of the downstream West River branch at Makou was about 78~90% (average 82%) of the total flow from the upstream West River and North River, but, since the 1990s, it decreased to 73~80% (average 75%) [29,32,33]. Accordingly, the discharge rate of the downstream North River branch at Sanshui almost doubled [20,34]. Several studies investigated the characteristics of flow division at the SXJ node and discussed the sensitivity of flow division to incoming fresh flow and estuary tides by constructing a 1D and 2D hydrodynamic models [8,35]. However, these studies did not investigate how the flow diversion in the SXJ waterway occurred and influenced the discharge fraction and the peak water levels in the downstream river branches.
In previous studies [26,27,35], the flow diversion in the SXJ waterway was indirectly estimated by an approach of water balance using flow measurements at two upstream stations (Gaoyao and Shijiao) and two downstream stations (Makou and Sanshui). Shen (1989) established an empirical linear model to estimate the current-day total flow from the North (West) River using the previous-day flow at Shijiao (Gaoyao), and then calculated the flow diversion as the residuals between the total flow from the North (West) River and the downstream discharge at Sanshui (Makou) [26]. Using the water balance approach, Liu (2008) analyzed the monthly diversion in the SXJ waterway during 1959–2004 and found that the annual diversion from the North River to the West River before 1992 had been reversed since 1993 [27]. Li (2018) constructed a stage-discharge relation in the SXJ waterway by multivariate linear regression using in situ measurements during a flood period in 2017 [28]. Nonetheless, the flow diversion in the low-water period was mainly controlled by the asynchronous tides in the downstream branches [36], and the application of such a statistic model that ignored the tidal force was limited in a changing environment.
The primary aim of this study was to investigate the main driving forces of flood diversion via the lateral SXJ waterway at an H-shaped compound river node, and to quantify how flood diversion modulates the large water level difference between the two rivers and influences the discharge fraction and peak water levels (i.e., flood hazards) at downstream Makou and Sanshui. Section 2 describes the study area and datasets; Section 3 explains the model setup and scenario modeling; Section 4 presents the results, followed by discussion in Section 5 and a conclusion. The study of the H-shaped compound node supports the expansion of the diversion theory of river nodes from a topological perspective. It also provides research insights for the same types of nodes in other deltas.

2. Study Area and Data
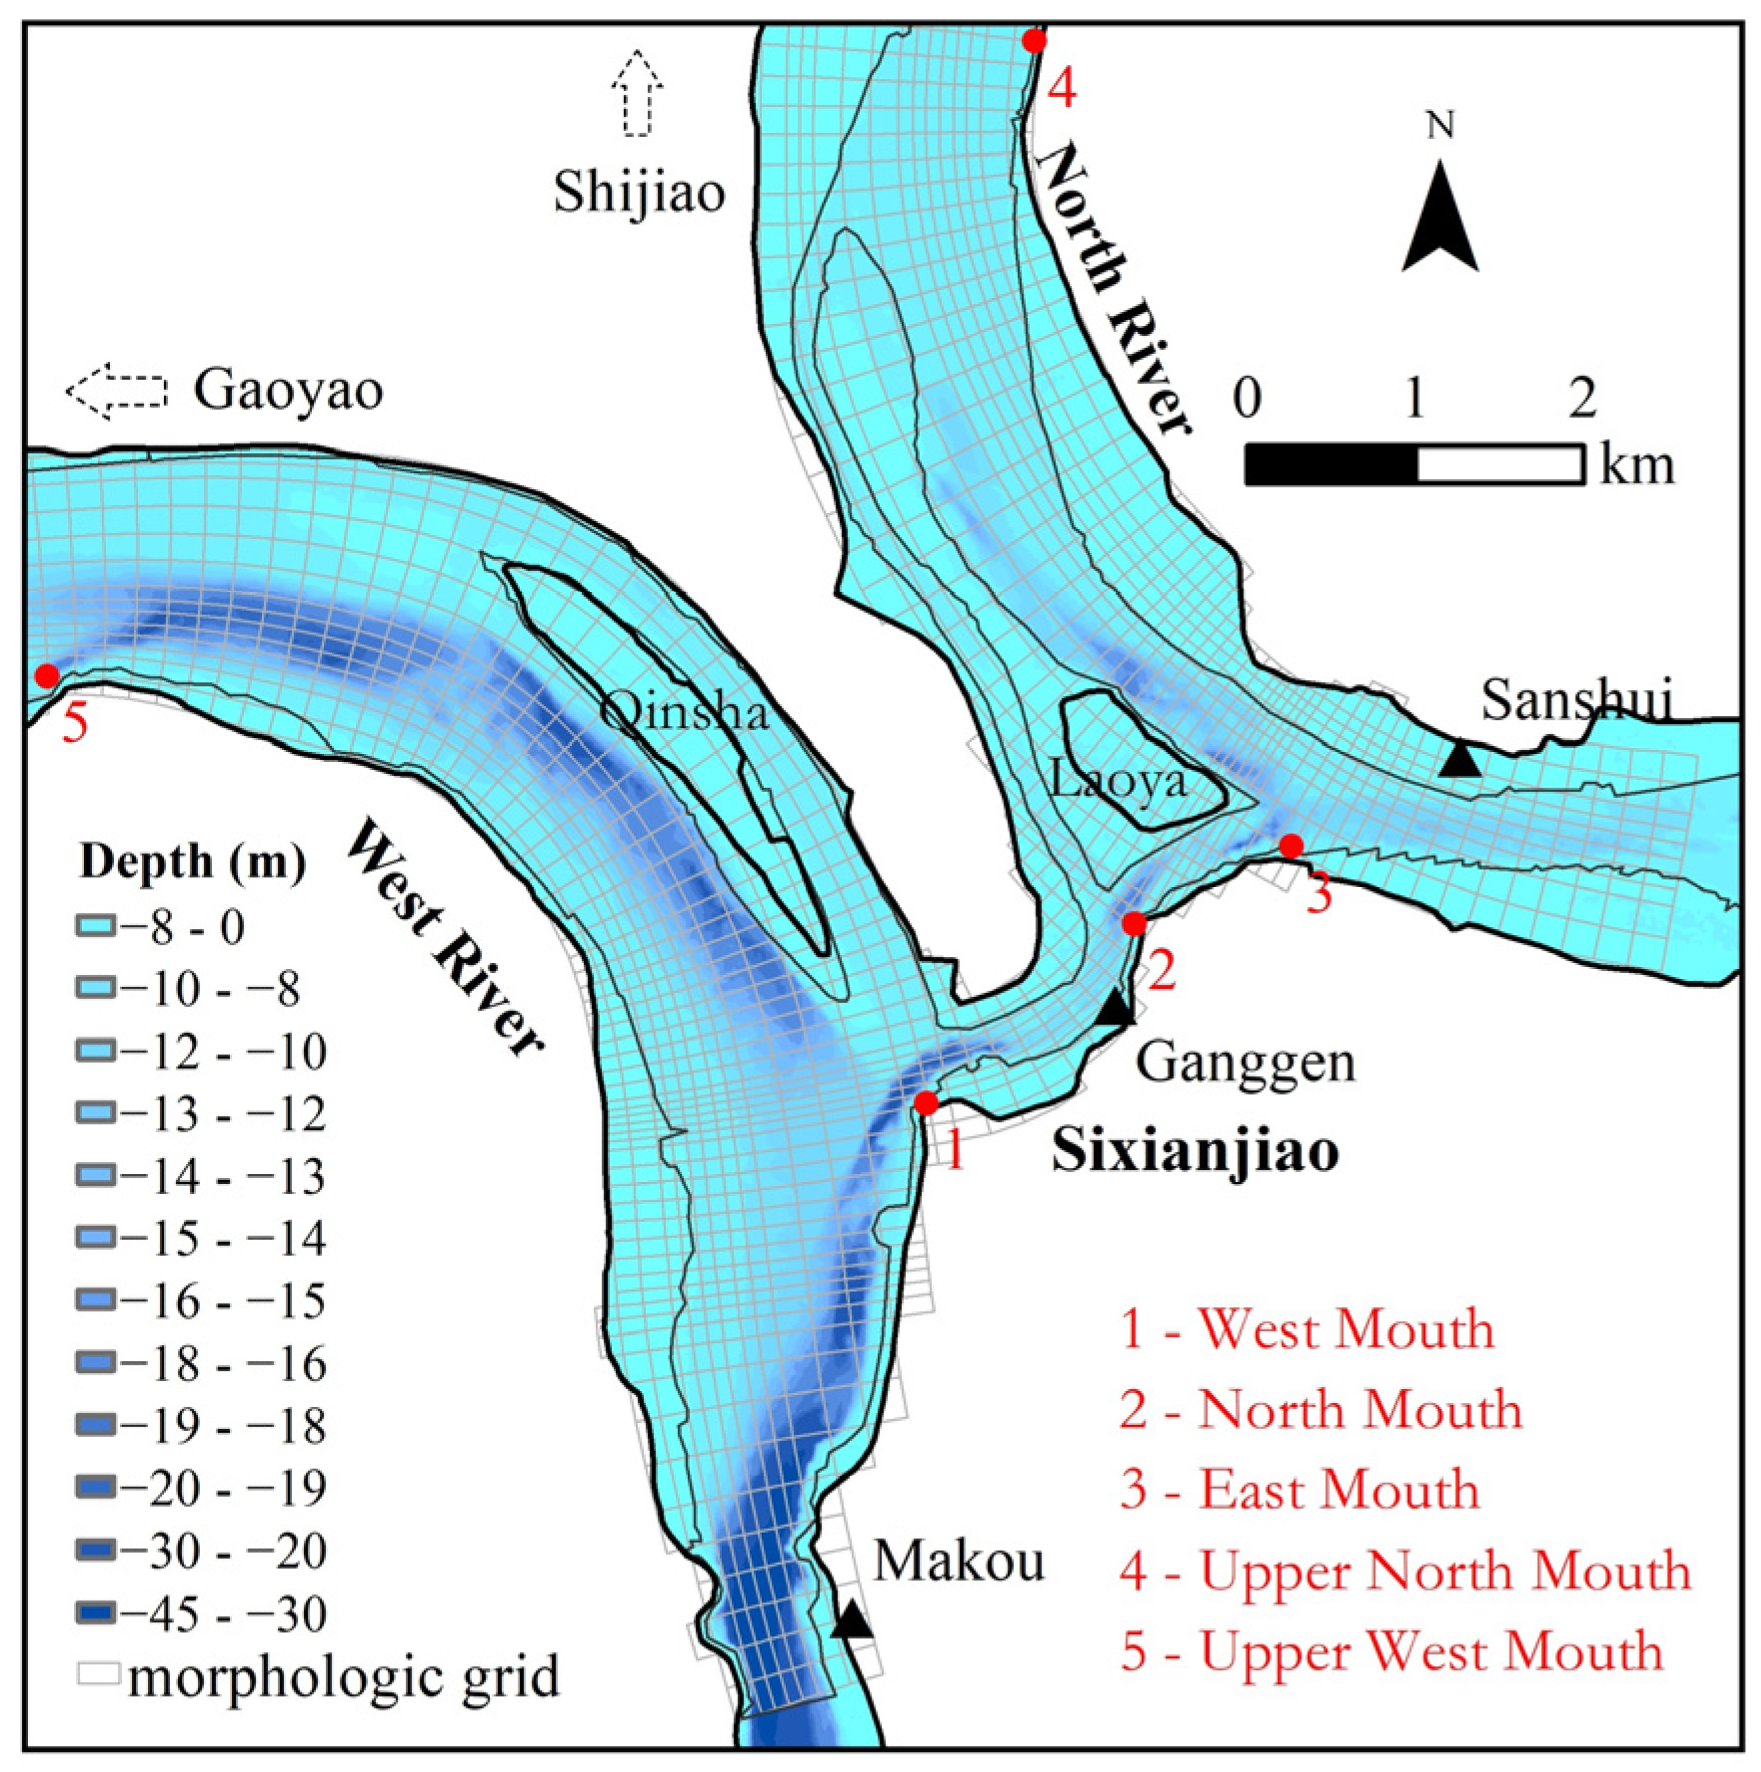
2.1. Study Area

The Pearl River is the second largest river in China. The Pearl River Delta in South China consists of the eastern delta fed by the East River and the northwestern delta fed by the West River and the North River (Figure 1). The annual mean stream flow of the West River, the North River, and the East River are 7124 m3/s, 1465 m3/s, and 719 m3/s, respectively [36]. The SXJ node is at the northwestern apex of the PRD and has a drainage area of 399,830 km2, of which those above Gaoyao in the West River and Shijiao in the North River are 351,535 km2 (99% of the West River basin) and 38,363 km2 (86% of the North River basin), respectively [27]. Gaoyao and Shijiao are 45 km and 52 km away from the SXJ waterway, and are the control stations of the West River and the North River. The SXJ is the first-order exchange node via the SXJ waterway for the West River and the North River and controls the flow and sediment redistribution in the downstream branches. The SXJ waterway is nearly 3 km from the west mouth to the east mouth, and 200 to 500 m wide at water levels of 1.0 to 10 m at the narrower west mouth. The mean depth of the SXJ waterway is −15 m. with two deeper pools near the west mouth (−30 m) and the north mouth (−20 m), between which there is a relatively shallower section of river bed with a depth of 10 m.
The PRD has one of the most complex river networks in the world. Makou and Sanshui are the two control stations after both rivers enter the PRD. Makou is 4 km downstream from the west mouth, while Sanshui is nearly 1 km from the east mouth. The discharge in the downstream West River and North River is further diverted into the river network at the second and third bifurcation nodes, and finally pours into the South China Sea through eight outlets, i.e., Humen, Jiaomen, Hongqimen, Hengmen, Modaomen, Jitimen, Hutiaomen, and Yamen (Figure 1).

2.2. Data Description

The data used in this study are summarized in Table 1. The bathymetry data of the SXJ node were surveyed in 2020 by the Pearl River Hydraulic Research Institute of the Pearl River Water Resources Commission of the Ministry of Water Resources (MWR) and converted into a 5 m grid. The water level and discharge were obtained from the Pearl River Hydraulic Research Institute and the Department Water Resources (DWR) of Guangdong Province. The water level and flow recorded during the flood events in 2005, 2006, 2017, and 2022 at Gaoyao, Shijiao, Makou, and Sanshui were used to calibrate and validate the model and to analyze the flood diversions via the SXJ waterway.
The design flood flow at Gaoyao and Shijiao were officially issued by the DWR of Guangdong Province in 2002 and were used to set the upstream boundary condition for scenario simulation [37]. The flow varies from 37,900 to 57,500 m3/s at Gaoyao and from 11,900 to 20,700 m3/s at Feilaixia/Shijiao, representing the extreme flow for return periods from 5 to 300 years (Table 2). In this study, all elevation and water level data were converted to the China 1985 Yellow Sea Geodatum.

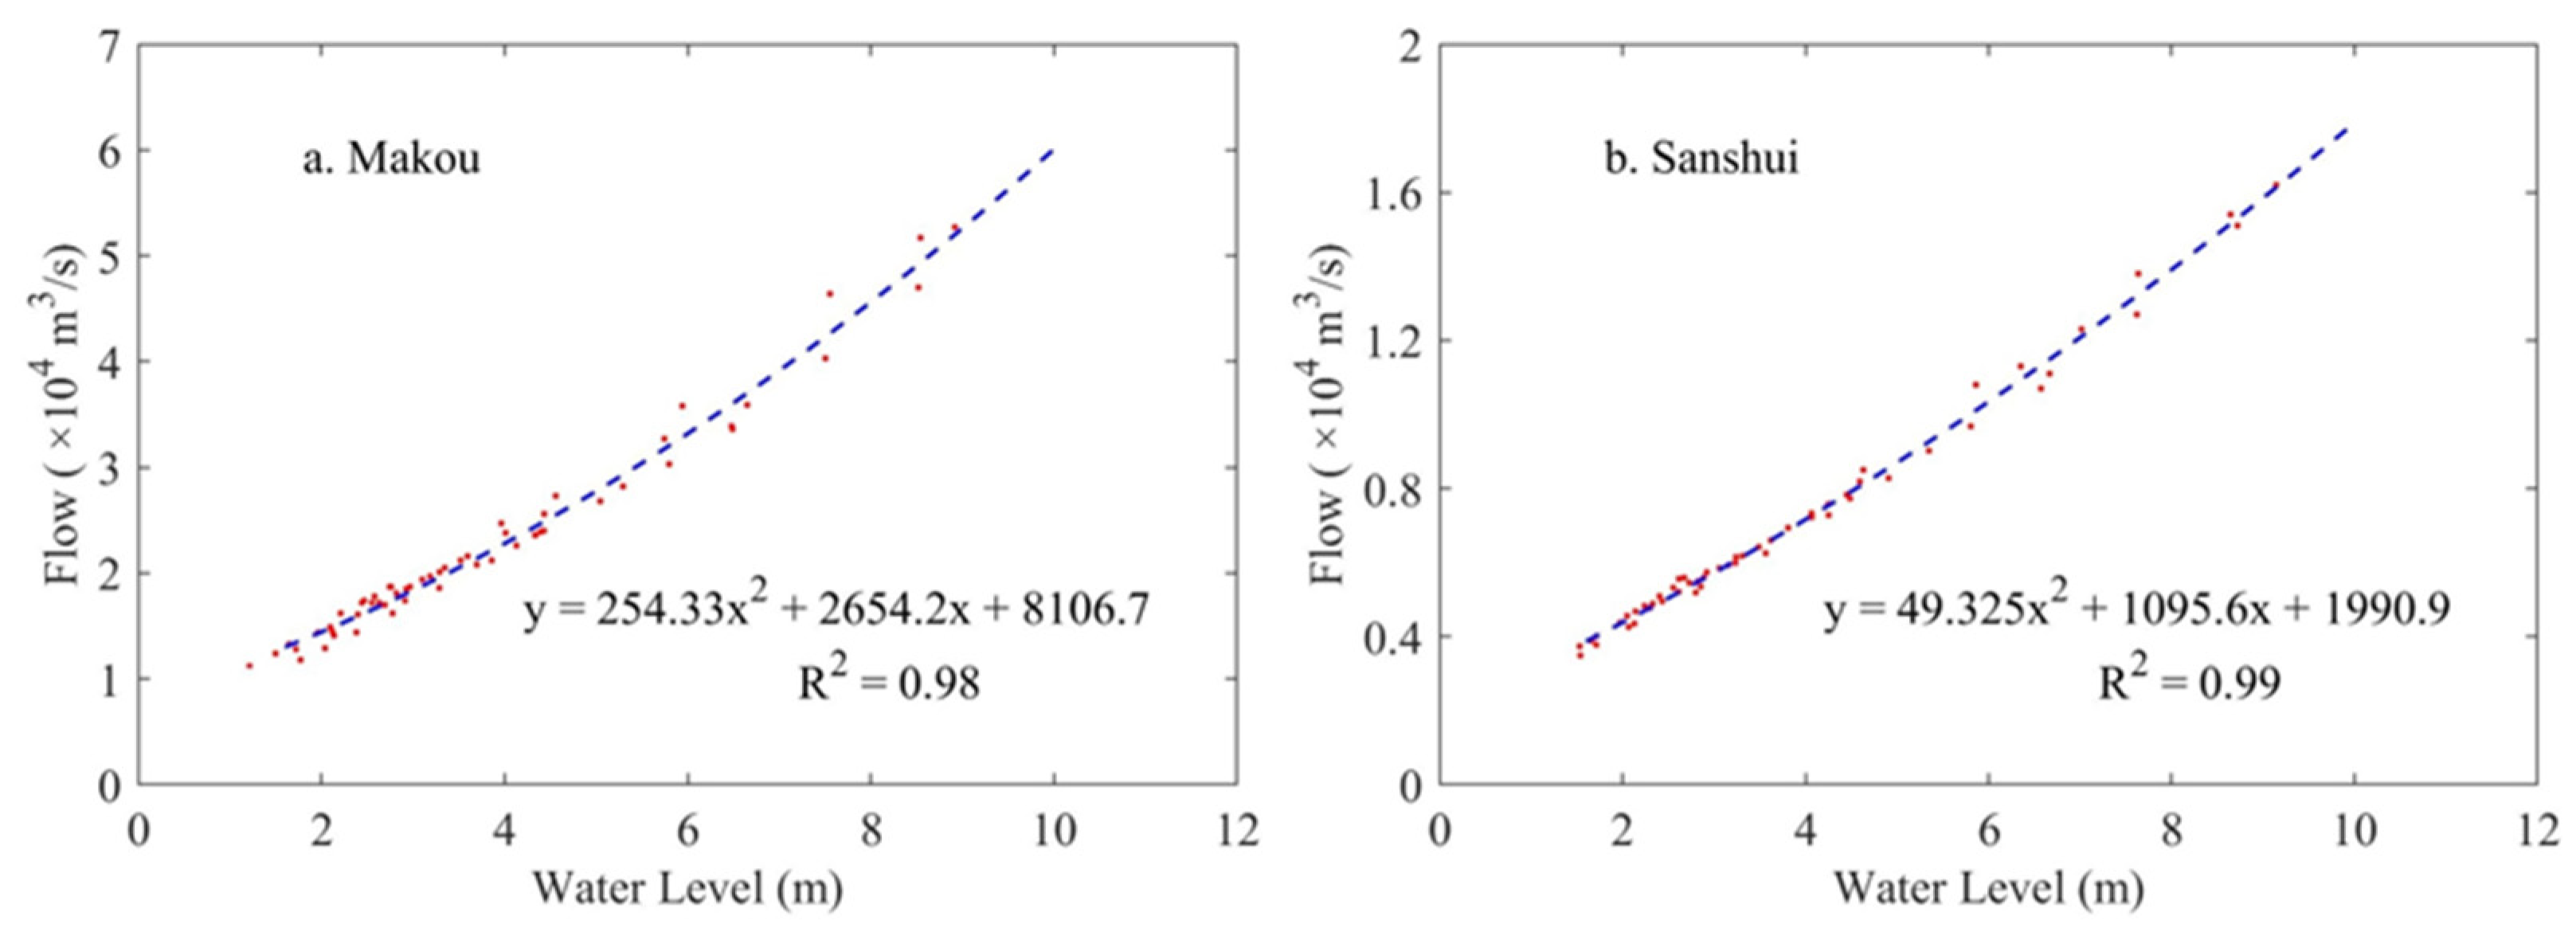
2.3. Historical Floods and Stage-Flow Curves

The 2005 flood occurred from 4 June to 9 July and was dominated by the West River. The peak flow reached 56,300 m3/s at Gaoyao and 13,500 m3/s at Shijiao, which represented a frequency of nearly 0.5% (200a return periods) and 10% (10a return periods), respectively. The flood water was mainly diverted from the West River to the North River via the SXJ waterway. The peak flood levels at Makou and Sanshui reached 9.71 m.
The magnitude of the 2006 flood was much smaller than that of the 2005 flood. The peak water level reached 6.6 m at Makou and Sanshui, and the peak flow at Gaoyao and Shijiao reached 32,000 m3/s and 17,500 m3/s, respectively—equivalent to a 5-year flood in the West River and a 50-year flood in the North River. The flood water was mainly diverted from the North River to the West River.
In order to set flexible boundary conditions downstream, the stage-flow curves at Makou and Sanshui were fitted by a quadratic polynomial with the stage and flow data during the flood events of 2005 and 2006, as shown in Equations (1) and (2):
Q m k = 254.33 Z m k 2 + 2654.2 Z m k + 8106.7
Q s s = 49.325 Z s s 2 + 1095.6 Z s s + 1990.9
where  Z m k  and  Z s s  are the water levels (m) and  Q m k  and  Q s s  are the flow (m3/s) at Makou and Sanshui.
The correlation coefficients between flow and water levels reached 0.99 at Makou and Sanshui (Figure 2a,b). Both fitted equations were relatively stable, since the river beds at Makou and Sanshui were relatively stable after 2007 [34], and could be used to estimate the flood flow with water levels recorded during the flood that occurred in June 2022.

3. Barotropic Modeling of Flow

The methodology section consists of three parts, i.e., the model setup, the model calibration, and validation using historical events and scenario simulations with a total of 121 combinations of incoming flow rates from the West River and the North River.

3.1. Model Setup

The Delft3D model was established with Cartesian grids at the SXJ node using the bathymetry data, which contain the levee height and river bed/beach elevation [38]. The river banks were constrained by the levees. The simulation domain started at upstream Gaoyao in the West River and Shijiao in the North River and ended at downstream Makou in the West River branch and Sanshui in the North River branch (Figure 1). The model consisted of 302 and 45 grid points in the M and N direction, respectively. Overall, there were 14, 9, and 8 grid cells with varying sizes across the West River, the North River and the SXJ waterway. Figure 3 illustrates the model grid over the SXJ node. Some local areas are widened to keep the boundary in line with the river banks. The upstream boundary conditions were set with flow at Gaoyao and Shijiao, and the downstream boundary stations at Makou and Sanshui were set with their stage-flow curves fitted, as shown in Figure 2. The flow was simulated using depth-averaged 2D shallow water equations, which solved the unsteady shallow water equations, since the the depth-averaged 2D simulations were comparable to those of the 3D simulations in several coastal cases [38,39].

3.2. Model Calibration and Validation

The Delft3D model was calibrated using the measured flow and the water levels from 4 June to 10 July 2005. The upstream boundary conditions were the measured flow at Gaoyao and Shijiao. The initial water levels were set for those on 4 June 2005 at Makou and Sanshui. The initial Manning’s roughness coefficients followed the recommended values in the user manual, varying from 0 to 0.04 [38]. The Nash–Sutcliffe efficiency coefficient (NSE) and the MAD between the simulated and observed water levels and discharge at Makou and Sanshui were used to optimize the model parameters. The NSE and MAD were computed using Equations (3) and (4), respectively [40,41].
N S E = N S E = 1 X o b s X m o d 2 X o b s X ¯ o b s 2
M A D = 1 N i = 1 N X o b s X m o d
where  X o b s  is observation for water levels or discharge,  X m o d  is the simulation, and  X ¯ o b s  is the mean value of observations. The performance levels of the model are classified as an excellent fit for NSE > 0.65, a very good fit for 0.5 < NSE < 0.65, a good fit for 0.5 < NSE < 0.5, and a poor fit for NSE < 0.2 [42,43].
The model was validated using the recorded flood data at the four stations of Gaoyao, Shijiao, Makou, and Sanshui from 5 June to 30 June 2022. By keeping the other parameters unchanged, only the upstream flows at Gaoyao and Shijiao were replaced. The water level and discharge at Makou and Sanshui were used to validate the simulated values, since they were not used to derive the stage-flow curves.
There was no regular flow measurement at the Ganggen station in the middle of the SXJ waterway. The only field-measured flow at Ganggen was used to validate the simulated flood diversion during the 2017 flood from 29 June to 19 July.

3.3. Scenario Simulations

A series of model runs were conducted, with total of 121 combinations for the upstream boundary conditions of steady flow (Table 3) based on the design flood flow issued by the Department of Water Resources of Guangdong Province in 2002 (Table 2). The incoming flow rates varied from 10,000 m3/s to 60,000 m3/s with an interval of 5000 m3/s at Gaoyao in the West River and from 2000 m3/s to 22,000 m3/s with an interval of 2000 m3/s at Shijiao in the North River. The downstream boundary conditions were set with the stage-flow curves of Equation (1) at Makou and Equation (2) at Sanshui (Figure 2). The bed roughness was set as a uniform Manning value of 0.035 m−1/3s in all runs. A time step of 3 s was used to keep the steady flow stable.

4. Results

This section presents the results for model calibration and validation, three typical flood events simulations, and scenario simulations for 121 combinations of incoming flood flow from West River and North River.

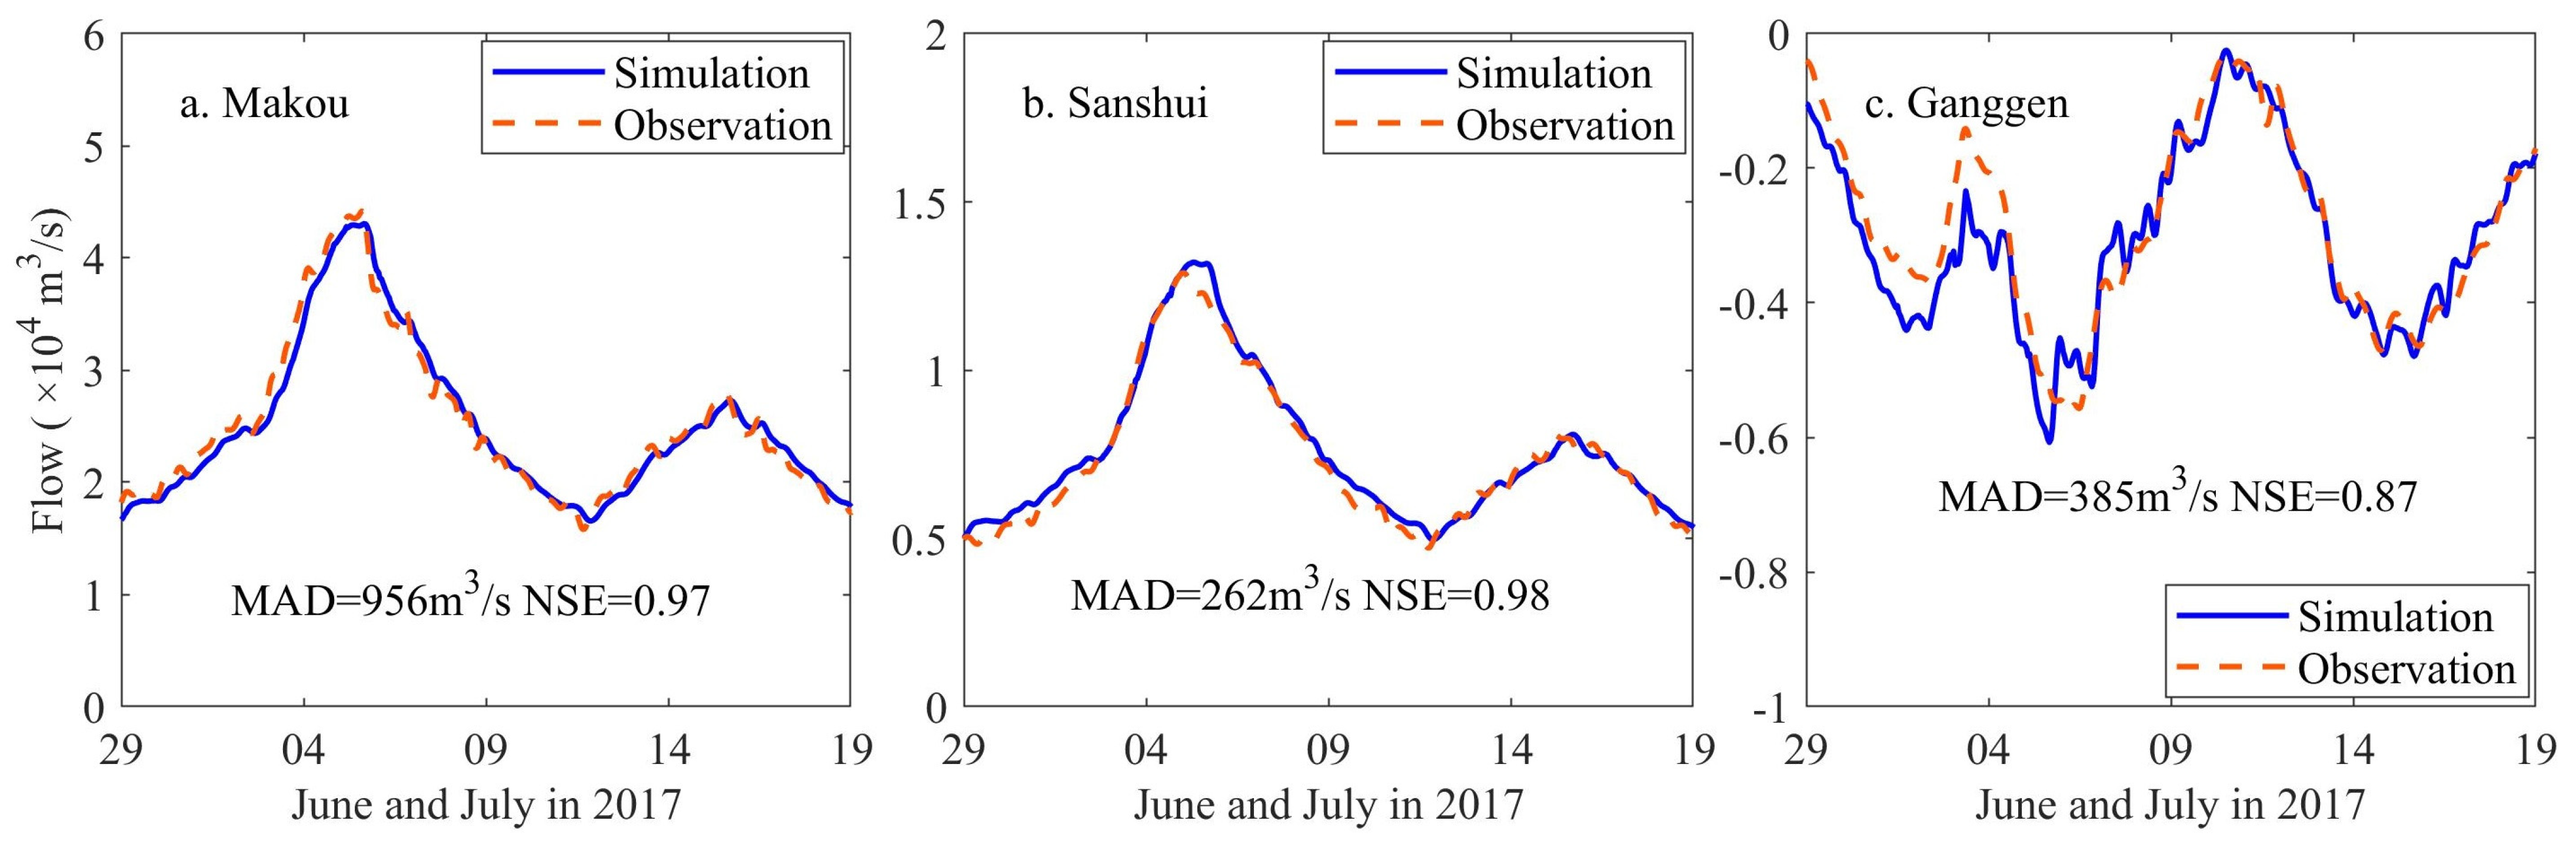
4.1. Model Calibration and Validation

For the model calibration, the simulated water levels and discharge agreed well with the in situ observations at Makou and Sanshui during the 2005 flood (Figure 4). The NSEs of water levels and discharge are 0.99 at Makou and Sanshui, and the MADs of water levels and discharge are 0.19 m and 0.14 m, 1262 m3/s and 425 m3/s, respectively. The relative differences (RMAD) of the simulated discharge against the mean flow were 5.2% and 5.6%.
For model validation, the simulated water levels and discharge during the 2022 flood matched well with in situ observations. The NSEs of water levels and discharge were 0.94 and 0.97, 0.96, and 0.93 at Makou and Sanshui, and the MADs were 0.26 m and 0.17 m, 983 m3/s (RMAD = 2.8%) and 627 m3/s (RMAD = 5.8%), respectively (Figure 5).
During the 2017 flood, the discharge at Makou (NSE = 0.97, MAD = 956 m3/s, RMAD = 3.9%) and Sanshui (NSE = 0.98, MAD = 262 m3/s, RMAD = 3.6%) were also successfully simulated (Figure 6), and the simulated diversion flow via the SXJ waterway was in agreement with the in situ observations by NSE of 0.87 and MAD of 385 m3/s (RMAD = 13.9%).
The above results for model calibration and validation indicate that the Delft3D model can be used to simulate the flood diversion and discharges at the SXJ node under different scenarios of incoming flood flow from the West River and the North River.

4.2. Flood Event Simulation

Three typical flood events in 2005 (a single flood wave), 2006 (two and three flood waves in the North River and the West River), and 2022 (three flood waves in both rivers) were simulated to illustrate the flood diversion via the SXJ waterway under different incoming flood waves at Gaoyao from the West River and at Shijiao from the North River (Figure 7, Figure 8 and Figure 9).

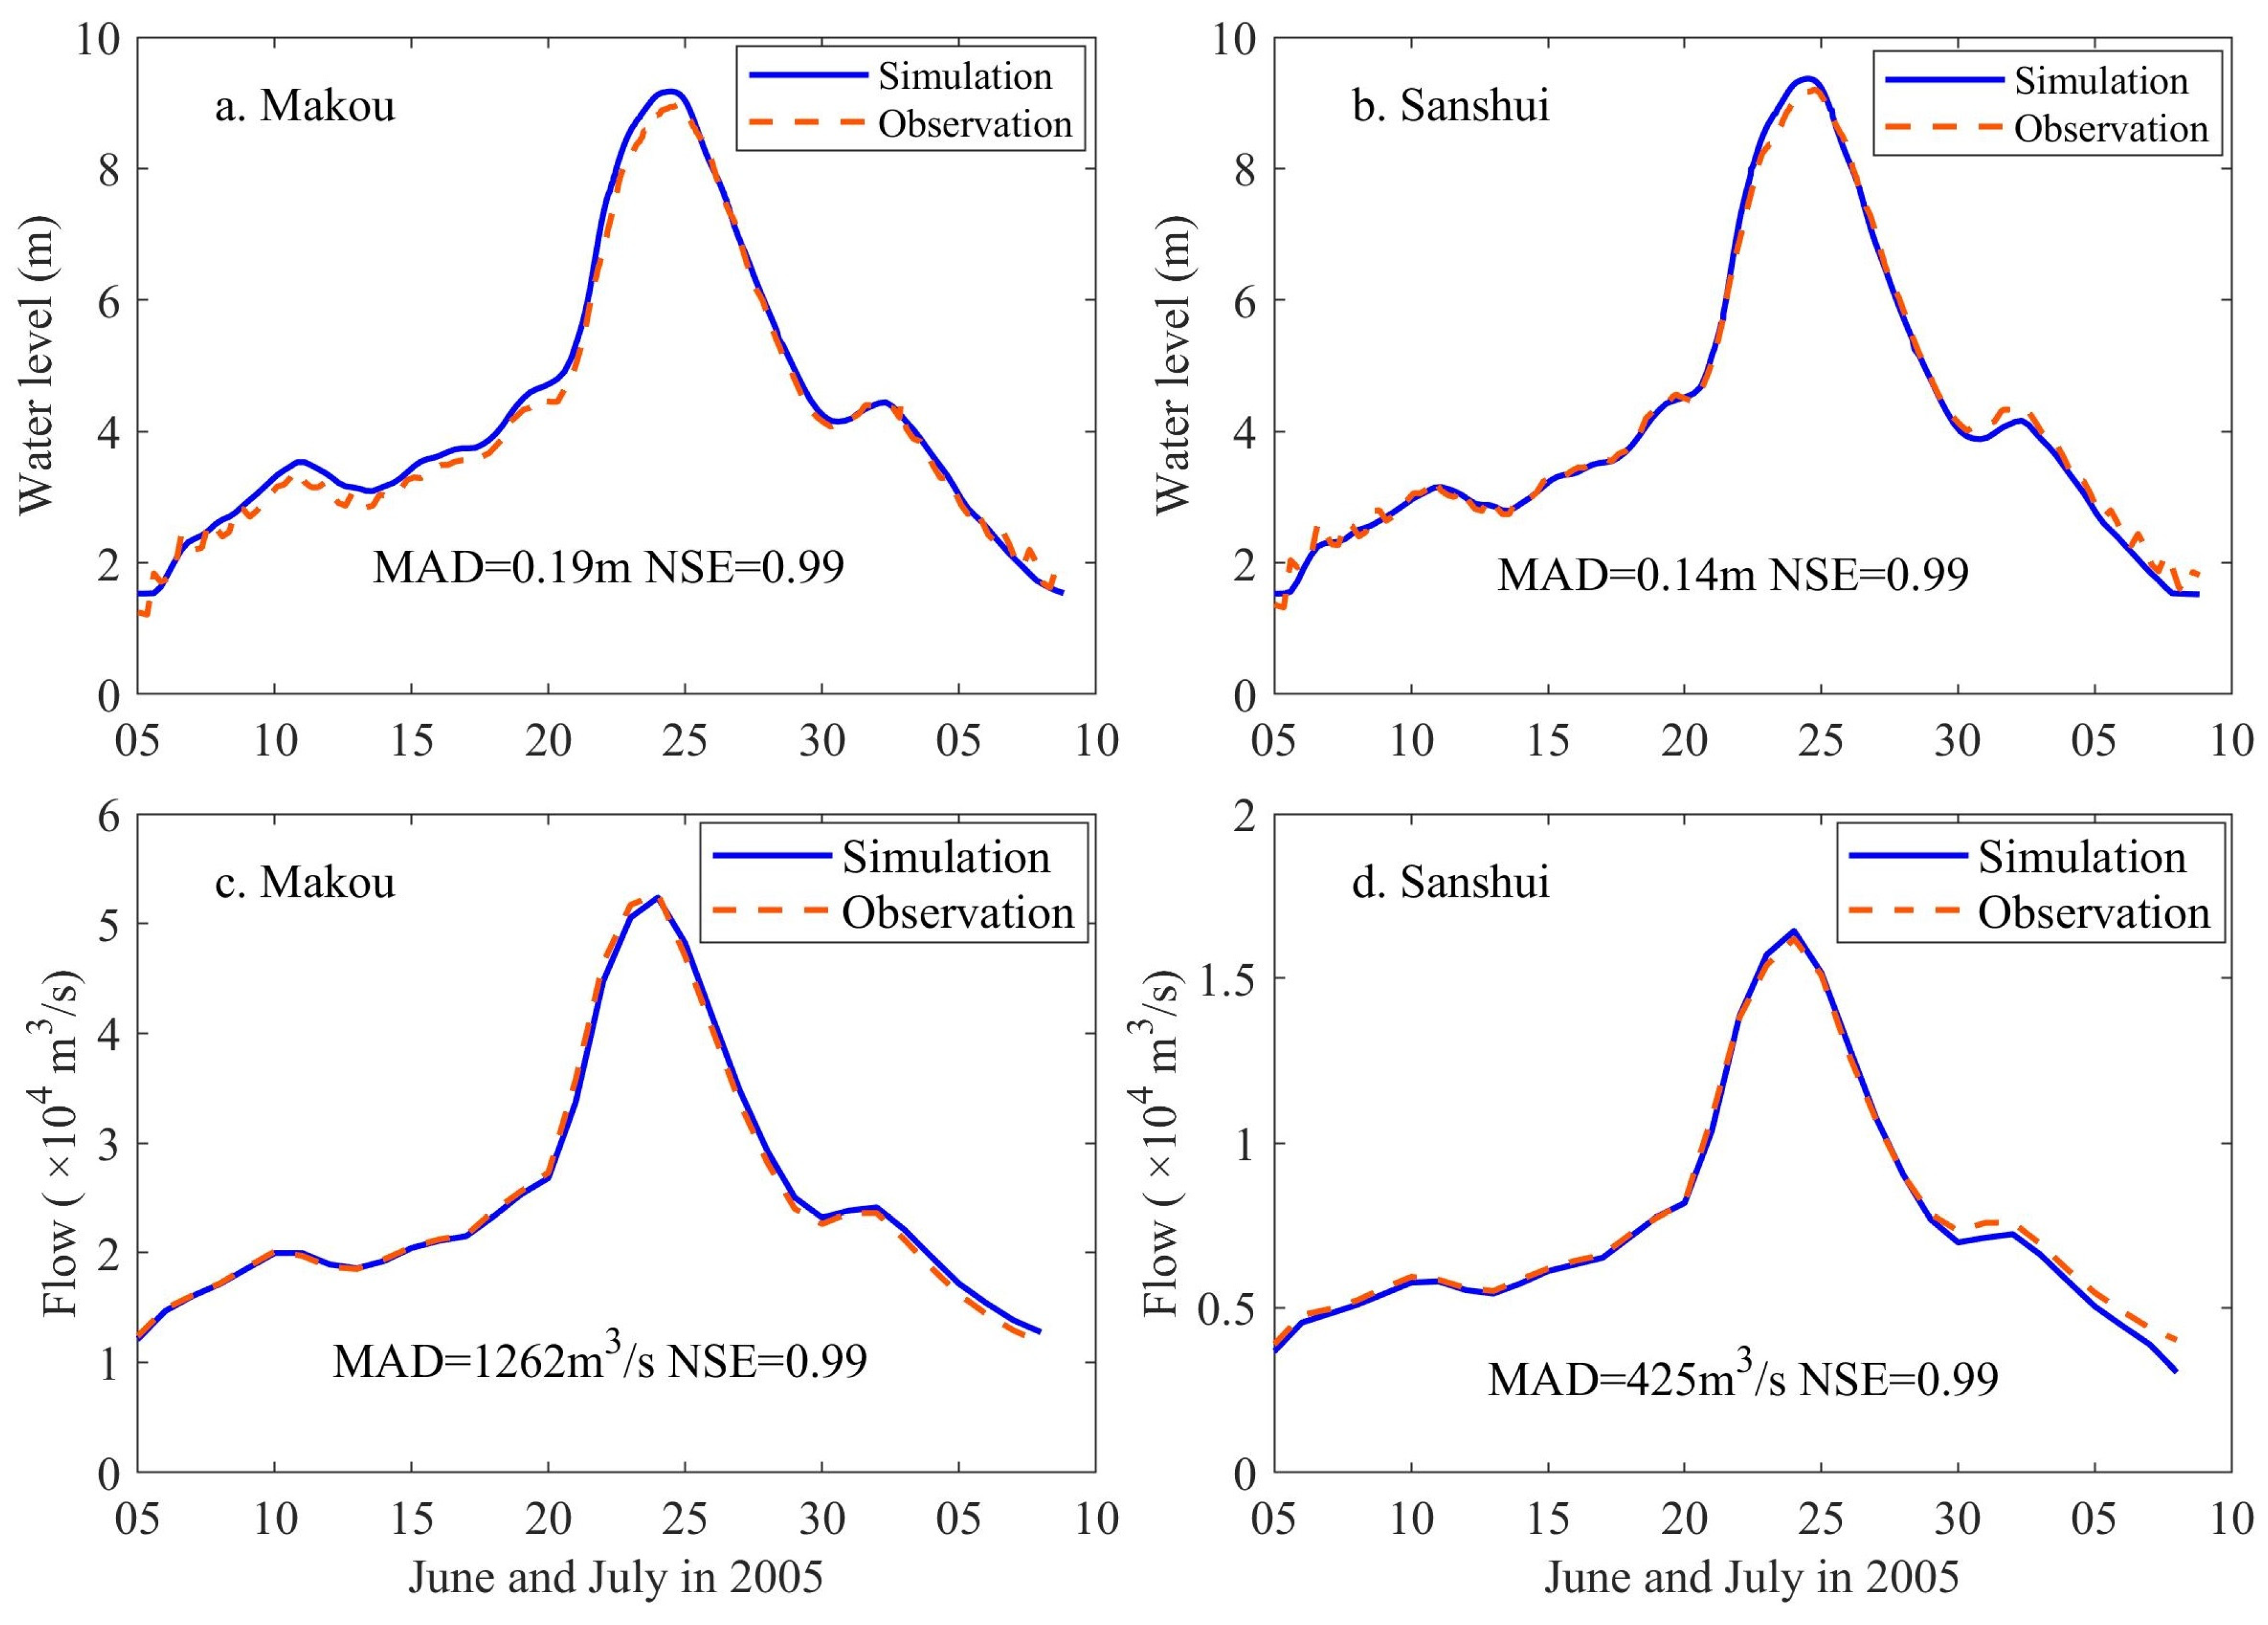
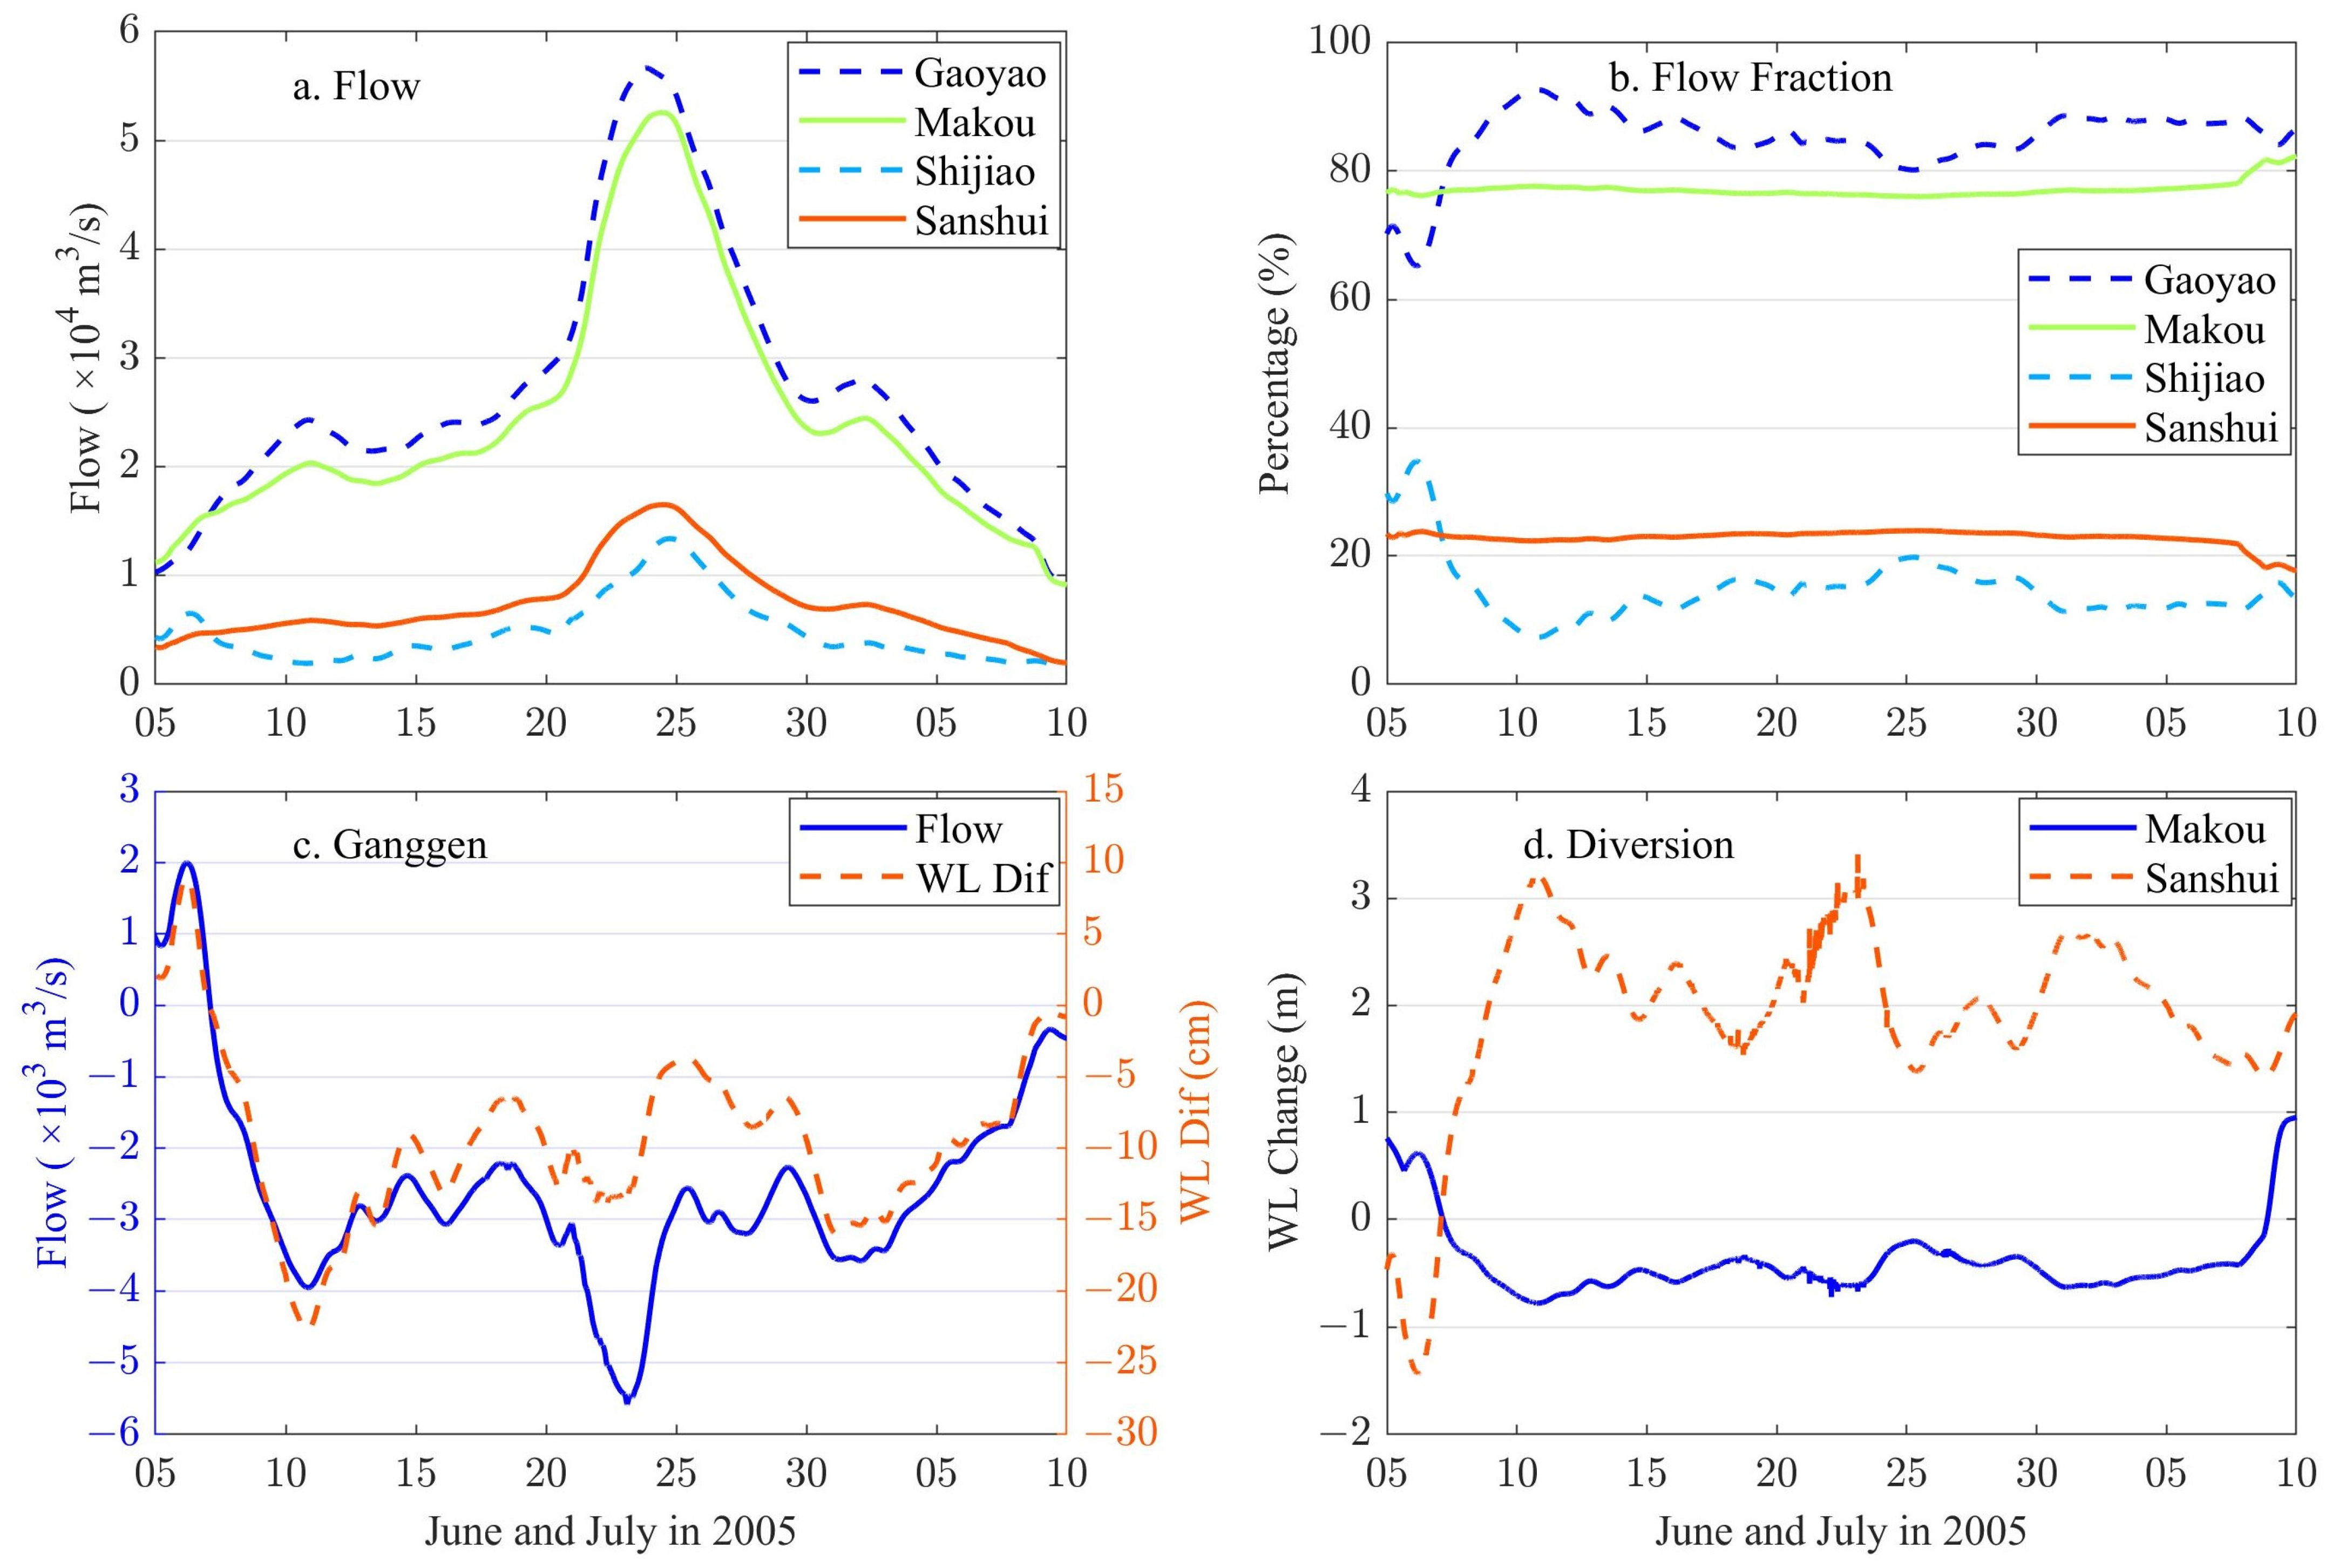
4.2.1. Flood Event in 2005

The flood event that occurred in 2005 was dominated by a single flood wave from the West River (Figure 7a), where the incoming flow fraction at Gaoyao (Gaoyao/[Gaoyao + Shijiao]) varied from 80% to 93% from 10 June to 5 July (Figure 7b). Accordingly, the water levels at the west mouth of the SXJ waterway were 0.04 to 0.23 m higher than at its north mouth, resulting in flood diversion from the West River to the North River via the SXJ waterway with a peak flow of −5730 m3/s (Figure 7c). Here, the positive flow was defined as it flowed from the North River to the West River, following the historical flow diversion status [27]. With flood diversion, the discharge fractions at Makou (Makou/[Makou+Sanshui]) and Sanshui were quite stable through the event, at around 77.2% and 22.8%, respectively (Figure 7b). The return periods of peak flow were 1:200a at Gaoyao from the West River and 1:10a at Shijiao from the North River and changed to 1:60a and 1:30a, respectively, after flood diversion (Table 4). Without flood diversion, the water levels at Makou would increase by 0.7 m (Figure 7d), i.e., flood diversion reduced the peak water level at Makou by up to 0.7 m, and the peak flow reduced from 56,667 m3/s (1:200a) to 52,601 m3/s (1:60a) (Table 4). The flood diversion synchronized the downstream discharge at Makou and Sanshui, although the incoming flood waves at Gaoyao from the West River formed earlier than at Shijiao from the North River (Figure 7a). The average rate of flow diversion during the flood from 6 June to 10 July was −2400 m3/s (West -> North), or a total volume by −7.27 km3, which was over half of the annual mean total water diversion (−14.20 km3) from 1993 to 2005 [27,34].

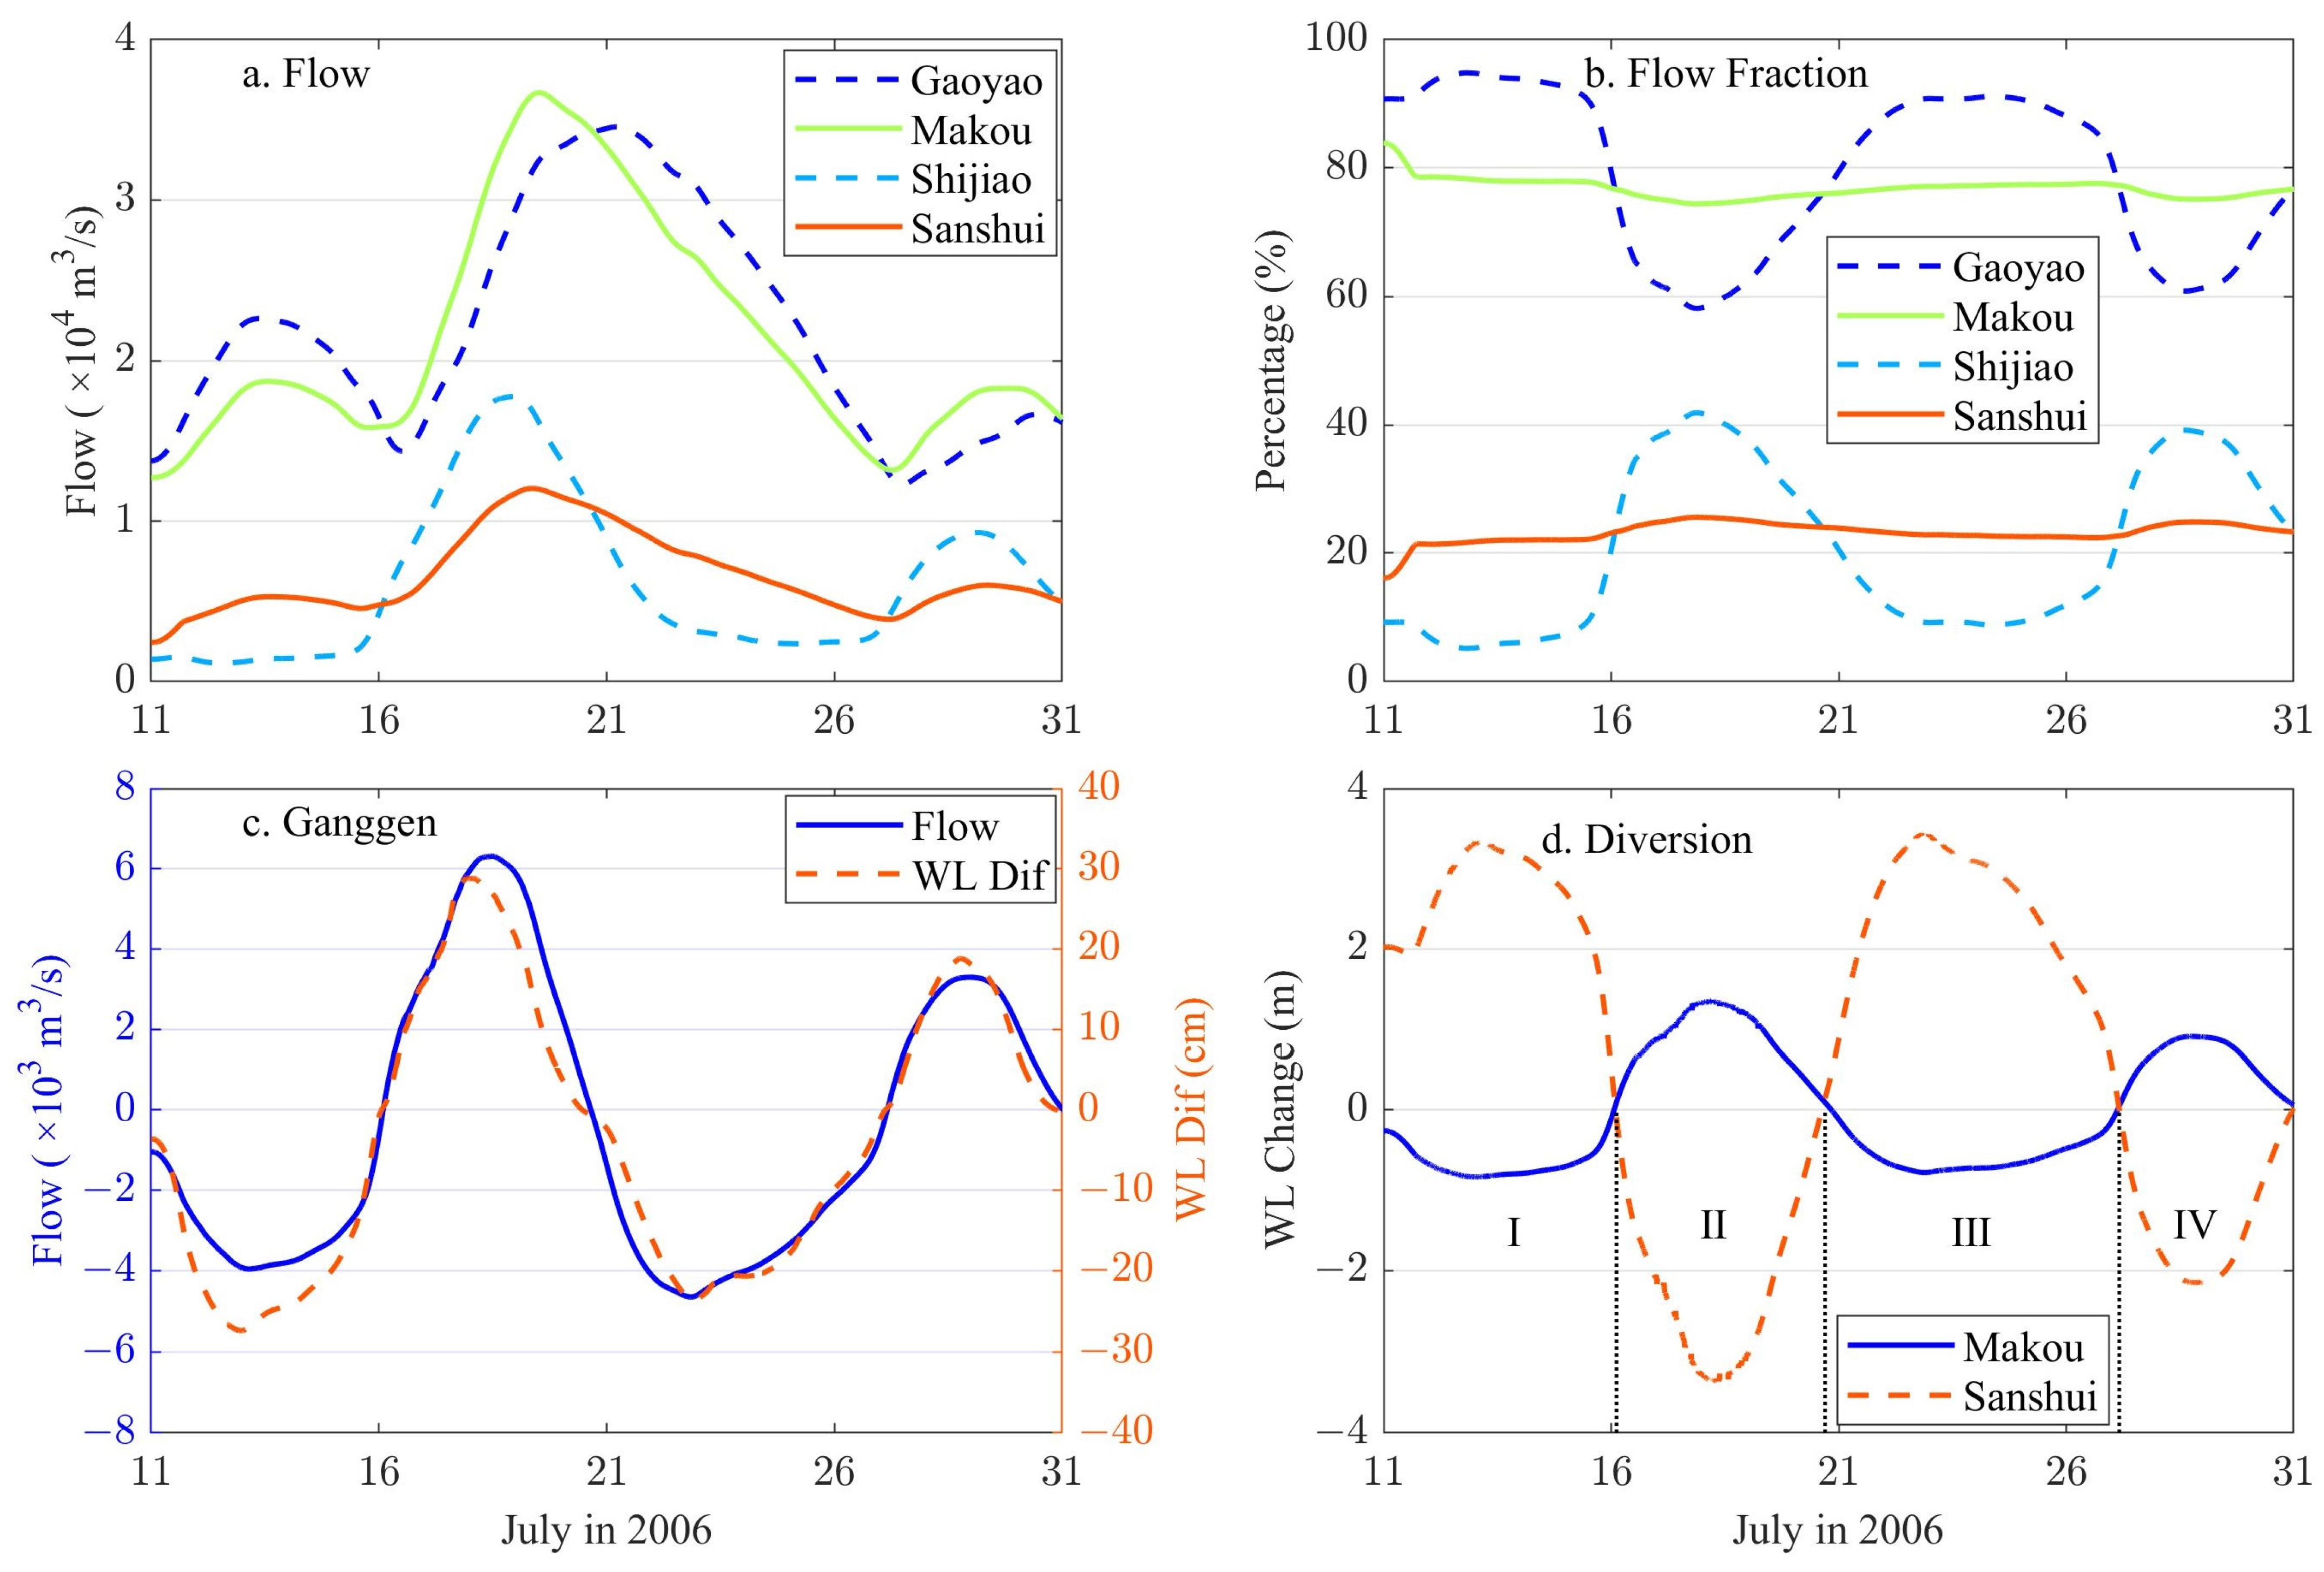
4.2.2. Flood Event in 2006

The flood event in July 2006 consisted of three flood waves in the West River and two flood waves in the North River (Figure 8a), and the flood diversion in the SXJ waterway was alternatively controlled by the incoming flow from the West River and the North River and was divided into four phases (Figure 8d). The return periods of peak flow at Gaoyao and Shijiao were 1:2a and 1:60a and changed to nearly 1:5a after flood diversion (Table 4). In phase I from 11 July to 16 July, the incoming flow was dominated by the West River at Gaoyao, whose flow fraction varied by around 94% (Figure 8b), and the peak water level at the north mouth was 28 cm lower than that at the west mouth, resulting in a peak flood diversion of −4000 m3/s from the West River to the North River (Figure 8c), a peak water-level reduction of 0.83 m at Makou, and an increase of 3.29 m at Sanshui (Figure 8d).
In phase II from 16 July to 20 July, the water levels at the SXJ node were dominated by the incoming flow from the North River at Shijiao, whose maximum flow fraction increased from 7% to 42%, while it decreased from 94% to 58% at Gaoyao from the West River (Figure 8b). The peak water level at the north mouth was 0.29 m higher than the peak water level at the west mouth, resulting in a peak flood diversion of 6300 m3/s from the North River to the West River (Figure 8c), a peak water-level reduction of 3.35 m at Sanshui, and an increase of 1.34 m at Makou (Figure 8d). The peak flow rate (return periods) reduced from 18,245 m3/s (1:60a) to 12,166 m3/s (1:5a) at Sanshui (Table 4).
In phase III from 20 July to 27 July, the flood flow from the North River retreated much faster than the flood flow from the West River, and the incoming flow was dominated by West River at Gaoyao, where the flow fraction increased from 58% to 91%, while it decreased from 42% to 9% at Shijiao. The peak water level at the north mouth of the SXJ waterway was 0.24 m lower than the peak water level at the west mouth, resulting in a peak flood diversion of −4600 m3/s from the West River to the North River (Figure 8c), a peak water level reduction of 0.75 m at Makou, and an increase of 3.4 m at Sanshui (Figure 8d).
In phase IV from 27 July to 31 July, the water levels at the SXJ node were again dominated by the flood wave from the North River at Shijiao, whose maximum flow fraction increased from 9% to 40%, while it decreased from 91% to 60% at Gaoyao (Figure 8b). The peak water level at the north mouth was 0.18 m higher than the peak water level at the west mouth, resulting in a peak flood diversion of 3300 m3/s from the North River to the West River (Figure 8c), a peak water level reduction of 2.2 m at Sanshui, and an increase of 0.9 m at Makou (Figure 8d). After flood diversion, the discharge fractions at Makou and Sanshui were quite stable—around 76.8% and 23.2%, respectively (Figure 7b).
Moreover, the asynchronous flood waves from the two rivers were synchronized by flood diversion in the downstream discharge at Makou and Sanshui (Figure 8a). The average diversion rate during the flood from 11 to 31 July was −448 m3/s (West -> North).

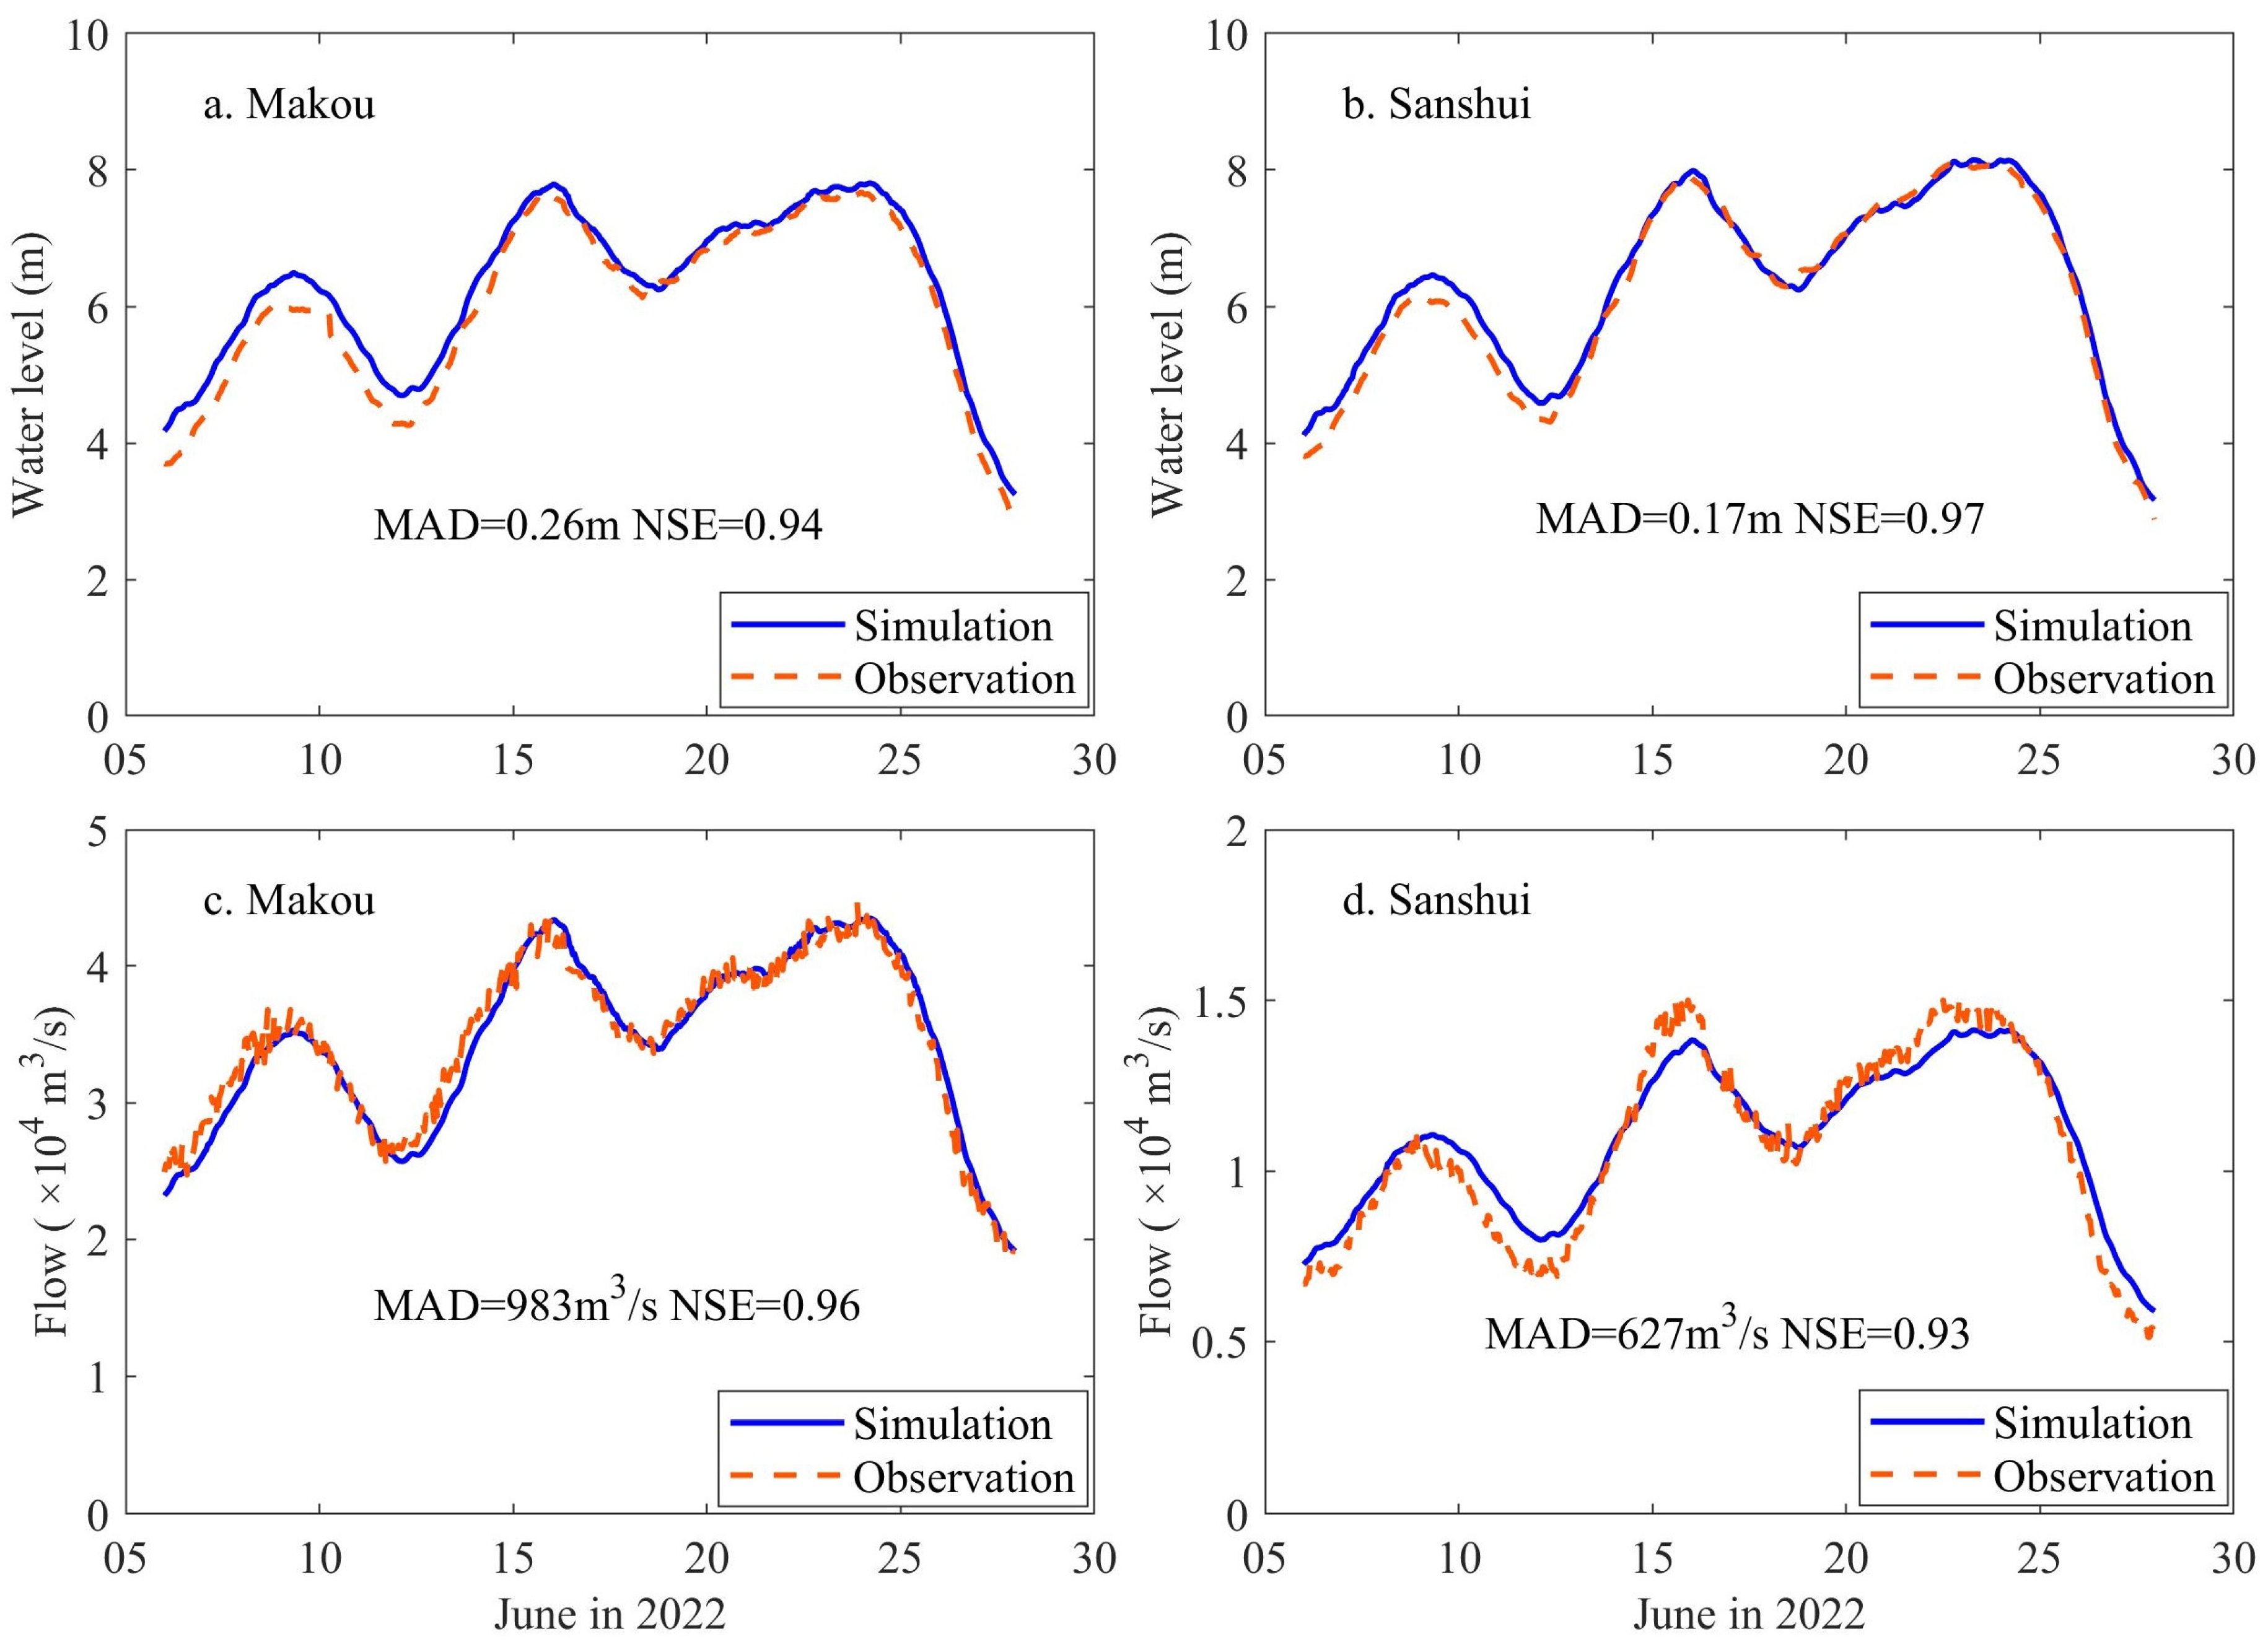
4.2.3. Flood Event in 2022

The flood event in 2022 consisted of three flood waves in both rivers (Figure 9a), and the flood diversions in the SXJ waterway were alternatively controlled by the incoming flows from the West River and the North River and were divided into three phases (Figure 9d). In phase I from 5 June to 14 June, the water levels at the SXJ node were dominated by the incoming flow from the West River at Gaoyao, where the flow fraction varied by around 81% (Figure 9b), and the peak water level at the north mouth of the SXJ waterway was nearly 0.05 m lower than the peak water level at the west mouth, resulting in a peak flood diversion of −2100 m3/s from the West River to the North River (Figure 9c), a peak water level reduction of 0.30 m at Makou, and an increase of 1.46 m at Sanshui (Figure 9d).
In phase II from 14 June to 19 June, the averages of the incoming flow fraction at Gaoyao from the West River and at Shijiao from the North River were 75.6% and 24.4% (Figure 9b), respectively, which presented a near equilibrium state with similar water levels at the north and west mouths of the SXJ waterway (Figure 9c). The flood diversion switched direction three times and had an average flow rate of only −182 m3/s (Figure 9c).
In phase III from June 19 to 26, the water levels at the SXJ node were dominated by the incoming flow from the North River at Shijiao, where the maximum flow fraction increased from 24% to 35%, while it decreased from 76% to 65% at Gaoyao (Figure 9b). The peak water level at the north mouth of the SXJ waterway was 0.16 m higher than the peak water level at the west mouth, resulting in a peak flood diversion of 5700 m3/s from the North River to the West River (Figure 9c) and a peak water level reduction at Sanshui of 2.8 m, while the peak water level at Makou increased by 1.1 m due to flood diversion (Figure 8d). With flood diversion, the discharge fractions at Makou and Sanshui were nearly constant at around 75.6% and 24.4%, respectively (Figure 9b), and the return periods of peak flow at Shijiao reduced from 1:100a to 1:10a (Table 4). The average rate of flood diversion from 5 June to 30 June was 574 m3/s (North ->West).
In summary, the SXJ waterway played a significant role in mutually diverting flood water from (to) the West River and the North River. The flood diversion synchronized the downstream discharge at Makou and Sanshui, although the flood waves from both rivers were asynchronous. The diversion rates were controlled by the water level differences at the west and north mouths of the SXJ waterway. The event–mean diversion rates were −2512 m3/s (West -> North) in 2005, −448 m3/s (West -> North) in 2006, −2921 m3/s (West -> North) in 2017, and 574 m3/s (North -> West) in 2022. The discharge fraction at Makou and Sanshui in the downstream branches remained nearly constant during those floods after flood diversion (Table 4).

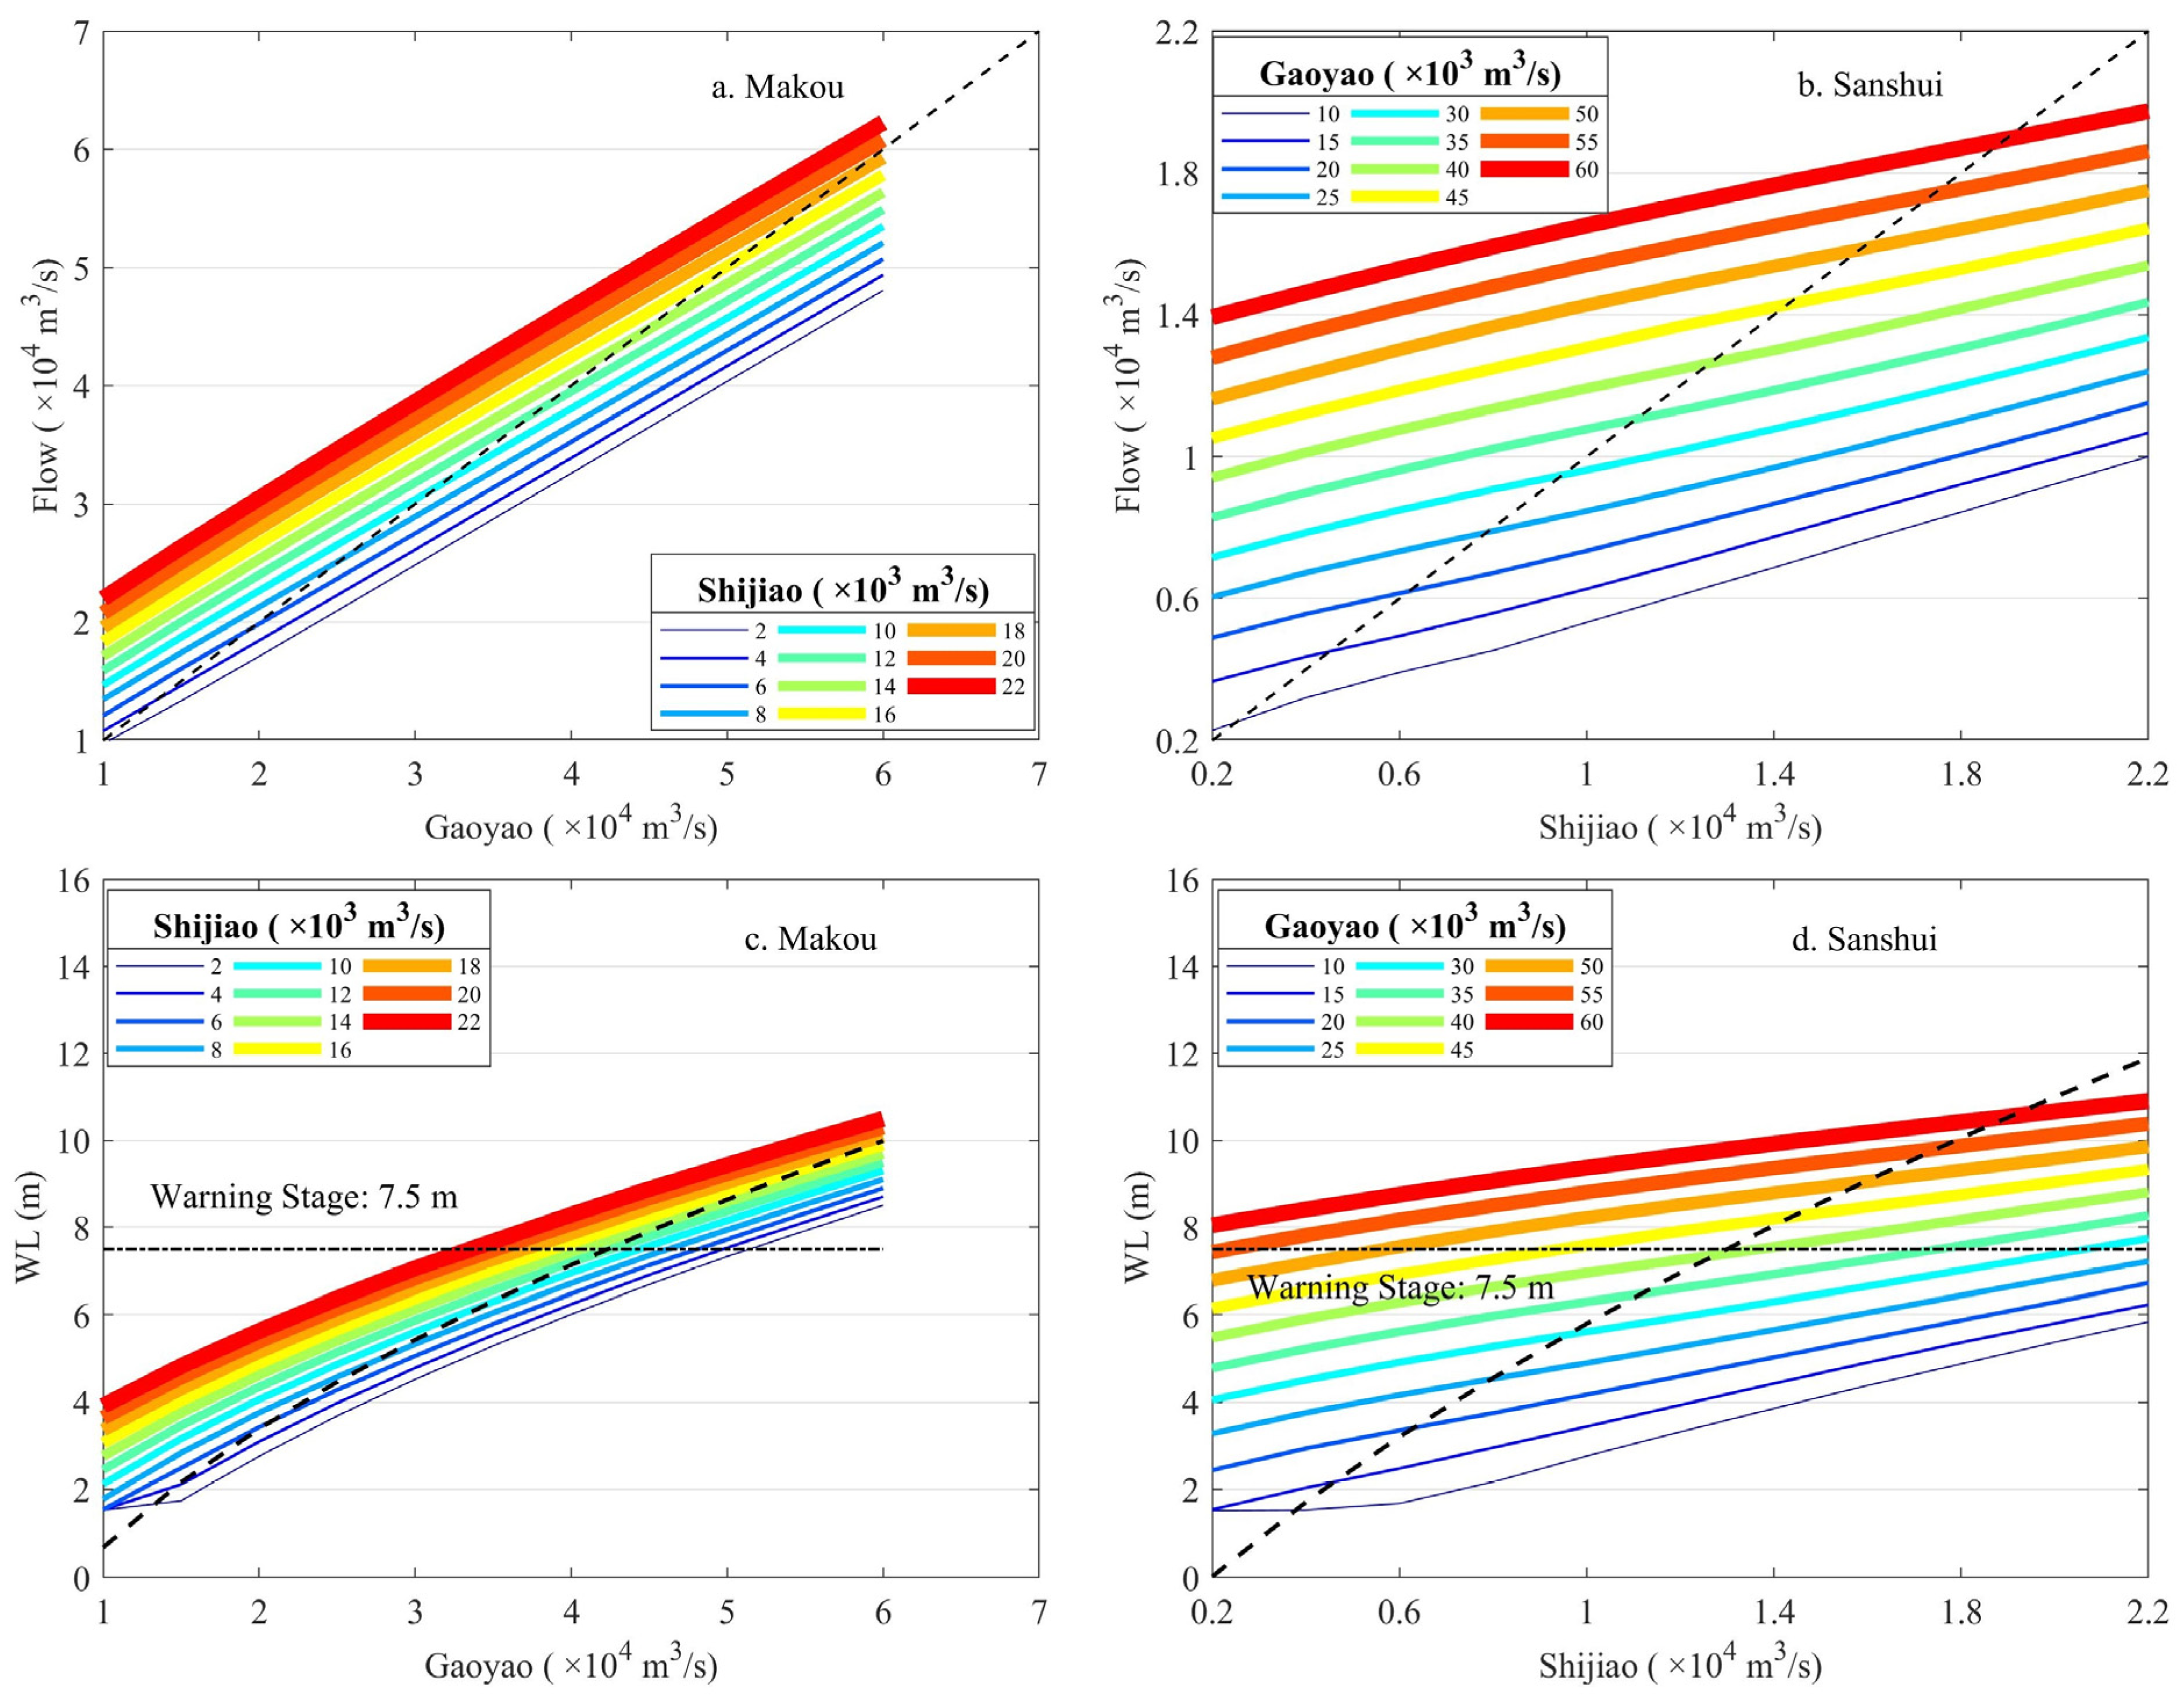
4.3. Flood Scenario Simulation

A total of 121 combinations of steady flow representing various upstream flow conditions were applied to simulate the flood diversion and discharge division at the SXJ node (Table 3 and Figure 10). The flood diversion was driven by the water level difference between the west mouth and the north mouth of the SXJ waterway, where the water levels were mainly determined by the incoming flow from the West River and the North River and modulated by the flow diversion via the SXJ waterway (Figure 10a). Under different incoming flow rates, a flow fraction threshold of 75.9% (Gaoyao/[Gaoyao + Shijiao]) exists when there is a common flood over 20,000 m3/s at Gaoyao from the West River (Figure 11a). Above this threshold or below the dashed line in Figure 10a,b, the water level at the north mouth is lower than the water level at the west mouth (Figure 10a), and the flood water will divert from the West River to the North River (W->N) with a maximum flow rate of –11,900 m3/s (Figure 10b), reducing the peak water level by up to 1.48 m at Makou and escalating the peak water level by up to 8.02 m at Sanshui (Figure 10c). Below this threshold or above the dashed line in Figure 10a,b, the water level at the north mouth is higher than the water level at the west mouth (Figure 10a), and the flood water will divert from the North River to the West River (N->W) with a maximum flow rate of 11,990 m3/s (Figure 10b), reducing the peak water level by up to 6.63 m at Sanshui and escalating the peak water level by up to 2.95 m at Makou (Figure 10c). After the flood diversion, the division fraction of discharge at Makou (Makou/[Makou + Sanshui]) varied from 74.3% to 77.6% (Figure 10d). Even under different incoming flow rates from both rivers, the discharge fractions at Makou (or Sanshui) remained relatively stable during a flood and varied by around a mean value of 76.6% when the discharge rate (water level) at Makou was over 20 000 m3/s (3.0 m) and when the tidal force on flow diversion became secondary (Figure 11b).
The SXJ waterway plays a crucial role on diverting flood water from either the North River or the West River and significantly reduces the peak water levels at Makou and Sanshui (Figure 12). The diversion flow is up to 55% of the North River’s peak flow and can reduce the peak water level by up to 6.63 m at Sanshui. In contrast, the diversion flow is only 20% of the West River’s peak flow and reduces the peak water level by 1.48 m at Makou (Figure 10b,c). In other words, the flood diversion has larger influence on the North River than on the West River. Meanwhile, the flood diversion significantly reduces the water level difference and increases the hydraulic equilibrium between the two rivers.

5. Discussion

In this section we discuss the driving forces of flood diversion and the hydraulic equilibrium modulated by the H-shaped compound river node and explore the influence of mutual flood diversion on peak water levels and discharge fractions at and beyond the SXJ node.

5.1. Diversion Force and Hydraulic Equilibrium

The SXJ waterway connects the West River and the North River and forms a unique H-shaped compound river node, which redistributes water/mass (flood hazards) to the downstream river network and often creates a hydraulic unstable state [44].
The H-shaped compound river node is usually in a near-hydraulic equilibrium modulated by flow diversion via the SXJ waterway, which acts like a seesaw driven by the hydraulic head (water levels) between its north mouth and west mouth; it is often disrupted by the unbalanced upstream flood waves and the asynchronous tidal force in downstream branches [29,44] Here, we discuss only the diversion force during flood season when the flood waves from both rivers are the main driving forces for flood diversion via the lateral SXJ waterway and the asynchronous tidal force becomes secondary or even negligible with high water levels at the SXJ river node [45].
During a single-wave flood, the flood diversion is determined by the relative magnitude of the upstream flood waves from the West River and the North River (Figure 7). During the 2005 flood, the relatively larger flood wave from the West River raised the water level up to 4 m higher at the west mouth than at the north mouth if there was no flood diversion (Figure 13a). Such a large water level difference dramatically disrupts the hydraulic equilibrium and compels the SXJ river node into an unstable state, which might cause a levee breach or a river avulsion [44]. With flood diversion, the water level difference between the two rivers reduced to 0.5–1.0 m at the 8 km upper SXJ waterway, reduced to below 0.2 m between the north mouth and west mouth of the SXJ waterway, and recovered to near zero (equilibrium) on 10 July 2005 after the flood water retreated (Figure 7c,d and Figure 13a). The flood water was diverted from the West River to the North River with a peak rate of −5 630 m3/s, reducing the peak water level at Makou by 0.70 m and increasing the peak water level at Sanshui by 3.30 m, thereby reducing the water level difference to below 0.2 m and causing the rivers to approach hydraulic equilibrium (Figure 7c,d).
For the long-term flood events with multiple flood waves that occurred in both basins, such as in July 2006 and in June 2022 (Figure 8, Figure 9 and Figure 13), the flood diversions in the SXJ waterway were controlled alternatively by the flood waves from the West River and the North River. There is a critical incoming flow fraction that presents a similar water level at the west mouth and north mouth, resulting in hydraulic equilibrium and little flood diversion [35]. When the incoming flow fraction from the West River is larger than the critical value, the flood water will divert from the West River to the North River; otherwise, the flood diversion reverses direction. The critical flow fraction (Gaoyao/[Gaoyao+Shijiao] = 75.9%) fitted with steady flow simulations using the 121 flow combinations was similar to those observed during the 2006 (76.1%) and 2022 (75.6%) flood events for an unsteady flow when the diversion rates fluctuated about ±200 m3/s (Figure 10a,b and Figure 11a), while being much larger than that (72.3%) fitted using the incoming flow ratio and the diversion rates estimated by a 1D numerical model of the river network [35].
Unlike the man-made and one-way flood diversion channel in a river network [22,23], the mutual flood diversion via the natural SXJ waterway synchronized the downstream discharge and greatly reduced the water level difference (i.e., flood hazards), which caused both rivers to reach hydraulic equilibrium and maintain a near-constant discharge fraction (Figure 13) [27,35,46].

5.2. Diversion Influence on Peak Water Levels

The flood diversion via the SXJ waterway had larger implications in reducing or raising the peak water levels at Sanshui for the North River than at Makou for the West River (Figure 7d, Figure 8d, Figure 9d, Figure 10c and Figure 12). The largest diversion flow (−6930 m3/s) in the SXJ waterway was observed on 22 July 1996, which reduced the peak water levels in the West River at the downstream Makou by 0.96 m and at the upstream Gaoyao by 0.79 m [46]. As summarized in Figure 13, the flood diversion in the SXJ waterway not only reduced the downstream peak water levels, but also reduced the upstream peak water levels near the SXJ node, since the declined water levels in the downstream increased the water surface slope and flow velocity of flood waves [46].
During the 2005 floods that were dominated by the flood waves from the West River, the peak diversion flows was −5730 m3/s and the diversion flows were 33.8% of the total discharge at Sanshui in the downstream North River branch (Figure 7). The flood diversion from the West River to the North River not only dramatically increased the peak water level at the downstream Sanshui by 3.41 m in 2005, but also increased the peak water levels at the upstream Shijiao, showing a strong backwater effect in the lower part of the North River [35].
In order to reduce the flood hazards by flood diversion from the West River and to control water allocation during a dry period, a sluice gate in the SXJ waterway was proposed in the 1990s and again in recent years to modulate the diversion rates. Our analysis suggests that any engineering project that reduces the diversion rates would decrease the natural modulating function of the SXJ waterway and push the H-shaped SXJ node into a more vibrating and unstable state [44].

5.3. Diversion Impact on Discharge Fraction

The discharge fraction at the downstream Makou and Sanshui approached a near constant value during individual flood events (Figure 7b, Figure 8b and Figure 9b) and fluctuated around a critical value for the scenario simulations of the 121 incoming flow combinations once the discharge rate at Makou was larger than 20,000 m3/s (Figure 10d), or the water level at Makou was higher than 3.0 m when the influence of tidal force on flow diversion became secondary or even negligible, with higher water levels [45]. The fitted critical discharge fractions (76.6%, 74.3–77.6%) at Makou were consistent with the event-total discharge fractions observed during the flood events in 2005 (76.9%), 2006 (76.6%), 2017 (76.8%), and 2022 (75.9%) (Figure 7b, Figure 8b, Figure 9b, Figure 10d and Figure 11b, Table 4) and fell within the range of the annual discharge fraction, such as 76.8% during 1993–2005 [27], 77.25% during 1989–2013 [34], and 75.1% in June during 2001–2005 [45].
The near-constant discharge fraction during individual floods was modulated by mutual flood diversion via the lateral SXJ waterway. The mutual flood diversion synchronized the downstream discharge and greatly reduced the peak water levels (flood hazards), resulting in similar water levels and pushing both rivers back to hydraulic equilibrium (Figure 7a and Figure 9a). Consequently, the downstream discharge fraction was then mainly determined by the channel dimensions and hydraulic roughness at Makou and Sanshui when the tidal force turned negligible during the high flood stage [15,45].
Such a critical discharge fraction is significant for engineering design for flood control and water resource allocation for downstream waterways and estuary management. In the practical calculation of the flood design stage for downstream waterways, the flood allocation at Makou and Sanshui was estimated using three empirical relations according to the dominated flood waves in either river basin, resulting in mean discharge fractions at Makou of 75.8%, 74.3%, and 73.7%, respectively [37]. Our fitted value was consistent with those values and confirmed the values of 75.8% and 74.3% estimated by the first two empirical relations, but still needs further investigation, especially under the influence of estuary tides and in unsteady flows, for a scenario simulation that considers the flood processes and phase lags in both river basins, such as the three flood events illustrated in Figure 7, Figure 8 and Figure 9.
In addition, the flood diversion in the SXJ waterway is also affected by tidal fluctuation, especially during spring and neap tide or during strong storm surges in the estuary [47]. The modeling results of Liu (2016) suggested that higher tidal levels would reduce the flood-discharge fraction at Makou [35]. Since Gaoyao and Shijiao were the upstream boundary stations and Makou and Sanshui were the downstream end of our model’s domain, this study did not investigate the estuary tidal influence on flood diversion via the SXJ waterway or on the discharge fraction at Makou or Sanshui, although the tidal influence on flood diversion in the SXJ waterway becomes secondary as the water level rises to higher than 3.0 m at Makou [45], or even negligible for a larger magnitude of flood, such as that of the 1:5a return period, where the water level at Makou would be higher than 6.5 m. Those issues will be explored in our further studies by extending the downstream model domain into the estuary and considering the coupled effect of flood discharge and storm surges in the river network [47].

6. Conclusions

Both the West River and the North River have been separated and connected by the nearly 3 km long and 200–400 m wide SXJ waterway, forming a unique H-shaped compound river node and creating an unstable state mainly due to unbalanced or asynchronous flood waves from upstream rivers, while always approaching hydraulic equilibrium by flood diversion via the lateral SXJ waterway.
When the stream flow is larger than 20,000 m3/s at Gaoyao, there exists a critical flow fraction threshold of 75.9% (or 24.1% at Shijiao), where the incoming flow from both rivers presents a similar water level at the west mouth and north mouth, resulting in hydraulic equilibrium (i.e., small water level differences) and little flood diversion via the SXJ waterway. Above the threshold, flood water will divert from the West River to the North River with a maximum rate of −11,900 m3/s, accounting for 20% of the West River and reducing the peak water level up to 1.48 m at Makou. Below the threshold, flood water will divert from the North River to the West River with a maximum rate of 11,990 m3/s, accounting for 55% of the North River flow and reducing the peak water level by up to 6.63 m at Sanshui.
The discharge fraction at downstream Makou and Sanshui approached a near-constant value during a flood and fluctuated around 76.6% as the water level at Makou was larger than 3.0 m, when the influence of tidal force on flow diversion became secondary, or even negligible with higher water levels. This critical discharge fraction is consistent with those observed during the four flood events and the annual discharge fractions after the late 1990s. This is significant for the engineering design of flood control and water resource allocation for the downstream waterways and estuary management.
We propose a new type of H-shaped compound river node, which clearly elucidates the driving force and the mechanism of flood diversion between two incoming rivers and two downstream branches at the SXJ river node in the PRD, and which may work well at similar compound river nodes in other river deltas around the world. In future work, the hydrodynamic model can be coupled with the watershed hydrologic model to investigate the response mechanism of the H-shaped compound river node to watershed runoff and estuarine tides.

Author Contributions

Conceptualization, Y.F. and X.W.; Methodology, Y.F., J.R. and H.L.; Software, J.R.; Validation, X.W., J.R., H.L. and Y.W.; Formal analysis, Y.F. and X.W.; Investigation, J.R. and Y.W.; Resources, X.W. and Y.W.; Data curation, H.L.; Writing—original draft, Y.F.; Writing—review & editing, X.W. All authors have read and agreed to the published version of the manuscript.

Funding

This study was supported financially by the National Key R&D Program of China (2021YFC3001000), the National Natural Science Foundation of China (41871085), and the Innovation Group Project of the Southern Marine Science and Engineering Guangdong Laboratory (Zhuhai) (311021004).

Data Availability Statement

The research data are restricted, and authors do not have permission to share the research data.

Acknowledgments

The water levels, stream flow, and bathymetry data provided by the Pearl River Hydraulic Research Institute and the Department Water Resources (DWR) of Guangdong Province and the Deft3D model developed by the Deltares in the Netherlands are highly appreciated.

Conflicts of Interest

The authors declare that they have no conflict of interest.

References

  1. Kleinhans, M.G.; Jagers, H.; Mosselman, E.; Sloff, C.J. Bifurcation dynamics and avulsion duration in meandering rivers by one-dimensional and three-dimensional models. Water Resour. Res. 2008, 44, W08454. [Google Scholar] [CrossRef]
  2. Bolla Pittaluga, M.; Repetto, R.; Tubino, M. Channel bifurcation in braided rivers: Equilibrium configurations and stability. Water Resour. Res. 2003, 39, 1046. [Google Scholar] [CrossRef]
  3. Ramamurthy, A.S.; Qu, J.; Vo, D. Numerical and experimental study of dividing open-channel flows. J. Hydraul. Eng. 2007, 133, 1135–1144. [Google Scholar] [CrossRef]
  4. Buschman, F.A.; Hoitink, A.; van der Vegt, M.; Hoekstra, P. Subtidal flow division at a shallow tidal junction. Water Resour. Res. 2010, 46, W12515. [Google Scholar] [CrossRef]
  5. Kleinhans, M.G.; Wilbers, A.; Ten Brinke, W. Opposite hysteresis of sand and gravel transport upstream and downstream of a bifurcation during a flood in the River Rhine, the Netherlands. Neth. J. Geosci./Geol. Mijnb. 2007, 86, 273–285. [Google Scholar] [CrossRef]
  6. Sassi, M.G.; Hoitink, A.; De Brye, B.; Vermeulen, B.; Deleersnijder, E. Tidal impact on the division of river discharge over distributary channels in the Mahakam Delta. Ocean. Dyn. 2011, 61, 2211–2228. [Google Scholar] [CrossRef]
  7. Sassi, M.G.; Hoitink, A.; Vermeulen, B.; Hidayat, H. Sediment discharge division at two tidally influenced river bifurcations. Water Resour. Res. 2013, 49, 2119–2134. [Google Scholar] [CrossRef]
  8. Ji, X.; Zhang, W. Tidal influence on the discharge distribution over the Pearl River Delta, China. Reg. Stud. Mar. Sci. 2019, 31, 100791. [Google Scholar] [CrossRef]
  9. Davoren, A.; Mosley, M.P. Observations of bedload movement, bar development and sediment supply in the braided Ohau River. Earth Surf. Process. Landf. 1986, 11, 643–652. [Google Scholar] [CrossRef]
  10. Ferguson, R.I.; Ashmore, P.E.; Ashworth, P.J.; Paola, C.; Prestegaard, K.L. Measurements in a braided river chute and lobe: 1. Flow pattern, sediment transport, and channel change. Water Resour. Res. 1992, 28, 1877–1886. [Google Scholar] [CrossRef]
  11. Ferguson, R.I. Understanding braiding processes in gravel-bed rivers: Progress and unsolved problems. Geol. Soc. Lond. Spec. Publ. 1993, 75, 73–87. [Google Scholar] [CrossRef]
  12. Ashmore, P.E.; Ferguson, R.I.; Prestegaard, K.L.; Ashworth, P.J.; Paola, C. Secondary flow in anabranch confluences of a braided, gravel-bed stream. Earth Surf. Process. Landf. 1992, 17, 299–311. [Google Scholar] [CrossRef]
  13. Best, J.L. Flow Dynamics at River Channel Confluences: Implications for Sediment Transport and Bed Morphology. In Recent Developments in Fluvial Sedimentology; Ethridge, F.G., Flores, R.M., Harvey, M.D., Eds.; Society of Economic Paleontologists and Mineralogists: Washington, DC, USA, 1987; Volume 39, pp. 27–35. [Google Scholar] [CrossRef]
  14. Best, J.L.; Roy, A.G. Mixing-layer distortion at the confluence of channels of different depth. Nature 1991, 350, 411–413. [Google Scholar] [CrossRef]
  15. Wang, Z.B.; De Vries, M.; Fokkink, R.J.; Langerak, A. Stability of river bifurcations in 1D morphodynamic models. J. Hydraul. Res. 1995, 33, 739–750. [Google Scholar] [CrossRef]
  16. Kleinhans, M.G.; Ferguson, R.I.; Lane, S.N.; Hardy, R.J. Splitting rivers at their seams: Bifurcations and avulsion. Earth Surf. Process. Landf. 2013, 38, 47–61. [Google Scholar] [CrossRef]
  17. Bertoldi, W.; Tubino, M. River bifurcations: Experimental observations on equilibrium configurations. Water Resour. Res. 2007, 43, W10437. [Google Scholar] [CrossRef]
  18. Ying, Z.; Chen, Z.; So, C.L. Formation and Evolution of the X-Shape waterways by Sixianjiao Channel. Sun Yat-Sen Univ. Forum 1988, 2, 8–14. (In Chinese) [Google Scholar]
  19. Zeng, Z.; Huang, S. Study on the historical geomorphology of the convergence area of branching channels in the Pearl River Delta, taking the development of a sandbar in Sixianjiao as an example. Pearl River 1982, 4, 25–29. (In Chinese) [Google Scholar]
  20. Xie, P.; Tang, Y.; Chen, G.; Li, C. Variation analysis of hydrological and sediment series in North River and West River Delta: Case study of Makou Station and Sanshui Station. J. Sediment Res. 2010, 5, 26–31. (In Chinese) [Google Scholar]
  21. Zhang, W.; Cao, Y.; Zhu, Y.; Wu, Y.; Ji, X.; He, Y.; Xu, Y.; Wang, W. Flood frequency analysis for alterations of extreme maximum water levels in the Pearl River Delta. Ocean. Eng. 2017, 129, 117–132. [Google Scholar] [CrossRef]
  22. Mel, R.A.; Viero, D.P.; Carniello, L.; D’Alpaos, L. Multipurpose Use of Artificial Channel Networks for Flood Risk Reduction: The Case of the Waterway Padova–Venice (Italy). Water 2020, 12, 1609. [Google Scholar] [CrossRef]
  23. Mel, R.A.; Viero, D.P.; Carniello, L.; D’Alpaos, L. Optimal floodgate operation for river flood management: The case study of Padova (Italy). J. Hydrol. Reg. Stud. 2020, 30, 100702. [Google Scholar] [CrossRef]
  24. Bertoldi, W. River Bifurcations. Ph.D. Thesis, University Digli Studi di Trento, Trento, Italy, 2004. [Google Scholar]
  25. Schuurman, F.; Kleinhans, M.G. Bar dynamics and bifurcation evolution in a modelled braided sand-bed river. Earth Surf. Process. Landf. 2015, 40, 1318–1333. [Google Scholar] [CrossRef]
  26. Shen, J. Calculation of the mean daily discharge through the Sixianjiao waterway in low-water season. Trop. Geogr. 1989, 9, 143–149. (In Chinese) [Google Scholar]
  27. Liu, X. Analysis of Flow in Sixianjiao. Pearl River 2008, 2, 36–39. (In Chinese) [Google Scholar]
  28. Li, Y. Stage-Discharge Relation Based on “2017.7” Measured Flood in Sixianjiao Channel. Guangdong Water Resour. Hydropower 2018, 4, 11–15. (In Chinese) [Google Scholar]
  29. Zhang, W.; Du, J.; Zheng, J.; Wei, X.; Zhu, Y. Redistribution of the suspended sediment at the apex bifurcation in the Pearl River Network, South China. J. Coast. Res. 2014, 30, 170–182. [Google Scholar] [CrossRef]
  30. Wu, Y.; Zhang, W.; Zhu, Y.; Zheng, J.; Ji, X.; He, Y.; Xu, Y. Intra-tidal division of flow and suspended sediment at the first order junction of the Pearl River Network. Estuar. Coast. Shelf Sci. 2018, 209, 169–182. [Google Scholar] [CrossRef]
  31. Luo, X.; Zeng, E.Y.; Ji, R.; Wang, C. Effects of in-channel sand excavation on the hydrology of the Pearl River Delta, China. J. Hydrol. 2007, 343, 230–239. [Google Scholar] [CrossRef]
  32. Liu, Q.; Wu, C. Hydrodynamic Characteristics of Waterway Network of the Pearl River Delta in the 1950’s. Port Waterw. Eng. 2005, 3, 66–69. (In Chinese) [Google Scholar]
  33. Liu, F.; Xie, R.; Luo, X.; Yang, L.; Cai, H.; Yang, Q. Stepwise adjustment of deltaic channels in response to human interventions and its hydrological implications for sustainable water managements in the Pearl River Delta, China. J. Hydrol. 2019, 573, 194–206. [Google Scholar] [CrossRef]
  34. Wang, X.; Huang, J.; Xu, H. Study of Hydrological Characteristics in Sixianjiao Reach. Guangdong Water Resour. Hydropower 2015, 11, 26–30. (In Chinese) [Google Scholar]
  35. Liu, J. The Pearl River Delta Sixianjiao Channel, Tianhe Node Split Ratio on Law. Pearl River 2016, 37, 15–20. (In Chinese) [Google Scholar]
  36. Zhang, W.; Cao, Y.; Zhu, Y.; Zheng, J.; Ji, X.; Xu, Y.; Wu, Y.; Hoitink, A.J.F. Unravelling the causes of tidal asymmetry in deltas. J. Hydrol. 2018, 564, 588–604. [Google Scholar] [CrossRef]
  37. Department of Water Resources (DWR) in Guangdong Province. Manuals for the Design Flood Stages in the Downstream of Xijiang and Beijiang and in the River Networks in the Pearl River Delta; Internal Document Issued by the Department of Water Resources in Guangdong Province: Guangzhou, China, 2002. Available online: http://slt.gd.gov.cn/ (accessed on 12 September 2019). (In Chinese)
  38. Deltares. Delft3D-FLOW: User Manual 3.15.57696; Deltares: Delft, The Netherlands, 2018. [Google Scholar]
  39. Lesser, G.R.; Roelvink, J.V.; van Kester JT, M.; Stelling, G.S. Development and validation of a three-dimensional morphological model. Coast. Eng. 2004, 51, 883–915. [Google Scholar] [CrossRef]
  40. Nash, J.E.; Sutcliffe, J.V. River flow forecasting through conceptual models part I—A discussion of principles. J. Hydrol. 1970, 10, 282–290. [Google Scholar] [CrossRef]
  41. Pinos, J.; Timbe, L. Performance assessment of two-dimensional hydraulic models for generation of flood inundation maps in mountain river basins. Water Sci. Eng. 2019, 12, 11–18. [Google Scholar] [CrossRef]
  42. Allen, J.I.; Somerfield, P.J.; Gilbert, F.J. Quantifying uncertainty in high-resolution coupled hydrodynamic-ecosystem models. J. Mar. Syst. 2007, 64, 3–14. [Google Scholar] [CrossRef]
  43. Maréchal, D. A Soil-Based Approach to Rainfall-Runoff Modelling in Ungauged Catchments for England and Wales. Ph.D. Thesis, Cranfield University, Cranfield, UK, 2004. [Google Scholar]
  44. Wu, C. A preliminary study on the phenomenological relation between morphodynamic equilibrium and geomorphic information entropy in the evolution of the Zhujiang River Delta. Haiyang Xuebao 2018, 40, 22–37. (In Chinese) [Google Scholar]
  45. Huang, W. Analysis on the hydrological characteristics at the Sixianjiao node and in West River and North River. Pearl River 2011, 32, 23–24. (In Chinese) [Google Scholar] [CrossRef]
  46. Li, T. The role of Sixianjiao in the July 1996 flood. Guangdong Water Resour. Hydropower 1997, 1, 22–24. (In Chinese) [Google Scholar]
  47. Wang, X.; Guo, Y.; Ren, J. The Coupling Effect of Flood Discharge and Storm Surge on Extreme Flood Stages: A Case Study in the Pearl River Delta, South China. Int. J. Disaster Risk Sci. 2021, 12, 1–15. [Google Scholar] [CrossRef]
Figure 1. The general setting of the Pearl River Delta and the satellite image over the H-shaped SiXianJiao (SXJ) node. Gaoyao and Shijiao are the two upstream controlling stations, and Makou and Sanshui are the two controlling stations in the downstream river network.  Q a  and  Q b  represent the incoming flow rates at Gaoyao from the West River and at Shijiao from the North River.  Q c  and  Q d  represent the discharge rates at Makou and Sanshui in the downstream branches.  Q x  is the diversion flow via the SXJ waterway. The abbreviations are the eight outlets: Humen (HUM), Jiaomen (JM), Hongqimen (HQM), Hengmen (HM), Modaomen (MDM), Jitimen (JTM), Hutiaomen (HTM), and Yamen (YM).
Water 15 01970 g001
Figure 2. The stage-flow curves at Makou (a) and Sanshui (b) fitted by the flow and water levels recorded during the 2005 and 2006 flood events.
Water 15 01970 g002
Figure 3. The model grid over the SXJ node. The filled red circles in the SXJ waterway are the junctions, called west mouth, north mouth and east mouth, plus the upper north mouth in the North River and upper west mouth in the West River, where water levels are used to analyze influence of the flood diversion via the SXJ waterway. The upper west mouth and the upper north mouth are about 8 km away from the west mouth and north mouth.
Water 15 01970 g003
Figure 4. Model calibration of water levels (a,b) and discharge (c,d) using in situ measurements at Makou (a,c) and Sanshui (b,d) during the flood from 5 June to 10 July 2005.
Water 15 01970 g004
Figure 5. Model validation of water levels (a,b) and discharge (c,d) using in situ measurements at Makou (a,c) and Sanshui (b,d) during the flood from 5 June to 27 June 2022.
Water 15 01970 g005
Figure 6. Model validation using in situ flow observation at Makou (a), Sanshui (b), and Ganggen (c) during the flood from 29 June to 19 July 2017.
Water 15 01970 g006
Figure 7. The simulated flow and water levels at the SXJ node during the 2005 flood. The incoming and outgoing flow (a) and the flow fraction (b) of the West River and the North River, (c) the diversion flow at Ganggen and water level difference (N–W) between the north mouth and west mouth of the SXJ waterway, and (d) water level changes with and without flood diversion, which were calculated as the actual water levels with flood diversion minus the given water levels without flood diversion, indicating that the discharge at Makou (Sanshui) is same as the incoming flow at Gaoyao (Shijiao) from the West River (North River).
Water 15 01970 g007
Figure 8. The simulated flow and water levels at the SXJ node during the 2006 flood. The incoming and outgoing flow (a) and the flow fraction (b) of the West River and the North River, (c) the diversion flow at Ganggen and water level difference (N–W) between the north mouth and west mouth of the SXJ waterway, and (d) water level changes with and without flood diversion, which were calculated as the actual water levels with flood diversion minus the given water levels without flood diversion, indicating that the discharge at Makou (Sanshui) is same as the incoming flow at Gaoyao (Shijiao) from the West River (North River). The flood diversion in 2006 was divided into four phases (d).
Water 15 01970 g008
Figure 9. The simulated flow and water levels at the SXJ node during the 2022 flood. The incoming and outgoing flow (a) and the flow fraction (b) of the West River and the North River, (c) the diversion flow at Ganggen and water level difference (N–W) between the north mouth and west mouth of the SXJ waterway, and (d) water level changes with and without flood diversion, which were calculated as the actual water levels with flood diversion minus the given water levels without flood diversion, indicating that the discharge at Makou (Sanshui) is same as the incoming flow at Gaoyao (Shijiao) from the West River (North River). The flood diversion in 2022 was divided into three phases (d).
Water 15 01970 g009
Figure 10. The flood diversion and discharge fraction simulated under various combinations of incoming flow rates at the SXJ node: (a) water level difference (N–W) between the north mouth and the west mouth in the SXJ waterway, (b) flood diversion at Ganggen, (c) water level change with flood diversion, and (d) discharge fraction at Makou and Sanshui. In plot (d), the two arrows and values represent the upper and lower fraction, and the dashed lines represent the incoming (discharge) flow fraction without flood diversion.
Water 15 01970 g010
Figure 11. The scatter plot of (a) incoming flow at Gaoyao from the West River versus Shijiao from the North River when there was no flood diversion, and (b) the discharge at Makou versus Sanshui when various flood diversions occurred via the SXJ waterway.
Water 15 01970 g011
Figure 12. Comparison of flow (a,b) and water level (c,d) changes at the downstream Makou and Sanshui with and without flood diversion via the SXJ waterway under various incoming flow at Gaoyao from the West River and at Shijiao from the North River. Below the dashed line, the figure indicates flow reduction and water level decline at Makou (Sanshui), due to flood diversion.
Water 15 01970 g012
Figure 13. Water level differences (N–W) between the North River and the West River at the 8 km upper (blue) and at the SXJ waterway (orange solid) with flood diversion during the floods in (a) 2005, (b) 2006, (c) 2017 and (d) 2022. The green dotted line represents the given water level differences between both rivers at the SXJ waterway when there is no flood diversion.
Water 15 01970 g013
Table 1. Description and sources of data used in this study.
ItemDescriptionSourceNote
BathymetryPrecision: 0.1 m;The Pearl River Hydraulic Research Institute of the Pearl River Water Resources Commission of the MWR of ChinaSurveyed in 2020
Water level and flowHourly, Gaoyao, Shijiao, Makou, Sanshui The Pearl River Hydraulic Research Institute of the Pearl River Water Resources Commission of the MWR of China for 2005, 2006, 2017, and the DWR of Guangdong Province for 2022For flood events in 2005, 2006, 2017, and 2022. The flow at Ganggen in 2017 was from Li [28].
Note. MWR—Ministry of Water Resources; DWR—Department of Water Resources.
Table 2. The flood flow and return periods at Gaoyao in the West River and Feilaixia/Shijiao in the North River [37].
River/StationsReturn Periods (1: n Year) and Flow Rates (×103 m3/s)
510203050100200300
West River/Gaoyao37.945.049.750.852.254.055.957.5
North River/Feilaixia11.913.815.516.717.719.220.721.6
Note: Feilaixia is located 40 km upstream from Shijiao.
Table 3. The upstream boundary conditions of incoming flow at Gaoyao from the West River and Shijiao from the North River, for scenario simulations.
Rivers/StationsFlow (×103 m3/s)
West River/Gaoyao1015202530354045505560
North River/Shijiao246810121416182022
Table 4. Comparisons of peak flow at Gaoyao (Shijiao) and discharge at Makou (Sanshui) in the West (North) River after flood diversion via the SXJ waterway during four flood events.
Flood Events/PhasesUpstream StationsPeak Flow (m3/s)Return Periods (Years)* Flow FractionDownstream StationsPeak Discharge# Return Periods (Years)* Discharge Fraction
2005 FloodGaoyao56,66720084.7%Makou52,6016076.9%
Shijiao13,4001015.3%Sanshui 16,5153023.1%
2006 Flood Gaoyao34,435278.1%Makou36,701576.6%
Shijiao18,2456021.9%Sanshui 12,166523.4%
2017 Flood Gaoyao49,1572086.0%Makou43,0581076.8%
Shijiao9603214.0%Sanshui 13,2051023.2%
2022 Flood IGaoyao37,366579.7%Makou35,308376.2%
Shijiao10,109220.3%Sanshui 11,061323.8%
2022 Flood IIGaoyao42,4151075.6%Makou43,8501076.0%
Shijiao15,3722024.4%Sanshui 13,8491024.0%
2022 Flood IIIGaoyao39,381568.9%Makou43,5161075.6%
Shijiao19,76810031.1%Sanshui 14,1221024.4%
Notes: * Flow (discharge) fraction is the percentage of total incoming flow (discharge). # The return periods at Makou (Sanshui) were assessed with the flow frequency distribution function at Gaoyao (Shijiao) and approximated to near values.
Disclaimer/Publisher’s Note: The statements, opinions and data contained in all publications are solely those of the individual author(s) and contributor(s) and not of MDPI and/or the editor(s). MDPI and/or the editor(s) disclaim responsibility for any injury to people or property resulting from any ideas, methods, instructions or products referred to in the content.

