Article

Spatiotemporal Evolution and Drivers of Chinese Industrial Virtual Water in International Trade

1
School of Economics, Ocean University of China, Qingdao 266100, China
2
Institute of Marine Development, Ocean University of China, Qingdao 266100, China
*
Author to whom correspondence should be addressed.
Water 2023, 15(11), 1975; https://doi.org/10.3390/w15111975
Submission received: 19 April 2023 / Revised: 18 May 2023 / Accepted: 19 May 2023 / Published: 23 May 2023
(This article belongs to the Section Water Use and Scarcity)

Abstract

:
As a water-scarce country and the world’s largest trader of industrial products, China’s industrial virtual water (VW) flow may exacerbate its water scarcity problem. Thus, industrial VW flows’ spatial and temporal evolution in international trade should be analyzed, and influencing factors must be identified. This study developed the multiregional input–output (MRIO) model, combined with the Leontief inverse matrix, to measure and decompose the industrial VW flows between China and other economies from 2000 to 2014. This extended MRIO model considers intermediate production water consumption and indirect water use, which technically distinguishes the sources of pressure on water use more accurately, thus enabling a new elaboration of the composition of China’s industrial water use. Then, the evolution of China’s industrial VW trade is analyzed spatiotemporally, and the structural decomposition analysis (SDA) method is invoked to identify the endogenous drivers further. The results indicate the following. (1) China was a net exporter of industrial VW trade. The main VW export sectors in China were the manufacture of textiles and wearing apparel, paper products, and chemical products, which had the characteristics of high water consumption, high pollution, and low added value, respectively. (2) The net exports of industrial VW from China mainly went to the US, EU, ROW (rest of the world), and Japan. China’s VW exports to the US and Japan are declining, while exports to the EU and Russia are increasing. (3) The decrease in the water-use coefficient in all industrial sectors in China was the most critical reason for inhibiting the increase in the country’s industrial VW exports. The export structure effect of intermediate products, product structure effect of foreign final demand, and scale effect of foreign final demand were the primary reasons for the rise in VW exports, but all gradually diminished. Moreover, the structural effects of China on the use of domestic intermediate products had a significant positive effect on the increase in VW exports. In contrast, those of foreign products had an extremely weak effect.

1. Introduction

China is a typical water-scarce country. The Food and Agriculture Organization of the United Nations (FAO) states that China’s per capita renewable inland freshwater resources in 2017 were only 1/3 of the world average [1]. The severe water shortage is a significant obstacle to its economic growth [2]. Relative to this crisis, China has taken several measures (e.g., the South–North Water Transfer Project) to transfer water across regions in response to uneven water-resource distribution. Before the 21st century, China’s water policy focused on water conservation projects to prevent floods and droughts. After 2000, the Chinese government emphasized introducing water resource management and the market mechanism, constructing a water-saving society in an all-round way. Since 2019, China has elevated water conservation to the level of a national strategy by implementing the National Water Conservation Initiative. About 1/15 of China’s water withdrawals were allocated to the industrial sector, the second-largest water user after agriculture [3]. On the domestic front, industrial water demand is expanding, while the industrial sector’s extensive growth exacerbates water scarcity [4]. Regarding international trade, China is the world’s largest exporter and the second-largest importer of industrial products. WTO statistics show that since China acceded to the WTO, the country’s industrial foreign trade has grown from USD 470,617 million in 2001 to USD 4,301,140 million in 2020, accounting for 14.4% of the world’s total and ranking first globally. A large amount of water consumption accompanies the production and service of products. As a result, water use in the industrial sector is expected to grow significantly for at least the next three decades [5].
The water resources consumed in producing goods and providing services are named virtual water (VW) [6]. Trade characterized by the movement of VW across regions is known as VW trade. Optimizing VW trade relationships may have broader socioeconomic consequences than direct water conservation measures [7]. A large body of work has measured VW flows on a global or regional scale to analyze VW trade relationships between individual economies. For water-scarce countries, VW trade may alleviate their water dilemma or exacerbate their water stress [8,9,10,11]. Hence, does China’s industrial VW trade with the rest of the world’s economies alleviate or exacerbate its water scarcity? An in-depth exploration of China’s VW trade relationships with various economies and further analysis of the drivers are necessary to explore the pathways to water savings through VW trade strategies.
VW research has focused on agricultural trade [12,13,14,15,16]. A few studies have addressed industry-wide [17,18,19], linkage effects are found between agricultural and industrial industries [20,21]; Garcia and Mejia, (2019), as well as individual industrial chains, such as wine [22], cement [23], and steel [24,25]. However, studies on industrial VW trade patterns are lacking [26]. Comprehensive studies covering multiple subsectors of Chinese industry are scarce. As a result, we may not have an overall and detailed understanding of China’s industrial VW trade pattern, nor can we optimize it from the industrial structure perspective. Chen et al. (2018) [27] studied the import and export of VW from 14 sectors of China’s foreign trade during 2002–2012. They put forward feasible suggestions to solve the water-shortage problem in China from the perspective of trade-structure adjustment. In view of this, this study focuses on industry, with water use in 20 industrial sectors, in an effort to propose guidance with practical implications for water management in China.
There are two main methods used for measuring VW flows: the physical trade flow (PTF) method and multiregional input–output (MRIO) analysis [28]. The PTF method is mainly used in agriculture and measured by determining product VW content [22,29], which is a “bottom-up” approach. However, MRIO analysis, a “top-down” approach, allows the calculation of the water footprint in all industries and products in a complex global supply chain [30,31,32]. However, the input–output analysis generally reflects only the final demand, ignoring the increasingly important intermediate production stage, resulting in a failure to consider indirect water use [33].
Regarding drivers’ research, most previous studies were based on multiple regression models or network trade models [34,35]. These models reflect the statistical correlation of many external factors with VW flows. However, the structural decomposition analysis (SDA) model more easily considers endogenous changes. It can decompose to obtain the internal drivers that lead to changes in VW flows, thus exploring the trade causes of water scarcity in greater depth. Even so, the application of SDA models could be improved: first, SDA is usually applied at the interprovincial level and lacks analysis at the national level [36,37,38,39,40]. Although Cai et al. (2019) used SDA to assess drivers of VW flows in China, only the 2002, 2007, and 2012 years were analyzed due to data availability [17]. Secondly, while economic structure, size, and efficiency are considered in SDA models, forward and backward correlations across industries are ignored.
Given the above discussion, this study uses data from the years 2000–2014 to measure the imports and exports of Chinese industrial VW and explore the spatial and temporal evolution of Chinese industrial VW in international trade. Drivers of VW flow changes were then analyzed using SDA to explore water-saving paths in the industrial sector. This study contributes the following. (1) Focusing on various industrial sectors, we fill the gap in studying industrial VW in international trade. According to 15 years of input–output data for the world’s 44 major economies, this study more comprehensively demonstrates the spatial and temporal evolution of the VW trade pattern, providing theoretical support for VW trade in China’s industrial water conservation. (2) The composition of industrial water consumption in China is newly elaborated from the production side. The decomposition of the MRIO model measurement results, with the help of the Leontief inverse matrix, distinguishes not only water consumption of intermediate production and final demand but also direct and indirect water consumption of intermediate production, technically distinguishing the sources of water-use pressure more accurately. (3) At the national level, the application of the SDA method in water resources research is enriched by the analysis of endogenous drivers of VW flow changes using the SDA model based on the consideration of distinguishing forward and backward inter-industry linkages.
The remainder of the paper is organized as follows. Section 2 is about model methods and data sources. This section details the establishment steps of the MRIO and SDA models. Section 3 is the results and discussion. It calculates China’s industrial VW flow, discusses the VW trade relationship between China and other economies, and investigates the driving factors of VW export change. Section 4 summarizes the research and discusses the guiding suggestions for China’s water resources management practice and the future research direction.

2. Materials and Methods

2.1. MRIO Model

The input–output table portrays the flow process of resources between industrial sectors in terms of producing consumption and output distribution. It reflects the techno-economic connections and resources’ quantitative linkages between sectors within the economic system under a certain level of technology. In order to reflect the relationship between countries involved in international VW trade more systematically and comprehensively, this study constructs the MRIO model to analyze the flow of water resources implied in industrial products across regions. Based on previous research methods, this study extends and adjusts the model and carries out a more detailed decomposition [17]. Equation (1) is the MRIO model consisting of m countries or regions.
X 1 X 2 X m = Q 11 Q 12 Q 21 Q 22 Q m , 1 Q m , 2 Q 1 , m Q 2 , m Q m , m + Y 1 Y 2 Y m = A 11 A 12 A 21 A 22 A m , 1 A m , 2 A 1 , m A 2 , m A m , m × X 1 X 2 X m + Y 1 Y 2 Y m
Equation (1) can be expressed in the form of a chunking matrix as follows:
X = Q + Y = A X + Y
Transformation yields the following equation containing the Leontief inverse matrix L = ( 1 A ) 1 :
X = ( 1 A ) 1 Y
Here, X, Q, and Y represent the world’s total output, intermediate demand, and final demand matrices, respectively, with cell X r representing the industrial sectoral total output matrix for country r and Y r representing the final demand matrix for country r . A is the direct consumption coefficient matrix, which describes the direct economic linkages between production sectors on a domestic or international scale. Here, cell A m m represents the direct consumption coefficient matrix of country m to its own country, and cell A m s ( r s ) represents the direct consumption coefficient matrix of country m to country s .
To incorporate the resource element into the input–output model, introduce the following VW direct-use coefficient:
ω i r = w i r x i r , i = 1,2 , , 20 ; r , s = 1,2 , , 17
w i r denotes the water consumption of sector i in country r , and x i r denotes the total output of sector i in country r . The ratio is calculated to obtain the direct water consumption coefficient ω d for sector i in country r . It can be expressed in a matrix as follows.
ω d = W X 1
The complete water consumption coefficient ω c can then be expressed as follows.
ω c = ω d L
ω c includes direct water use in this sector and indirect water use from other sectors, respectively. Combined with the Leontief inverse matrix in Equation (3), it can be expressed as follows.
W V = ω ( 1 A ) 1 Y
Among them,
W V = W V 11 W V 12 W V 21 W V 22 W V 17,1 W V 17,2 W V 1,17 W V 2,17 W V 17,17 , ω = ω ^ 1 0 0 ω ^ 2 0 0 0 0 ω ^ 17
W V r r represents the VW consumption contained in products or services in country r to satisfy the final demand in that country. W V r s represents VW export from country r to country s resulting from the final demand of country s . ω ^ r represents the diagonal matrix of ω r , which denotes the direct VW consumption coefficient matrix of country r . This study investigates the impact of VW flow from international trade on China’s domestic water stress. Therefore, it accepts the “imported technology homogeneity hypothesis,” which suggests that imported products are produced abroad with the same technical efficiency as China’s. If we number China as 1, the demand-induced VW exports ( W V e x ) and VW imports ( W V i m ) from China to other economies can be obtained as follows.
W V e x = S 1 W V 1 s
W V i m = r 1 W V r 1

2.2. Decomposition of VW in the Industrial Sector

VW exports are typically measured without a clear description of the components of industrial water use and without a decomposition of VW exports from a matrix perspective. Hence, this study split the Leontief inverse matrix L into a full consumption matrix ( L I ) and a unit matrix I , corresponding to intermediate production water consumption and final demand water consumption. The resulting water consumption for intermediate production includes the industrial products’ direct and indirect demand for each sector and comprehensively reflects the link between production and final products.
According to Equations (2) and (7), from the production side, the VW of each country’s industrial sector is divided into two components: the VW of intermediate production and final demand, each of which includes exported and domestic own use. Still assuming that China is numbered 1, the Chinese industrial sector VW (column vector) can be expressed from the production perspective as follows.
W C h i n a = E I W + D I W + E F W + D F W = ω ^ 1 j   s 1   ( L I ) 1 s Y s j Export - induced   intermediate   production   water   + ω ^ 1 j   s = 1   ( L I ) 1 s Y s j Domestically   induced   intermediate   production   water   + ω ^ 1 j   s 1   Y 1 s j Export - induced   final   product   water   + ω ^ 1 j   s = 1   Y 1 s j Domestically   induced   final   product   water  
From Equation (10), the industrial sector VW in China can be classified according to usage into two parts: intermediate production-induced VW and final demand-induced VW. Intermediate production VW can be decomposed into EIW (export-induced intermediate production water, which meets the intermediate demand of foreign industrial sectors) and DIW (domestically induced intermediate production water for meeting domestic demand for intermediate products in various industrial sectors). VW produced by final demand can be decomposed into EFW (export-induced final product water) and DFW (domestically induced final product water). EFW is the water consumption of final products produced by the Chinese industrial sector and meets the foreign final demand. DFW is the water consumption of final products produced by the Chinese industrial sector and meets domestic final demand. From a country perspective, the sum of EIW and EFW is the total VW exported by the Chinese industry. Thus, a more comprehensive picture of the impact of international trade on the pressure of water use in Chinese industrial production can be presented.

2.3. SDA Model

This study used an SDA model to examine the contribution of changes in the variables in the input–output model to changes in VW import and export flows. The SDA model is a matrix decomposition model measuring the magnitude of the effect of each factor on the dependent variable. Suppose a dependent variable can be expressed as the product form of multiple variables. In that case, the change in the dependent variable can be expressed as the sum of changes in the individual independent variables. Combining the idea of the SDA method with the input–output model, the basic model decomposition is obtained in the form of the following:
X = B Y
X = B Y 1 + B 1 Y + B Y
where B = ( 1 A ) 1 .
Sources of changes in aggregate output include changes in production technology or changes in final demand. Interaction terms are generally combined; however, when the model’s independent variables increase, the form of decomposition also increases. In combining the interaction terms, the model decomposition is not unique, which may cause deviations in the decomposition. Among the various SDA forms, the bipolar decomposition method is considered to obtain a better approximate solution and is widely used in the decomposition analysis of resource consumption [14,41].
Based on the above settings, industrial VW can be further decomposed:
W = w L P V
The SDA equation for the amount of VW change is the following:
Δ W = W ( Δ w ) + W Δ L + W ( Δ P ) + W ( Δ V )
Here, w is the water consumption per unit of output for each industrial sector, referred to as the direct water use coefficient, and W ( Δ w ) represents the effect of changes in the water-use coefficient, referred to as the water-use intensity effect. L is the Leontief inverse matrix, representing intermediate production technology linkage in the input–output table, and W Δ L is the intermediate production technology effect. P is each sector’s final demand proportion in the final demand column vector. W ( Δ P ) represents the product structure effect of the final demand of each world economy. V is the final demand of each world economy, and W ( Δ V ) represents the scale effect of final demand. The above equation can be decomposed into various forms. Hence, this study adopts the bipolar decomposition method to analyze the impact of changes in the four aspects of direct water-use coefficient, intermediate production technology, final demand product structure, and final demand scale on the change in VW volume on the production side.
W ( Δ w ) = 1 2 Δ w × L 0 × P 0 × V 0 + Δ w × L 1 × P 1 × V 1 W Δ L = 1 2 w 1 × Δ L × P 0 × V 0 + w 0 × Δ L × P 1 × V 1 W ( Δ P ) = 1 2 w 1 × L 1 × Δ P × V 0 + w 0 × L 0 × Δ P × V 1 W ( Δ V ) = 1 2 w 1 × L 1 × P 1 × Δ V + w 0 × L 0 × P 0 × Δ V
Furthermore, the L = I A 1 can be deduced from that
Δ L = L 1 L 0 = L 1 Δ A L 0
Decomposing the variation of the Leontief inverse matrix can be continued, and the corresponding direct consumption system and its variation decomposition are as follows.
W Δ A = W Δ A 1 d + W Δ A 1 d + W Δ A 1 s + W Δ A r 1 + W Δ A r s
Hence, matrix A 1 d retains only the submatrices A 11 , and 0 replaces the rest of the elements in A with those that reflect the structure of the use of domestically produced intermediate goods in the Chinese industrial sector. Matrix A 1 d retains submatrices on A r r (the diagonal matrix) except A 11 , and 0 replaces the remaining elements with those A in the matrix. It reflects the structure of the use of domestically produced intermediate products in other economies. Matrix A 1 s retains submatrices on the row vector where the A 11 is located, except A 11 . And 0 replaces the rest of A . It reflects the export structure of Chinese industrial intermediates, i.e., the forward linkage of China with other economies. A r 1 retains all submatrices except A 11 on the column vector where cell A 11 is located, replacing the remaining elements in A with zeros. It reflects the import structure of China’s industrial intermediates, i.e., China’s backward linkages with other economies. A r s then subtracts the above four matrices from A , reflecting the industrial linkages between the various foreign economies.
The final demand can also be decomposed into the final demand of China and that of other economies worldwide. The final demand column vector P can thus be decomposed into a final demand column vector for China P 1 and a foreign final demand column vector P r . The final demand size V can be decomposed into a final demand size for China V 1 and a foreign final demand size V r .
According to the above equation, the change in industrial VW can be decomposed into the ten influences individual factors, as shown in Table 1.

2.4. Data Sources

This study uses the world input–output (MRIO) table from 2000 to 2014 provided by the WIOD (world input–output database) and combines the 27 EU countries (included) into one region. Here, the data for China only covers mainland China (excluding Hong Kong, Macao, and Taiwan). Considering the study period, the UK was included in the EU region for the analysis. The MRIO table is divided into 56 sections based on the ISIC/Rev.4 standard, covering 22 industrial sectors. In order to explore the water resources effect of China’s industrial international trade, data on total industrial water use were obtained from the Water Resources Bulletin provided by the Ministry of Water Resources. Industrial water refers to the water used in manufacturing, processing, cooling, air conditioning, purification, and washing in the production process of industrial and mining enterprises, and is calculated according to the amount of new water taken, excluding the internal reuse water. In this case, the study does not focus on water quality and reuse. The missing water consumption data was calculated equivalently by combining data on wastewater discharge and total water consumption for each industrial sector [42]. The wastewater discharge data of industries were obtained from the China Environmental Yearbook and China Environmental Statistics Yearbook. The direct and complete water-use coefficients are converted according to the annual average exchange rate of CNY (Chinese Yuan) against USD (US Dollar) in the ChinaStock Market & Accounting Research Database. MRIO industries were matched against the National Economic Industry Standard, and 20 individual industrial sectors were identified (Table 2).

3. Results and Discussion

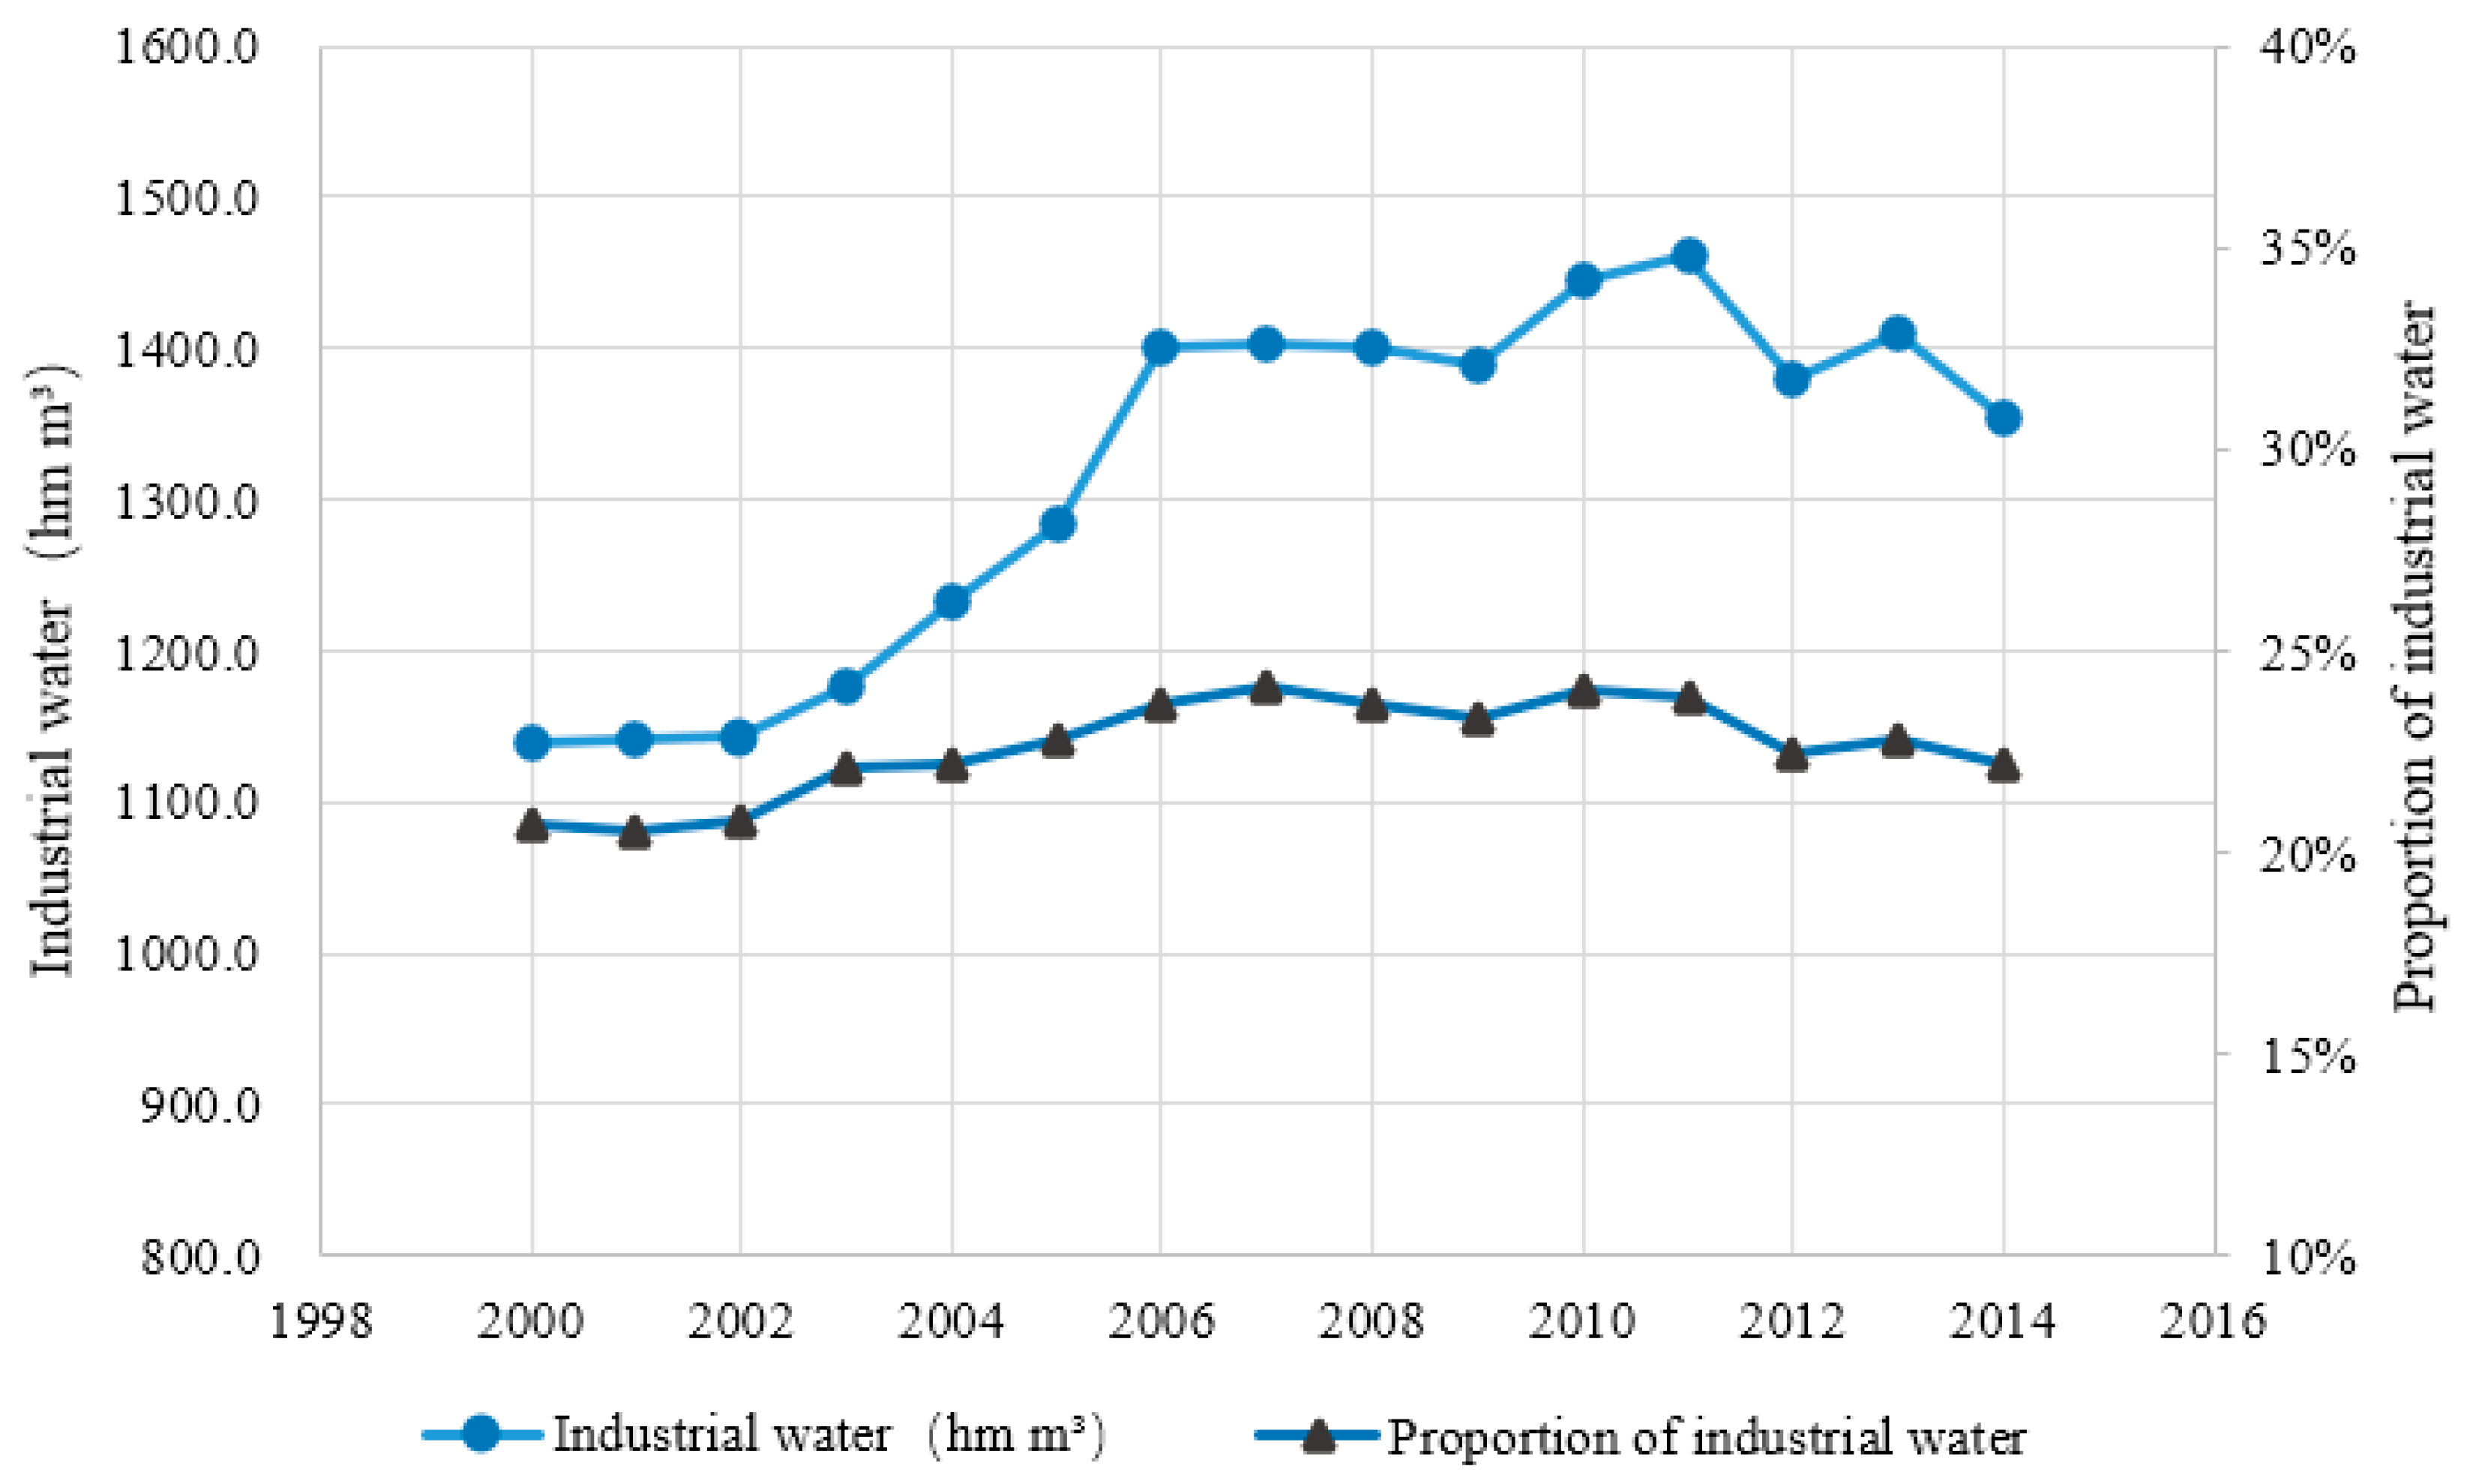
3.1. Analysis of Industrial Water Use in China

The decline in water consumption (or reduction of water-use coefficients) achieved by industrial high water consumption sectors is vital to the sustainable development of the Chinese economy. This section discusses China’s industrial water use in terms of total water consumption and water-use coefficients based on the MRIO model results.
Total water consumption in the industrial sector in China has changed relatively little in the years from 2000 to 2014 (Figure 1). Total water consumption rose from 1138.1 hm m3 in 2000 to 1400.7 hm m3 in 2006 and fluctuated from around 1400 hm m3, after which it showed a slight downward trend. However, the industrial sector’s value increased by more than 500% from CNY 4.0 trillion in 2000 to CNY 22.8 trillion in 2014. This indicates that water-use efficiency in the industrial sector has improved significantly under the national water-conservation strategy.
Further, the water-use coefficient is used to characterize the water-use efficiency of the industrial sector. The direct water-use coefficient ω d and complete water-use coefficient ω c for China’s industrial sector were calculated according to Equations (5) and (6), as shown in Table 3. ω d and ω c show a significant decline during the study period. ω d for industrial sectors decreased by approximately 50–90%, and ω c decreased by 30–90%, indicating a significant increase in the water-use efficiency of China’s industrial sector. Moreover, ω c was significantly larger than ω d , especially in S1, S8, S12 and S14. Hence, the correlations are strong across sectors for industrial production water use. Water resources implied by the production of final products in each sector include a large amount of indirect water use from other sectors.
Specifically, the S5 and S8 industries have the largest water consumption, with an annual water consumption of around 200 billion m3 in 2014. S5 is based on the supply and rough processing of primary raw materials, characterized by high resource consumption, high environmental pollution, and low added value. S8 is also burdened with high resource and environmental costs. Its production processes are accompanied by chemical pollution (e.g., heavy metal pollution and eutrophication), which may cause irreversible environmental damage. Moreover, manufacturing basic chemical raw materials has become a problem of overcapacity. Its industrial structure urgently needs adjustment under the dual pressure of the environment and economy. However, the two sectors have the most significant decline in the water consumption coefficients. The S5 also has a nearly 1700 m3 decline per CNY 10,000 of complete water consumption, followed by S8 with an over 1000 m3 decline per CNY 10,000. As for other sectors, S2, S1, and S3 also include high water consumption. Industrial water consumption in these three typical high-water-consuming sectors doubled during the study period. However, their water-use coefficients dropped significantly, with ω d dropping by 60–80%. This is related to increased consumption levels and demand restructuring.

3.2. The Component Analysis of Production-Side VW Flow

Next, this study decomposes the components of VW involved in China’s industrial production from the international trade perspective. According to Equations (7)–(10), the composition of total VW consumption in industrial production can be calculated (Figure 2).
According to Figure 2, China’s total industrial water consumption generally showed a trend of first growth and then decline. Specifically, the overall rise was 215 hm m3, an 18.9% increase. The total industrial water consumption of China is divided into four parts: DIW (domestically induced intermediate-production water), EIW (export-induced intermediate-production water), DFW (export-induced final-product water), and EFW (domestically induced final-product water).
The sum of EIW and EFW represents industrial VW exports. The Chinese industrial VW exports generally also showed a trend of first growth and then decline, accounting for 25–40% of total industrial water use. Specifically, the overall rise was 93.1 hm m3, a 32.2% increase. The EFW only showed a certain decline in the latter period, while the changes in EIW coincided more with the changes in VW exports, suggesting that the factor determining the “upward and then downward” trend in VW exports is EIW.
Specifically, VW exports consist of EIW and DIW. VW exports declined from 2000 to 2001, then steadily increased, reaching a peak of 551.3 hm m3 in 2006, accounting for 39.4% of total industrial water use that year. During this period, the sharp rise of EIW reflects the rapid strengthening of China’s industrial linkages with the rest of the world economy. It can be seen that since China acceded to the WTO in 2001, its economic and trade exchanges with other economies have increased, and therefore the VW flows implied in goods have also increased. During 2006–2008, VW exports presented a slow downward trend. It was followed by a precipitous decline in 2008–2009, with both EIW and EFW declining more sharply. Industrial VW can partially reflect short-term industrial production. Domestic intermediate-production water consumption increased significantly, while domestic final-demand water consumption only slightly decreased. Clearly, China stimulated its economy by expanding domestic demand and strengthening domestic inter-industry linkages, reflecting the importance of stable domestic demand and industrial integrity to sustain healthy economic development.

3.3. Evolution of China’s Industrial VW Trade

3.3.1. Overall VW Trade Volume Changes

Figure 3 presents the changes in import and export volume in industrial VW trade. During the study period, China’s VW imports and exports presented a trend of increasing and then decreasing, reaching a peak at around 2006 and 2007. Annual VW imports as a share of total industrial water use ranged from approximately 14% to 20%. VW exports were consistently greater than imports, with the annual net VW exports as a share of total industrial water use ranging from approximately 5% to 20%. They increased annually until 2007, from 5.7% to 22.8%, then gradually fell back, fluctuating at around 15%. Net VW exports rose nearly twofold from 64.4 hm m3 in 2000 to 189 hm m3 in 2014 and even exceeded 300 hm m3 2007. It is easy to see that China is a net exporter of industrial VW trade.
China is a large water user as a country with a large population and industrial sector. As an industrial net VW exporter, China has assumed the water pressure of other economies in international trade, neither of which is conductive to water conservation in China’s industrial sector. Therefore, the amount of VW exports and imports is relevant to formulating China’s domestic water resources strategy. After 2010, China’s total water use in the industrial sector declined, partly due to the decline in VW exports and the increase in VW imports, relieving some pressure on domestic industrial sector water use.

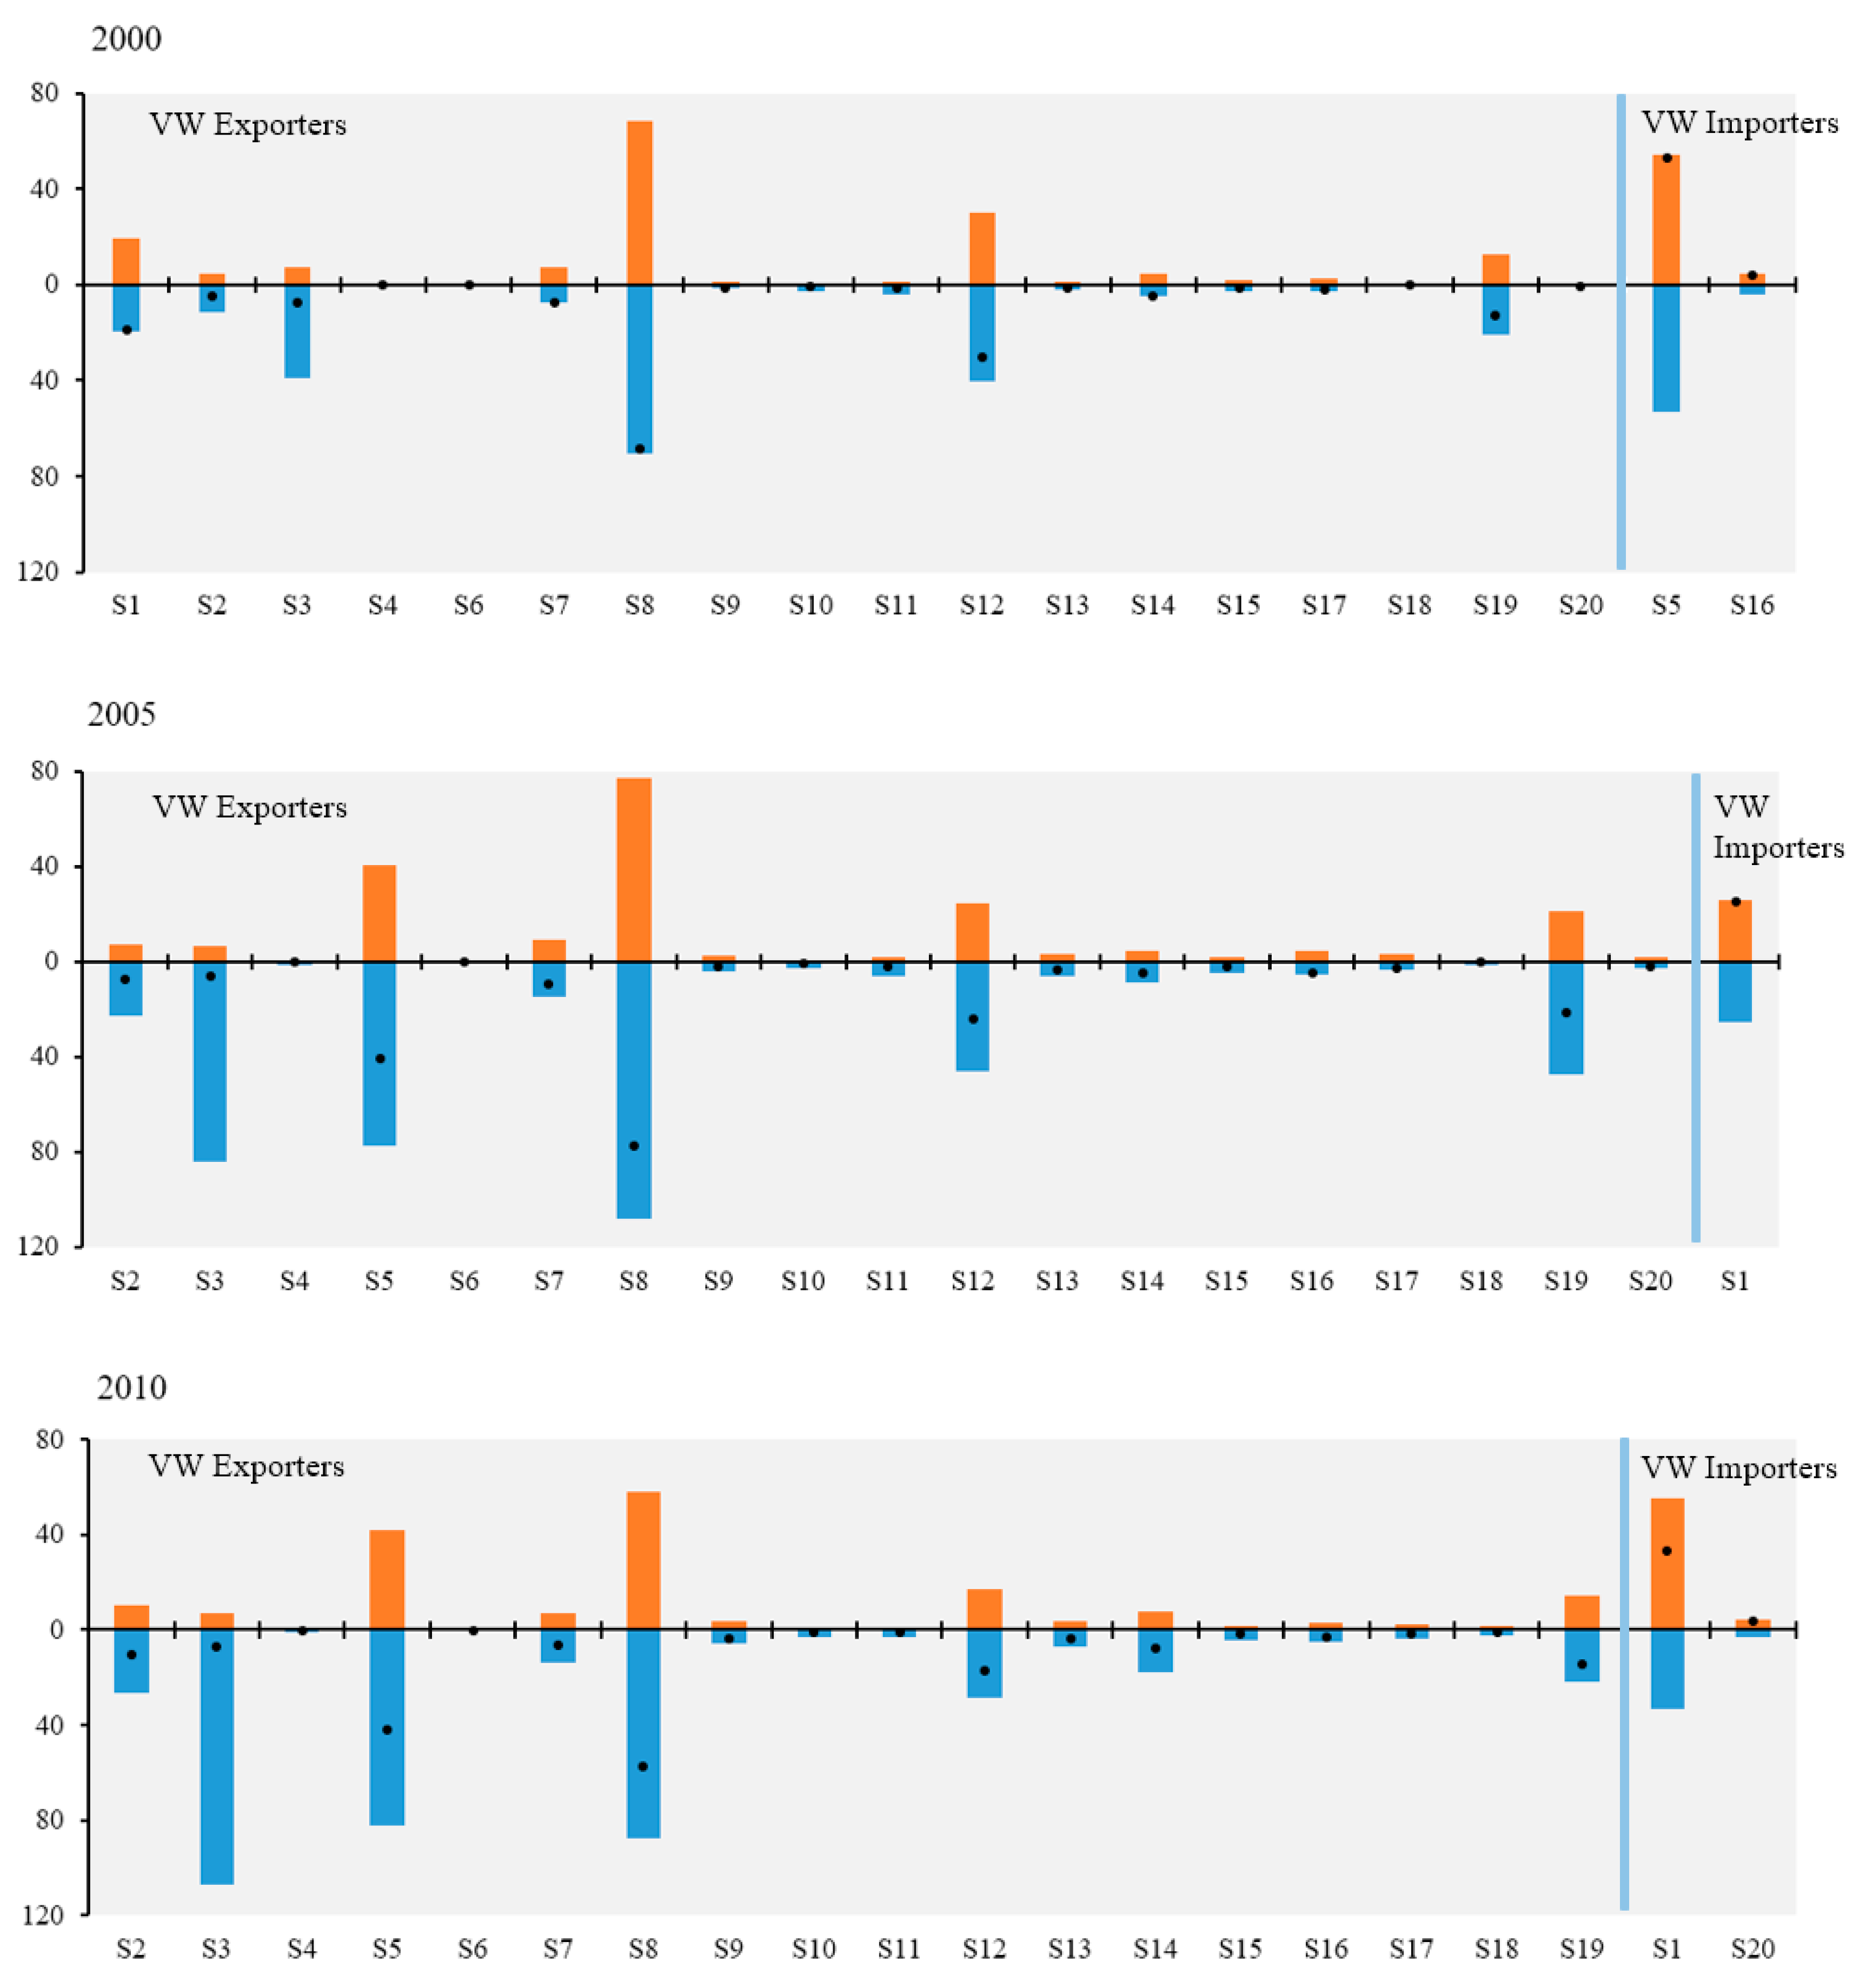
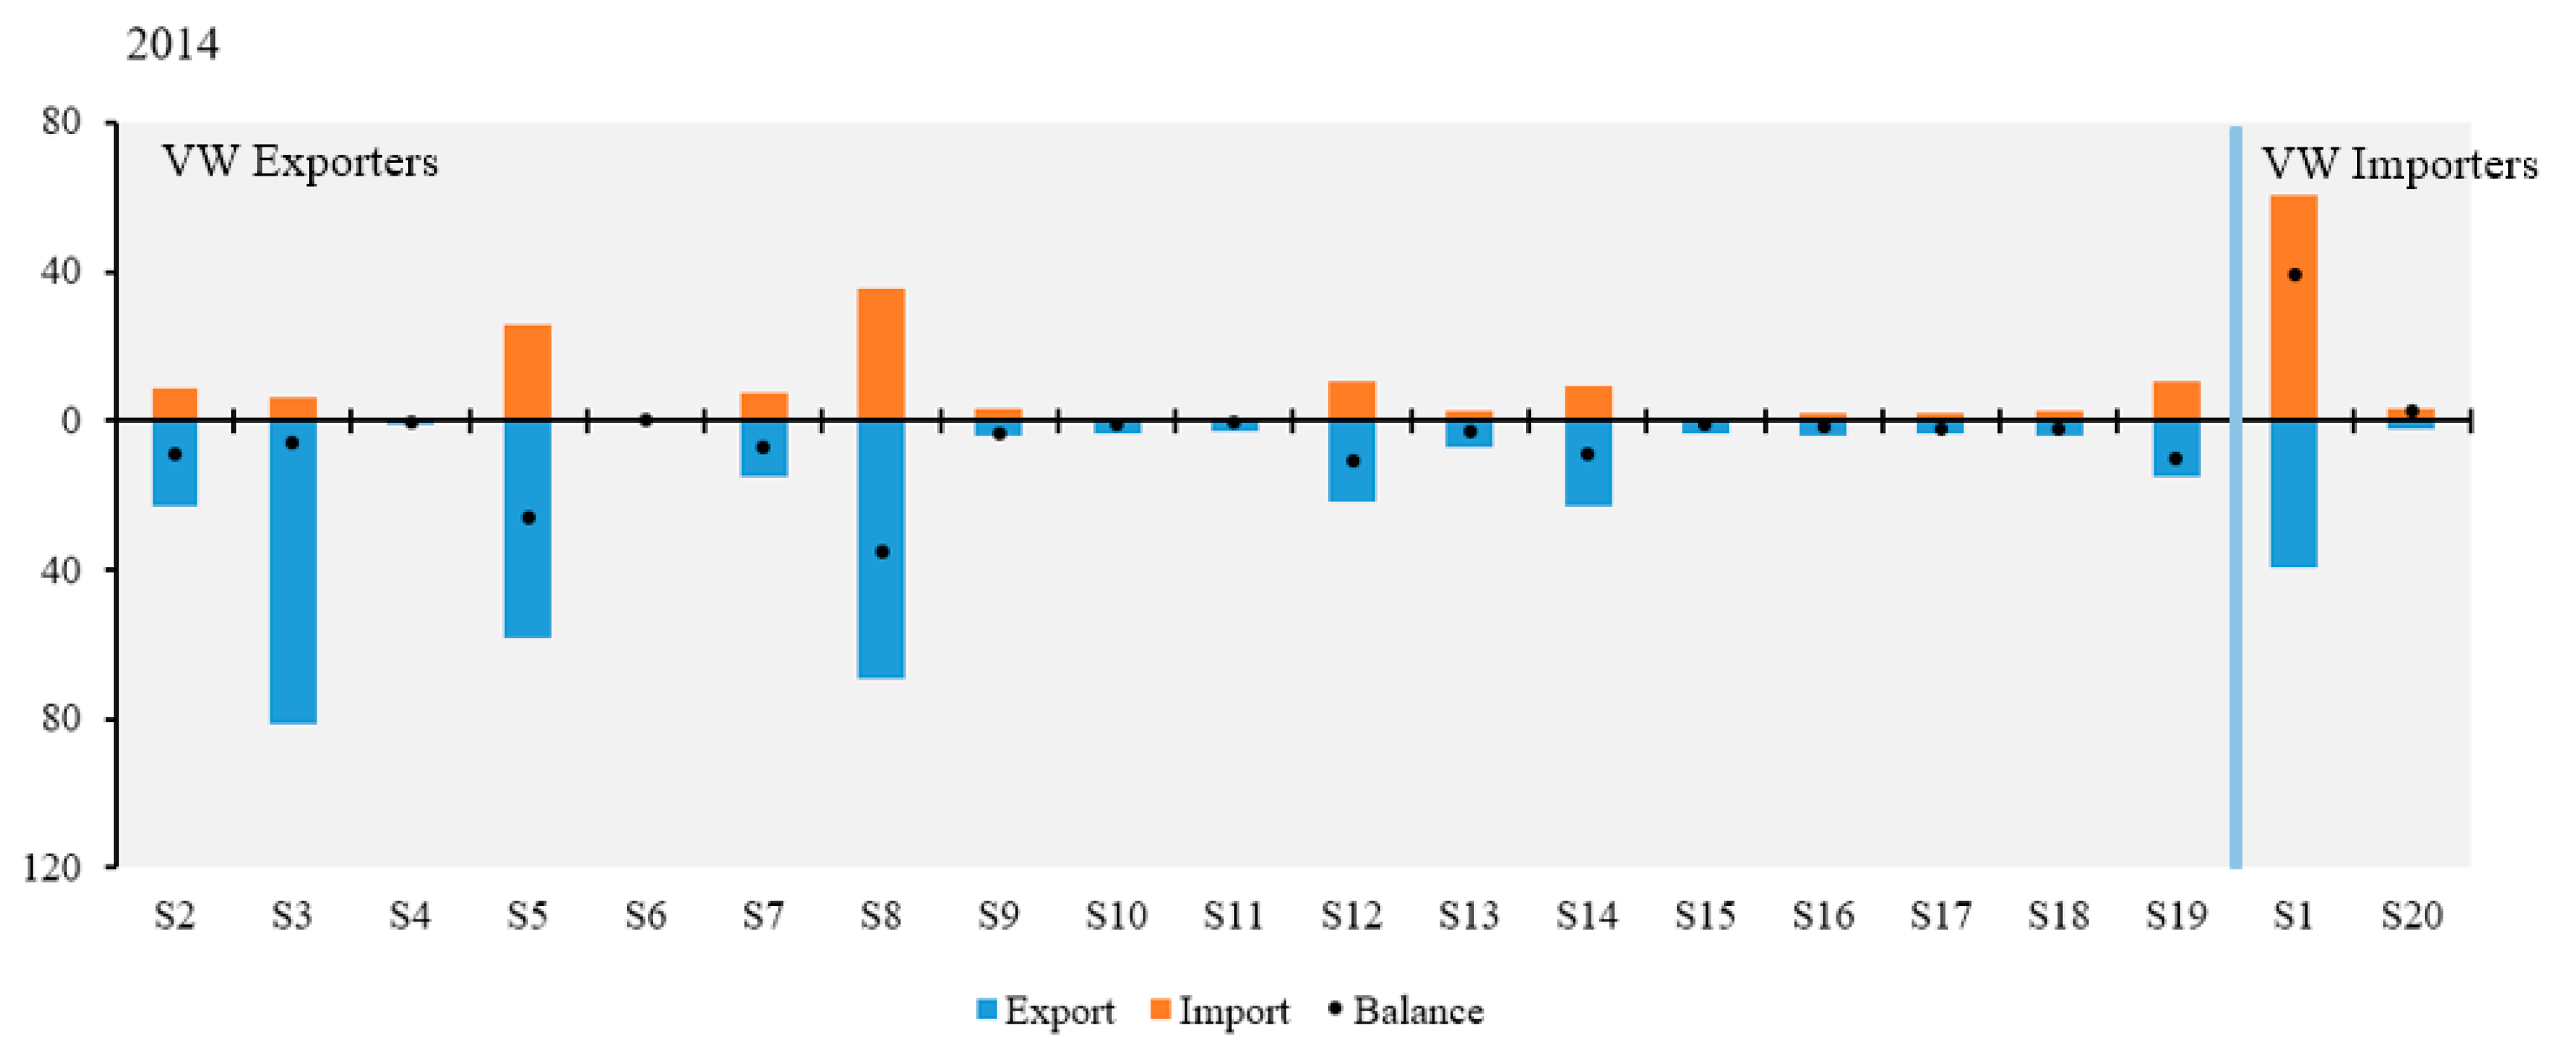
3.3.2. Industrial Sector VW Trade Volume Changes

From a sector perspective, Figure 4 presents the VW trade volume by industry sector. If exports are greater than imports, that sector is a net VW exporter, called VW Exporters, which is at the left of the light blue line, or it is a net VW importer, called VW Importers, which is at the right of the light blue line. The same is true for similar figures. S3, S8, and S5 industries are China’s leading industrial VW export sectors. In 2014, three sectors of VW exports accounted for more than 50% of total exports. Moreover, VW exports from these three sectors are also much larger than VW imports, contributing 75 percent of net VW exports. VW exports from S3 have increased and more than doubled during the study period. However, its imports have changed little, with 3.14 hm m3 to 7.52 hm m3 in net exports. S5 imports have been decreasing, with this sector moving from being a net VW importer in 2000 to a large net VW exporter in 2014. S8 is also experiencing increased net exports owing to decreased imports. However, S1, the largest importing sector of VW, has seen increased VW exports and imports and shifted from a net exporting sector to a net importing sector during the study period. In 2014, net VW imports reached 2.15 hm m3. S20 has moved from being a small net VW importer to a small net VW exporter. The water consumption of S20 is minimal, mainly because the sector’s product imports grew more than its product exports during the study period, becoming a net importer in the product trade.
In summary, China’s imports of VW are more often reflected in the supply or processing industries of raw materials and fuels; exports are more often reflected in high pollution and low value-added industries. Such a trade structure is not conducive to water conservation in China’s industrial sector, nor is it conducive to sustainable national economic development, and the industrial structure needs urgent adjustment. However, the net VW importer S1 brings positive environmental effects to the country in international trade. China’s per capita natural resources are scarce, and the water environment is tight. Under the national system and environmental regulations, VW trade provides a new path for alleviating pressure on water resources and ecological conditions domestically and finding a new impetus for long-term stable economic development. However, although we may enjoy positive environmental effects through VW trade, we must also consider the sustainable use of the world’s resources and avoid bringing irreversible resources and environmental damage to other economies, especially developing countries or regions.

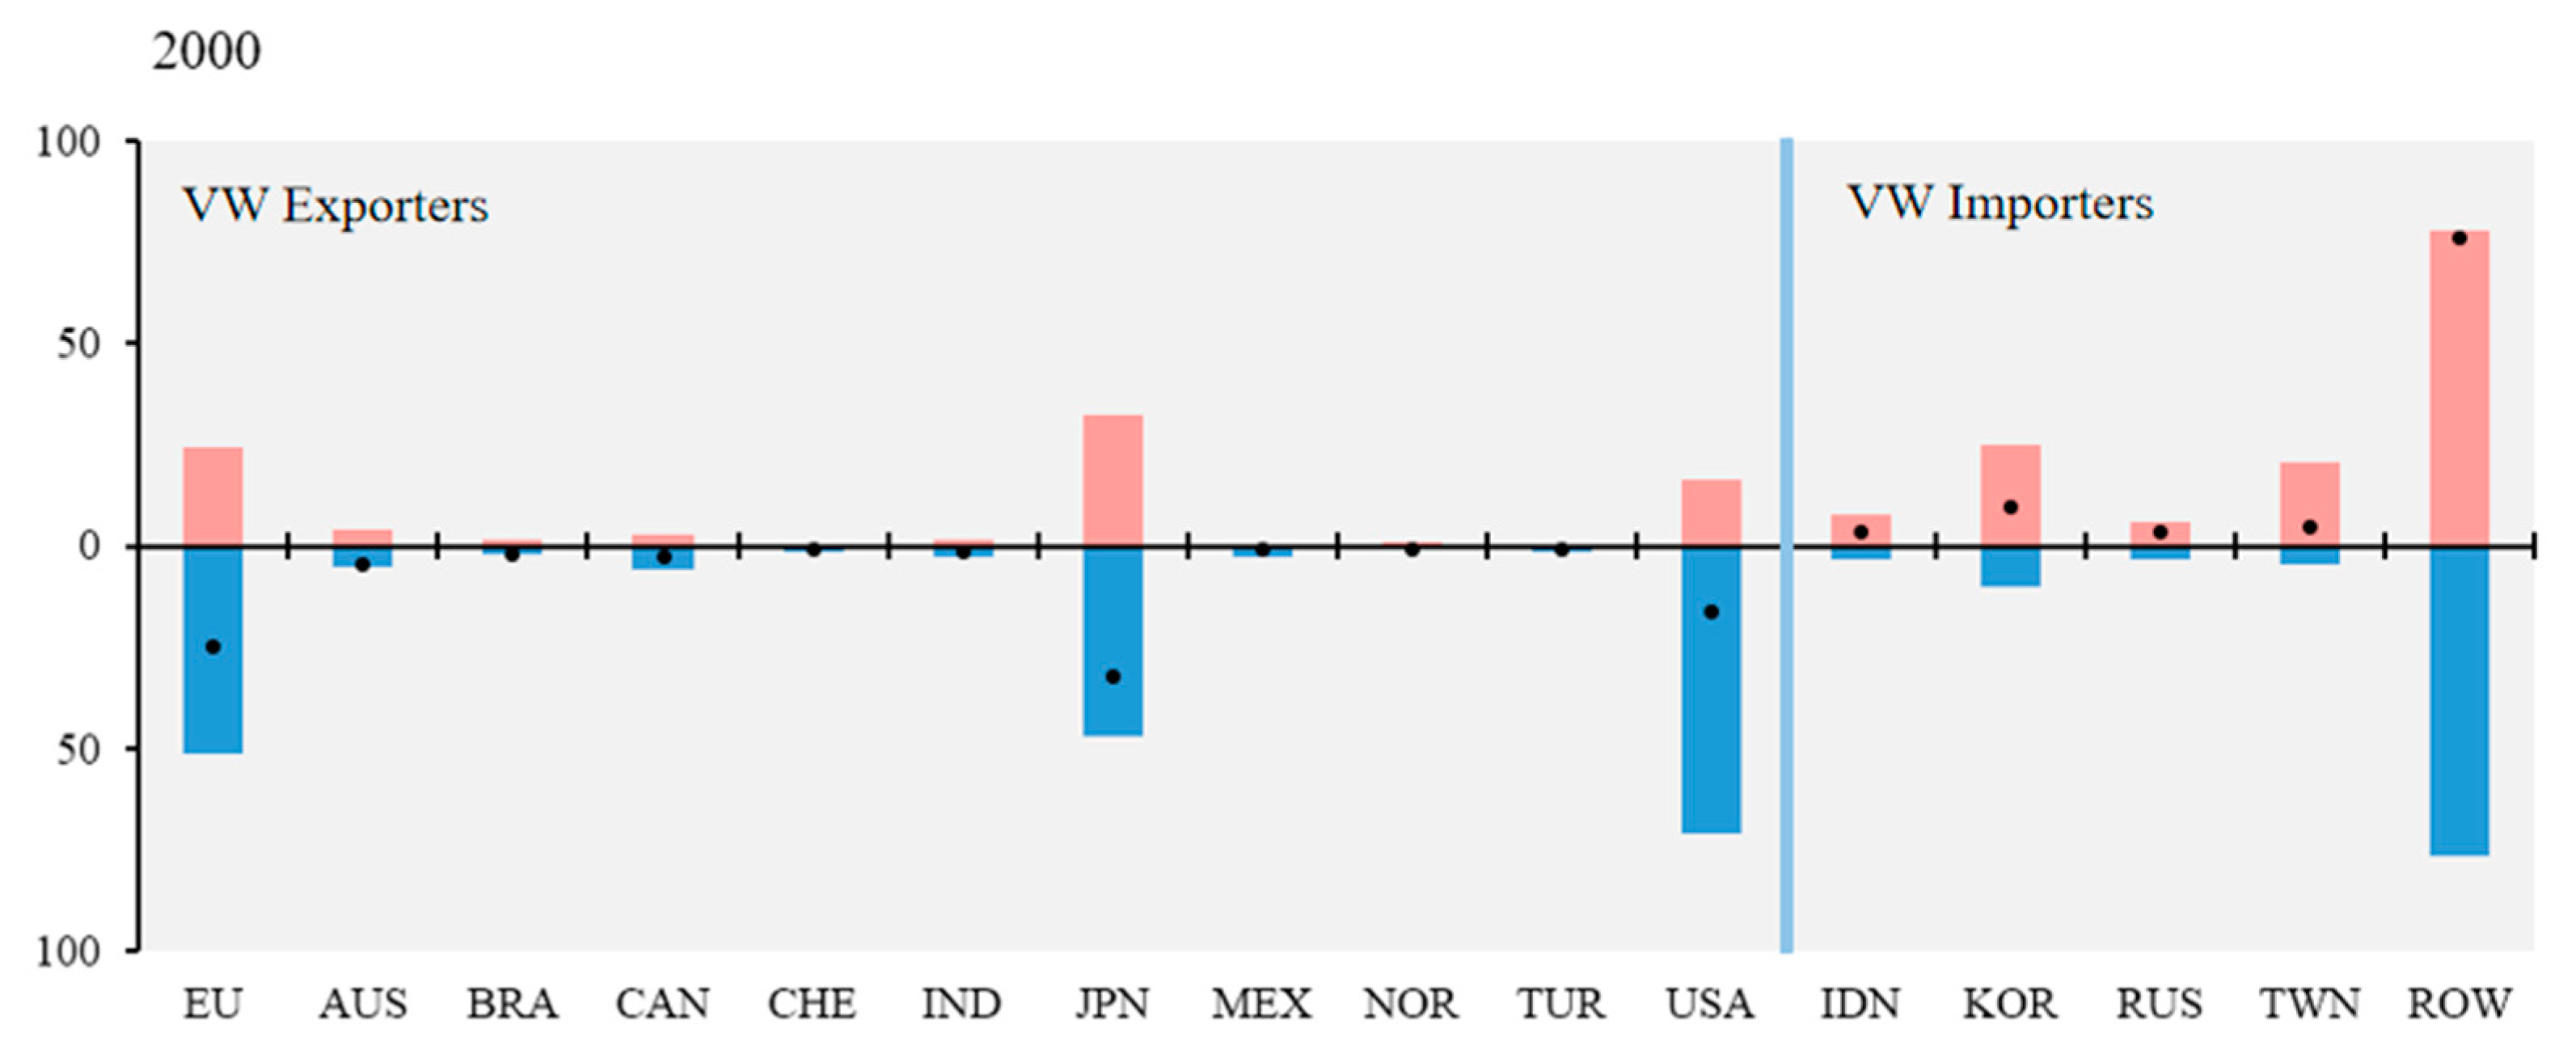
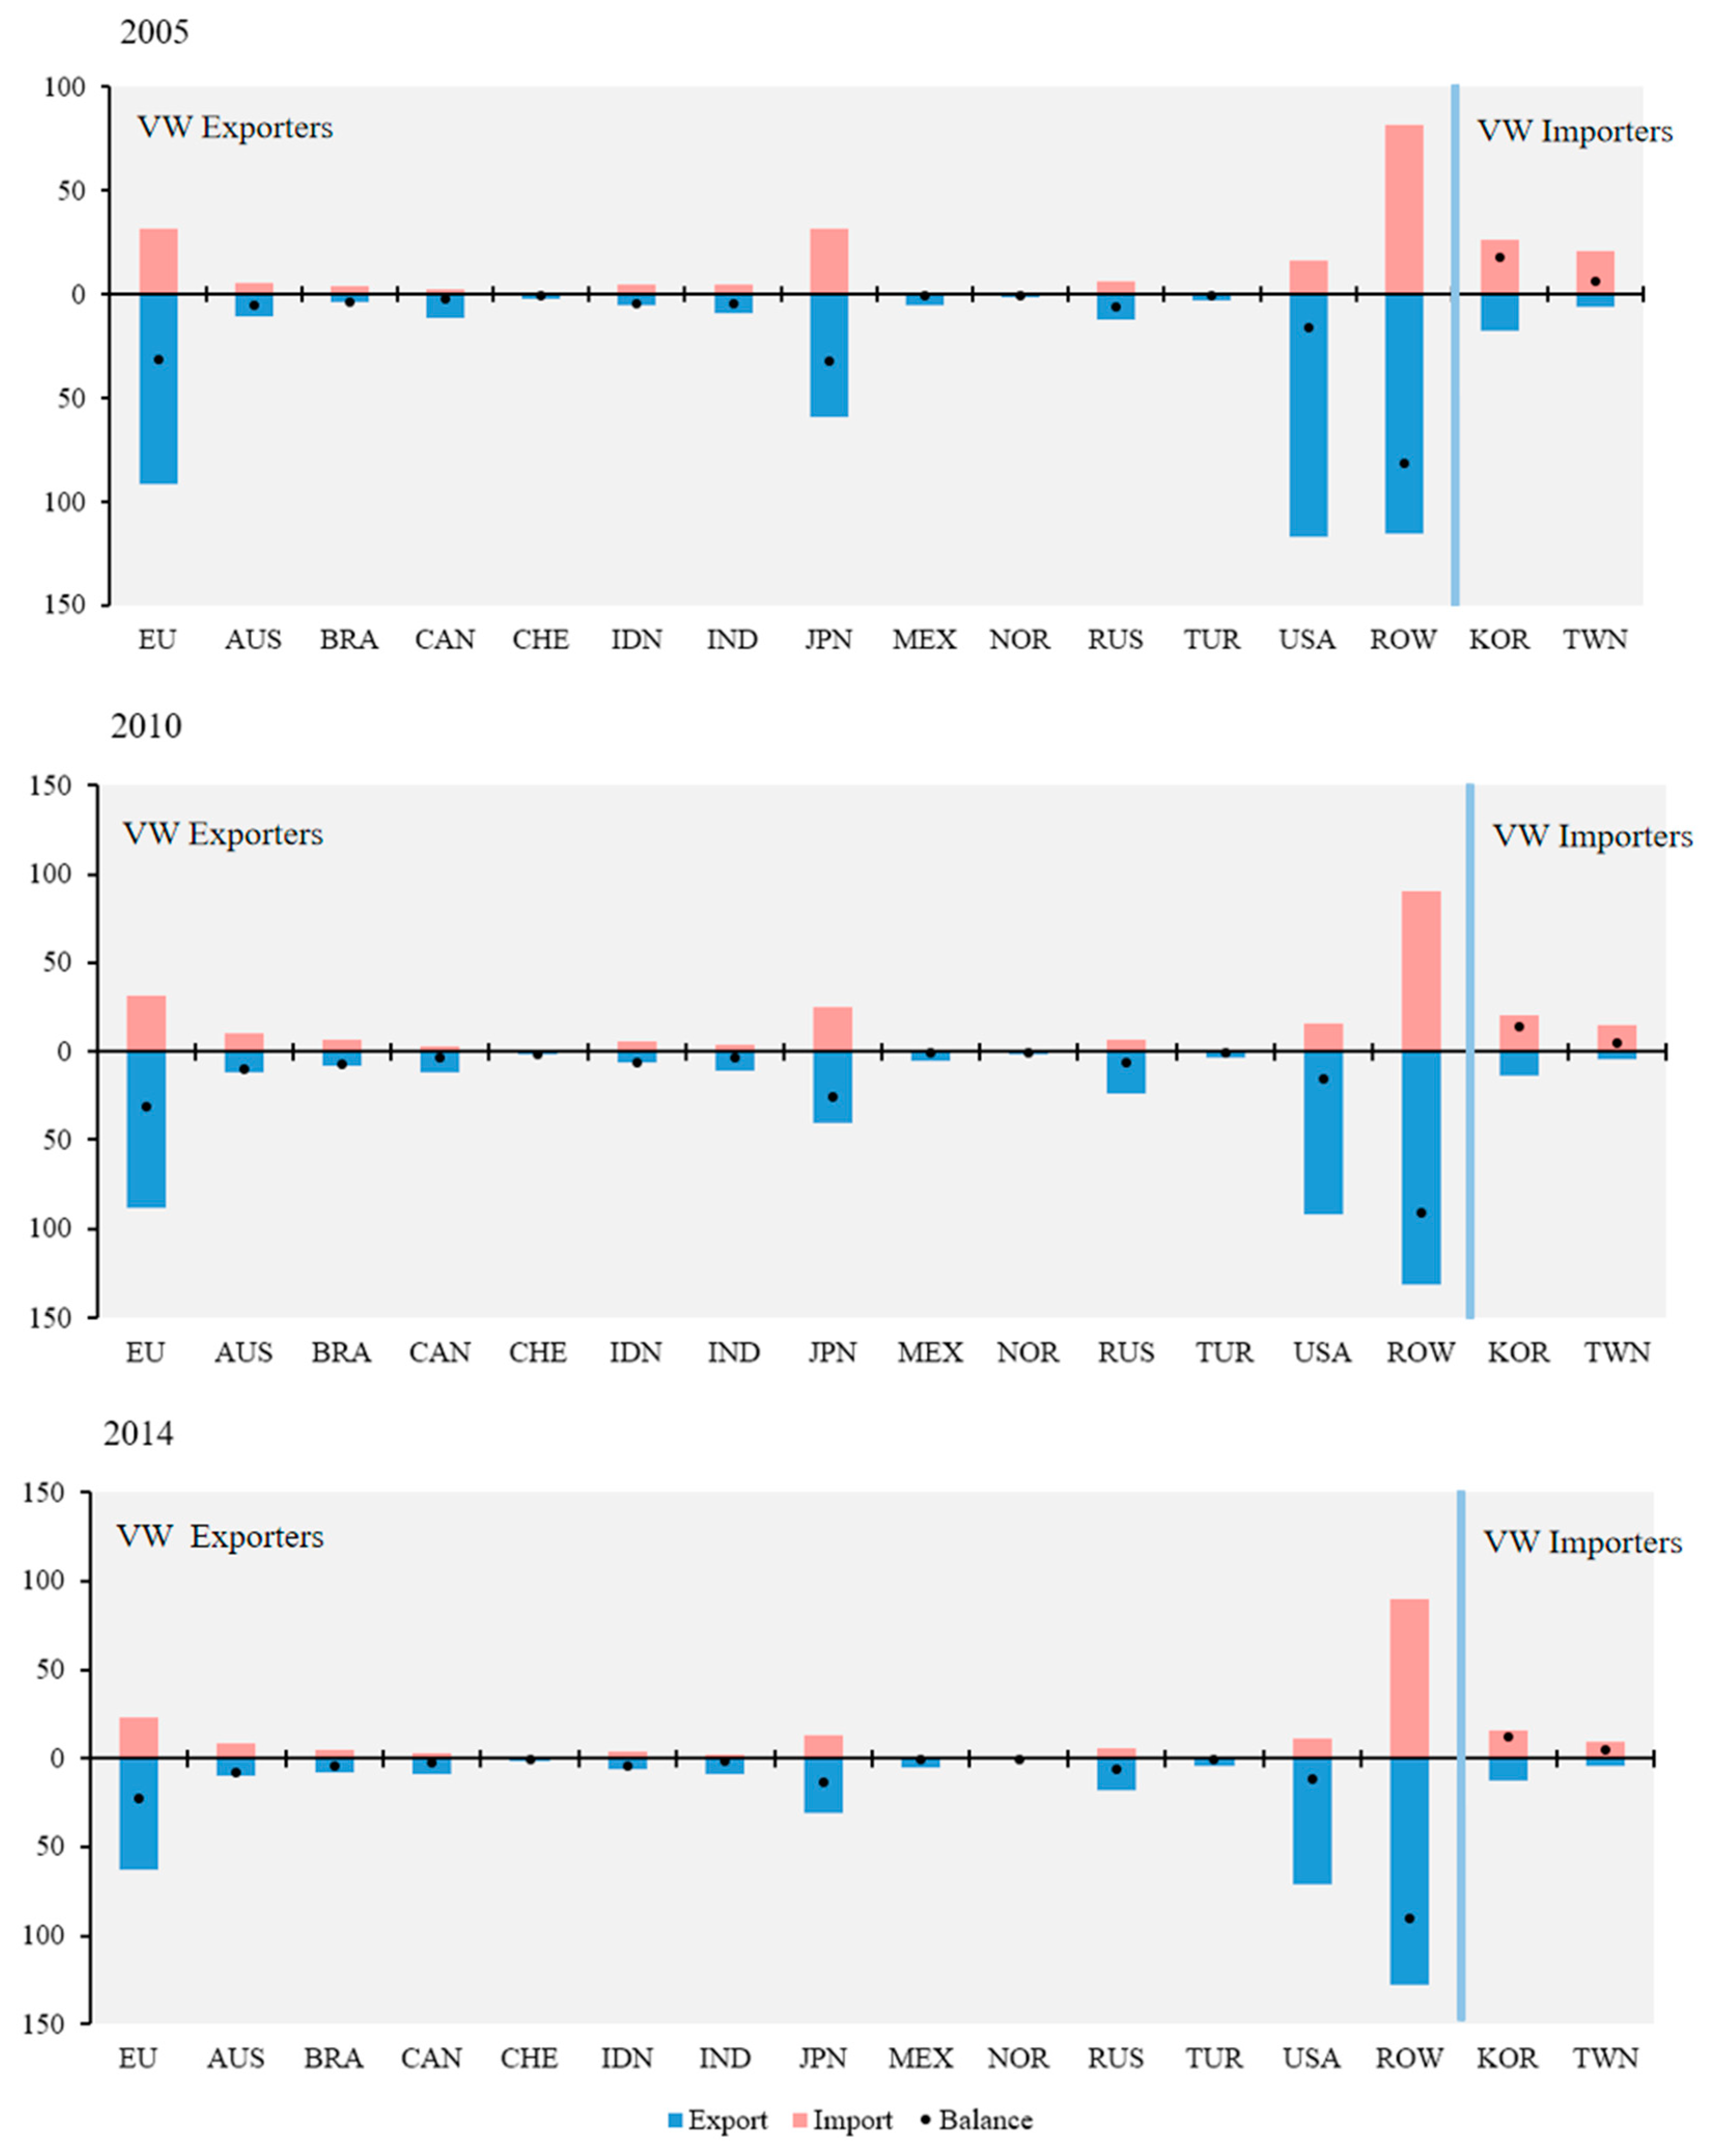
3.3.3. Changes in VW Trade Volume among Economies

From a spatial perspective, Figure 5 shows the VW flows embodied in China’s industrial product trade with other world economies. Evidently, China has the largest VW trade volume with ROW. China exported 76.4 hm m3 to the ROW and imported 77.9 hm m3, still on the importer’s side. By 2014, China exported 128.2 hm m3 to ROW and imported 90.0 hm m3, moving it to the VW exporter side, accompanied by 20.2% of net VW exports that year. China has maintained good trade relations with ROW, and most of these regions are water scarce, transferring some of the water pressure to China through trade.
China exported much industrial VW to the US, EU, Japan, and Russia. China’s net exports of VW to the US reached 54.9 hm m3 in 2000, which accounts for 85% of China’s total net VW exports. This proportion dropped to 31.5% in 2014. However, the US remained China’s largest net exporter. China’s VW exports to the EU have been increasing, with the net export increasing from 27.0 hm m3 to 40.7 hm m3, while a slight decrease in VW imports has been recorded. China’s net exports to the EU in 2014 accounted for 21.5%, second only to the US. China’s VW imports and exports with Japan are on a downward trend, with the net export share decreasing from 23% to 9.2%. Conversely, China’s VW exports to Russia have increased, and China has changed from a net importer to a net exporter. Net exports from China to Russia contributed 6.5% of total 2014 exports. In terms of imports, China imports industrial VW mainly from South Korea and Taiwan, China on a net basis.
This study analyzes the largest VW countries trading with China (Table 4 and Table 5), finding that countries with close VW trade with China have VW industry structures similar to ours.
ROW’s VW exports to China are mainly created by S1, S5, and S8, with S1 making a 48% contribution in 2014. Similarly, the sectors comprising the largest share of China’s VW exports to the ROW include S1, S5, and S8. Moreover, S3, S12, and S19 also created a lot of VW exports. This is related to China’s “One Belt, One Road” construction, which is accompanied by the export of many products, such as infrastructure and clothing, to African countries.
China’s net VW exports to the EU continued to increase during the study period. Early in the study, China’s VW exports to the European region were mainly reflected in S3, S5, S8, and S12. In 2014, they were mainly reflected in S3 and S8. China’s imports to the European region are mainly in S5, S8, and S12. Similar to the EU, China’s VW exports to Japan are also mainly reflected in S3, S5, S8, and S12, while China’s VW imports from Japan are mainly reflected in S5, S8, and S12. During the study period, China was a net exporter of VW to Japan, mainly through S5. After China acceded to the WTO, it became a vital world factory, providing substitute processing for the garment and chemical industries, and so on.
China’s VW exports to the US were mainly reflected in S3, S5, S8, and S12 in 2000. In 2014, the main export sector joined S14, meaning that some electronic and optical equipment exports became available. VW imports from the US are mainly provided by S5 and S8, and the import volume is relatively small. Industrial VW trade between China and the US is mainly in the raw material and fuel industries and some basic processing industries, which are also severe water-consuming industries.
The findings show that sectors generating larger VW imports and exports tend to have higher water consumption coefficients, evident in transactions with countries with larger VW trade volumes with China (e.g., Japan and the United States). Combining these two analyses, unit imports and exports of industrial sectors with high water-consumption coefficients have a greater impact on VW import and export volume. It implies that a large amount of VW is implied in the unit output of those sectors with high water-consumption coefficients. This finding provides an idea for implementing water-conservation strategies focusing on the production of high water-consumption sectors. Specifically, green technological innovation is encouraged to improve water-use efficiency in water-consuming sectors. Trade restructuring and industrial transfer can reduce net VW exports from high water-consumption sectors.

3.4. Analysis of Factors Influencing the Change in VW Export

As mentioned, China’s industrial sector is a net exporter of world VW trade. However, in 2009, China’s total industrial water use and VW exports began slowly declining. This may be attributable to the shift in trade focus or restructuring of industry, or related to the world’s water-conservation philosophy and China’s increasingly sophisticated and strict water-conservation policies. In order to investigate the reasons for declined industrial VW and explore the industrial water-conservation methods, this study conducted an SDA model of the intrinsic factors affecting China’s industrial VW exports based on Equations (11)–(17) (Figure 6).
During the study period, China’s industrial VW exports rose by 93.1 hm m3. The increased forward linkage between China and other economies was the most important reason for the increased VW exports, contributing to more than 660% growth of VW exports. The forward linkage effect increased industrial VW exports by approximately 150 hm m3 over 2000–2005, contributing nearly 85%. Although total VW export volume decreased during 2005–2010 and 2010–2014, forward linkage still shows the effect of promoting export volume growth. The industrial VW increased by approximately 97 and 63 hm m3, respectively. In addition, important reasons for rising VW exports include changes in the structure of foreign final-demand sources and expansion of foreign final demand. A positive effect during the 15 years increased VW exports by approximately 450 hm m3 and 320 hm m3, respectively.
Changes in water-use coefficients in the industrial sector are the most critical cause of dampening VW export growth. They contribute more than 1500% to the decline in VW exports over the study period. The coefficient effect reduced VW exports by approximately 310 hm m3 during 2000–2005, about 380 hm m3 during 2005–2010, and about 260 hm m3 during 2010–2014. Increased industrial water-use efficiency in China is likely a result of advances in production technology, indicating that technological progress and green development of industrial production have vigorously and increasingly promoted the intensive use of water resources, contributing to industrial water conservation.
Structural changes in using domestically produced intermediate products in China also significantly positively affect VW’s export growth. VW volume increased by approximately 130 m3 during the study period, with a 140% contribution. However, the change in the structure of foreign use of domestically produced intermediate products on VW exports is extremely weak. Hence, China can reduce VW exports by adjusting the structure of the use of domestically produced intermediate products in the industrial sector. Additionally, changes in the industrial linkages between various foreign economies have a weak positive effect on the growth of VW exports. Meanwhile, changes in backward linkages between China and other economies shift from a weak positive effect to a weak negative effect on the VW export increase.

4. Conclusions

This study constructed an MRIO model of China’s VW trade with countries worldwide based on world input–output tables and Chinese industrial data from 2000 to 2014, combined with the application of the Leontief inverse matrix to measure the VW volume and composition of Chinese production-side industries, and calculated the VW flows of major countries globally. Further, the contribution of the changes in the endogenous drivers in the input–output model to the changes in production-side VW was analyzed using the SDA method. The following are the main findings:
  • First, China is a net exporter of industrial VW trade. VW exports from the Chinese industry exhibited an initially rising and then declining trend during the study period, peaking in 2006. Additionally, the proportion of EIW (export-induced intermediate-production water) in VW export is much higher than EFW (domestically induced final-product water). The former is the main reason for determining the change in total VW export.
  • Second, the sectors with high VW exports from China mainly manufacture textiles and apparel, paper products, and chemical products. These industries are characterized by high water consumption, high pollution, and low added value. This trade structure is not conducive to water conservation in China’s industrial sector, and the industrial structure should be gradually adjusted to save water resources. In particular, mining and quarrying is the only sector with a clear net import trend that brings positive environmental effects to China in international trade.
  • Third, in terms of VW trade, the total amount of VW trade between China and ROW is the largest. China mainly exports industrial VW to the US, the EU, ROW, and Japan on a net basis. VW exports to the US and Japan are declining, but exports to the EU and Russia are increasing. Mainland China imports VW mainly from South Korea and Taiwan, China.
  • Fourth, regarding drivers, a decrease in water-use coefficients across all Chinese industry sectors is the most crucial factor inhibiting VW exports’ increase from the Chinese industry. The increase in China’s forward linkages with other economies, the changes in the structure of foreign final demand sources, and the expansion of the size of foreign final demand are the main reason for increased VW exports. However, these roles are gradually diminishing. A change in the structure of China’s use of domestically produced intermediate products has a more significant positive effect on the increase in VW. Conversely, the change in the structure of foreign use of domestically produced intermediate products has an extremely weak effect on VW export.
Based on our research conclusion, we believe that industrial VW trade can relieve the pressure on domestic water resources through the following three ways:
  • First, governments should focus on water for intermediate production when implementing the VW strategy. Water saving can be achieved by improving the water efficiency of industrial intermediate production links.
  • Second, the forward correlation between industries in China and other economies can be adjusted. The export structure of intermediate products can be adjusted in the direction of water saving, i.e., the export of intermediate products can be reduced, and the export of final products can be increased. It will reduce VW exports and increase the added value of domestic industrial production chains.
  • Third, policymakers can adjust the industrial structure to achieve water conservation in China. The export of textiles and clothing, paper products, and chemical products should be moderately reduced, and the import of mining and quarrying products from water-rich countries should be maintained.
However, the implementation of the VW strategy should not only consider the flow of water resources but also the economic benefits. This study believes future studies may integrate VW trade networks with global value chains to find a balance between resource flows and value-added flows. In addition, considering water pollution and reuse in VW trade, some other topics, such as water pollution transfer and water-use efficiency, can be considered in the future. More practical conclusions and suggestions can be put forward based on the principle of balanced development of the environment and economy.

Author Contributions

Conceptualization, J.J.; methodology, C.W.; software, C.W.; validation, C.W. and J.Z.; formal analysis, C.W.; investigation, J.J.; resources, J.J.; data curation, C.W.; writing—original draft preparation, C.W.; writing—review and editing, J.Z.; visualization, C.W.; supervision, J.J.; project administration, J.J.; funding acquisition, J.J. All authors have read and agreed to the published version of the manuscript.

Funding

This research was funded by National Natural Science Foundation of China, grant number 71873127.

Data Availability Statement

The data that support the findings of this study are available on request from the corresponding author.

Conflicts of Interest

The authors declare no conflict of interest.

References

  1. Mekonnen, M.M.; Hoekstra, A.Y. Four billion people facing severe water scarcity. Sci. Adv. 2022, 2, e1500323. [Google Scholar] [CrossRef] [PubMed]
  2. Distefano, T.; Kelly, S. Are we in deep water? Water scarcity and its limits to economic growth. Ecol. Econ. 2017, 142, 130–147. [Google Scholar] [CrossRef]
  3. Sun, Y.; Zhi, Y.; Zhao, Y. Indirect effects of carbon taxes on water conservation: A water footprint analysis for China. J. Environ. Manag. 2020, 279, 111747. [Google Scholar] [CrossRef]
  4. Zou, D.; Cong, H. Evaluation and influencing factors of China’s industrial water resource utilization efficiency from the perspective of spatial effect. Alex. Eng. J. 2021, 60, 173–182. [Google Scholar] [CrossRef]
  5. Kitamori, K.; Manders, T.; Dellink, R.; Tabeau, A.A. OECD Environmental Outlook to 2050: The Consequences of Inaction; OECD: Paris, France, 2012. [Google Scholar] [CrossRef]
  6. Allan, J.A. Fortunately there are substitutes for water otherwise our hydro-political futures would be impossible. Priorities Water Resour. Alloc. Manag. 1993, 13, 26. [Google Scholar]
  7. Zhang, C.; Anadon, L.D. A multi-regional input–output analysis of domestic virtual water trade and provincial water footprint in China. Ecol. Econ. 2014, 100, 159–172. [Google Scholar] [CrossRef]
  8. Allan, J.A. Virtual Water: A Long Term Solution for Water Short Middle Eastern Economies, British Association Festival of Science; University of Leeds: Leeds, UK, 1997. [Google Scholar]
  9. Wang, R.; Zimmerman, J. Hybrid analysis of blue water consumption and water scarcity implications at the global, national, and basin levels in an increasingly globalized world. Environ. Sci. Technol. 2016, 50, 5143–5153. [Google Scholar] [CrossRef]
  10. Caro, D.; Alessandrini, A.; Sporchia, F.; Borghesi, S. Global virtual water trade of avocado. J. Clean. Prod. 2021, 285, 124917. [Google Scholar] [CrossRef]
  11. Zhai, M.; Huang, G.; Liu, L.; Xu, X.; Li, J. Transfer of virtual water embodied in food: A new perspective. Sci. Total Environ. 2019, 659, 872–883. [Google Scholar] [CrossRef]
  12. Duarte, R.; Pinilla, V.; Serrano, A. Globalization and natural resources: The expansion of the Spanish agrifood trade and its impact on water consumption, 1965–2010. Reg. Environ. Chang. 2016, 16, 259–272. [Google Scholar] [CrossRef]
  13. Dalin, C.; Wada, Y.; Kastner, T.; Puma, M.J. Groundwater depletion embedded in international food trade. Nature 2017, 543, 700–704. [Google Scholar] [CrossRef] [PubMed]
  14. Wang, H.; Ang, B.W.; Su, B. Assessing drivers of economy-wide energy use and emissions: IDA versus SDA. Energ. Policy 2017, 107, 585–599. [Google Scholar] [CrossRef]
  15. Masud, M.B.; Wada, Y.; Goss, G.; Faramarzi, M. Global implications of regional grain production through virtual water trade. Sci. Total Environ. 2019, 659, 807–820. [Google Scholar] [CrossRef] [PubMed]
  16. Ren, Y.; Huang, K.; Yu, Y.; Hu, J. Inter-Regional Agricultural Virtual Water Flow in China Based on Volumetric and Impact-Oriented Multi-Regional Input-Output (MRIO) Approach. Water 2020, 12, 251. [Google Scholar] [CrossRef]
  17. Cai, B.; Zhang, W.; Hubacek, K.; Feng, K.; Li, Z.; Liu, Y.; Liu, Y. Drivers of virtual water flows on regional water scarcity in China. J. Clean. Prod. 2019, 207, 1112–1122. [Google Scholar] [CrossRef]
  18. Tian, X.; Sarkis, J.; Geng, Y.; Qian, Y.; Gao, C.; Bleischwitz, R.; Xu, Y. Evolution of China’s water footprint and virtual water trade: A global trade assessment. Environ. Int. 2018, 121, 178–188. [Google Scholar] [CrossRef]
  19. Liao, X.; Han, A.; Li, S.; Du, Y.; Chai, L. Unveiling economic co-benefits of virtual water trades: An empirical analysis on China’s JingJinJi Megalopolis. Water 2021, 13, 3140. [Google Scholar] [CrossRef]
  20. Deng, G.; Wang, L.; Xu, X. Linkage effect of virtual water trade in China’s industrial products—Based on generalized hypothetical extraction method. Ecol. Indic. 2018, 93, 1302–1310. [Google Scholar] [CrossRef]
  21. Garcia, S.; Mejia, A. Characterizing and modeling subnational virtual water networks of US agricultural and industrial commodity flows. Adv. Water Resour. 2019, 130, 314–324. [Google Scholar] [CrossRef]
  22. Miglietta, P.P.; Morrone, D. Managing water sustainability: Virtual water flows and economic water productivity assessment of the wine trade between Italy and the Balkans. Sustainability 2018, 10, 543. [Google Scholar] [CrossRef]
  23. Hosseinian, S.M.; Nezamoleslami, R. Water footprint and virtual water assessment in cement industry: A case study in Iran. J. Clean. Prod. 2018, 172, 2454–2463. [Google Scholar] [CrossRef]
  24. Nezamoleslami, R.; Hosseinian, S.M. An improved water footprint model of steel production concerning virtual water of personnel: The case of Iran. J. Environ. Manag. 2020, 260, 110065. [Google Scholar] [CrossRef] [PubMed]
  25. Gerbens-Leenes, P.W.; Hoekstra, A.Y.; Bosman, R. The blue and grey water footprint of construction materials: Steel, cement and glass. Water Resour. Ind. 2018, 19, 1–12. [Google Scholar] [CrossRef]
  26. Deng, G.; Lu, F.; Wu, L.; Xu, C. Social network analysis of virtual water trade among major countries in the world. Sci. Total Environ. 2021, 753, 142043. [Google Scholar] [CrossRef]
  27. Chen, W.; Wu, S.; Lei, Y.; Li, S. Virtual water export and import in China’s foreign trade: A quantification using input-output tables of China from 2000 to 2012. Resour. Conserv. Recycl. 2018, 132, 278–290. [Google Scholar] [CrossRef]
  28. Hubacek, K.; Feng, K. Comparing apples and oranges: Some confusion about using and interpreting physical trade matrices versus multi-regional input–output analysis. Land Use Policy 2016, 50, 194–201. [Google Scholar] [CrossRef]
  29. Antonelli, M.; Tamea, S.; Yang, H. Intra-EU agricultural trade, virtual water flows and policy implications. Sci. Total Environ. 2017, 587, 439–448. [Google Scholar] [CrossRef]
  30. Guo, S.; Shen, G.Q. Multiregional input–output model for China’s farm land and water use. Environ. Sci. Technol. 2015, 49, 403–414. [Google Scholar] [CrossRef]
  31. Lutter, S.; Pfister, S.; Giljum, S.; Wieland, H.; Mutel, C. Spatially explicit assessment of water embodied in European trade: A product-level multi-regional input-output analysis. Glob. Environ. Chang. 2016, 38, 171–182. [Google Scholar] [CrossRef]
  32. Liu, X.; Du, H.; Zhang, Z.; Crittenden, J.C.; Lahr, M.L.; Moreno-Cruz, J.; Guan, D.; Mi, Z.; Zuo, J. Can virtual water trade save water resources? Water Res. 2019, 163, 114848. [Google Scholar] [CrossRef]
  33. Han, M.Y.; Chen, G.Q.; Li, Y.L. Global water transfers embodied in international trade: Tracking imbalanced and inefficient flows. J. Clean. Prod. 2018, 184, 50–64. [Google Scholar] [CrossRef]
  34. Tamea, S.; Carr, J.A.; Laio, F.; Ridolfi, L. Drivers of the virtual water trade. Water Resour. Res. 2014, 50, 17–28. [Google Scholar] [CrossRef]
  35. Suweis, S.; Konar, M.; Dalin, C.; Hanasaki, N.; Rinaldo, A.; Rodriguez-Iturbe, I. Structure and controls of the global virtual water trade network. Geophys. Res. Lett. 2011, 38, L10403. [Google Scholar] [CrossRef]
  36. Tian, X.; Chang, M.; Lin, C.; Tanikawa, H. China’s carbon footprint: A regional perspective on the effect of transitions in consumption and production patterns. Appl. Energ. 2014, 123, 19–28. [Google Scholar] [CrossRef]
  37. Chen, S.; Chen, B. Tracking inter-regional carbon flows: A hybrid network model. Environ. Sci. Technol. 2016, 50, 4731–4741. [Google Scholar] [CrossRef] [PubMed]
  38. Cheng, H.; Dong, S.; Li, F.; Yang, Y.; Li, S.; Li, Y. Multiregional input-output analysis of spatial-temporal evolution driving force for carbon emissions embodied in interprovincial trade and optimization policies: Case study of northeast industrial district in China. Environ. Sci. Technol. 2018, 52, 346–358. [Google Scholar] [CrossRef]
  39. Qian, Y.; Dong, H.; Geng, Y.; Zhong, S.; Tian, X.; Yu, Y.; Chen, Y.; Moss, D.A. Water footprint characteristic of less developed water-rich regions: Case of Yunnan, China. Water Res. 2018, 141, 208–216. [Google Scholar] [CrossRef]
  40. Zhang, Y.; Zhou, Q.; Feng, W. Virtual water flows at the county level in the Heihe River Basin, China. Water 2017, 9, 687. [Google Scholar] [CrossRef]
  41. Dietzenbacher, E.; Los, B. Structural decomposition techniques: Sense and sensitivity. Econ. Syst. Res. 1998, 10, 307–324. [Google Scholar] [CrossRef]
  42. Lu, Q.; Liu, F.; Li, Y.; Wang, D. Study on the Relationship between Water Resources Utilization and Economic Growth in Tarim River basin from the Perspective of Water Footprint. Water 2022, 14, 1655. [Google Scholar] [CrossRef]
Figure 1. Total and share of industrial water (2000–2014).
Water 15 01975 g001
Figure 2. Industrial VW composition.
Water 15 01975 g002
Figure 3. Industrial VW flows in proportion to industrial water in China.
Water 15 01975 g003
Figure 4. VW flows for industrial sectors (hm m3). (Note: the blue bars represent the VW exports by sector, the orange bars represent the VW imports by sector, and the black dots mark their balance points.)
Water 15 01975 g004aWater 15 01975 g004b
Figure 5. VW trade flows between China and other economies (hm m3). Note that other economies are EU (The European Union), AUS (Australia), BRA (Brazil), CAN (Canada), CHE (Switzerland), IDN (Indonesia), IND (India), JPN (Japan), KOR (Republic of South Korea), MEX (Mexico), NOR (Norway), RUS (Russia), TUR (Turkey), TWN (Taiwan, China), USA (The United States), and ROW (rest of the world).
Water 15 01975 g005aWater 15 01975 g005b
Figure 6. Influencing factors of industrial VW exports in China.
Water 15 01975 g006aWater 15 01975 g006b
Table 1. Decomposition of influencing factors of industrial VW change.
FactorsDescription
W ( Δ w ) Effect of variation in water-use coefficient.
W ( Δ A 1 d ) Structural effects of China’s use of domestic intermediate products.
W ( Δ A 1 d ) Structural effects of foreign economies on use of domestic intermediate products.
W ( Δ A 1 s ) Forward correlation effect between China and other economies, or the export structure effect of intermediate products.
W ( Δ A r 1 ) Backward correlation effect between China and other economies, or the import structure effect of intermediate products.
W ( Δ A r s ) Effect of industrial correlation between foreign economies.
W ( Δ P 1 ) Impact of changes in the product structure of China’s final demand, or the product structure effect of China’s final demand.
W ( Δ P r ) Influence of product structure change of foreign final demand, or the product structure effect of foreign final demand.
W ( Δ V 1 ) Impact of changes in the size of China’s final demand, or the scale effect of China’s final demand.
W ( Δ V r ) Impact of changes in the scale of foreign final demand, or the scale effect of foreign final demand.
Table 2. Twenty industrial sub-sectors and codes.
CodeIndustrial Sector
S1Mining and quarrying
S2Manufacture of food products, beverages, and tobacco products
S3Manufacture of textiles, wearing apparel, and leather products
S4Manufacture of wood and of products of wood and cork, except furniture
S5Manufacture of paper and paper products
S6Printing and reproduction of recorded media
S7Manufacture of coke and refined petroleum products
S8Manufacture of chemicals and chemical products
S9Manufacture of basic pharmaceutical products and pharmaceutical preparations
S10Manufacture of rubber and plastic products
S11Manufacture of other nonmetallic mineral products
S12Manufacture of basic metals
S13Manufacture of fabricated metal products, except machinery and equipment
S14Manufacture of computer, electronic, and optical products
S15Manufacture of electrical equipment
S16Manufacture of machinery and equipment
S17Manufacture of transport equipment
S18Manufacture of furniture and other manufacturing
S19Electricity, gas, steam, and air conditioning supply
S20Water collection, treatment, and supply
Table 3. Direct water-use coefficient and complete water-use coefficient of industrial sectors in China (m3/CNY 10,000).
Industry Code2000200520102014
ω d ω c ω d ω c ω d ω c ω d ω c
S194.5508.434.7257.926.9211.621.4196.7
S281.6223.053.1184.529.8147.917.2106.9
S355.4194.348.4172.037.3181.021.6127.6
S46.615.16.718.52.57.31.65.5
S5795.12161.8399.01302.3267.6868.7140.8478.6
S66.111.83.46.62.44.01.52.8
S789.2249.339.9174.913.288.411.478.7
S8213.11322.1104.3802.448.2451.625.9304.5
S978.7142.352.592.036.667.821.342.2
S1011.639.85.017.43.714.72.712.0
S1134.398.025.159.17.018.03.711.6
S12119.6766.134.8304.614.1115.17.573.2
S1312.437.614.339.09.229.96.124.3
S148.831.53.319.03.728.53.837.9
S159.931.46.521.02.712.51.58.6
S1621.077.77.529.63.014.91.89.9
S1721.969.29.030.62.613.32.111.5
S185.010.24.36.76.18.76.510.9
S19116.7609.761.0506.321.9146.111.078.9
S2077.9103.093.7125.9152.1179.192.0108.9
Table 4. Industrial structure of China’s VW trade with EU, JPN, USA, and US in 2000 (hm m3).
SectorsChina’s ExportsChina’s Imports
EUJPNUSAROWEUJPNUSAROW
S13.23.24.35.60.70.30.513.4
S21.63.91.42.90.60.30.52.3
S35.78.69.210.50.50.80.23.6
S40.10.10.10.10.00.00.00.0
S59.47.015.014.57.66.46.415.5
S60.00.00.00.10.00.00.00.0
S71.41.11.72.40.50.80.41.9
S813.810.717.417.56.610.84.719.2
S90.40.20.50.40.30.10.30.5
S100.50.30.60.60.10.20.10.3
S110.70.61.11.00.20.30.10.6
S127.36.19.910.23.27.71.08.3
S130.40.30.50.50.30.30.10.3
S141.10.61.61.20.50.80.61.6
S150.50.40.60.70.30.50.10.6
S160.70.41.11.11.30.80.51.2
S170.40.30.51.00.60.60.40.4
S180.20.10.40.10.00.00.00.1
S193.83.14.95.81.01.40.47.8
S200.10.10.20.20.00.10.00.3
Sum51.547.071.176.424.532.216.277.9
Table 5. Industrial structure of China’s VW trade with EU, JPN, USA, and US in 2014 (hm m3).
SectorsChina’s ExportsChina’s Imports
EUJPNUSAROWEUJPNUSAROW
S16.22.76.714.91.10.31.243.5
S23.42.93.48.11.80.20.93.6
S313.77.516.022.50.80.40.12.5
S40.20.10.20.30.00.00.00.1
S59.94.311.020.65.43.03.36.3
S60.00.00.00.10.00.00.00.0
S72.31.02.56.00.90.50.82.3
S811.45.213.522.04.54.12.610.4
S91.00.30.61.31.30.10.50.6
S100.50.20.61.10.20.20.10.3
S110.40.20.41.10.10.10.00.3
S123.41.53.78.21.51.70.44.5
S131.20.61.32.60.90.30.30.6
S144.22.15.17.30.51.00.33.7
S150.70.30.71.30.20.20.00.3
S160.60.20.71.40.70.20.10.4
S170.50.20.61.61.00.30.40.3
S181.00.21.11.20.40.10.21.4
S192.41.12.65.51.00.40.17.5
S200.40.20.40.90.40.20.01.4
Sum63.330.871.0128.222.713.411.490.0
Disclaimer/Publisher’s Note: The statements, opinions and data contained in all publications are solely those of the individual author(s) and contributor(s) and not of MDPI and/or the editor(s). MDPI and/or the editor(s) disclaim responsibility for any injury to people or property resulting from any ideas, methods, instructions or products referred to in the content.

