Article

Hydraulic Conductivity Characteristics of a Clayey Soil Incorporating Recycled Rubber and Glass Granules

1
School of Civil and Environmental Engineering, Queensland University of Technology, Brisbane 4000, Australia
2
Group of Sustainable Engineered Construction Materials, Queensland University of Technology, Brisbane 4000, Australia
3
Centre for Materials Science, Queensland University of Technology, Brisbane 4000, Australia
*
Author to whom correspondence should be addressed.
Water 2023, 15(11), 2028; https://doi.org/10.3390/w15112028
Submission received: 29 March 2023 / Revised: 15 May 2023 / Accepted: 24 May 2023 / Published: 26 May 2023
(This article belongs to the Special Issue Recent Advancements in Unsaturated Soil Mechanics)

Abstract

:
Recycled waste materials have been employed to stabilize clayey soil by many practitioners in geotechnical engineering. However, the effects on hydraulic conductivity and its underlying mechanism have rarely been explored. The study aims to examine the hydraulic conductivity characteristics of soil reinforced with the inclusion of selected recycled waste granules, rubber crumb (RC) and crushed glass (CG) under changing confinement. For this purpose, a series of consolidation tests were carried out by varying recycled waste type and additive contents (0%, 5%, 10% and 20% additive content by dry weight of soil). The confining stress was increased within a range of 6.25 kPa to 200 kPa. The results reveal that the addition of RC and CG, as well as the stress state, significantly impacted the soil’s hydraulic conductivity (k). The hydraulic conductivity of both RC/CG soil composites consistently declined with increasing applied stress. Moreover, as the concentration of recycled waste granules in the reinforced soil increased, the hydraulic conductivity value k initially increased, reaching a peak before subsequently declining. Additionally, the study utilized scanning electron microscope (SEM) imaging, which revealed that the inclusion of RC and CG significantly influenced hydraulic conductivity-related parameters by modifying pore size and distribution.

1. Introduction

Clayey soils containing hydrophilic minerals (e.g., montmorillonite and illite) are characterized as reactive and known to exhibit significant changes in volume in response to variations in water content. This type of soil inevitably shrinks when losing water or swells when absorbing water [1,2,3]. Clayey soils are also known for their low bearing capacity and high compressibility. Over time, the poor strength properties tend to result in exceptional subsidence and cracks in foundations, subgrade and other civil infrastructure built on reactive soil [4]. Owing to significant volume change and weak engineering properties, implementing modification methods on this “problematic” soil is imperative [5].
To lessen the swelling–shrinking deformation and improve strength, some conventional chemical stabilizers, including cement [6,7,8], lime [9,10,11], fly ash [12,13,14,15], etc., have been added to improve its strength and durability. Though effective, using such additives is costly and can generate undesired byproducts like greenhouse gas [16,17]. Given its high durability and appropriate strength, along with environmental considerations, recycled waste has been used as a potential geosynthetic material [18]. Generally, most types of industrial solid waste are directly burned or buried in landfills, which is harmful to the existing ecological environment [4]. In this respect, the exploration of the beneficial reuse of waste materials in geotechnical engineering has been investigated as a potential solution to reduce waste and conserve resources [19,20]. However, using recycled waste materials may potentially generate secondary waste such as dust and leachate, which is an important consideration when evaluating the suitability of such materials for soil improvement. Efforts were made to minimize potential secondary waste generation by thoroughly mixing the recycled waste materials into the soil at appropriate proportions during soil reinforcement. Among all recycled solid wastes, rubber crumb (RC) and crushed glass (CG) aggregates are recognized as two effective additives in soil reinforcement with low cost. In Australia, the application of RC and CG as in situ civil materials is encouraged in construction projects, such as the Guide to Pavement Technology Part 4E from Austroads [21]. The effectiveness of recycled RC and CG as soil stabilizers has been well established in the literature. Abbaspour et al. [22] conducted compaction, direct shear, unconfined compressive strength (UCS), California bearing ratio (CBR) and split tensile strength (STS) tests to evaluate the strength behavior of soil reinforced with 0.5%, 1%, 2%, 3%, and 4% of waste tire textile fibers and observed a reduction in UCS and CBR and a significant increase of ductility when tire fiber content reached 3% and 4%. Several studies have demonstrated a uniform reduction of modified dry density and a decrease of optimum moisture content by adding waste tire fiber. Bekhiti et al. [23] explored the swelling behavior of rubber-stabilized soil and concluded that adding rubber can effectively reduce swelling potential and pressure. Özkul and Baykal [24] conducted a series of consolidated triaxial test on soil–rubber mixture under drained and undrained conditions within a range of 50–300 kPa and observed a limiting confining stress that the composite should not be used beyond 300 kPa. Arrieta et al. [25] performed the UCS and durability using recycled glass powder for soil stabilization and found that UCS increased with an increase in glass powder. Blayi et al. [26] conducted a series of laboratory tests to investigate the optimum percentage of waste glass powder (WGP) for construction use and found that adding 15% of WGP in samples can optimally enhance the geotechnical properties of reactive soil, yet begins decreasing after this amount.
According to previous studies, most research has predominantly focused on the strength behavior and stabilization effects of soils treated with various types of rubber and glass. The addition of recycled RC and CG also has the potential to alter soil properties, including hydraulic conductivity. Soil hydraulic conductivity (k) is a fundamental geotechnical and geoenvironmental parameter to assess infiltration, runoff and drainage in construction projects [27]. The requirement of hydraulic conductivity varies in different geotechnical applications; a lower value of hydraulic conductivity is preferred when using soil as a foundational material while a higher value of hydraulic conductivity may be desired in areas prone to excessive groundwater, such as road embankments or retaining walls. The addition of solid waste particles can create additional pore spaces within the soil structure, allowing for improved water flow, and reduce the size of soil particles, further enhancing hydraulic conductivity. However, if the waste granules are poorly dispersed or form large aggregates, they can block the pores and decrease hydraulic conductivity. The impact of adding RC and CG on soil hydraulic conductivity is complex and requires thorough investigation. To date, studies on the effect of RC and CG on hydraulic conductivity have been insufficient, with most research focusing on the use of conventional chemicals [28]. Nevertheless, there is a lack of microstructural analysis available to uncover the pore-scale behavior of clayey soil mixed with varying proportions of CG and RC. Therefore, further research is necessary to understand the impact of adding recycled solid waste materials on soil hydraulic conductivity.
This study aims to investigate the hydraulic conductivity characteristics of unreinforced and reinforced locally sourced clayey soil considering various confining stresses. A series of laboratory consolidation tests are carried out for the soil sample by adding different percentages of CG and RC, i.e., 0%, 5%, 10%, and 20%, to the dry weight of the soil sample. The hydraulic conductivity of soil was deduced from the odometer consolidation test results. Additionally, microstructures of the soil mixed with RC and CG under compression were captured using SEM, and the underlying relationship between hydraulic conductivity and microstructure was then explored. Such insights can help optimize the design and engineering of soil systems that incorporate recycled waste granules, leading to more sustainable and cost-effective construction practices.

2. Materials and Methods

2.1. Materials

The soil utilized in this study was originally taken from Southeast Queensland (SEQ) in Australia at a depth of approximately 0.5–1.0 m (Figure 1). The soil samples were carefully stored and transported in a polythene container to maintain moisture equilibrium.
Soil characteristics were evaluated and summarized in Table 1. According to the Unified Soil Classification System (USCS), the soil was classified as a clay of low plasticity, specifically a lean clay (CL). The mineralogical composition of the selected soil was analyzed using X-ray diffractometry (XRD), and the results are presented in Figure 2. The XRD analysis indicated that the primary minerals present in the soil were kaolinite and illite. Table 2 provides additional information on the mineralogical composition of the soil. Notably, the presence of smectite, kaolinite and illite, comprising approximately 25% of the soil, suggests the potential for expansiveness. Additionally, to prepare for testing, the selected soils were placed on desiccating discs in the oven and dried at 105° for at least 24 h before use. Larger crumbs of clay aggregates were crushed using a grinder and screened through a 425 µm sieve to ensure the fineness of soil particles.
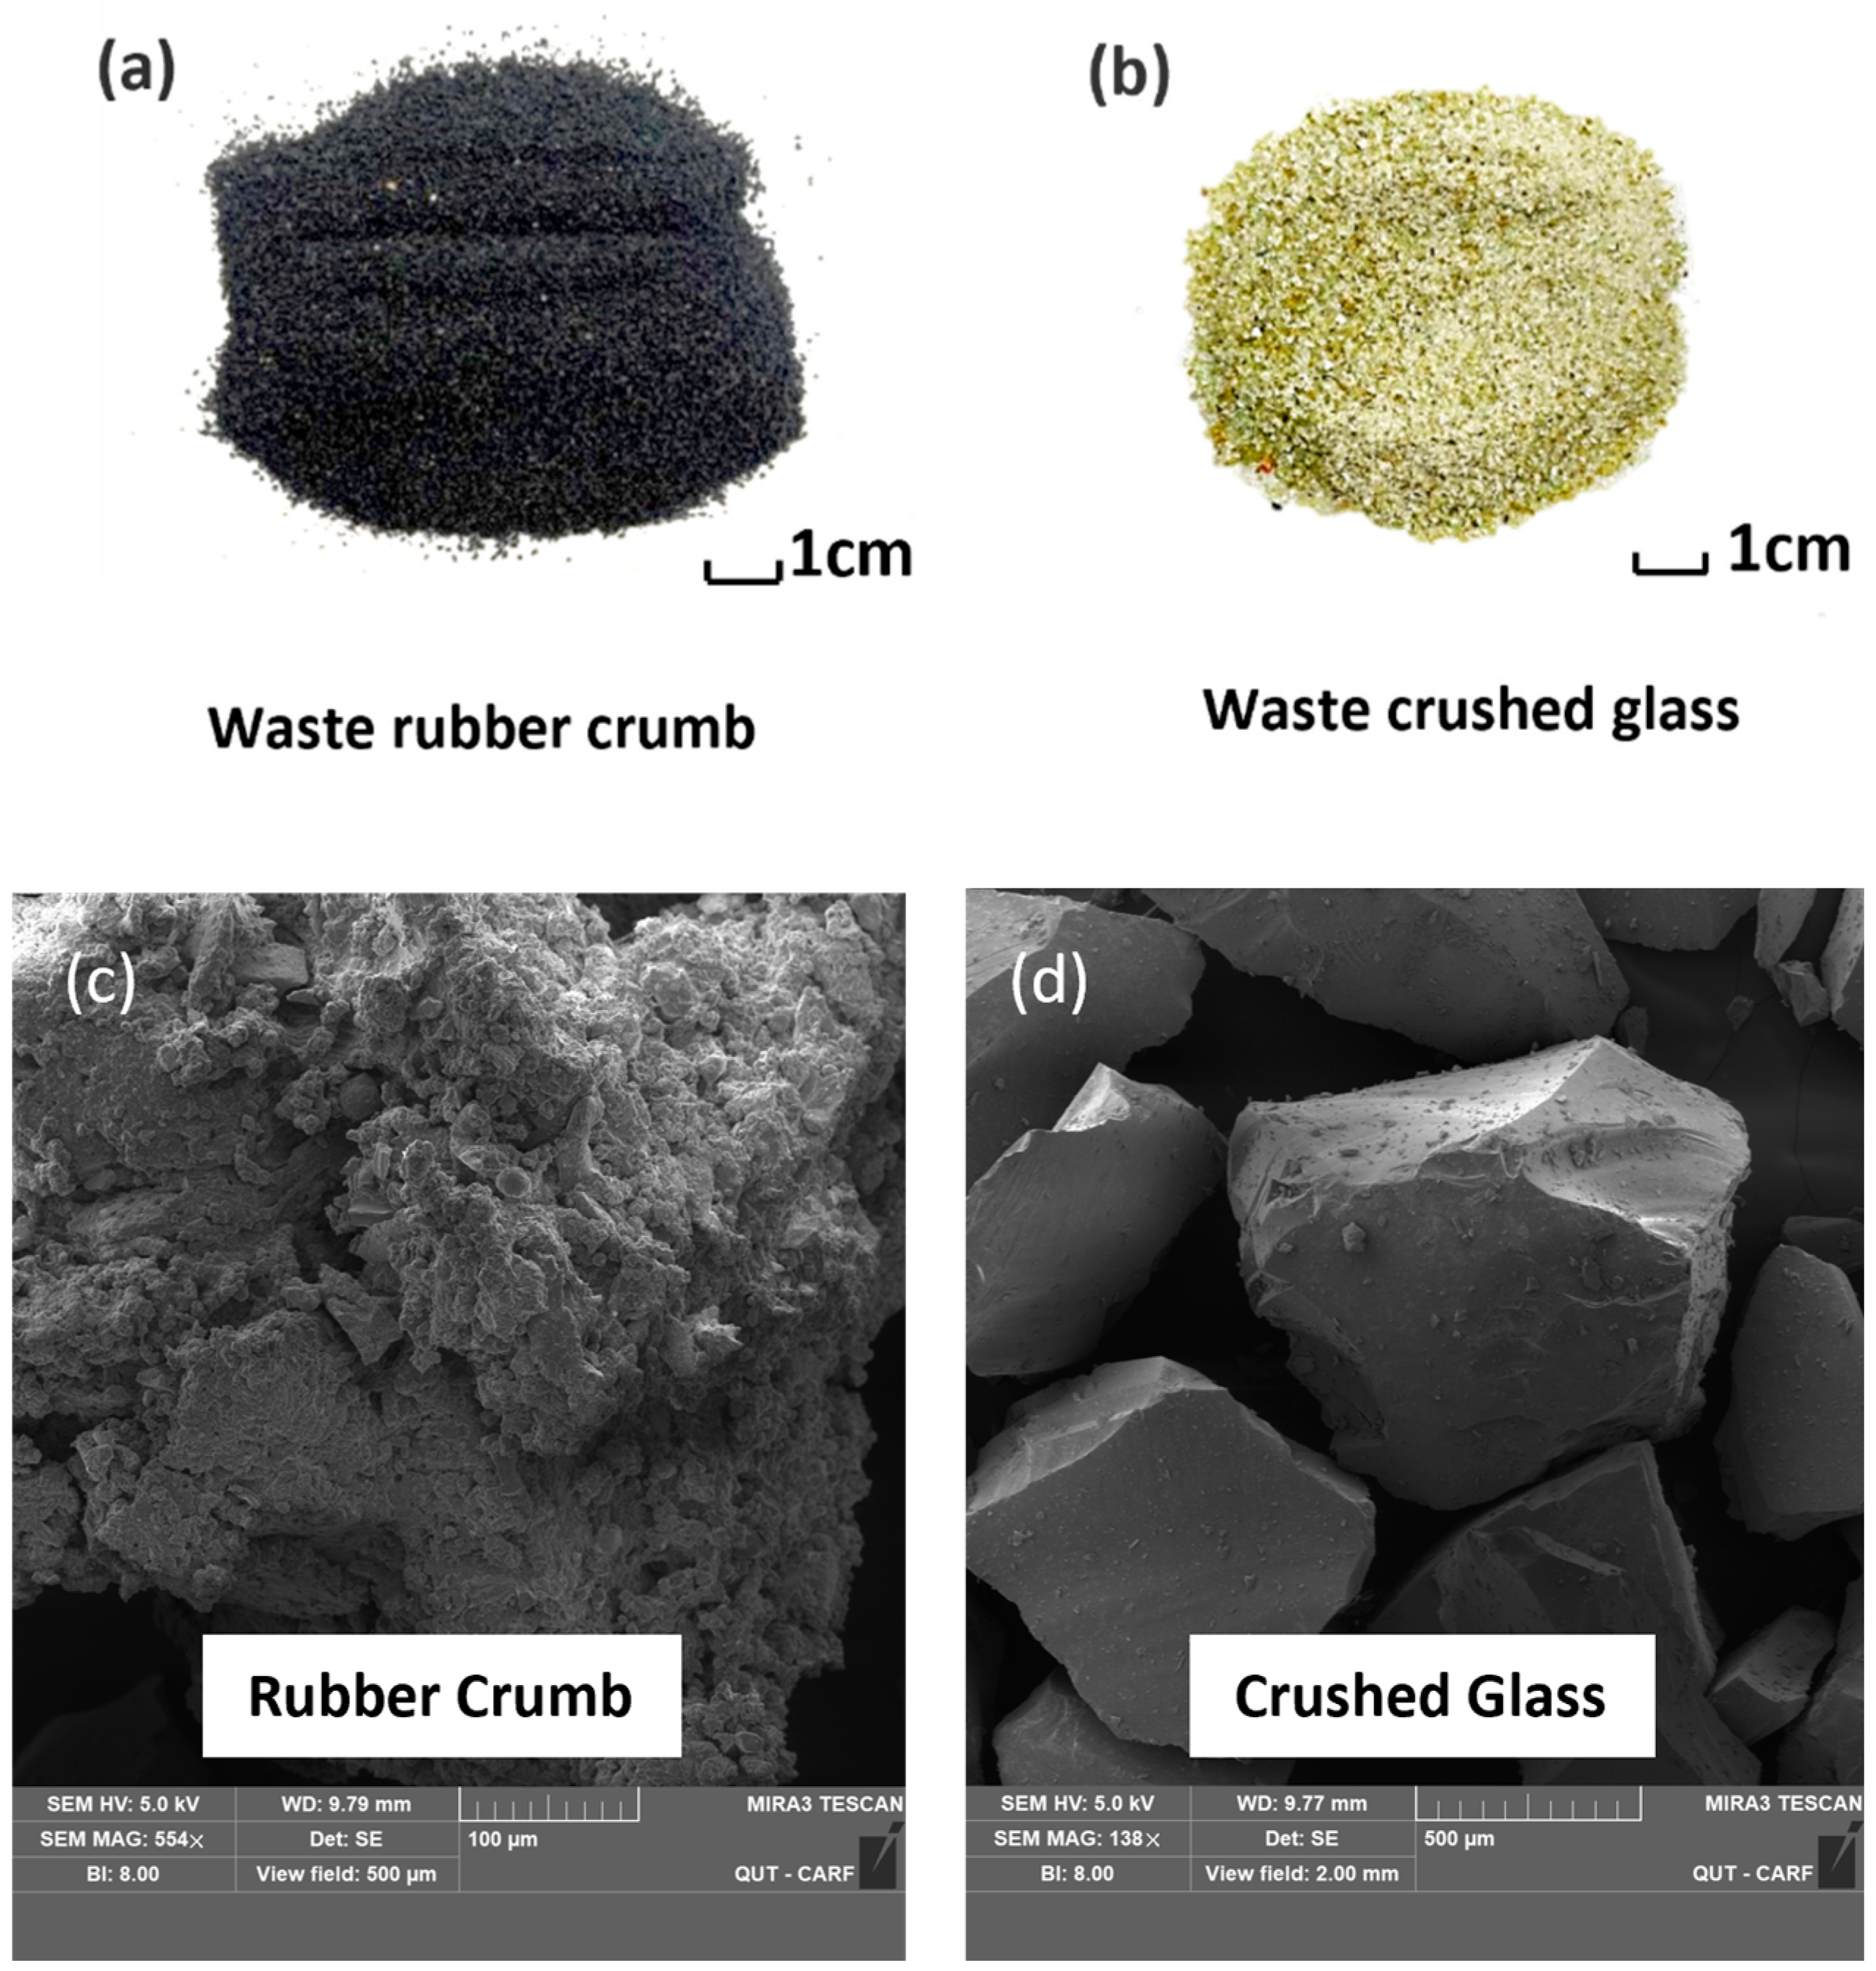
Recycling waste materials constitutes a crucial element of sustainable development. To investigate the effect of recycled waste granules on hydraulic conductivity characteristics, RC and CG were selected to treat soil samples (Figure 3). RC granules were collected from recycled scrap tires in Ipswich, Queensland and the CG used in this experimental work was supplied from recycled glass particles in Brisbane, Queensland. The RC granules exhibited a size range between 0.7 mm and 1 mm with a specific gravity of 1.14. The specific gravity of glass particles is 2.5. The size of CG ranged from 0.15 mm to 0.3 mm and the composition of CG mainly consisted of crushed glass (99%) and traces of crystalline silica (<1%). SEM was used to capture the unique microscale morphological characteristics. Figure 3c illustrates the detailed microstructure of RC granules, which are black, solid with uneven surface. Some small pores were scattered on the surface, which allow water to flow through. Figure 3d shows the detailed microstructural characteristics of CG granules, which are solid, granular and angular. Some glass debris was found on the surface of large glass particles, which could occupy the pores in soil aggregates.

2.2. Preparation of Recycled Waste Treated Soil Samples

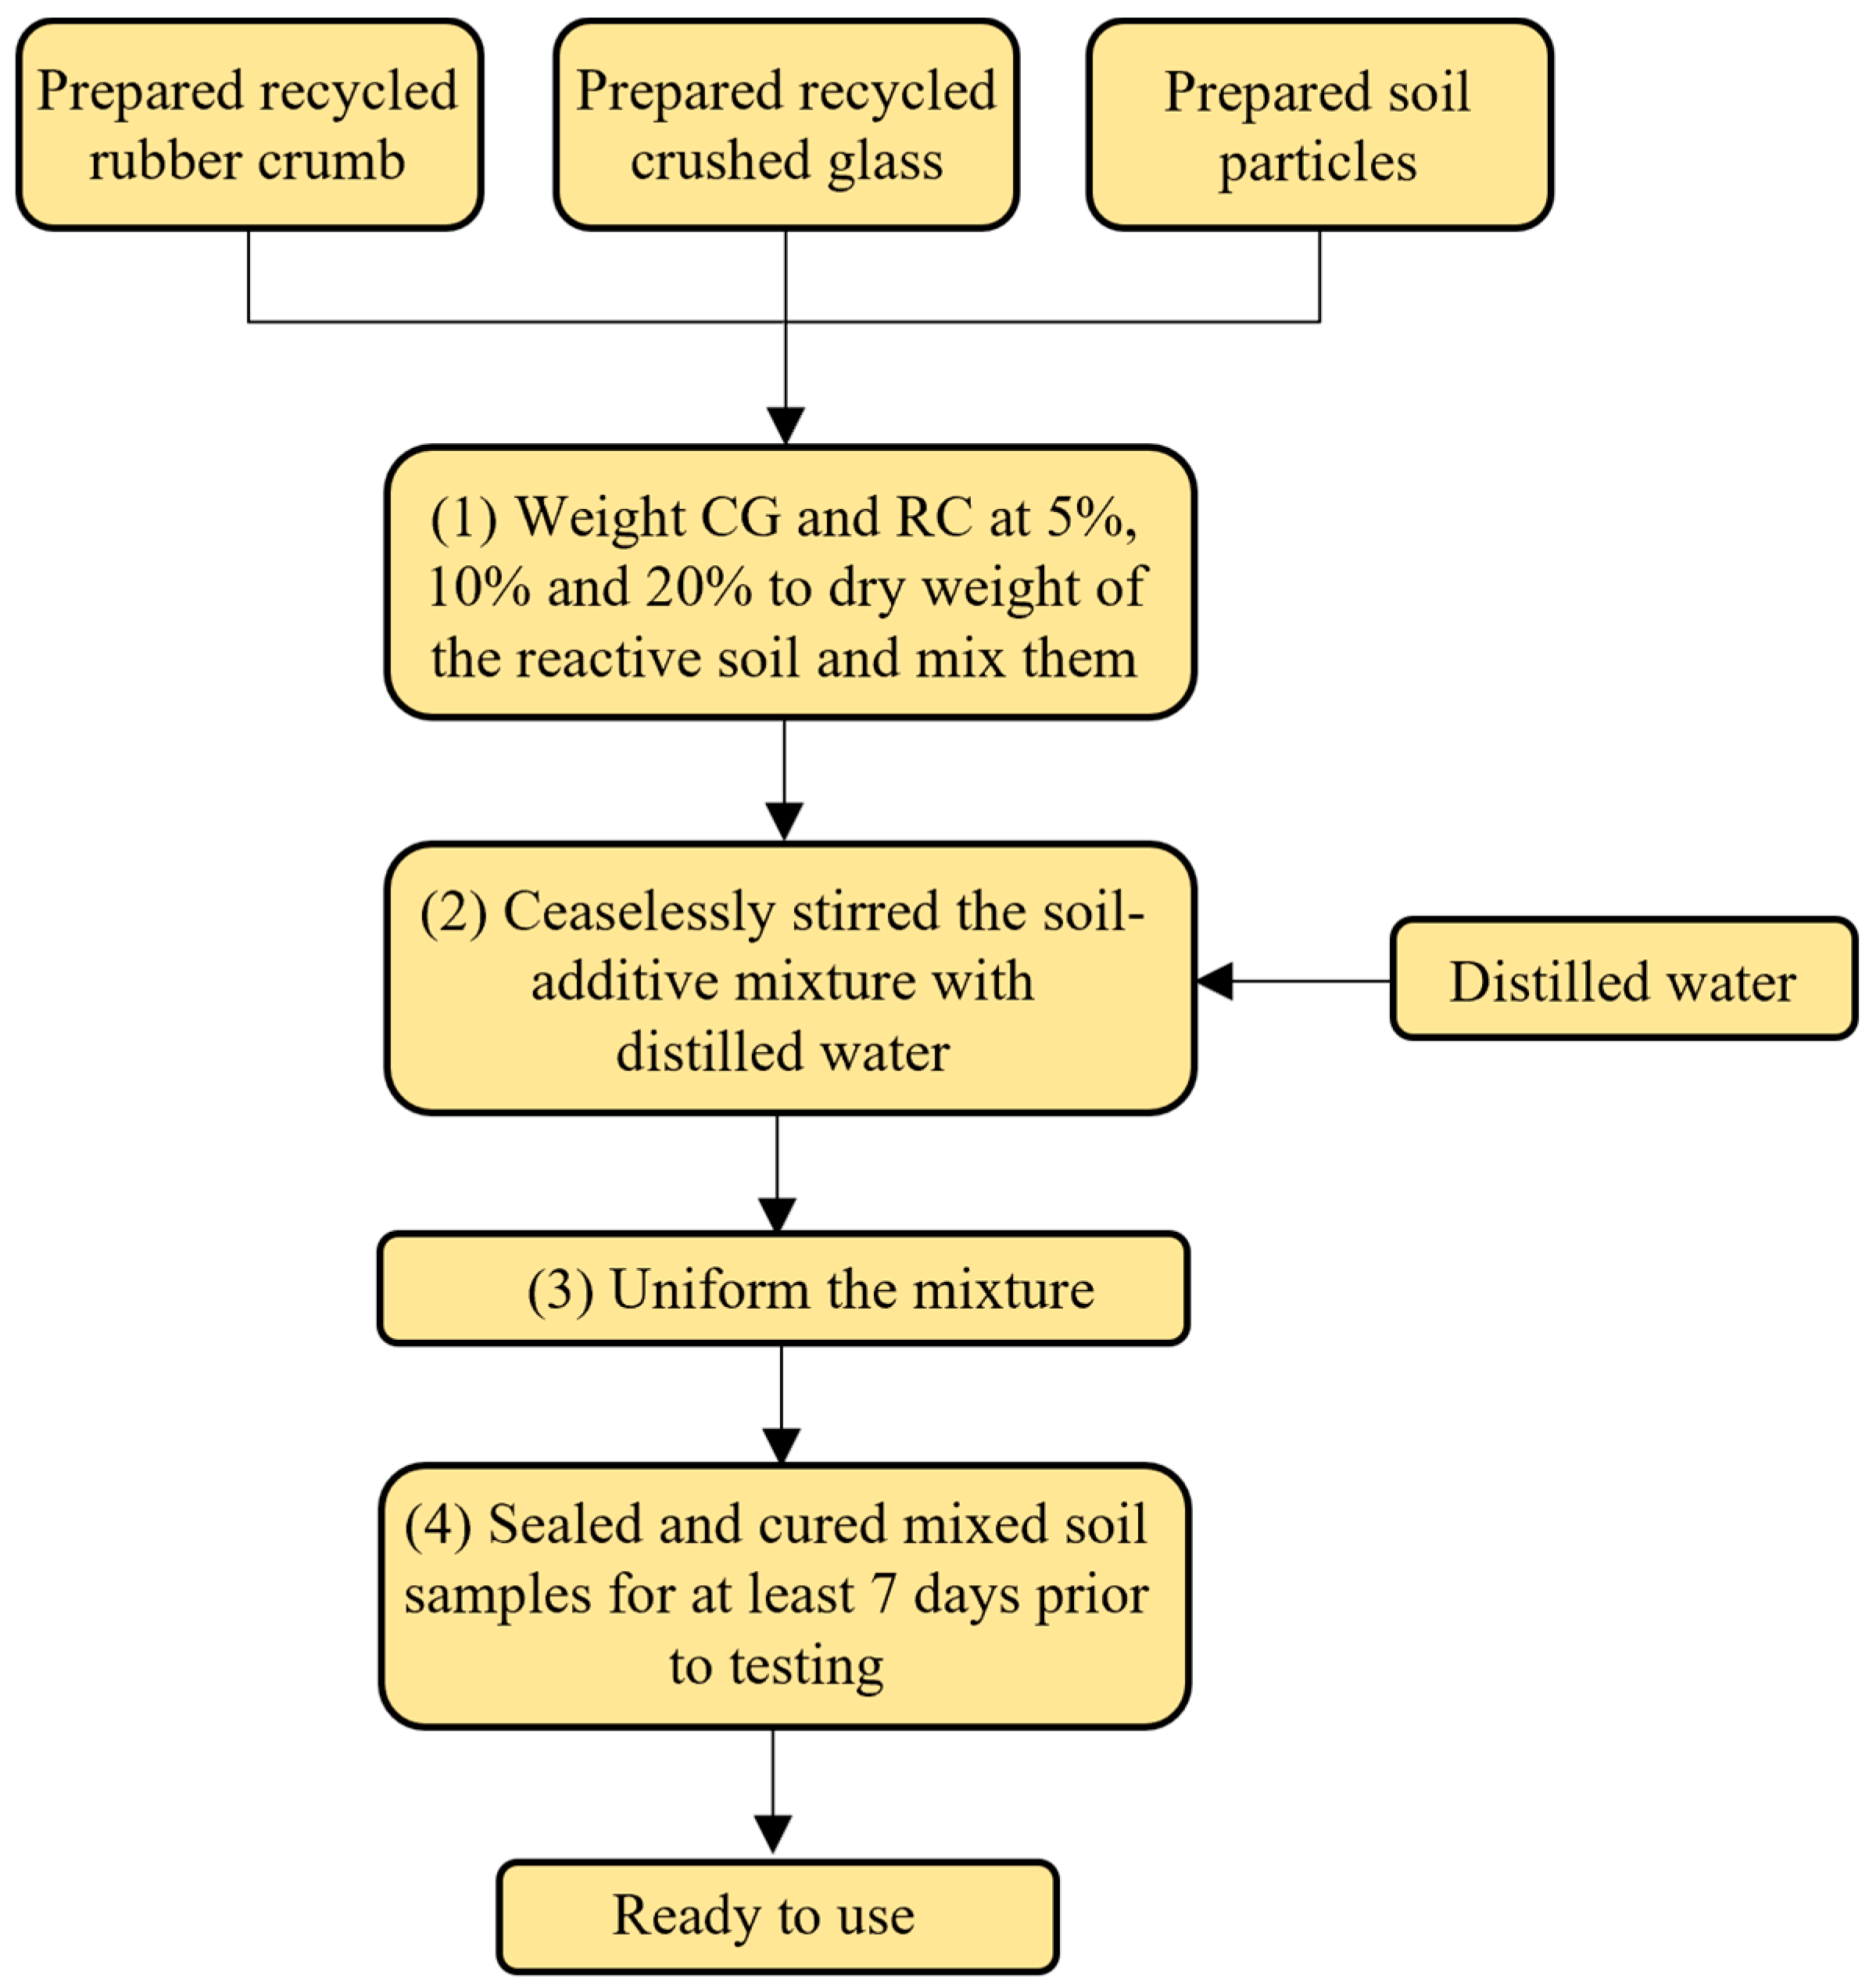
The preparation of mixed soil samples consists of four distinct steps (Figure 4). Based on type and properties of the waste materials, the property of soil as well as previous studies and industry standards, CG and RC granules in a proportion of 0%, 5%, 10% and 20% of total dry weight of the soil sample were selected and added to oven-dried soil particles. Following this, distilled water was added gradually to the soil–additive mixture and ceaselessly stirred in order to ensure accurate and repeatable results by minimizing the impact of impurities and contaminants. The initial water content utilized herein was of ~29% to guarantee the fully saturated state throughout the experimental program. Uniformity of the mixture is monitored by visual inspection. Finally, mixed soil samples were sealed and cured for at least 7 days prior to testing to homogenize the water distribution in the soil mixture. In this study, sample preparation was carried out in an air-conditioned lab with minimal temperature variations.

2.3. Consolidation Test Procedure

To evaluate the hydraulic conductivity characteristics of treated and untreated soil, the prepared samples were applied to conduct a set of one-dimensional consolidation tests in accordance with Australian standard 1289.6.6.1 (ASTM 2011).
Specimens of precured soil samples were placed into the fixed stainless-steel O-ring with a diameter of approximately 65 mm and a 25 mm height, while trimming off any excess soil from the sides of the specimen until it reached the desired diameter using a trimming knife. The specimen was placed on a flat surface and a ruler was used to measure its diameter and height. The sample thickness was measured with an accuracy of ±0.1 mm prior to initiating the consolidation procedure to ensure reliable and precise results. Second, the consolidation cell was assembled with the O-ring, specimen, porous plate and filter paper on both sides of the specimen and the loading plate was then placed upon the specimen. It is worth noting that the porous plate was saturated in advance to minimize any water absorption from the samples. Subsequently, the upper pedestal was locked in case of any vertical displacement. Once the soil specimens were completely inundated with distilled water, the first loading pressure was applied and the changes of thickness were recorded. The incremental loading applied from 6.25 kPa and subsequently doubled, up to 200 kPa. Each loading stage lasted for 24 h until the test was completed. The load and deformation characteristics were controlled, measured and recorded together by computer. Following the ASTM D2435 standard for consolidation testing, in total, three separate measurements on each soil sample were conducted to ensure the reliability of our results. The testing programs in this study are listed in Table 3. Term “√” refers to conducted consolidation tests or SEM analysis with selected percentage of additive.

2.4. Analytical Methods

Hydraulic conductivity in each incremental loading was calculated in light of the consolidation curves. The parameters were calculated in accordance with the square-root time method using results obtained from the consolidation tests [29]. The variation of the void ratio subject to each loading step was calculated as:
e = H H · 1 + e 0
where H = change of thickness at current loading pressure, H = initial height of samples and e 0 = initial void ratio, which can be calculated as:
e 0 = H 0 H s H s
where H 0 = initial height of the specimen and H s = equivalent height of solid particles that can be expressed from:
H s = 1000 m ρ s A
where m is the dry mass of the specimen, A is the surface area of the soil specimen, and ρ s is the particle density of the selected specimen, which is obtained from the dry mass and volume of particles.
The coefficient of compressibility, a v , is among the key consolidation parameters that reflect the rate of change of the void ratio corresponding to increasing vertical stress. The smaller the value of a v , the less compressibility can be captured. The coefficient of compressibility is equal to the slope of the graph of pressure versus the void ratio (log scale):
a v = e 0 e 1 log p 0 log p 1 ,
where e 1 = void ratio after compression, and p 0 and p 1 = pressure corresponding to e 0 and e 1 , respectively.
The coefficient of volume compressibility, m v , for pressure increment was obtained as:
m v = a v 1 1 + e
The coefficient of consolidation, c v , is the soil parameter governing the time rate of consolidation for double drainage condition, which was determined as:
c v = 0.112 H ¯ 2 t 90
where t 90 = time for 90% primary consolidation in typical compression versus time graph (square root). H ¯ = average thickness of specimen corresponding to load increment.
Based on the calculated consolidation data above, the hydraulic conductivity in the vertical direction, k , at identical loading increments was deduced based on Terzaghi’s equation:
k = c v · m v · γ w
where γ w = unit weight of distilled water, which is defined as 9.8 kN/m3 at room temperature. This k value represents the vertical direction of the hydraulic conductivity. It is worth noting that this method relies on several assumptions, including small strains, saturated soil, and linear elastic soil behavior. The void ratio, compression index and other consolidation parameters were determined through laboratory testing, and used as input parameters in the method to derive the k values
The compression index, C c , was captured as the slope of the straight-line portion of e-log σ curve as:
C c = e log 10 p
where ( log 10 p ) = change in the logarithm of the effective pressure applied to the soil sample between the two stresses at which the void ratio was measured.

3. Results and Discussion

3.1. Impact of RC or CG Inclusion on Compressibility Behavior of Reactive Soil

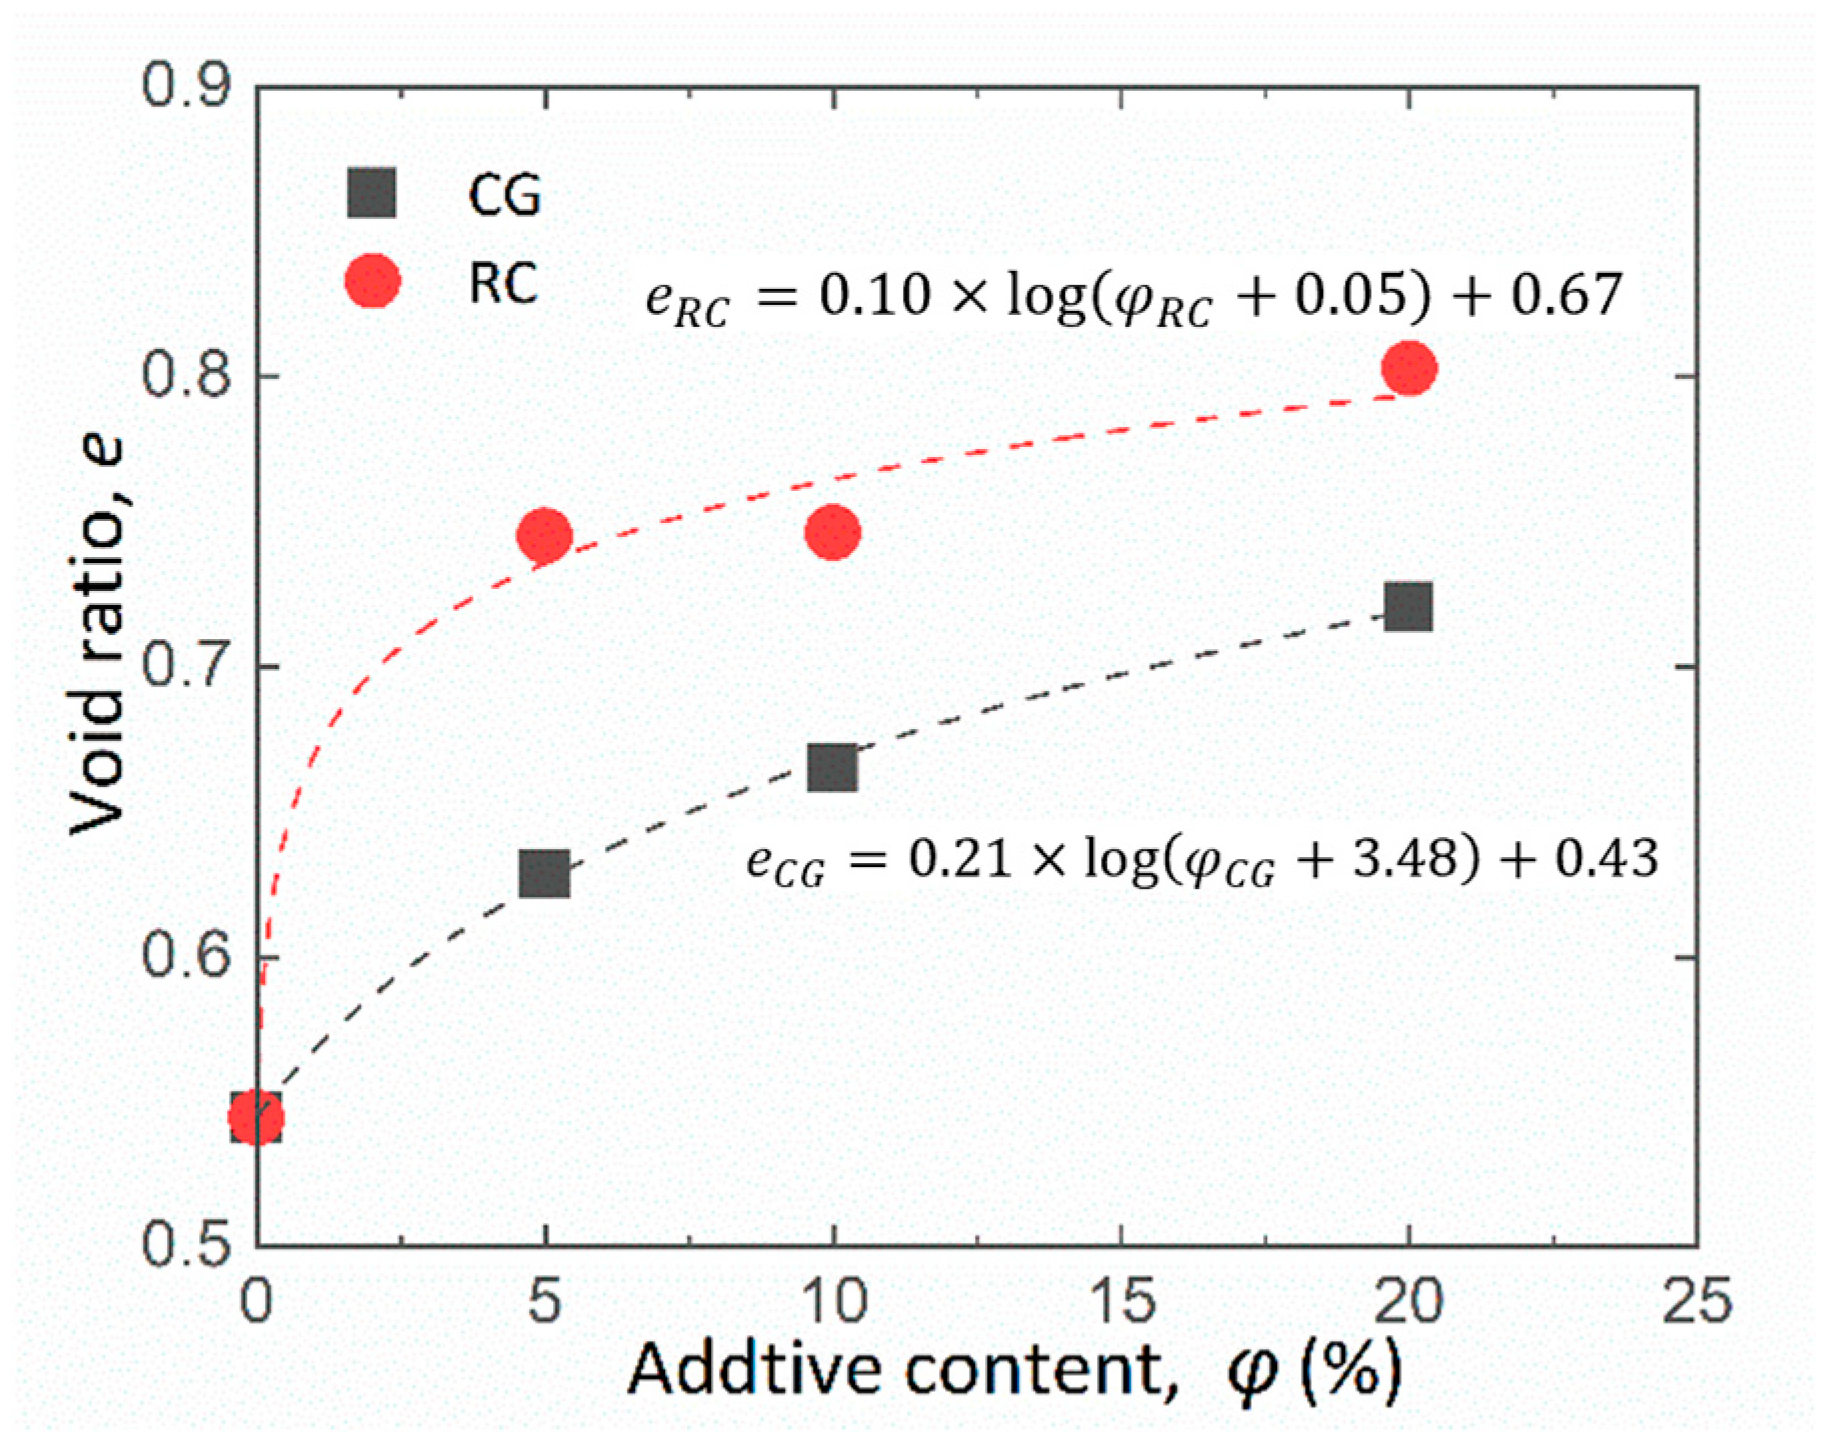
The stress–strain characteristic of reactive soil depends on soil texture, soil structure, etc. The initial void ratio for soil samples mixed with different percentages of recycled waste particles are illustrated in Figure 5. It can be seen that the void ratio of reactive soil increases apparently with the increased amount of RC/CG added into the soil samples. The alteration in the void ratio caused by the incorporation of rubber particles is more pronounced, suggesting that the structure of the soil–rubber composite (RC) is less compact than that of the soil–glass composite (GC) containing the same additive content. The increase in void ratio (e) can be represented as a logarithmic function in relation to the recycled waste content (φ). This relationship can be expressed as:
e C G = 0.21 log φ C G + 3.48 + 0.43 R 2 = 0.9989
e R C = 0.10 log φ R C + 0.05 + 0.67 R 2 = 0.9867
The observed higher void ratio in different specimens reinforced with RC and CG can be ascribed to the presence of larger grain size additives. When mixing with the soil, larger voids or spaces were created between the particles, resulting in an increase in the void ratio. More information can be found in the discussion on SEM images.
The consolidation curves are plotted for the logarithm of the effective stress ( log σ ) versus void ratio (e). Figure 6 depicts the consolidation curves for all composites with different content of recycled waste inclusion. It was observed that there is a substantial increase in the void ratio in the presence of RC and CG.
The findings from the investigation of CG- and RC-treated soils, as shown in Figure 6a,b respectively, revealed notable changes in the void ratio under varying loading conditions. In the investigation of CG-treated soil (Figure 6a), it was observed that specimens with 20% CG exhibited less compression than those with 10% and 5% CG, corresponding to a lower variation range of void ratio (e) under identical loading paths. More specifically, the reduction of the void ratio due to an increase of vertical stress for different percentages of soil–CG mixture followed a specific order: 20% CG (0.44 ≤ e ≤ 0.60) < 10% CG (0.45 ≤ e ≤ 0.64) < 5% CG (0.46 ≤ e ≤ 0.68). This trend can be attributed to an increasing amount of CG inclusion, which potentially enhances its strength and resistance to compression [26]. Under identical consolidation pressure of 100 kPa, the void ratio decreased from 0.53 to 0.50 and 0.49 with increasing CG content. A similar downward trend was revealed in the results captured by Jalal et al. [30]. For RC-treated reactive soil (Figure 6b), a significant decline in the void ratio was observed for the 10% RC when the effective stress (σ’) exceeded 12.5 kPa, followed by 20% RC and 5% RC. As the applied pressure increased stepwise, RC particles were found to interlock with soil particles, filling void spaces and improving soil stability. This process can reduce settling and enhance load-bearing capacity [31]. The presence of interlocking particles between the soil and RC granules contributed to the largest reduction in the void ratio.
Another parameter that can be used as a measure of compressibility to predict the settlement of structures is the compression index ( C c ). The C c values of rubber and glass mixed soil are listed in Table 4, where nontreated soil refers to the absence of any added recycled waste material in the soil samples. It can be seen that the addition of 5% recycled rubber crumb to the soil reduced the compression index from 0.152 to 0.116, which indicates that the soil became more compact and less compressible. This reduction in C c could be due to the rubber crumb acting as a filler material, increasing its strength and resistance to compression. Nonetheless, when the rubber crumb content was raised to 10%, the compression index rose to 0.154, indicating that the soil became more compressible than its untreated counterpart. This phenomenon might result from the rubber crumb reaching a saturation point, beyond which additional increments may not enhance soil properties. For the soil treated with recycled crushed glass, all percentages (5%, 10%, and 20%) exhibited a lower compression index than nontreated soil, indicating improved compressibility. Furthermore, as the content of crushed glass increased, the compression index consistently decreased, with the 20% content yielding the lowest compression index, which is 0.111. This suggests that the crushed glass may have contributed to a densification of the soil, resulting in a more stable and less compressible material.
The compressibility index of RC- and CG-treated soil subject to different applied effective stress is shown in Figure 7. It was found that all samples experience a drop of C c value at a low-stress state, then increase with rising applied stress and finally tend to be consistent. Clayey soil samples treated with RC and CG have a higher compression index when the stress is beyond 100 kPa, which refers to a higher settlement and looser structure of specimen. However, soil samples containing 10 CG and 20 CG exhibit a denser characteristic with lower compressibility.

3.2. Impact of In Situ Stress on Hydraulic Conductivity

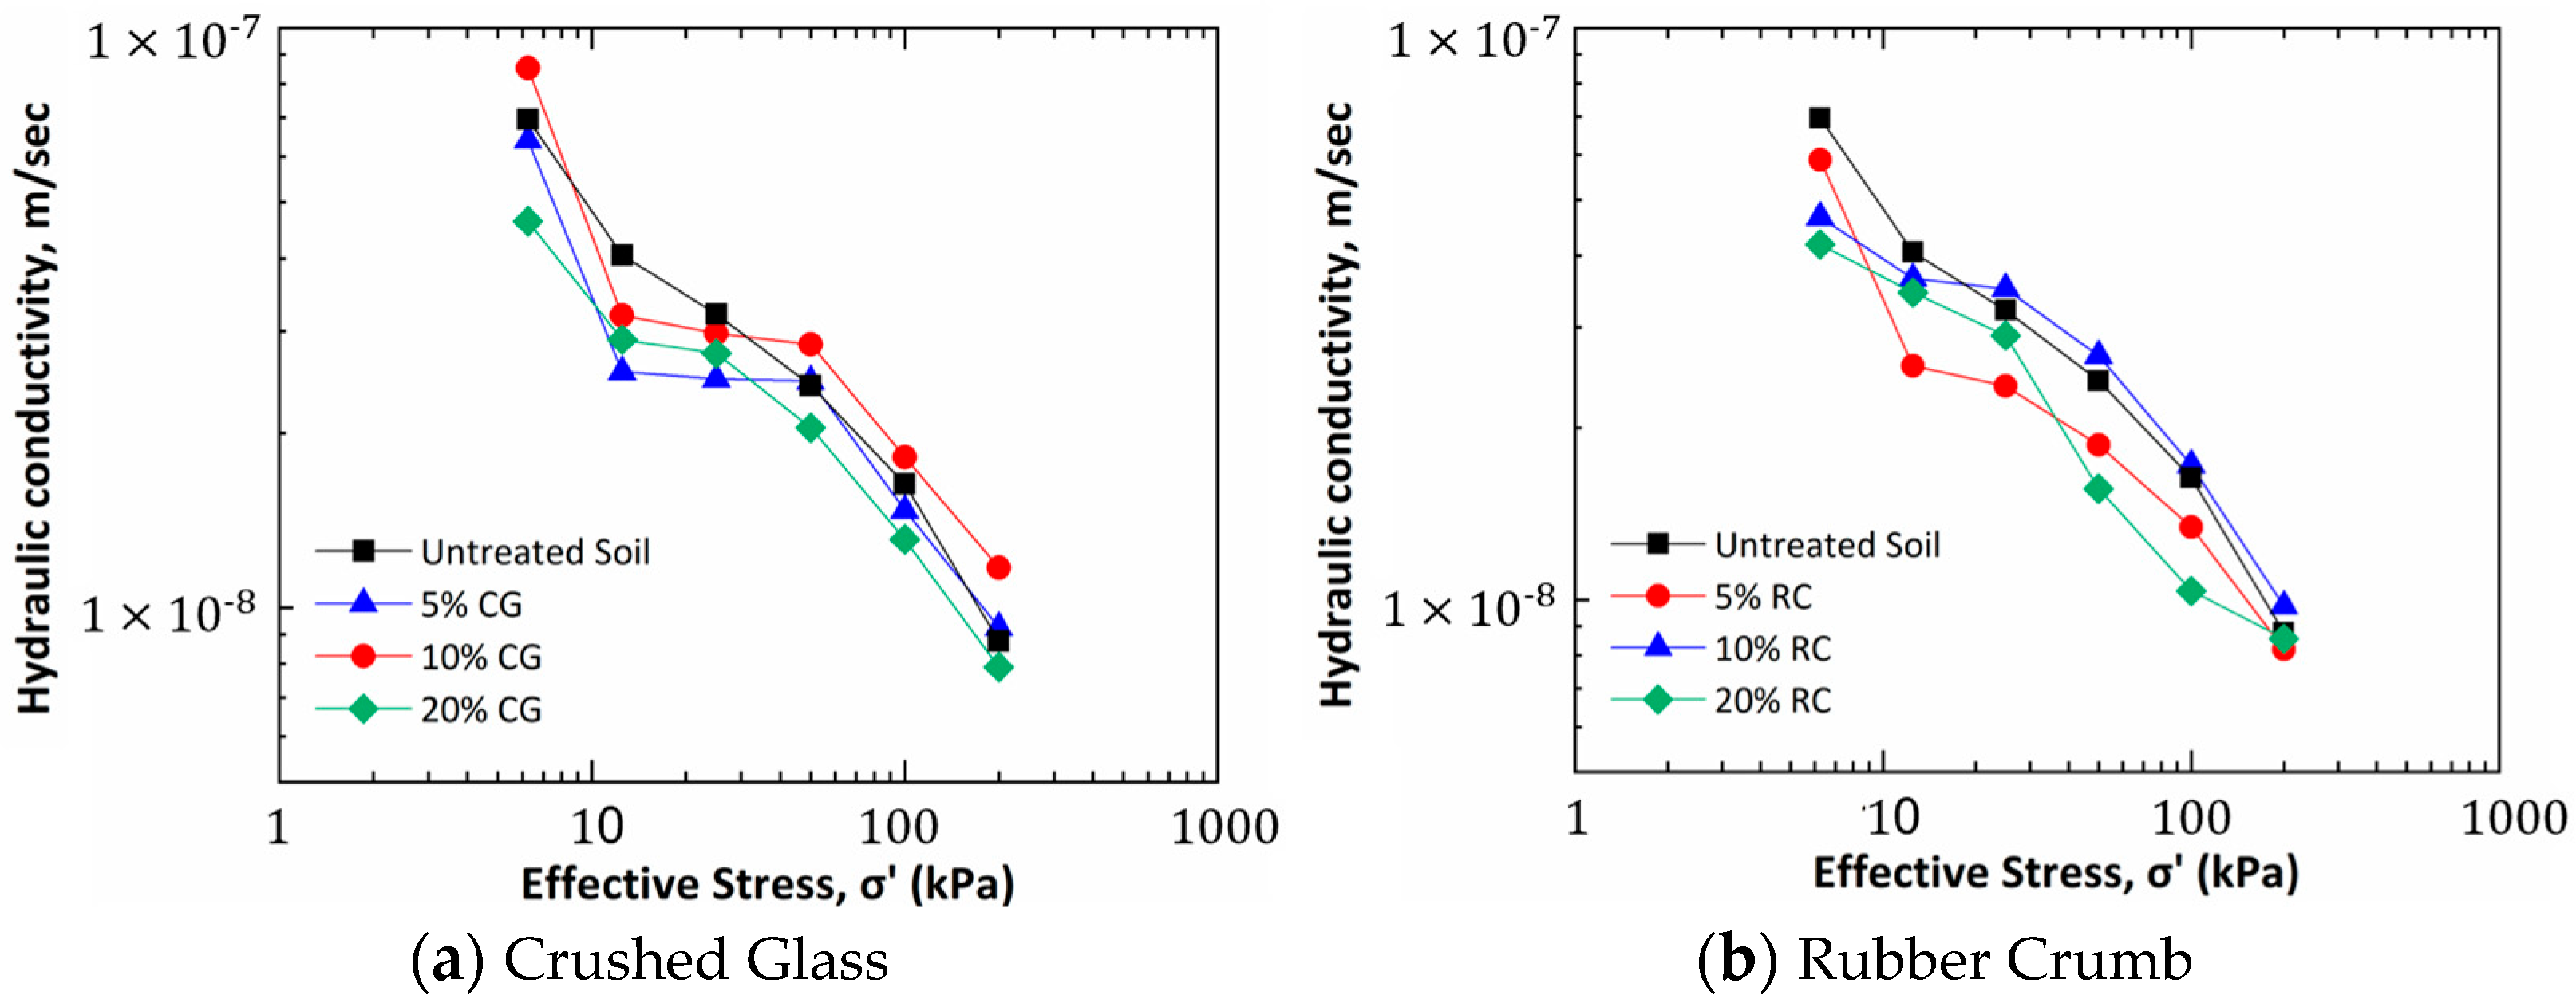
The hydraulic conductivity (k) of soil mixtures with recycled rubber (RC) or recycled glass (CG) under different applied stress conditions are summarized and plotted in Figure 8. It was detected that the hydraulic conductivity of both soil composites consistently declined as the applied stress increased, which indicats a similar trend between applied stress and void ratio. This is mainly attributed to the decreasing amount and volume of voids during the compaction process.
In the case of reactive soil mixtures containing recycled crushed glass (5% CG, 10% CG, and 20% CG), it is notable that at higher applied stresses (50, 100 and 200 kPa), the hydraulic conductivity of 20% CG soil mixture is the lowest among all CG-treated soil mixtures. Specifically, at 200 kPa, the hydraulic conductivity for the specimen is 7.9 × 10⁻9 m/s, which is lower than that of untreated soil (8.8 × 10⁻9 m/s), the 10% CG mixture (9.3 × 10⁻9 m/s), and the 5% CG mixture (1.2 × 10⁻8 m/s). Moreover, there appears to be a plateau in the hydraulic conductivity values for CG-treated soil mixtures between 12.5 kPa and 50 kPa applied stress, suggesting that hydraulic conductivity stabilizes and remains relatively constant throughout this stress interval. Nevertheless, for the RC-treated mixtures, the 20% RC content yields the lowest hydraulic conductivity values at the highest stress levels, but not at 200 kPa applied stress. This implies that the optimal percentage of recycled material may vary depending on the material type and applied stress conditions. One potential reason for this phenomenon is that the addition of RC may cause the soil particles to rearrange under stress, resulting in changes in the pore size and distribution.

3.3. Impact of RC or CG Inclusion on Hydraulic Conductivity

The evolution of hydraulic conductivity (k) with increasing amounts of CG and RC are depicted in Figure 9. Regardless the type and content of recycled waste, the range of most measured k under identical applied σ are similar. The relationship between the content of CG and RC and hydraulic conductivity is nonmonotonic. Adding CG initially enhances hydraulic conductivity up to a certain threshold. However, beyond that threshold, further increases in the content (φ) of CG cause a reduction in the value of k, whereas adding RC initially deteriorates hydraulic conductivity and then increases up to a certain threshold, beyond which further addition of RC causes a reduction in the value of k. The trends of hydraulic conductivity variation for different recycled waste are different. For example, the hydraulic conductivity of soil–glass composite at 100 kPa increased from 1.63 × 10⁻⁶ cm/s to 1.82 × 10⁻⁸ m/s and dropped subsequently to 1.47 × 10⁻⁸ m/s and finally reached 1.31 × 10⁻⁶ cm/s due to the inclusion of 0%, 5%, 10% and 20% of glass particles, respectively. Nevertheless, the hydraulic conductivity of soil–rubber composite at 100 kPa initially dropped from 1.63 × 10⁻⁸ m/s to 1.34 × 10⁻⁸ m/s and then rose to 1.47 × 10⁻⁸ m/s before further declining again and finally reached 1.31 × 10⁻⁸ m/s due to the inclusion of 0%, 5%, 10% and 20% of rubber particles, respectively. The reason for higher k of reactive soil reinforced with certain content of recycled waste can be explained by the following: the addition of solid waste particles may lead to the formation of larger pores and void spaces, which increases the overall soil hydraulic conductivity. It is worth noting that the above phenomenon is more pronounced under high-stress conditions.
Figure 10 shows the relationship between hydraulic conductivity and void ratio values at different additive contents. Although scattered, for all treated and untreated reactive soil, an evident correlation between the void ratio and hydraulic conductivity can be observed: the higher the void ratio, the higher the hydraulic conductivity, which indicates that Taylor’s e-log(k) relationship could be applied throughout.
Hydraulic conductivity versus the void ratio of CG-treated soil is displayed in Figure 10a. It was seen that the relationship between void ratio and hydraulic conductivity was roughly linear for void ratios below 0.6, where a similar trend was also found in RC-treated soil as shown in Figure 10b. A comparison of the hydraulic conductivity among CG/RC treated soil at an identical void ratio of 0.65 is listed in Table 5. There is a drop of over 98% from untreated soil (3.09 × 10⁻⁶ m/s) when adding recycled waste into reactive soil. The comparison study of the two types of reinforced soil also revealed that the hydraulic conductivity values exhibit relatively smaller fluctuations for the addition of crushed glass (CG). The range of hydraulic conductivity values for the CG addition is between 0.98% (3.03 × 10⁻⁸ m/s) and 1.04% (3.21 × 10⁻⁸ m/s) compared with untreated reactive soil, while the hydraulic conductivity of soil–rubber composite exhibits prominent fluctuations, varying from 0.69% (2.12 × 10⁻⁸ m/s) to 1.41% (4.36 × 10⁻⁸ m/s) of untreated soil.
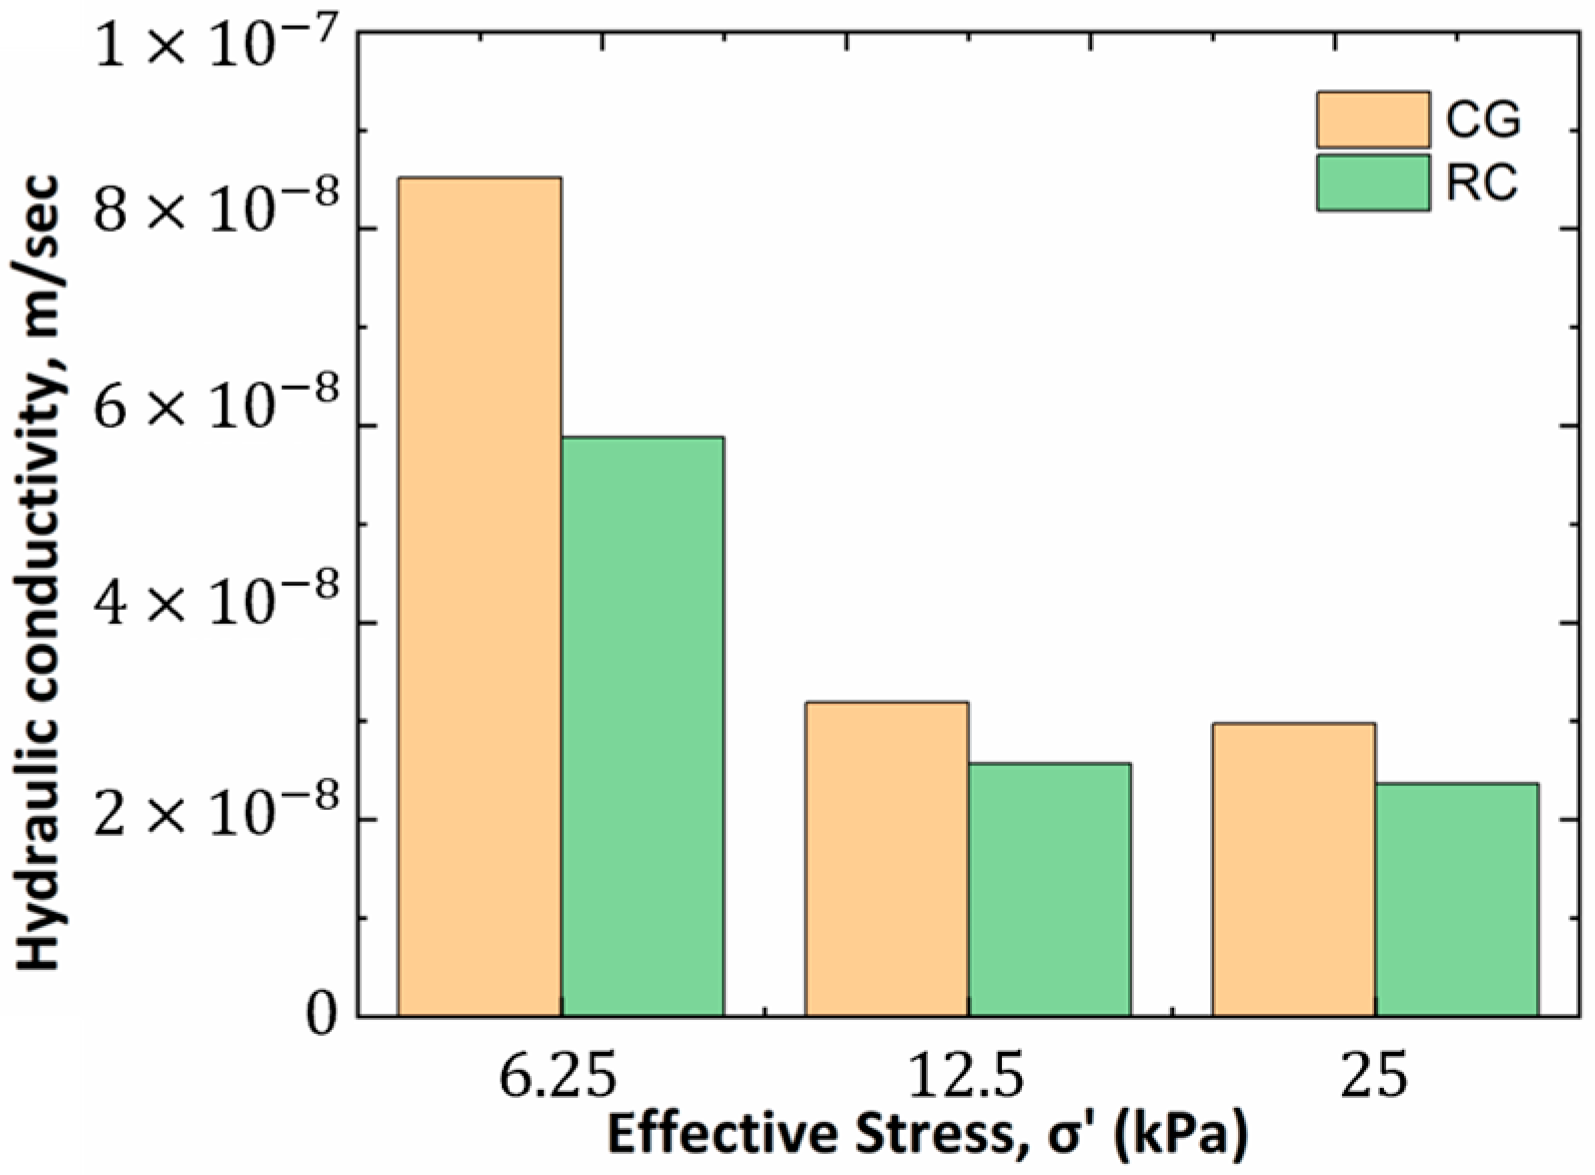
The effect of soil reinforced with the same amount (5%) of two different types of recycled wastes (i.e., RC and CG) on the measured k values is plotted in Figure 11. Regardless of the stress state conditions, the k for soil treated with CG is always higher than soil treated with RC. For identical stress state conditions, k of reactive soil in the presence of CG varied within a range from 1.24 to 1.45 times of soil with RC in all cases, indicating that CG particles had a more notable impact on k. The possible factors contributing to this trend could be the rigidity of the materials. Rubbery material could be slightly more flexible than glass, which could allow the rubber to better conform to the soil particles, resulting in improved connectivity between the pores and, therefore, higher hydraulic conductivity.

3.4. Microstructure Analysis of Reactive Soil–RC/CG Composites

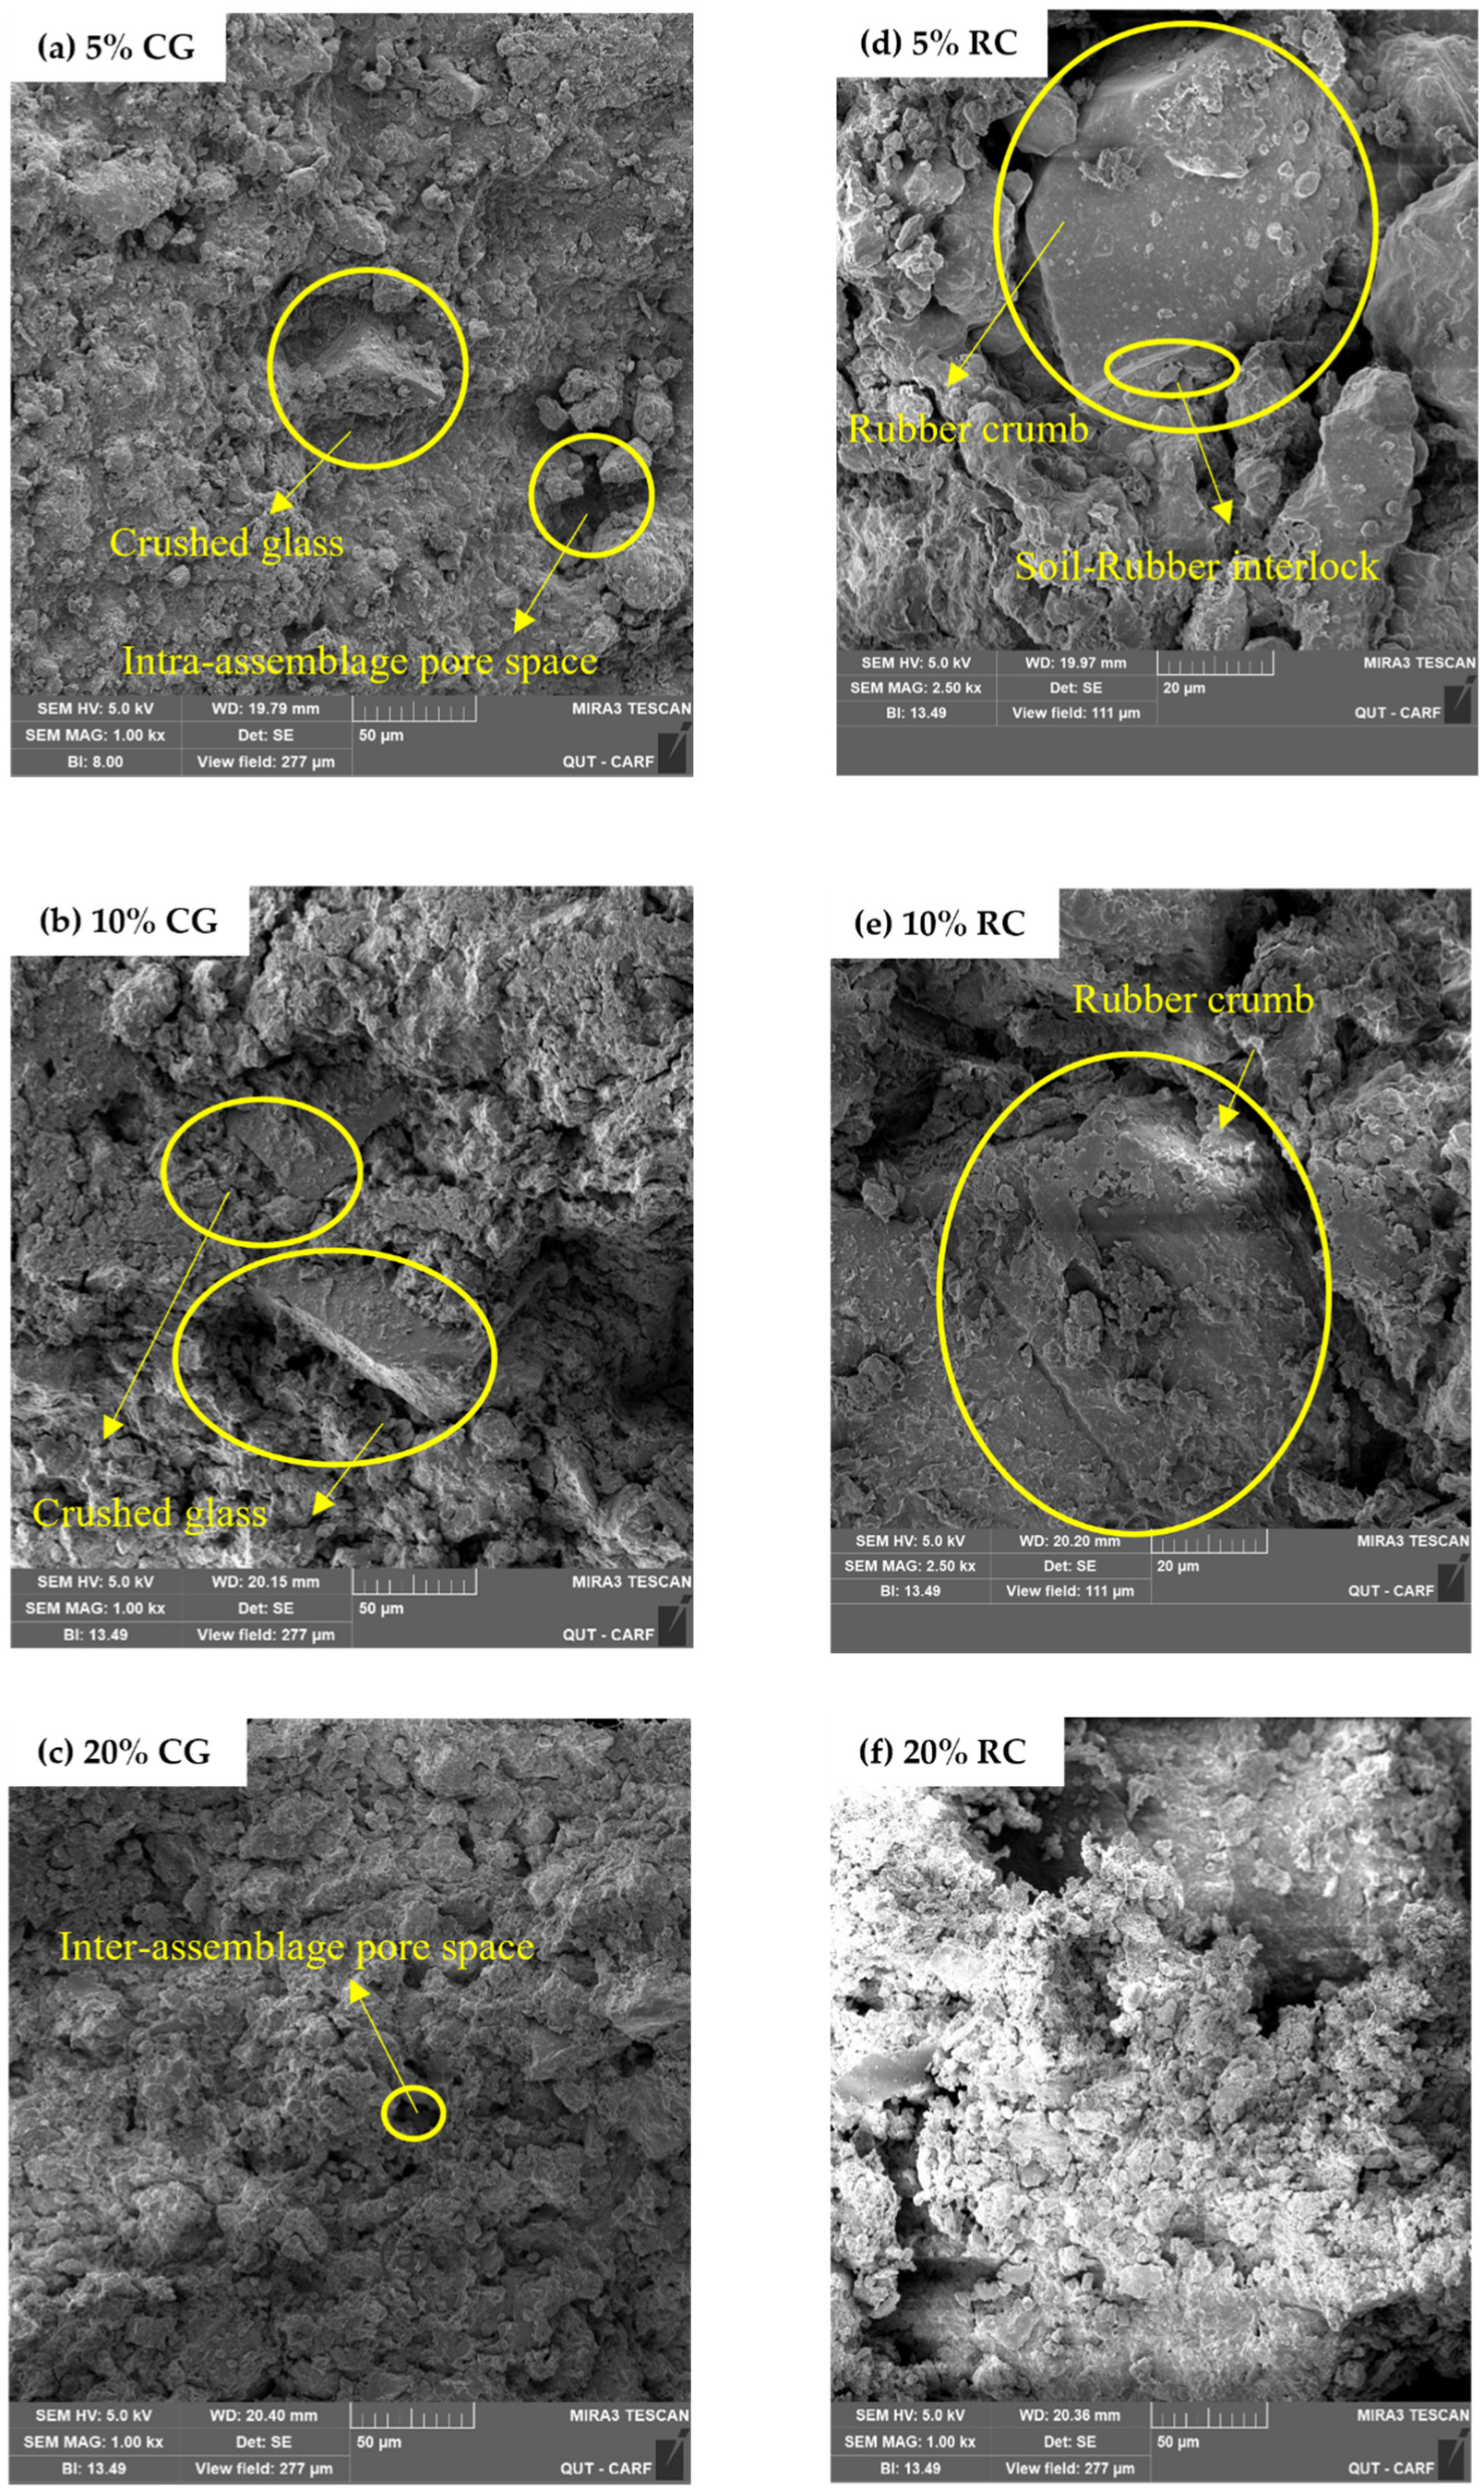
Previous studies have indicated that the void ratio, microstructures of pores, including pore size and its distribution, and basic pore water properties are the main factors dominating hydraulic conductivity of a porous medium [28]. With identical void ratio conditions, larger pore size leads to higher k. Fundamentally, pore space can be classified into intra-aggregate pores, which are defined as pores between soil particles with smaller sizes, and interaggregate pores with larger pore sizes between aggregates [32]. In order to study the effect of RC and CG on morphological structures, SEM analyses were performed on RC-and CG-stabilized soil specimens. The morphology of reactive soil in the presence of 5%, 10% and 20% CG are illustrated in Figure 12a–c, and the morphology of reactive soil in the presence of 5%, 10% and 20% RC are given in Figure 12d–f.
Figure 12a shows that many intra-aggregate pores were not filled by 5% CG aggregates. The pore size is around 1–10 μm. The addition of CG particles can create additional pore spaces within the soil structure, allowing for improved water flow and potentially increasing hydraulic conductivity. The formation of more void was also reported by Perera et al. [33]. These results can explain the increase of k at low ranges of recycled CG concentration in reactive soil.
Figure 12b,c show that adding more GC granules will form large aggregates that block pores. Many small, connected particles are captured, which contribute to a more compacted sample. For 20% CG-treated soil specimens, the pore size is less than 1 μm and nearly no interaggregate pores exist as many recycled waste granules fill interaggregate pores. Water can only flow through the intra-aggregate pores, making it a less permeable structure. These images agreed with the reduction of k value when recycled CG content reached 20% in the reactive soil specimen.
The soil sample treated with 5% RC features a loosely packed texture (Figure 12d). It can be seen that large interaggregate pores were disrupted by RC aggregates, leading to more small pores; changes in the total volume of voids are not evident, making it a larger void ratio. However, the RC particles can interlock with each other and with the surrounding soil particles, creating a denser soil structure. This interlocking can decrease soil hydraulic conductivity by reducing the number of available pores for water flow. Therefore, the interlocking concept can help explain the decrease in hydraulic conductivity observed in the 5% RC-treated soil specimen. A similar phenomenon was captured by Soltani et al. [31].
After increasing the RC content to 10%, the morphology shows that large rubber crumbs were embedded within soil aggregates, creating more interassemblage pore space, which dominates the water flow and enhances the passibility of fluids (Figure 12e). Increasing RC content leads to the formation of larger aggregates that block the pores (Figure 12f) as seen in the SEM images of the 10% and 20% CG-treated soil specimens. Additionally, a denser and more uniform soil structure was observed. The interlocking of the RC particles with the surrounding soil particles may further reduce the number of available pores for water flow. These factors contribute to the observed decrease in hydraulic conductivity at the 20% RC concentration.
From the observations above, it can be concluded that the addition of RC and CG plays an important role in hydraulic conductivity-related parameters changing pore size and distribution. When CG began to be added, large interaggregate pores were created and caused the formation of smaller pores that were more interconnected, leading to an increase in the hydraulic conductivity of the soil. More GC granules in the soil specimen will form large aggregates that block pores, and the hydraulic conductivity begins to decrease significantly. As for RC-treated soil, a soil sample treated with 5% RC experienced a decrease in hydraulic conductivity due to the presence of interlock with nearby soil aggregates. As the content of RC increases, larger rubber crumbs become embedded within soil aggregates. When the RC concentration surpasses a critical threshold, nearly all interaggregate pores become filled with additives, leading to a substantial decline in hydraulic conductivity-related parameters. It should be noted that curing time can have a significant effect on the microstructure of soil. Longer curing times can lead to further development and stabilization of the treated soil structure, resulting in improved hydraulic conductivity and other mechanical properties. Future studies could include longer curing periods and the use of advanced imaging techniques to examine the microstructure and pore connectivity of the treated soil.

4. Conclusions

In this paper, the effect of selected recycled waste inclusions, i.e., CG and RC, on hydraulic conductivity characteristics was investigated. The reactive soil was reinforced by adding different percentages of CG and RC, i.e., 0%, 5%, 10%, and 20%, to the dry weight of the soil sample. To further identify the underlying mechanisms of the observed phenomenon, the microstructure was evaluated using SEM images. Based on the findings obtained from the experimental program, the major conclusions can be summarized as follows:
  • The alteration in the initial void ratio caused by the incorporation of rubber particles is more pronounced where the increase in void ratio ( e ) can be represented as a logarithmic function in relation to the recycled waste content ( φ ).
  • The hydraulic conductivity of RC– or CG–soil composites consistently declined as the applied stress increases, which indicates a similar trend between applied stress and void ratio. Moreover, the hydraulic conductivity values for CG-treated soil mixtures tend to be stable between 12.5 kPa and 50 kPa applied stress.
  • The inclusion of RC and CG can effectively affect the hydraulic conductivity of the soil, regardless of the type of recycled waste. The relationship between the void ratio and hydraulic conductivity is nearly linear: the higher the void ratio, the higher the value of hydraulic conductivity. Meanwhile, the addition of CG initially enhances hydraulic conductivity up to a threshold, beyond which further addition causes a reduction in k, while the addition of RC initially reduces hydraulic conductivity and then increases up to a threshold, beyond which further addition causes a reduction in k.
  • Results from SEM indicate that RC and CG inclusion plays an important role in hydraulic conductivity by changing pore size and its distribution on soil morphological structure. When CG was begun to be added, large interaggregate pores were created and caused the formation of smaller pores that were more interconnected, leading to an increase in the effective porosity and hydraulic conductivity of the soil. As for RC-treated soil, soil sample treated with 5% RC experienced a decrease in hydraulic conductivity due to the presence of interlock with nearby soil aggregates. When the content of RC increases, larger rubber crumbs become embedded within soil aggregates. The hydraulic conductivity showed a significant decrease when the amount of CG or RC added was sufficient to fill all interaggregate pores.
Overall, hydraulic properties, such as the void ratio and vertical hydraulic conductivity, can be altered evidently by incorporating recycled rubber and crushed glass (RC and CG) into reactive soil or applying stress. This is due to the fact that the addition of RC and CG changes the size, shape and connectivity of soil pores, which in turn affects the flow of water through the soil. The effect of both additives on the hydraulic conductivity properties is comparable. These changes in hydraulic properties can have important implications for the performance of soil in various applications, including in construction and geotechnical engineering projects. It is important to consider the potential environmental impacts of these treatments. Further research to fully understand the potential environmental impacts of using waste materials for soil treatment and to develop strategies to minimize these impacts is essential.

Author Contributions

Conceptualization, M.Y. and Y.G.; methodology, M.Y. and Y.G; validation, R.L. and M.Y.; formal analysis, M.Y. and R.L.; data curation, M.Y. and R.L.; writing—original draft preparation, M.Y.; writing—review and editing, M.Y. and Y.G.; supervision, Y.G. All authors have read and agreed to the published version of the manuscript.

Funding

This research received no external funding.

Institutional Review Board Statement

Not applicable.

Informed Consent Statement

Not applicable.

Data Availability Statement

Data is contained within the article.

Acknowledgments

The first author acknowledge the China Scholarship Council (CSC) for scholarship support.

Conflicts of Interest

The authors declare no conflict of interest.

References

  1. Gui, Y.; Zhao, G.; Khalili, N. Experimental investigation of desiccation of clayey soils. In From Materials to Structures: Advancement through Innovation; CRC Press: Boca Raton, FL, USA, 2013. [Google Scholar]
  2. Gui, Y.L.; Hu, W.; Zhao, Z.Y.; Zhu, X. Numerical modelling of a field soil desiccation test using a cohesive fracture model with Voronoi tessellations. Acta Geotech. 2018, 13, 87–102. [Google Scholar] [CrossRef]
  3. Tang, C.-S.; Cheng, Q.; Leng, T.; Shi, B.; Zeng, H.; Inyang, H.I. Effects of wetting-drying cycles and desiccation cracks on mechanical behavior of an unsaturated soil. Catena 2020, 194, 104721. [Google Scholar] [CrossRef]
  4. Vijayan, D.; Parthiban, D. Effect of Solid waste based stabilizing material for strengthening of Expansive soil-A review. Environ. Technol. Innov. 2020, 20, 101108. [Google Scholar] [CrossRef]
  5. Jones, D.E., Jr.; Holtz, W.G. Expansive soils-the hidden disaster. Civ. Eng. 1973, 43, 49–51. [Google Scholar]
  6. Chenarboni, H.A.; Lajevardi, S.H.; MolaAbasi, H.; Zeighami, E. The effect of zeolite and cement stabilization on the mechanical behavior of expansive soils. Constr. Build. Mater. 2021, 272, 121630. [Google Scholar] [CrossRef]
  7. Mahedi, M.; Cetin, B.; White, D.J. Performance evaluation of cement and slag stabilized expansive soils. Transp. Res. Rec. 2018, 2672, 164–173. [Google Scholar] [CrossRef]
  8. Naseem, A.; Mumtaz, W.; Jalal, F.E.; De Backer, H. Stabilization of expansive soil using tire rubber powder and cement kiln dust. Soil Mech. Found. Eng. 2019, 56, 54–58. [Google Scholar] [CrossRef]
  9. Ashango, A.A.; Patra, N.R. Behavior of expansive soil treated with steel slag, rice husk ash, and lime. J. Mater. Civ. Eng. 2016, 28, 06016008. [Google Scholar] [CrossRef]
  10. Ma, J.; Su, Y.; Liu, Y.; Tao, X. Strength and microfabric of expansive soil improved with rice husk ash and lime. Adv. Civ. Eng. 2020, 2020, 9646205. [Google Scholar] [CrossRef]
  11. Thyagaraj, T.; Rao, S.M.; Suresh, P.S.; Salini, U. Laboratory studies on stabilization of an expansive soil by lime precipitation technique. J. Mater. Civ. Eng. 2012, 24, 1067–1075. [Google Scholar] [CrossRef]
  12. Dahale, P.; Nagarnaik, P.; Gajbhiye, A. Engineering behavior of remolded expansive soil with lime and flyash. Mater. Today Proc. 2017, 4, 10581–10585. [Google Scholar] [CrossRef]
  13. Li, M.; Fang, C.; Kawasaki, S.; Achal, V. Fly ash incorporated with biocement to improve strength of expansive soil. Sci. Rep. 2018, 8, 2565. [Google Scholar] [CrossRef]
  14. Mir, B. Some studies on the effect of fly ash and lime on physical and mechanical properties of expansive clay. Int. J. Civ. Eng. 2015, 13, 203–212. [Google Scholar]
  15. Sharma, A.K.; Sivapullaiah, P. Ground granulated blast furnace slag amended fly ash as an expansive soil stabilizer. Soils Found. 2016, 56, 205–212. [Google Scholar] [CrossRef]
  16. Puppala, A.J.; Griffin, J.A.; Hoyos, L.R.; Chomtid, S. Studies on sulfate-resistant cement stabilization methods to address sulfate-induced soil heave. J. Geotech. Geoenviron. Eng. 2004, 130, 391–402. [Google Scholar] [CrossRef]
  17. Sivapullaiah, P.; Sridharan, A.; Ramesh, H. Strength behaviour of lime-treated soils in the presence of sulphate. Can. Geotech. J. 2000, 37, 1358–1367. [Google Scholar] [CrossRef]
  18. Yang, Z.; Zhang, Q.; Shi, W.; Lv, J.; Lu, Z.; Ling, X. Advances in properties of rubber reinforced soil. Adv. Civ. Eng. 2020, 2020, 6629757. [Google Scholar] [CrossRef]
  19. Day, R.W. Performance of slab-on-grade foundations on expansive soil. J. Perform. Constr. Facil. 1994, 8, 129–138. [Google Scholar] [CrossRef]
  20. Yaghoubi, E.; Yaghoubi, M.; Guerrieri, M.; Sudarsanan, N. Improving expansive clay subgrades using recycled glass: Resilient modulus characteristics and pavement performance. Constr. Build. Mater. 2021, 302, 124384. [Google Scholar] [CrossRef]
  21. Andrews, B.; Rebecchi, J. Guide to Pavement Technology: Part 4E: Recycled Materials; Association of Australasian Road and Transport Agencies: Sydney, Australia, 2009. [Google Scholar]
  22. Abbaspour, M.; Aflaki, E.; Nejad, F.M. Reuse of waste tire textile fibers as soil reinforcement. J. Clean. Prod. 2019, 207, 1059–1071. [Google Scholar] [CrossRef]
  23. Bekhiti, M.; Trouzine, H.; Rabehi, M. Influence of waste tire rubber fibers on swelling behavior, unconfined compressive strength and ductility of cement stabilized bentonite clay soil. Constr. Build. Mater. 2019, 208, 304–313. [Google Scholar] [CrossRef]
  24. Özkul, Z.H.; Baykal, G. Shear Behavior of Compacted Rubber Fiber-Clay Composite in Drained and Undrained Loading. J. Geotech. Geoenviron. Eng. 2007, 133, 767–781. [Google Scholar] [CrossRef]
  25. Arrieta Baldovino, J.D.J.; dos Santos Izzo, R.L.; da Silva, É.R.; Lundgren Rose, J. Sustainable use of recycled-glass powder in soil stabilization. J. Mater. Civ. Eng. 2020, 32, 04020080. [Google Scholar] [CrossRef]
  26. Blayi, R.A.; Sherwani, A.F.H.; Ibrahim, H.H.; Faraj, R.H.; Daraei, A. Strength improvement of expansive soil by utilizing waste glass powder. Case Stud. Constr. Mater. 2020, 13, e00427. [Google Scholar] [CrossRef]
  27. Pham, B.T.; Nguyen, M.D.; Al-Ansari, N.; Tran, Q.A.; Ho, L.S.; Van Le, H.; Prakash, I. A Comparative Study of Soft Computing Models for Prediction of Permeability Coefficient of Soil. Math. Probl. Eng. 2021, 2021, 7631493. [Google Scholar] [CrossRef]
  28. Quang, N.D.; Chai, J.C. Permeability of lime-and cement-treated clayey soils. Can. Geotech. J. 2015, 52, 1221–1227. [Google Scholar] [CrossRef]
  29. Taylor, D.W. Fundamentals of soil mechanics. Soil Sci. 1948, 66, 161. [Google Scholar] [CrossRef]
  30. Jalal, F.E.; Zahid, A.; Iqbal, M.; Naseem, A.; Nabil, M. Sustainable use of soda lime glass powder (SLGP) in expansive soil stabilization. Case Stud. Constr. Mater. 2022, 17, e01559. [Google Scholar] [CrossRef]
  31. Soltani, A.; Deng, A.; Taheri, A.; Mirzababaei, M. Rubber powder–polymer combined stabilization of South Australian expansive soils. Geosynth. Int. 2018, 25, 304–321. [Google Scholar] [CrossRef]
  32. Nagaraj, T.; Miura, N. Soft Clay Behaviour Analysis and Assessment; CRC Press: Boca Raton, FL, USA, 2001. [Google Scholar]
  33. Perera, S.T.A.M.; Saberian, M.; Zhu, J.; Roychand, R.; Li, J. Effect of crushed glass on the mechanical and microstructural behavior of highly expansive clay subgrade. Case Stud. Constr. Mater. 2022, 17, e01244. [Google Scholar] [CrossRef]
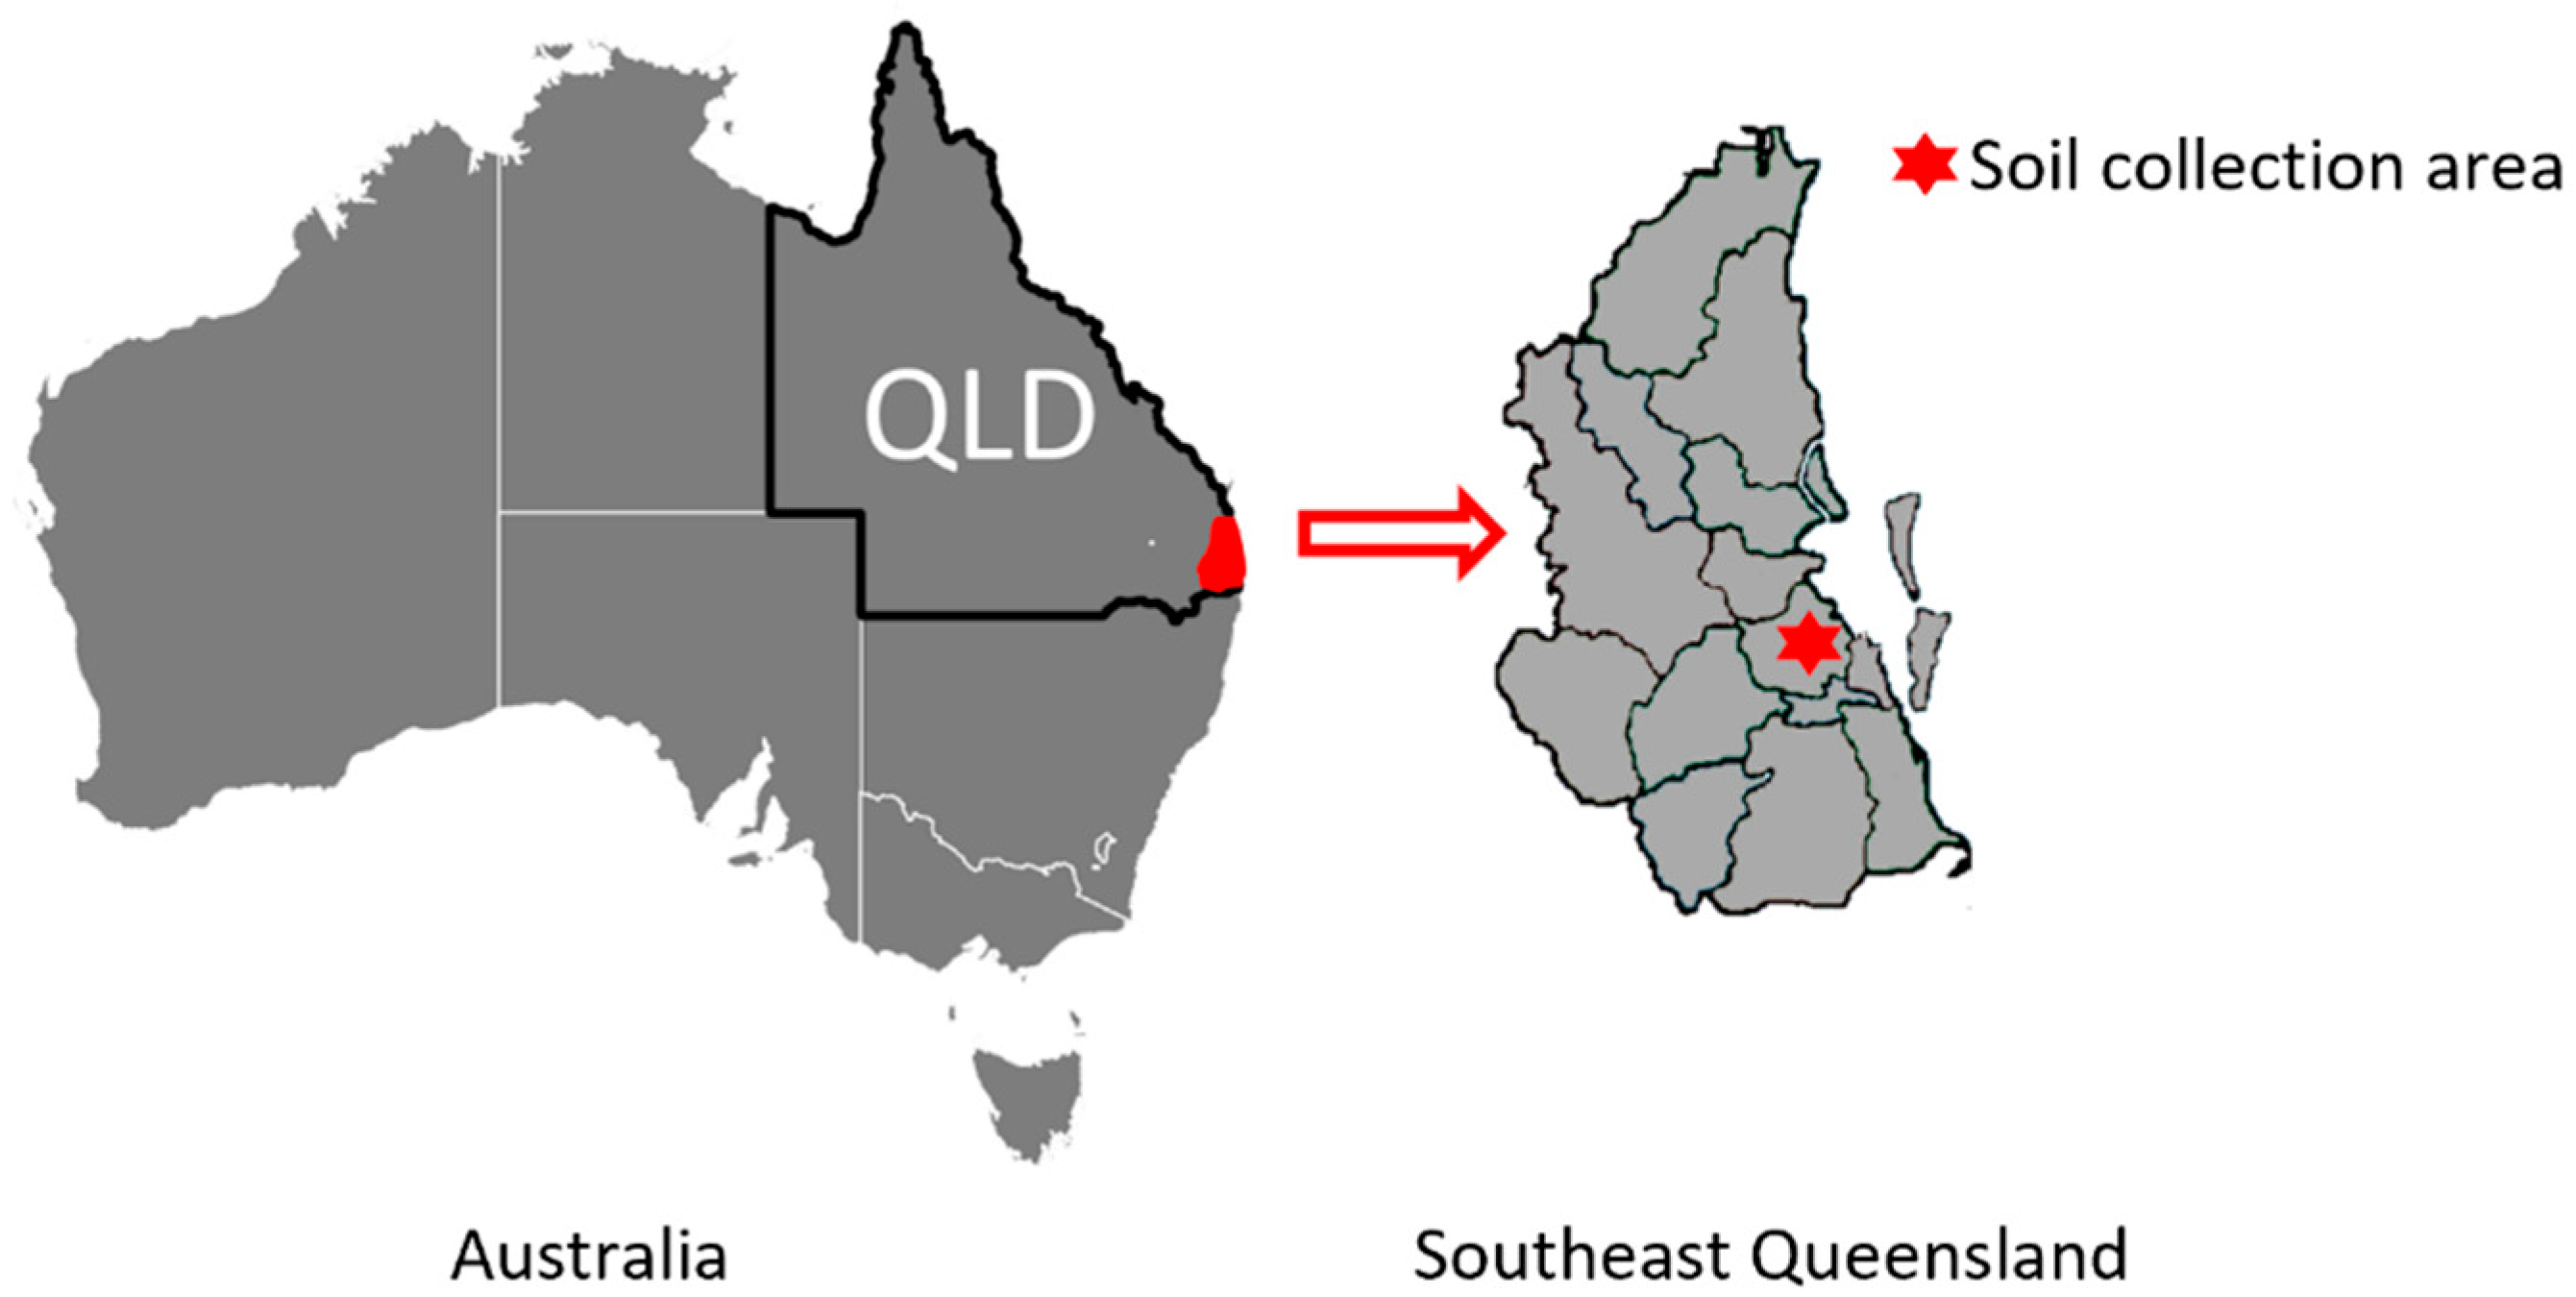
Figure 1. Southeast Queensland in Australia and location of soil collection area.
Water 15 02028 g001
Figure 2. XRD diagram of selected soil.
Water 15 02028 g002
Figure 3. (a) Recycled materials and their microstructures used in the study: (a) Rubber Crumb, (b) Crushed Glass, and micrographs of (c) Rubber Crumb and (d) Crushed Glass.
Water 15 02028 g003
Figure 4. Flow chart of treated soil specimen preparation.
Water 15 02028 g004
Figure 5. Initial void ratio of RC- and CG-treated soil before consolidation test.
Water 15 02028 g005
Figure 6. Consolidation curves for (a) CG-treated and (b) RC-treated clayey soils.
Water 15 02028 g006
Figure 7. Compression index of RC- and CG-treated soil at different stress states.
Water 15 02028 g007
Figure 8. Hydraulic conductivity subject to different loading conditions of (a) CG-treated and (b) RC-treated soil.
Water 15 02028 g008
Figure 9. Hydraulic conductivity versus different percentage of (a) CG and (b) RC inclusion in clayey soils from consolidation tests.
Water 15 02028 g009
Figure 10. Hydraulic conductivity versus void ratio of (a) CG-treated and (b) RC-treated soil.
Water 15 02028 g010
Figure 11. Effect of the same amount (5%) of different recycled waste granules on hydraulic conductivity, k, measured in consolidation tests at different values of applied stress.
Water 15 02028 g011
Figure 12. SEM images of (a) 5% glass-treated soil, (b) 10% glass-treated soil, (c) 20% glass-treated soil, (d) 5% rubber-treated soil, (e) 10% rubber-treated soil, and (f) 20% rubber-treated soil after consolidation tests.
Water 15 02028 g012
Table 1. Basic engineering properties of the soil.
Material TypePropertyValueUnitTest Standard
Reactive soilAtterberg limits ASTM D4318 (ASTM, 2017)
  Liquid limit29%
  Plastic index15%
  Linear shrinkage6.8%ASTM D854 (ASTM, 2017)
  Specific gravity2.67 ASTM D854 (ASTM, 2017)
Table 2. Mineral compositions and percentage of selected soil.
Mineral CompositionsSoil Content (%)
Coroudum23.17
Quartz30.26
Anatase1.19
Hematite1.53
Geothite3.33
Plagioclase (Albite)1.97
Plagioclase (Oligoclase, An16)7.40
Plagioclase (Oligoclase, An25)0.95
Microcline (maximum)2.73
Microcline (intermediate)0.63
Illite 2M17.05
Kaolinite (Kga-1b), PONKCS model3.64
Smectite 12 Å (SWy-2), PONKCS model10.29
Smectite 12 Å (SCa-3), PONKCS model5.87
Table 3. Summary of test program in this study.
Test ProgramCuring TimeRC or CG Added (%)Applied Stress (kPa)
051020
Consolidation tests7 days6.25, 12.5, 25, 50, 100, 200
SEM imaging7 days /
Table 4. Compression index of reactive soil treated with different recycled waste granule.
Recycled Waste TypeContent (%) Compression   Index   ( C c )
Nontreated00.152
Recycled rubber crumb50.116
100.154
200.125
Recycled crushed glass50.149
100.123
200.111
Table 5. Hydraulic conductivity of reactive soil treated with RC/CG at identical void ratio = 0.65.
Content, %Crushed Glass (CG)Rubber Crumb (RC)
03.09 × 10⁻⁶ m/s3.09 × 10−6 m/s
53.08 × 10⁻⁸ m/s2.12 × 10−8 m/s
103.21 × 10⁻⁸ m/s4.36 × 10−8 m/s
203.03 × 10⁻⁸ m/s3.60 × 10−8 m/s
Disclaimer/Publisher’s Note: The statements, opinions and data contained in all publications are solely those of the individual author(s) and contributor(s) and not of MDPI and/or the editor(s). MDPI and/or the editor(s) disclaim responsibility for any injury to people or property resulting from any ideas, methods, instructions or products referred to in the content.