Communication

Vapour Multicycle Sorption of a Cement–Bentonite Cutoff Wall Material: Hysteresis Effects

by
Sarah Al-Baiaty
and
Abdelmalek Bouazza
*
Department of Civil Engineering, Monash University, 23 College Walk, Melbourne, VIC 3800, Australia
*
Author to whom correspondence should be addressed.
Water 2023, 15(13), 2469; https://doi.org/10.3390/w15132469
Submission received: 3 April 2023 / Revised: 19 June 2023 / Accepted: 20 June 2023 / Published: 5 July 2023
(This article belongs to the Special Issue Recent Advancements in Unsaturated Soil Mechanics)

Abstract

:
This paper examines the effects of multicycles of desorption/adsorption on the water isotherms of a typical cement–bentonite mixture. These water isotherms were evaluated over a relative humidity (RH) range of 90% and 0.3%. This study shows that, after the first adsorption–desorption cycle, the subsequent cycle shifted the water isotherm curves upward, particularly at RH < 70%, with a high degree of hysteresis. In contrast, at RH > 70%, the water isotherm curves shifted slightly downward with a low degree of hysteresis. The overall degree of hysteresis slightly decreased with the subsequent cycles. It is postulated that multi-adsorption–desorption cycles led to microstructural changes in the CB porous system as the CB material’s water retention ability was enhanced by increasing isotherm cycles.

1. Introduction

Cement–bentonite (CB) cut-off walls are commonly used to contain waste or encapsulate contaminated sites because the CB materials provide a hydraulic barrier against solutes or gas movement. CB slurry mixes typically contain 5–7% bentonite and 15–25% cement of the total mass of water [1,2,3,4]. The cement matrix usually contains additives such as slag or fly ash [2,4,5]. For cut-off wall construction, a cement replacement of 60–80% with ground granulated blast furnace slag (GGBS) or up to 30% with fly ash can be used in a cement matrix. GGBS is often used in CB mixes because it reduces hydraulic conductivity and increases strength [2,5,6]. Fly ash is primarily used in acidic environments where protection against sulphate attack is necessary [2,3,4,5].
As most porous systems are susceptible to moisture changes, the CB wall’s effectiveness as a barrier against gas/vapour movement above the water table is still fraught with uncertainties due to the presence of a relatively dry section in the upper part of the wall. This dry section can become problematic if vapours or gases are to be contained since they can migrate through air-filled voids more quickly than if the voids are water-filled. Furthermore, exposure of the upper part of the CB wall to atmospheric conditions can also lead to drying and the formation of microcracks within the CB matrix, which can exacerbate gas or vapour migration through the wall [6,7,8,9]. Jefferis [5] observed that water in the surrounding soils was insufficient to avoid desiccation within the CB matrix, even at depths of 2 m for uncapped cutoff walls. Seasonal wetting–drying cycles can also cause cracking in the upper part of the CB wall; Joshi [10] observed fissure cracks in the part of the wall near the groundwater table that was susceptible to the drying–wetting cycles. Thus, understanding the water dynamics in the unsaturated portion of a CB wall is primordial to gaining insight into the behaviour of CB cutoff walls under unsaturated conditions.
This paper examines the water retention properties of typical CB materials. Water vapour isotherms were used to identify the amount of moisture retained and removed within the CB porous system under wetting–drying cycles. The CB materials’ hysteresis/irreversible changes were evaluated and contrasted through their response over the isotherm cycles. Such information would be valuable in describing the hydraulic response of CB cut-off wall materials under unsaturated conditions.

2. Materials and Methods

2.1. Materials

A commercially available sodium bentonite powder (Volclay, CETCO Australia), typically used in the construction of cut-off walls, was used in this study. Its mineralogical properties are presented in Table 1. The cation exchange capacity (CEC) measurement of the <2 µm fraction was obtained using the barium chloride (BaCl2) compulsive exchange method [11] with barium (Ba) analysis via X-ray fluorescence (XRF). The mineralogical composition of the bentonite was determined using quantitative X-ray diffraction (XRD) analysis. The XRD analysis was conducted using a PANalytical X’ Pert Pro Multi-Purpose Diffractometer after the samples were calcium saturated. The <2 µm fraction was separated by centrifugation from the bulk of bentonite materials and used for the XRD analysis. Approximately 2 g were dispersed with the aid of NaCl and vigorously shaken, then repeatedly centrifuged at 570 g, with the supernatant collected after each centrifugation to extract all of the <2 μm fractions. A special purpose (SP) cement (Boral, Melbourne, Australia) was used in the current investigation. This cement is typically used in applications where aggressive sulphate-rich environments and other aggressive salts and solutions are expected. The cement complied with the Australian Standard AS3972, LH/SR type, special purposes cement. It comprised cement clinker, ground-granulated blast furnace slag (GGBSF) (40 cement/60 GGBSF), and gypsum.

2.2. Experimental Methods

2.2.1. Sample Preparation and Pre-Conditioning

The CB slurry mixture was prepared according to a standard specification [7]. It included 5% bentonite and 20% cement of the total mass of water, with a water-to-binder ratio of 3.0. The resulting mix had a density of 1220 Kg/m3 and filter loss of ≤2% within 24 h. These values were within the required range specified in the ICE guidelines [7]. The unconfined compressive strength of the CB mix was recorded at 793 kPa at 28 days, and the saturated hydraulic conductivity was 9.30 × 10⁻¹⁰ m/s at 90 days. Both values were within the ICE specifications [7], which recommend that the unconfined strength at 28 days should be more than 100 kPa and the saturated hydraulic conductivity at 90 days to be in the range of 10−8 to 10−9 m/s.
Cement-based materials’ unsaturated properties are directly related to their internal structure, and this structure can change during the curing period due to unhindered cement hydration [12,13]. In the current study, cement hydration was stopped after 28 days of curing using a solvent exchange method [14] on specimens cut into thin slices of 30 mm diameter by 8 mm thickness. This method involved removing the free water, 50–70% of the water, in the CB pore system by immersing a CB specimen in a cylinder filled with isopropanol for 10 days at room temperature. The immersion period (i.e., 10 days) was selected based on cement and concrete studies reported by Scrivener [14] and Zhang [15]. They recommended using a short immersion period (i.e., a maximum of 10 days), as it allowed the water to be confined in small pores. The current study investigated 10- and 14-day immersion durations in isopropanol. It was observed that the 14-day soaking period removed approximately 95% of the moisture but caused cracks and volume changes in the CB specimens.
In contrast, the 10-day immersion period released approximately 60% of the water from the CB specimens without causing cracks or volume changes. To ensure optimum water replacement, the volume of isopropanol was approximately 100 times the CB volume, and the solvent was changed twice during the exchange duration. This process was followed by removing the CB specimens from the solvent exchange cylinder and placing them inside a desiccator with silica gel under a drying vacuum for 3 days to remove the solvent from the CB pores [14].

2.2.2. Test Method

A dynamic vapour sorption analyser (DVS) (Decagon, Pullman, WA, USA) was used to measure the uptake and release of moisture from the CB pore system gravimetrically. DVS imposes drying by allowing dry air to flow through desiccant tubes across the specimen, and wetting by saturating the air with water before entering the chamber to flow across the specimen. It also has a custom-built system that records the equilibrium progress at each controlled humidity level. When the steady weight of the specimen is achieved and equilibrium between the specimen’s water activity and controlled humidity is targeted, it steps automatically to the subsequent relative humidity.
In the current experiment, a CB specimen (1 to 1.2 gm) was placed in the DVS analyser at room temperature (200 ± 0.10 °C), and its initial internal humidity was recorded. The internal relative humidity (RH) was approximately 70%; it equilibrated as an initial RH starting point. Then, the CB specimen was exposed to progressive drying from the initial relative humidity of 70% to 0.3% to ensure complete drying. As a porous system, the CB materials may be susceptible to irreversible pore network changes due to drying. Thus, once the first drying stage was completed, the CB specimen was subjected to six different stages: three adsorption and three desorption stages, resulting in three adsorption–desorption (Ads–Des) water cycles.
In the first Ads–Des cycle, the CB specimen was exposed to progressive wetting during the adsorption leg from RH = 0.3% to RH = 85%. Once this stage was completed, the CB specimen was dried from RH = 85% to RH = 0.3% for the first desorption leg. On completion of the first cycle, the second and third (Ads–Des) cycles followed to evaluate any further changes in CB hydration under the effect of multiple cycles on adsorption and desorption isotherms.
The equilibrium mass at each relative humidity increment was deemed to be attained when the ratio of sample mass change per unit time (dm/dt) was less than 0.01%/min, as suggested by Kumar [16] and Jennings [17]. The experimental stages lasted about 1 month, with data acquisition at 5 min intervals.

3. Results and Discussion

The temporal changes in the gravimetric water content of the CB materials are shown in Figure 1 for each of the three adsorption–desorption (Ads–Des) cycles. The cycling process started after the CB specimen had dried and equilibrated at RH = 30% from the initial humidity of RH~70%. The initial internal humidity was the starting point when the cement hydration was halted by removing approximately 60% of the water from the CB porous system. The percentage of water removal from the CB specimen was measured once the specimen completed the preconditioning period (i.e., 10 days of immersion in isopropanol followed by 3 days of vacuum drying). It is important to emphasise that water from any porous system cannot leave the interlayer spaces between the hydration sheets (i.e., the C-S-H phase, the smallest pores in the porous system < 2 nm) during desorption until RH < 25% is achieved [17,18].
It can be seen from Figure 1 that, in the adsorption stage of the first Ads–Des cycle, the gain in water vapour was significant when the specimen equilibrated at RH = 85% and was higher than in the subsequent adsorption stages of the second and third Ads–Des cycles. The equilibrated gravimetric water content (GWC) at RH = 85% reduced from 14.5% at the first adsorption stage to 13.5% and 12% at the second and third adsorption stages, respectively. This decreasing trend is probably due to the changes in the CB pore structure, particularly the capillary pores, as a result of the subsequent cycles. Capillary pores are the larger pores in the porous system (≈10 µm to ≈8 nm), and they are responsible for retaining water within the estimated range of RH > 80% [17,18,19]. The capillary pores in a CB porous system could be subjected to a microstructural change, which results in the expansion or enlargement of capillary pores under each cycle that can only be filled with water at RH = 100% or vacuum saturation condition [16,17,18,20]. When comparing the desorption isotherm stages for each cycle (i.e., first to subsequent Ads-Des cycles) (Figure 1), the gravimetric water content of the CB specimen equilibrated, for example, at RH = 10%, increased with the following desorption stages for each cycle process. The GWC had risen from 1% at RH = 10% during the first drying stage and continued to increase for subsequent drying stages to GWC = 4% during the third cycle drying stage. This may be due to the CB microstructure’s densification, which could occur from the collapse of the hydration sheets under the effect of subsequent cycles. The collapse of the hydration products can also increase the volume of the small pores due to pore filling at the expense of capillary pores [17,18,19]; that, in turn, can increase the amount of inkbottle formation within the CB microstructure and consequently increase the amount of retained water. This study used a scanning electron microscope (SEM) (Quanta 3D FEG) to obtain microstructure images of CB specimens (Figure 2a–c). The CB specimen was cored from a CB sample after the preconditioning period (i.e., about 30–40% of moisture remained confined in the CB pores) and then coated with a double carbon layer.
Figure 2a illustrates the general view of the CB microstructure at 6500 magnification and 30 kV. At a higher magnification, it was observed that the C-S-H sheet collapsed and new pores formed within the observed area (Figure 2b, marked area before C-S-H collapsed; Figure 2c, marked area after C-S-H sheet collapsed). This study suggests that this observation likely reflects the changing microstructural conditions in the CB specimen during the subsequent isotherm cycles. It is worth noting here that the SEM chamber can also dry the specimen completely after a short time.
A similar observation was reported by Jennings [17,18]. They indicated that when enough water is removed from the interlayer space between the hydration sheets, it causes the separation of the hydration sheet from the capillary pores. The collapsed hydration sheets can reduce porosity and increase the C-S-H density [17]. In the case of a porous CB material system, the reduction in porosity can promote its water retention ability during the following isotherm cycles. However, this response (i.e., water retention enhancement at subsequent isotherm cycles) can be different in other porous material systems. The current study’s results suggest that the CB material’s porous system was exposed to a significant disturbance, with irreversible changes initiated from the first desorption stage (i.e., the starting point in Figure 1) and continued under the effect of subsequent isotherm cycles.
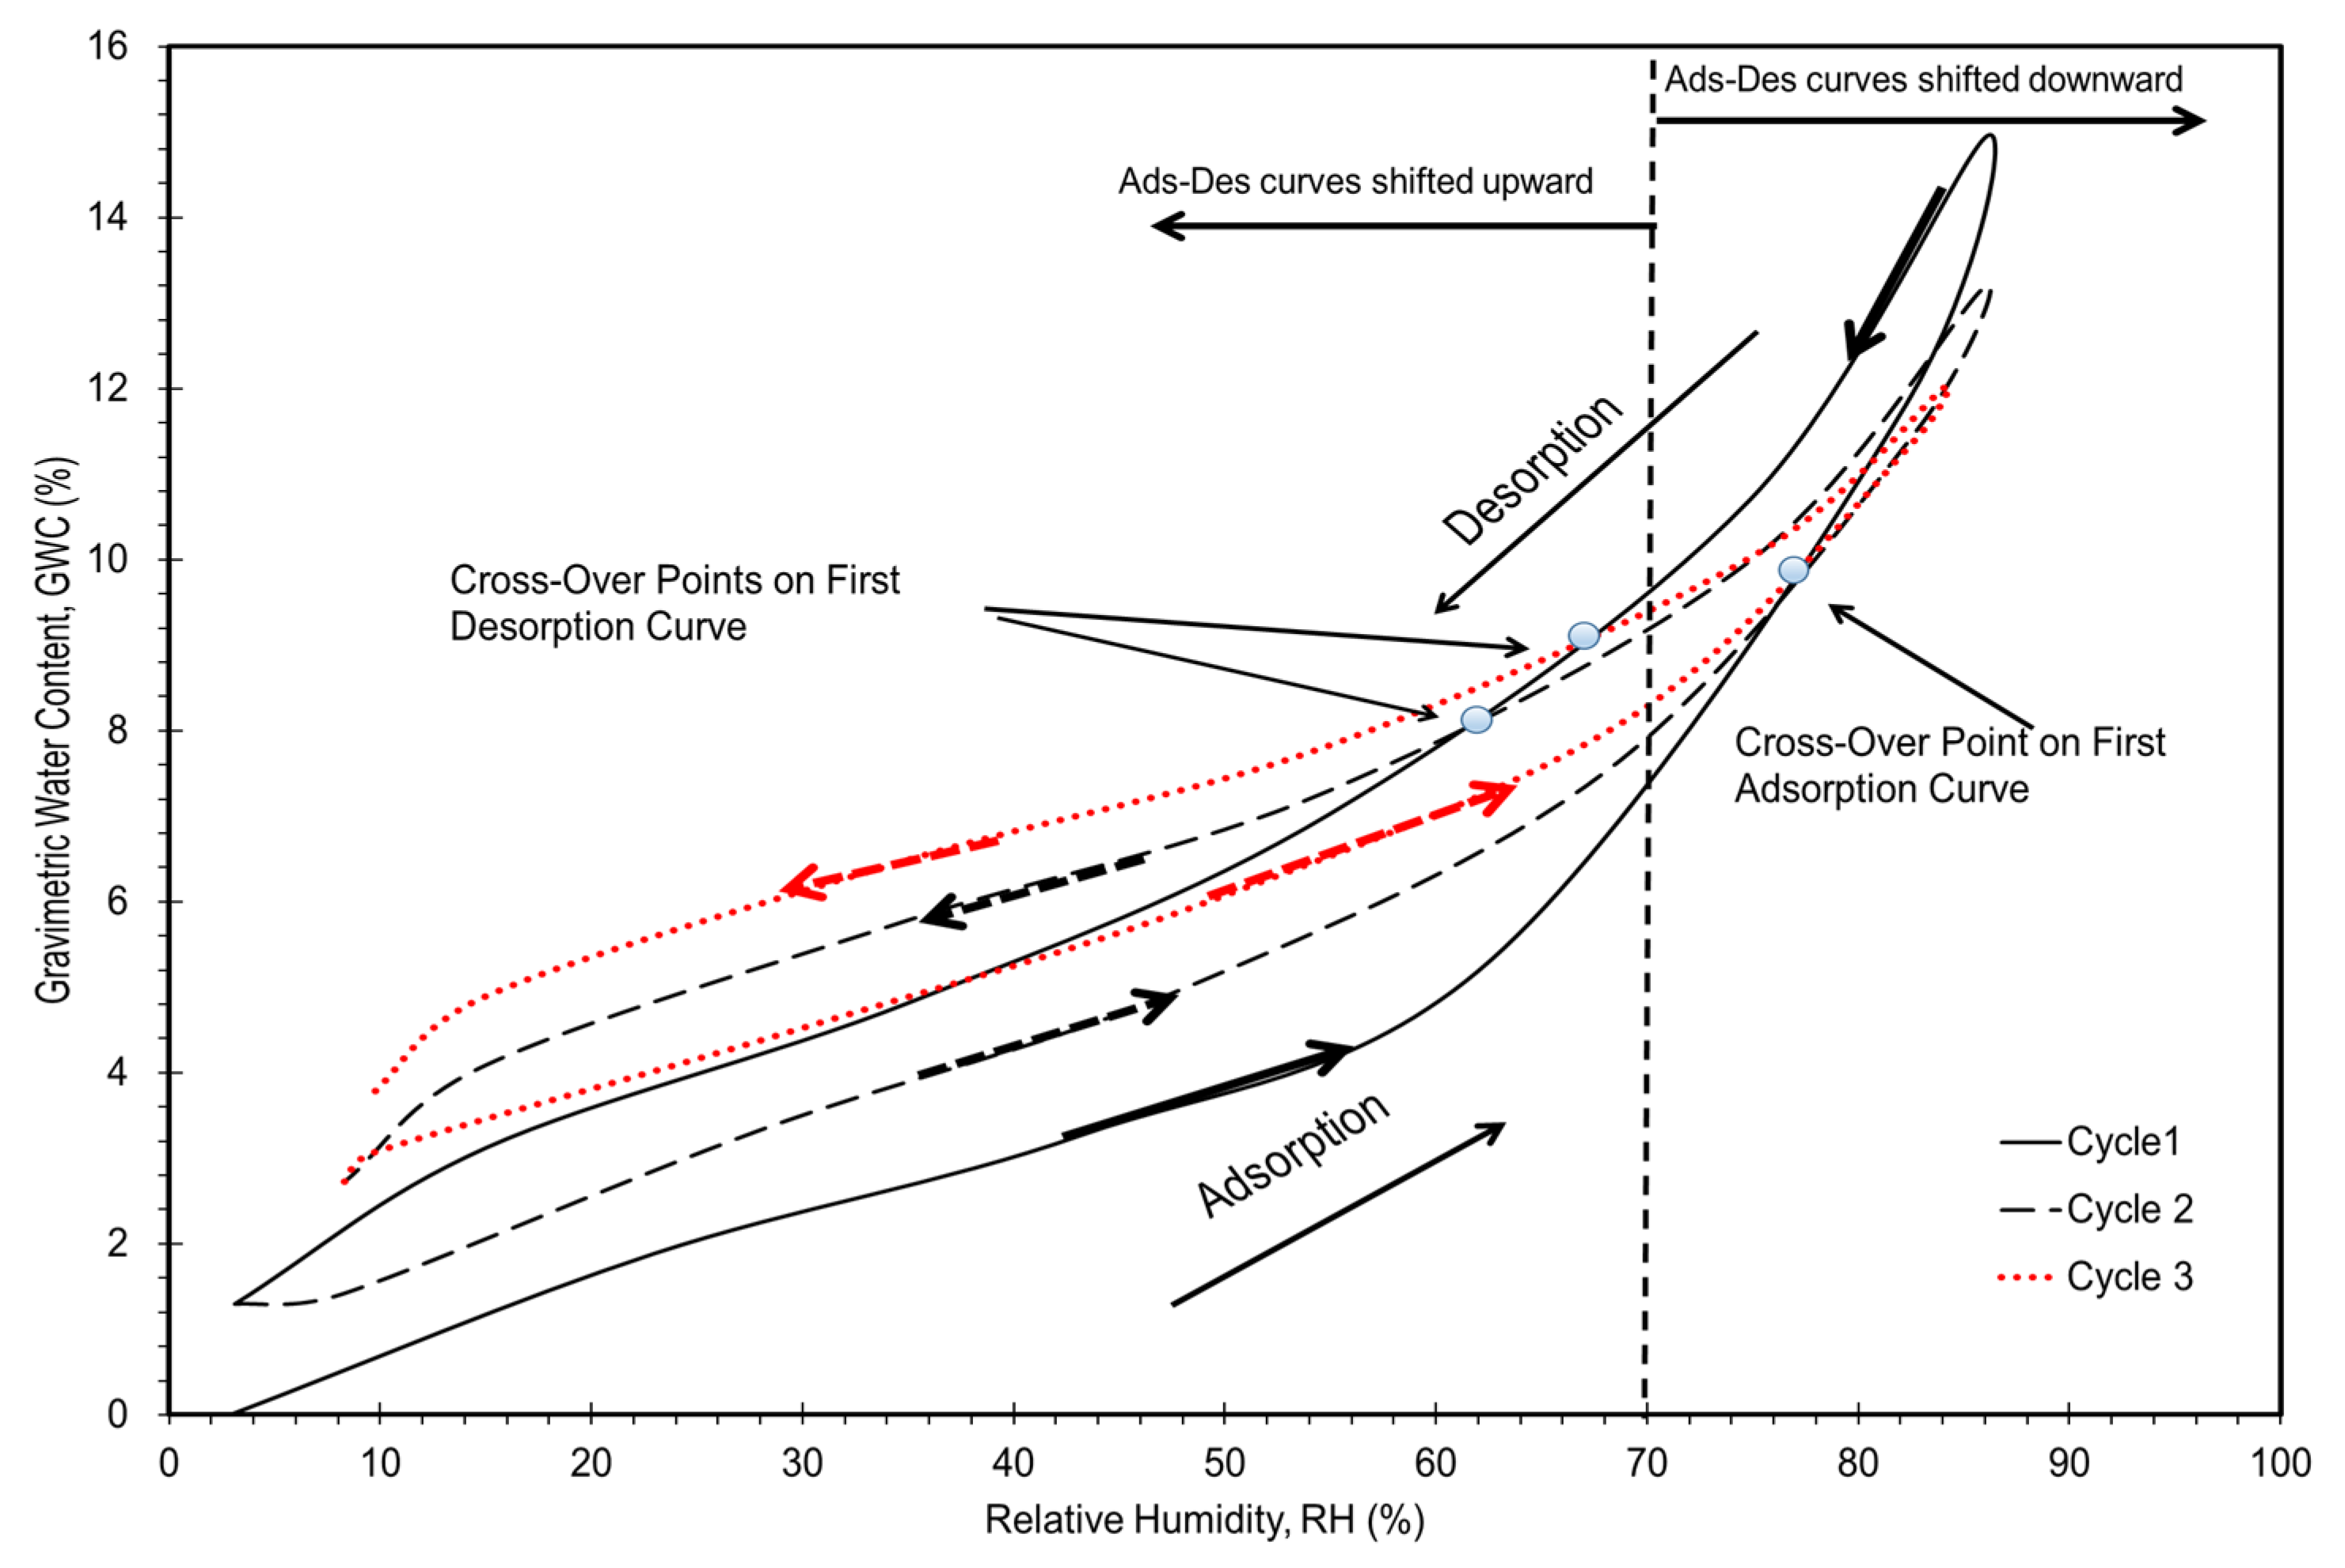
The three Ads–Des cycles are reported in Figure 3 in terms of gravimetric water content versus relative humidity (RH). As seen in Figure 3, the Ads–Des curves changed with the subsequent cycles: relative to the initial cycle, the Ads–Des curves of subsequent Ads–Des cycles resulted in a loss of water content at RH > 70% but an increase in water content at RH < 70%. The pores that empty within the estimated range of 80% ≤ RH ≤ 25% are defined as gel pores (of width ≈4 nm to ≈10 nm), whereas the moisture storage at RH < 25% is affected by the interlayer space between the hydration sheet (<2 nm); this space is characterised as the smallest pores in the porous system [17,18,19]. Comparing the desorption stages for each Ads–Des isotherm cycle, one can infer that the total pore volume is low when RH < 70%. Each subsequent Ads–Des cycle results in cross-over points on the first desorption curve (Figure 3). The cross-over point moved from RH = 62% for the second desorption cycle to approximately RH = 68% for the third desorption cycle. This behaviour could be associated with irreversible changes in CB microstructure, typically occurring within the drying stages [12]. It indicates that the gel pores experienced a possible denser structure or pore filling during the subsequent drying stages. The drying cycles increased the volume of the small pores and the formation of the ink bottle [21]. The amount of retained moisture depends on the ink bottle and the size of the neck pores [22]; this means that during the subsequent drying stage, the water cannot be entirely extracted due to the enclosed water within the small pores [12].
It is evident that desorption caused an alteration/rearrangement of the CB microstructure. Such an effect on the CB microstructure could also influence the water uptake process in the adsorption stages. The gain of moisture of the CB specimen increased in the subsequent adsorption stages, particularly at a range of RH < 70%; in contrast, at over 70% RH, it decreased (Figure 3). A cross-over point was identified at RH = 80% for the second and third adsorption cycles. The amount of absorbed water was reduced at RH > 80% within the subsequent adsorption cycles. As mentioned previously, this is likely due to an increase in capillary pores’ size. Pores larger than 200 nm are considered devoid of condensed water and require RH = 100% to achieve equilibrium conditions (i.e., it takes a long time to refill these pores at RH = 100% unless performed under vacuum saturation) [17].
It is interesting to note that for materials such as cement or concrete, no further changes were observed after the first isotherm cycle in their water isotherm behaviour and microstructure under the following isotherm cycles [16,17], as all the subsequent cycle curves (i.e., desorption and adsorption curves) overlaid each other. The reason is that cement and concrete have a more rigid structure than CB materials. After the first desorption stage to RH ≤ 25% (i.e., after the water removal from the hydration sheets) is completed, the cement and concrete materials’ C-S-H structure is considered to be stable [17]. As indicated by Kumar [16] and Jennings [17], the porous structure of cement or concrete materials can develop a strong bond region, similar to the bonds between the interlayers of hydration sheets, with no further changes imposed in the following isotherm cycles.
It is also interesting to draw a parallel to work conducted on cementitious materials to shed more light on the evolution of the CB materials’ water vapour isotherms. The nature of irreversible changes mentioned previously is described in well-hydrated cement materials across a range of RH (100–0.7%) by [17,18], who showed that the significant volume change in capillary pores occurring upon drying to 0.7% RH was associated with the emptying of the interlayer space between the hydration sheets, which, in turn, increased the polymerisation and the density of the C-S-H. Also, the minimum porosity achievable in a cementitious system is referred to as a gel pore [17,18,20,23], where large meso-pores are associated with 85% ≥ RH ≥ 50% and small meso-pores with 50% ≥ RH ≥ 25%; lower than 25% RH, the gel pore is assigned to the interlayer space between the hydration sheets that confines water, known as the hydration pressure or the disjointed pressure [17]. Jennings [17,18] indicated that this division of gel pores was assigned based on the inflection point observed between the first isotherm cycle and the following isotherm cycles identified to occur at about RH = 50%, where all the desorption isotherm cycle curves (i.e., the first and the subsequent cycles) start overlaying each other from 50% RH down to 0.7% RH. This inflection point is also identified as a separation point between the small gel pores, the interlayer space of the hydration sheets, and the large gel pores and capillary pores.
In contrast, changes in the water isotherm cycles of the CB material (i.e., desorption and adsorption) occurred across all RH ranges (85–0.3%). Each isotherm cycle shows a dependent history, which manifests at the cross-over points on the desorption curves at 60% and 68% RH, as seen in Figure 3. These points are where the CB material starts experiencing an enhancement in its water retention ability in the following isotherm cycles compared to the first isotherm cycle. The separation between the capillary and gel pores can be arbitrary, as it is likely a function of the topology of the material microstructure and the C-S-H phase in terms of the calcium/silica ratio [24,25]. However, based on the results of this study, the range of RH ≥ 70% can be defined as the separate region between the capillary and gel pores for the CB materials. However, more research is warranted to confirm this observation.
The current study suggests that the CB porous system’s disturbance (i.e., rearrangement to the CB pores size) favours small pores, gel pores, and the interlayer space between hydration sheets at the expense of capillary pores. The volume of small pores in the CB porous system may increase as it is accompanied by the collapse of the hydration sheets under desorption cycles. When the water re-enters these small pores in the next adsorption stage, it will be confined under high pressure and will not be removed later at the successive desorption cycles, even at low RH ≤ 25%. This is the main reason why hysteresis occurs. One can observe from Figure 2 that the hysteresis was high at RH < 80%, and the amount of water trapped at this range of RH was high. However, the adsorption curves are slightly parallel to the desorption curves at RH < 80%. At higher RH, the Ads–Des curves become closer, suggesting no significant microstructural changes occur to the large pores around RH < 80%.
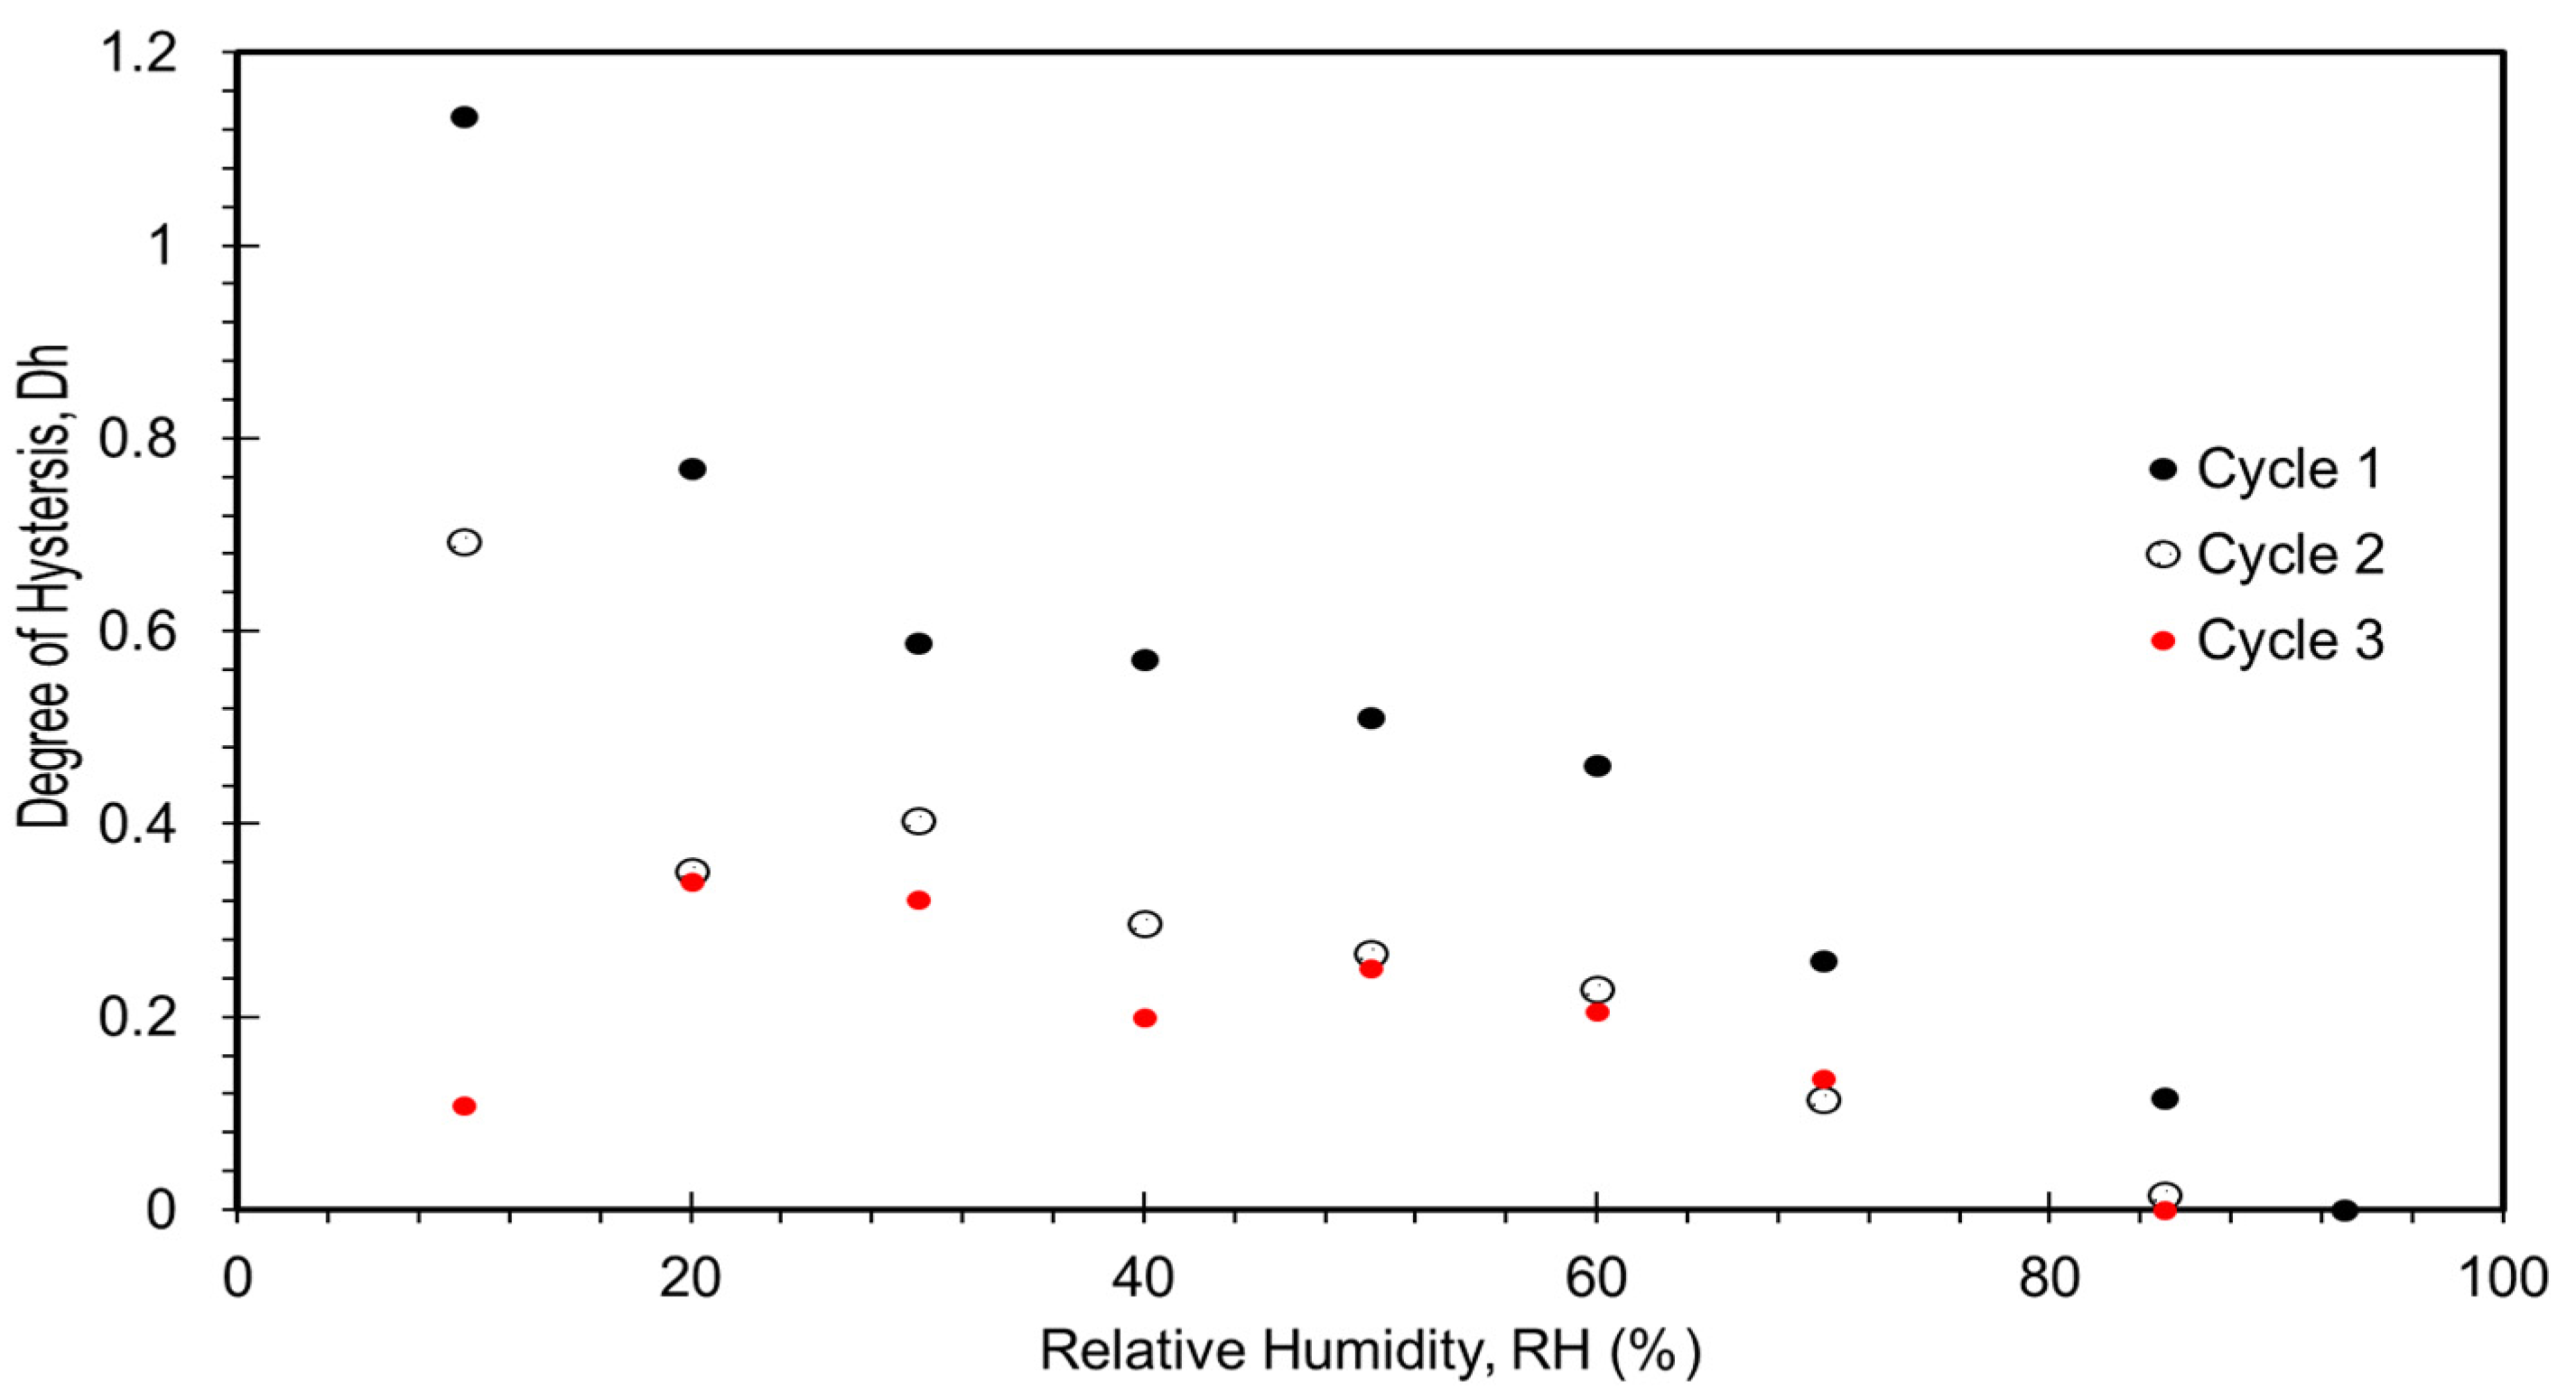
The degree of hysteresis can be quantified at any given suction from the water retention curves shown in Figure 2 using the procedure proposed by Lu [26] and Bouazza [27], where the degree of hysteresis (Dh) at any point in the hysteresis loop is defined as:
D h = W d i   W w i     W m i
where wdi is the water content at point i during the desorption, wwi is the water content at point i during adsorption, and wmi is the average water content at point i between desorption and adsorption states. The average degree of hysteresis (Dh) over the RH space loop can be defined as:
D = 1 n   i = 1 n W d i   W w i     W m i
where n is the number of evaluated points selected in the RH space. A high Dh represents high hysteresis in water content between wetting and drying; a smaller hysteresis will correspond to a lower Dh.
Figure 4 illustrates the relationship between the degree of hysteresis (Dh) and the relative humidity. It can be observed that the degree of hysteresis (Dh) decreases as RH increases, with the highest decrease occurring in the first adsorption–desorption cycle compared to the subsequent isotherms, confirming the observation noted earlier in Figure 2, which pointed to the likelihood that microstructural changes in the CB porous system mainly occurred in pore sizes relevant to the range of RH < 80% and mainly at the first and second isotherm cycles.
It is evident from Figure 4 that most of the changes in Dh were found between the first and second isotherm cycles. In contrast, no significant difference in Dh was observed between the second and third isotherm cycles, indicating that the changes in the microstructure became similar across the RHs, only below 50% RH down to 20% RH. The third isotherm cycle had a slightly lower Dh than the second cycle, indicating less alteration to the CB microstructure. At 20% RH, no changes in hysteresis were observed between the second and third isotherm cycles; below 20% RH, the third isotherm cycle had a lower Dh than the second cycle, indicating less water became confined in CB pores. Such a response is controlled by the C-S-H gel, as mentioned previously. The reorganisation or changes to the CB pores connectivity are the major contributors to the changes in the degree of hysteresis as it evolved from the ink bottle constrictions [16]. Overall, the average degree of hysteresis (Dh) decreased from 0.55 for the first cycle to 0.3 in the second cycle and 0.20 in the third cycle, confirming the low hysteresis observed in Figure 2 in cycles 2 and 3 as less and less water became available in the CB system.

4. Conclusions

Multicycle water vapour absorption/desorption and hysteretic behaviour of a cement–bentonite (CB) material for cutoff wall construction were examined over a range of relative humidity varying between 90% and 0.3%. This study postulates that multiple adsorption–desorption cycles led to microstructural changes in the CB porous system. This suggestion stems from the fact that the CB materials’ water retention ability was enhanced by increasing isotherm cycles. It is postulated that this enhancement favoured the so-called smaller pores (i.e., gel pores and the space between the hydration sheets) rather than the capillary pores. Repeated adsorption–desorption cycles led to the 2nd and 3rd cycle isotherms shifting upward after the first cycle at about RH ≤ 70%, with cross-over points identified on the first adsorption–desorption isotherm cycle. These cross-over points correspond to the points where the CB material started experiencing an enhancement in its water retention ability in the following isotherm cycles compared to the first isotherm cycle. The first water vapour absorption/desorption cycle exhibited a high degree of hysteresis at RH ≤ 70%, which was reduced with the following cycles. After the first isotherm cycle, the initial collapse in the C-S-H hydration sheet had a more significant effect on the CB microstructure than in the second and third isotherm cycles. This was confirmed by the higher average degree of hysteresis (Dh = 0.55) recorded in the first adsorption–desorption cycle (0.55) compared with the second cycle (Dh = 0.3) and third cycle (Dh = 0.2), most likely caused by microstructural changes (for example, smaller CB pore’ size possibly densifying due to drying). Finally, further work is needed to confirm the trends reported in this paper and expand its scope, including a more detailed microstructural analysis.

Author Contributions

Conceptualization, S.A.-B. and A.B.; methodology, S.A.-B. and A.B.; formal analysis, S.A.-B. and A.B.; investigation, S.A.-B. and A.B.; resources, A.B.; data curation, S.A.-B. and A.B.; writing—original draft preparation, S.A.-B.; writing—review and editing, A.B.; supervision, A.B.; project administration, A.B. All authors have read and agreed to the published version of the manuscript.

Funding

The first author was funded by a scholarship from the Iraqi Higher Committee of Education Development.

Data Availability Statement

The data presented in this study are available on request from the corresponding author.

Conflicts of Interest

The authors declare no conflict of interest.

References

  1. Ryan, C.R.; Day, S. Performance Evaluation of Cement-Bentonite Slurry Wall Mix Design; US EPA: Washington, DC, USA, 1986.
  2. Jefferis, S. Grouts and slurries. In Construction Materials Reference Book; Doran, D., Cather, B., Eds.; Routledge: Abingdon, UK; Taylor and Francis: Abingdon, UK, 2013; pp. 165–194. [Google Scholar]
  3. Evans, J.C.; Dawson, A.R.; Opdyke, S. Slurry walls for groundwater control: A comparison of U and US practice. In Proceedings of the ASCE/PENNDOT Central PA Geotechnical Conference, Philadelphia, PA, USA, 13–15 May 2002; pp. 1–9. [Google Scholar]
  4. Opdyke, S.M.; Evans, J.C. Slag-cement-bentonite slurry walls. J. Geotech. Geoenviron. Eng. 2005, 11, 673–681. [Google Scholar] [CrossRef]
  5. Jefferis, S. Cement-bentonite slurry systems. In Proceedings of the 4th International Conference on Grouting and Deep Mixing, New Orleans, LA, USA, 15–18 February 2012; pp. 1–24. [Google Scholar]
  6. Soga, K.; Joshi, K.D.; Evans, J.C. Cement bentonite cutoff walls for polluted sites. In Proceedings of the 1st International Symposium on Coupled Phenomena in Environmental Geotechnics, Torino, Italy, 1–3 July 2013; pp. 149–165. [Google Scholar]
  7. ICE (Institution of Civil Engineers). Specification for Construction of Slurry Trench Cut-Off Walls as Barriers to Pollution Migration; Thomas Telford: London, UK, 1999. [Google Scholar]
  8. Cermak, J.; Law, M. Cut-off performance of a soil-cement bentonite wall. In Proceedings of the 14th Pan-American Conference on Soil Mechanics and Geotechnical Engineering, Toronto, ON, Canada, 2–6 October 2011. [Google Scholar]
  9. Cermak, J.; Evans, J.C.; Tamaro, G.J. Evaluation of Soil-Cement-Bentonite Wall Performance-Effects of Backfill Shrinkage. In Proceedings of the 4th International Conference on Grouting and Deep Mixing, New Orleans, LA, USA, 15–18 February 2012; pp. 502–511. [Google Scholar]
  10. Joshi, K.D. Long-Term Engineering Performance and in-Situ Assessment of Cement-Bentonite Cut-Off Walls. Ph.D. Thesis, The University of Cambridge, Cambridge, UK, 2010. [Google Scholar]
  11. Sumner, M.E.; Miller, W.P. Cation exchange capacity and exchange coefficients. Methods Soil Anal. Part 3 Chem. Methods 1996, 5, 1201–1229. [Google Scholar]
  12. Espinosa, R.M.; Franke, L. Influence of the age and drying process on pore structure and sorption isotherms of hardened cement paste. Cem. Concr. Res. 2006, 36, 1969–1984. [Google Scholar] [CrossRef]
  13. Zhang, Z.; Scherer, G.W.; Bauer, A. Morphology of cementitious material during early hydration. Cem. Concr. Res. 2018, 107, 85–100. [Google Scholar] [CrossRef]
  14. Scrivener, K.; Snellings, R.; Lothenbach, B. A Practical Guide to Microstructural Analysis of Cementitious Materials; CRC Press: Boca Raton, FL, USA, 2016; Volume 540. [Google Scholar]
  15. Zhang, Z.; Scherer, G.W. Physical and chemical effects of isopropanol exchange in cement-based materials. Cem. Concr. Res. 2021, 145, 106461. [Google Scholar] [CrossRef]
  16. Kumar, A.; Ketel, S.; Vance, K.K.; Oey, T.; Neithalath, N.; Sant, G. Water vapor sorption in cementitious material-Measurement, modeling and interpretation. Transp. Porous Media 2014, 103, 69–98. [Google Scholar] [CrossRef]
  17. Jennings, H.M.; Kumar, A.; Sant, G. Quantitative discrimination of the nano-pore-structure of cement paste during drying: New insights from water sorption isotherms. Cem. Concr. Res. 2015, 76, 27–36. [Google Scholar] [CrossRef] [Green Version]
  18. Jennings, H.M. Refinements to colloid model of CSH in cement: CM-II. Cem. Concr. Res. 2008, 38, 275–289. [Google Scholar] [CrossRef]
  19. Pinson, M.B.; Masoero, E.; Bonnaud, P.A.; Manzano, H.; Ji, Q.; Yip, S.; Thomas, J.J.; Bazant, M.Z.; Van Vliet, K.J.; Jennings, H.M. Hysteresis from multiscale porosity: Modeling water sorption and shrinkage in cement paste. Phys. Rev. Appl. 2015, 3, 064009. [Google Scholar] [CrossRef] [Green Version]
  20. Wu, Z.; Wong, H.S.; Buenfeld, N.R. Transport properties of concrete after drying-wetting regimes to elucidate the effects of moisture content, hysteresis and microcracking. Cem. Concr. Res. 2017, 98, 136–154. [Google Scholar] [CrossRef]
  21. Baroghel-Bouny, V. Water vapour sorption experiments on hardened cementitious materials: Part I: Essential tool for analysis of hygral behaviour and its relation to pore structure. Cem. Concr. Res. 2007, 37, 414–437. [Google Scholar] [CrossRef]
  22. Baroghel-Bouny, V. Water vapour sorption experiments on hardened cementitious materials. Part II: Essential tool for assessment of transport properties and for durability prediction. Cem. Concr. Res. 2007, 37, 438–454. [Google Scholar] [CrossRef]
  23. Wei, X.; Xiao, L.; Li, Z. Electrical measurement to assess hydration process and the porosity formation. J. Wuhan Univ. Technol. Mater. Sci. Ed. 2008, 23, 761766. [Google Scholar] [CrossRef]
  24. Powers, T. Properties of cement paste and concrete. In Proceedings of the 4th International Symposium on the Chemistry of Cement, Washington, DC, USA, 2–7 October 1960; pp. 577–613. [Google Scholar]
  25. Sant, G.; Bentz, D.; Weiss, J. Capillary porosity depercolation in cement-based materials: Measurement techniques and factors which influence their interpretation. Cem. Concr. Res. 2011, 41, 854–864. [Google Scholar] [CrossRef]
  26. Lu, N.; Khorshidi, M. Mechanisms for soil-water retention and hysteresis at high suction range. J. Geotech. Geoenviron. Eng. 2015, 141, 04015032. [Google Scholar] [CrossRef]
  27. Bouazza, A.; Rouf, M.A. Hysteresis of the water retention curves of geosynthetic clay liners in the high suction range. Geotext. Geomembr. 2021, 49, 1079–1084. [Google Scholar] [CrossRef]
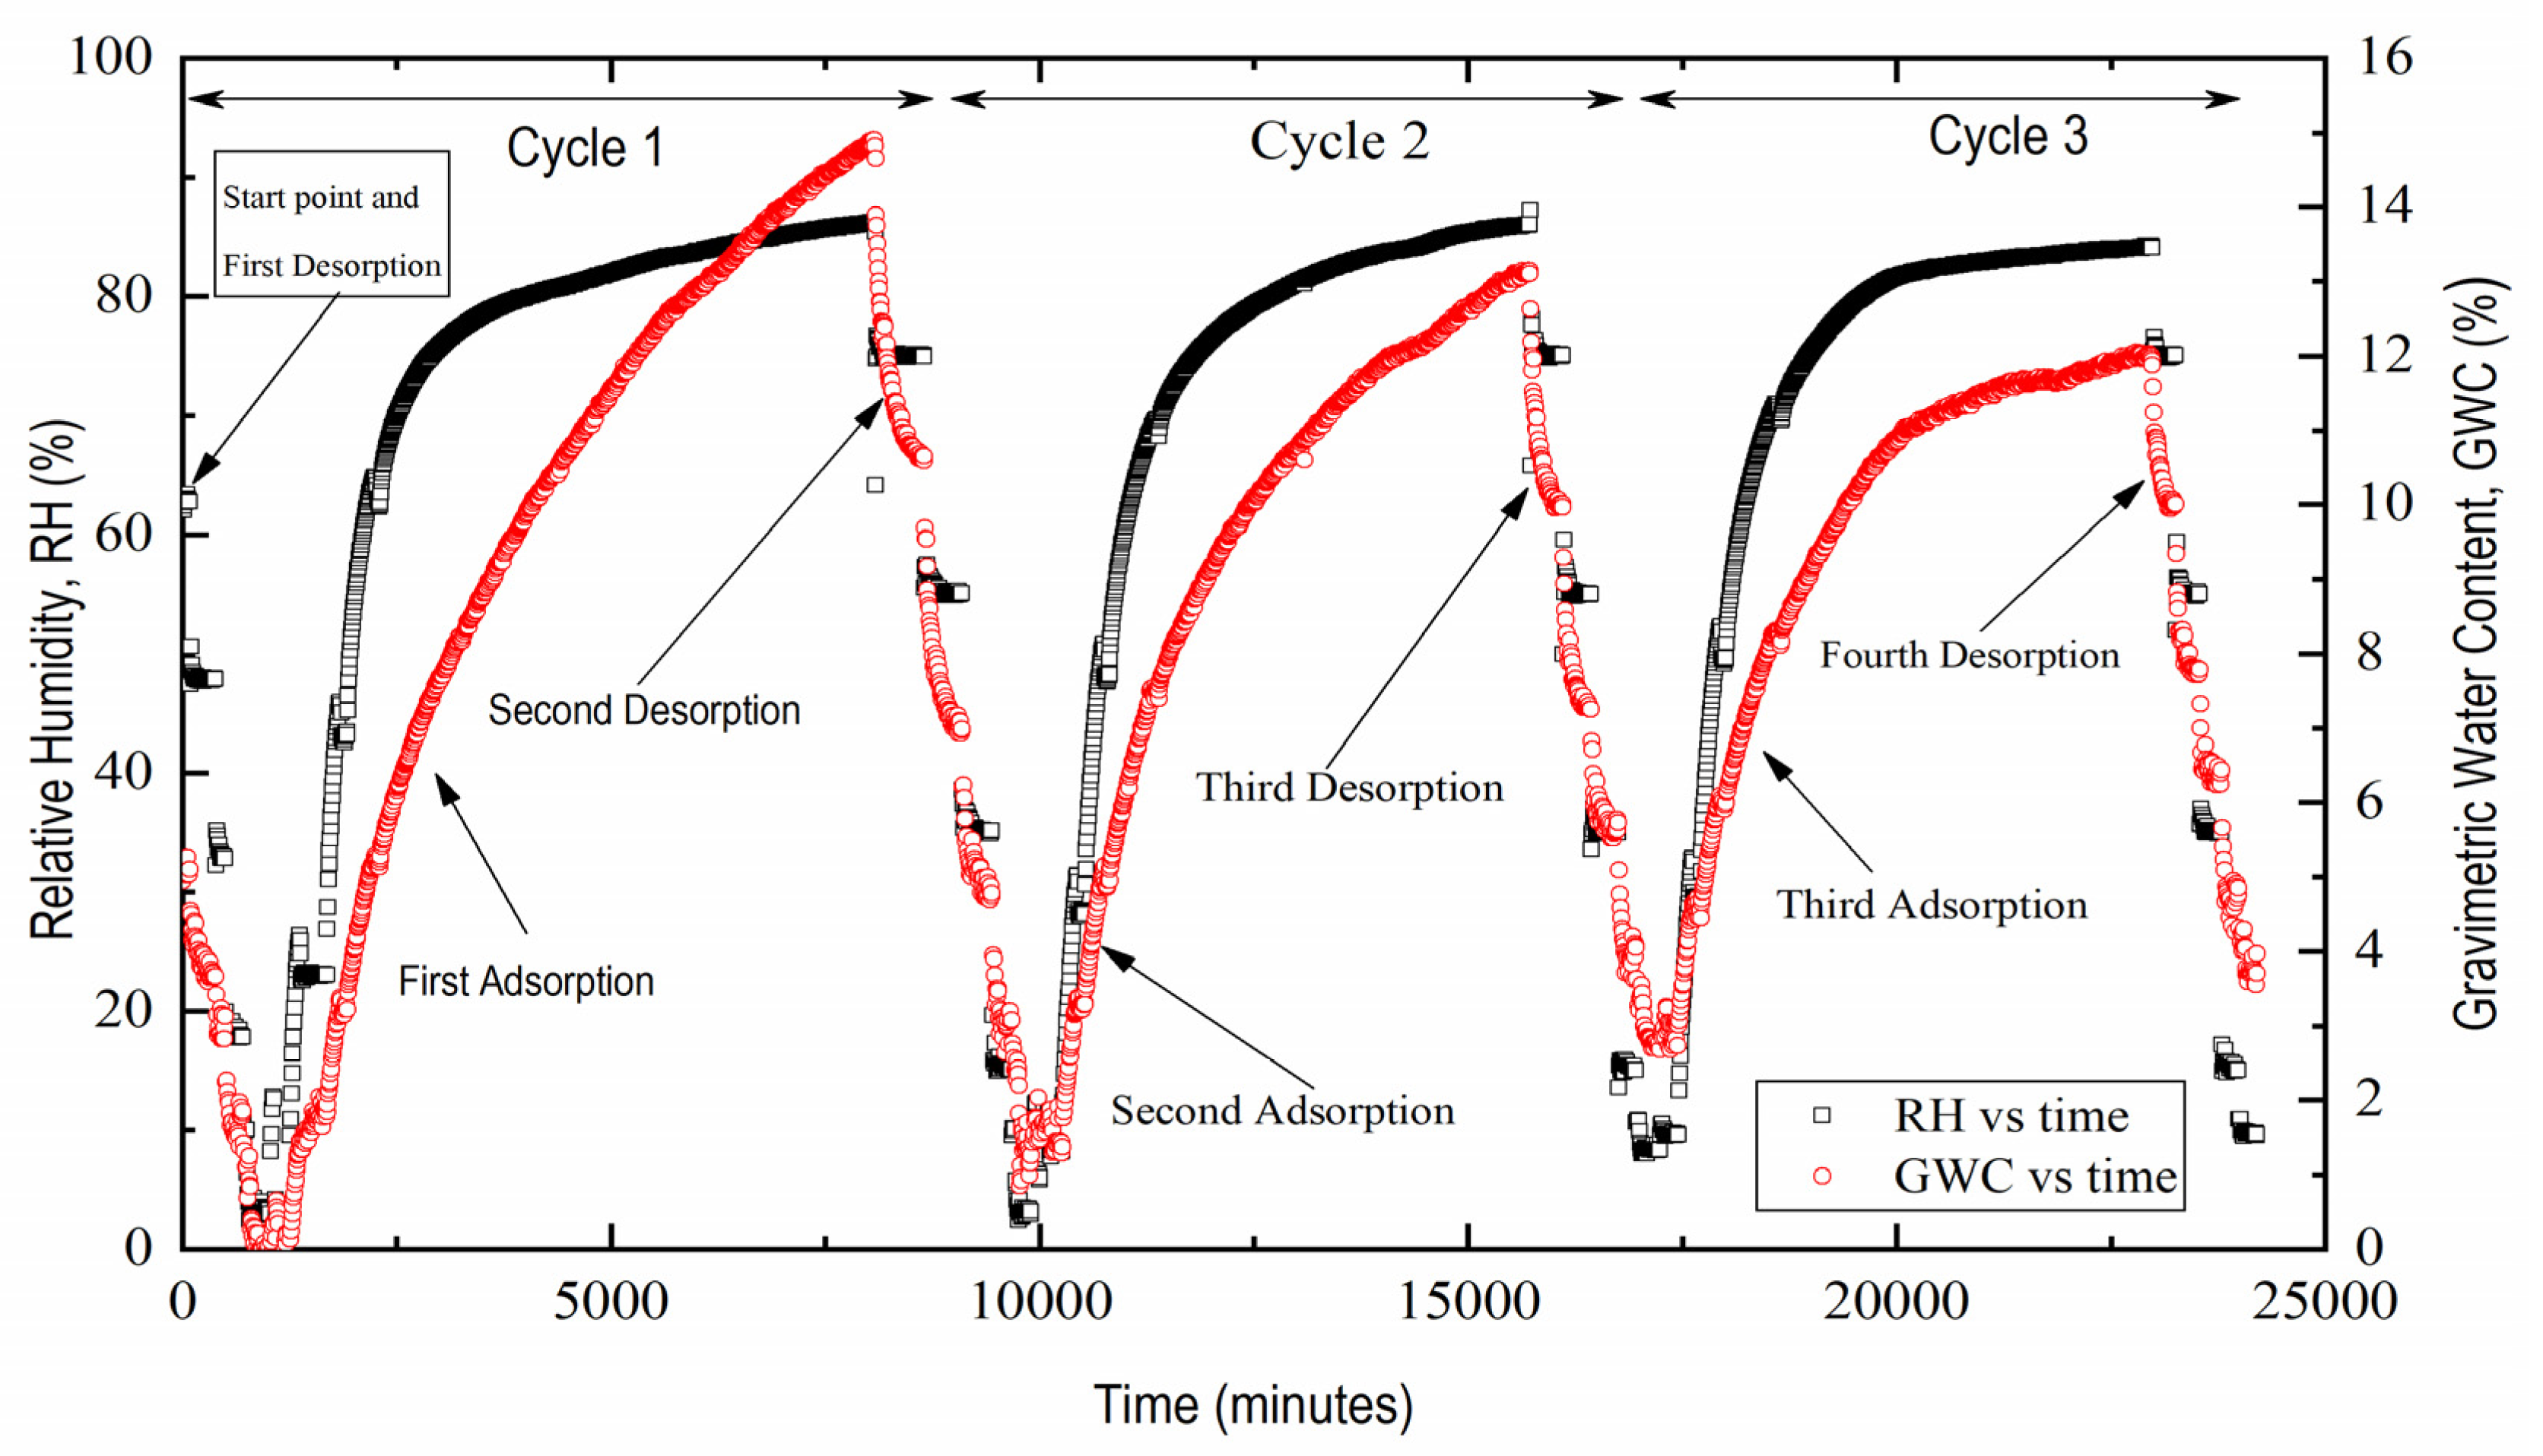
Figure 1. Multicycles of desorption/adsorption for CB materials across a range of relative humidities (90–0.3%).
Water 15 02469 g001
Figure 2. SEM images illustrate the collapsed C-S-H sheet after some time: (a) general configuration of the hydration products and pores of the CB materials at 6500 magnification and 30 kV, (b) observed area of C-S-H sheet before collapsing at 25,000 magnification and 30 kV, (c) same observed area after collapsed C-S-H sheet into the microstructure and the appearance of new pores at 25,000 magnification and 30 kV.
Water 15 02469 g002
Figure 3. Desorption–adsorption water isotherm cycles in terms of relative humidity.
Water 15 02469 g003
Figure 4. Degree of hysteresis versus relative humidity for CB materials under three desorption–adsorption water isotherm cycles.
Water 15 02469 g004
Table 1. Bentonite mineralogy composition.
Bulk Ca Saturated<2 µm Fraction
Quartz%123
Cristobalite%1<1
Montmorillonite%7895
Calcite%<1-
Albite/Anorthite%7<1
Kaolin%11
Zeolite%1-
Particle size24.475.1
 CEC (cmol/kg) by Ba and XRF-93
Disclaimer/Publisher’s Note: The statements, opinions and data contained in all publications are solely those of the individual author(s) and contributor(s) and not of MDPI and/or the editor(s). MDPI and/or the editor(s) disclaim responsibility for any injury to people or property resulting from any ideas, methods, instructions or products referred to in the content.