Article

Application of Vortex Identification Methods in Vertical Slit Fishways

1
Faculty of Electrical Power Engineering, Kunming University of Science and Technology, Kunming 650500, China
2
Faculty of Metallurgical and Energy Engineering, Kunming University of Science and Technology, Kunming 650500, China
3
Shanghai Investigation, Design & Research Institute Co., Ltd., Shanghai 200434, China
*
Author to whom correspondence should be addressed.
Water 2023, 15(11), 2053; https://doi.org/10.3390/w15112053
Submission received: 26 April 2023 / Revised: 24 May 2023 / Accepted: 25 May 2023 / Published: 29 May 2023

Abstract

:
The reproduction and survival of fish are often negatively affected by the construction of dams and other hydroelectric projects, which cut off their migratory routes. Building effective fish passage facilities that allow fish to pass through dams smoothly alleviates the negative impact of hydroelectric projects on the ecological environment, thus protecting the diversity of aquatic species and preventing the extinction of indigenous fish. Vertical slit fishways are highly effective, but turbulence inside the fishway pools directly affects fish passage. In this study, the large-eddy simulation framework is used to capture the vortex characteristics in the interior of vertical slit fishway pools, and the volume of fluid method is applied to simulate the free surface. The independence of the grid is assessed by the large-eddy simulation quality index, and the simulation results are compared with experimental acoustic Doppler velocimetry data. This work characterizes the vortex flow field inside the vertical slit fishway using the Q-criterion, Omega method, and Liutex vortex identification method. The results show that the vortex structure inside the fishway pool has obvious three-dimensional characteristics and vortex structure varies within the different fishway pool chambers. The analysis and comparison of the three different vortex identification methods show that the vortex structure captured by the Liutex method is more consistent with the actual motion pattern of the fishway water flow.

1. Introduction

The construction of hydraulic projects often creates a barrier to the connectivity of rivers, thereby destroying their ecosystems and leading to the reduction or extinction of fish populations. As a low head hydraulic structure, fishways can be hydraulically designed to meet the needs of the fish in the ecosystem, so that the flow conditions are such that the target fish can move up and down. Vertical slit fishways are widely used to facilitate the movement of fish from one side of a river to the other across a lateral barrier. The vertical slit fishway is suitable for different flow conditions, it is beneficial for the migration of most fish and is considered a reliable choice to ensure fish passage [1,2].
The flow field characteristics are a key factor in the efficient operation of fishways. Knowledge of the flow characteristics ensures a better understanding of fish passage performance and fish movement, and improvements in this area allow practical problems in fishways to be solved. The turbulent kinematics have a direct effect on fish behavior, and whether the effect is beneficial or detrimental depends on the specific characteristics of the flow environment [3]. Rajaratnamand et al. [4] explored the hydraulics of vertical slit fishways using four different model scales. Their results show that the water flows in a form similar to a plane jet at the vertical seam, decays downstream, and forms eddies on both sides of the fishpond. When the size of the eddies is similar to the size of the fish, turbulence can limit fish movement [5,6], reduce the hydrostatic stability of the fish [7,8], or cause confusion and increase fish fatigue during migration [9]. Several studies have shown that fish can benefit from turbulence, for example, by capturing energy from vortices to propel themselves upstream [10,11] or using it as a stimulus for selecting trajectories through the fish passage [12,13]. Therefore, identifying vortex information in the flow field is particularly important in determining the effectiveness of the fishway.
Ahmadi et al. [14] conducted numerical simulations of several novel fish passage models using the RNG k-ε model [15] and depicted the vortex structure in the pool using the mean velocity streamlines. Tarrade et al. [16] evaluated the transient vortices using particle image velocimetry and concluded that more than 85% of the flow energy is related to large vortex structures and the main dynamics of the flow. Marriner et al. [17] used vector cloud images and vorticity images to analyze the length and width of vortices at three water depth locations in a vertical slit fishway resting pool and concluded that vorticity within the pool chamber delays or prevents fish passage.
Although the above studies have shown that vortex structures affect fish passage, most studies have only analyzed the vortex structures based on vorticity, vector cloud images, and mean flow lines. Other more advanced vortex identification methods, which are more accurate and comprehensive in terms of characterizing vortex structures, have not yet been used. Vortex identification methods can be divided into three generations [18]. The first generation uses vorticity to represent a vortex, but vorticity is not equivalent to a vortex [19,20]. As the understanding of vortices expanded, the second generation of vortex recognition methods emerged, such as the Q-criterion [21] and λ2 criterion [22]. The Q criterion cannot capture both strong and weak vortexes, and cannot give information on the intensity of the vortex, etc. Liutex proposed the third-generation vortex identification methods represented by the Omega ( Ω ) method [23], Liutex vector [24], and Ω R method [25]. Compared with the first-generation and second-generation vortex methods, the third-generation vortex identification methods are insensitive to thresholds. They can be applied to different cases, and the Liutex vectors have both magnitude and direction, which can characterize vortex information more comprehensively [26,27,28,29].
With the development of computational fluid dynamics, related techniques are increasingly used to analyze the flow field in fish passage pool chambers. Although turbulence can be quantified numerically at different scales using direct numerical simulations, this is computationally demanding [30]. To solve computationally feasible problems, the Reynolds-averaged Navier–Stokes (RANS) and large-eddy simulation (LES) methods are the most reasonable alternatives. By analyzing the results given by RNG and LES frameworks and comparing them with experimental data obtained through acoustic Doppler velocimetry (ADV), Fuentes–Pérez et al. [31] concluded that both RNG and LES turbulence models provide acceptable results. LES is more spatially consistent with the measured data, and RANS lacks the ability to calculate temporal fluctuations, making LES more relevant for biological studies interested in smaller spatial and temporal scales. Quaresma and Pinheiro [31] emphasize that to accurately reproduce this complex flow field, especially the turbulence parameters, LES model should be used. The lower performance of RNG, k-ε, and k-ω turbulence models in adequately reproducing this flow field.
The volume of fluid (VOF) method can handle the free surface, and many studies have used this approach to determine the free surface of fishways [32,33]. The LES and VOF methods were used to simulate the three-dimensional flow field in the vertical slit fishway, and the simulation results were in good agreement with the experimental data. Three different vortex identification methods, Q-criterion, Omega method, and Liutex method, were used to characterize the three-dimensional structure of the vortex. The information related to the intensity and diameter of the vortex in the fish channel was also analyzed by the vortex identification method.

2. Materials and Methods

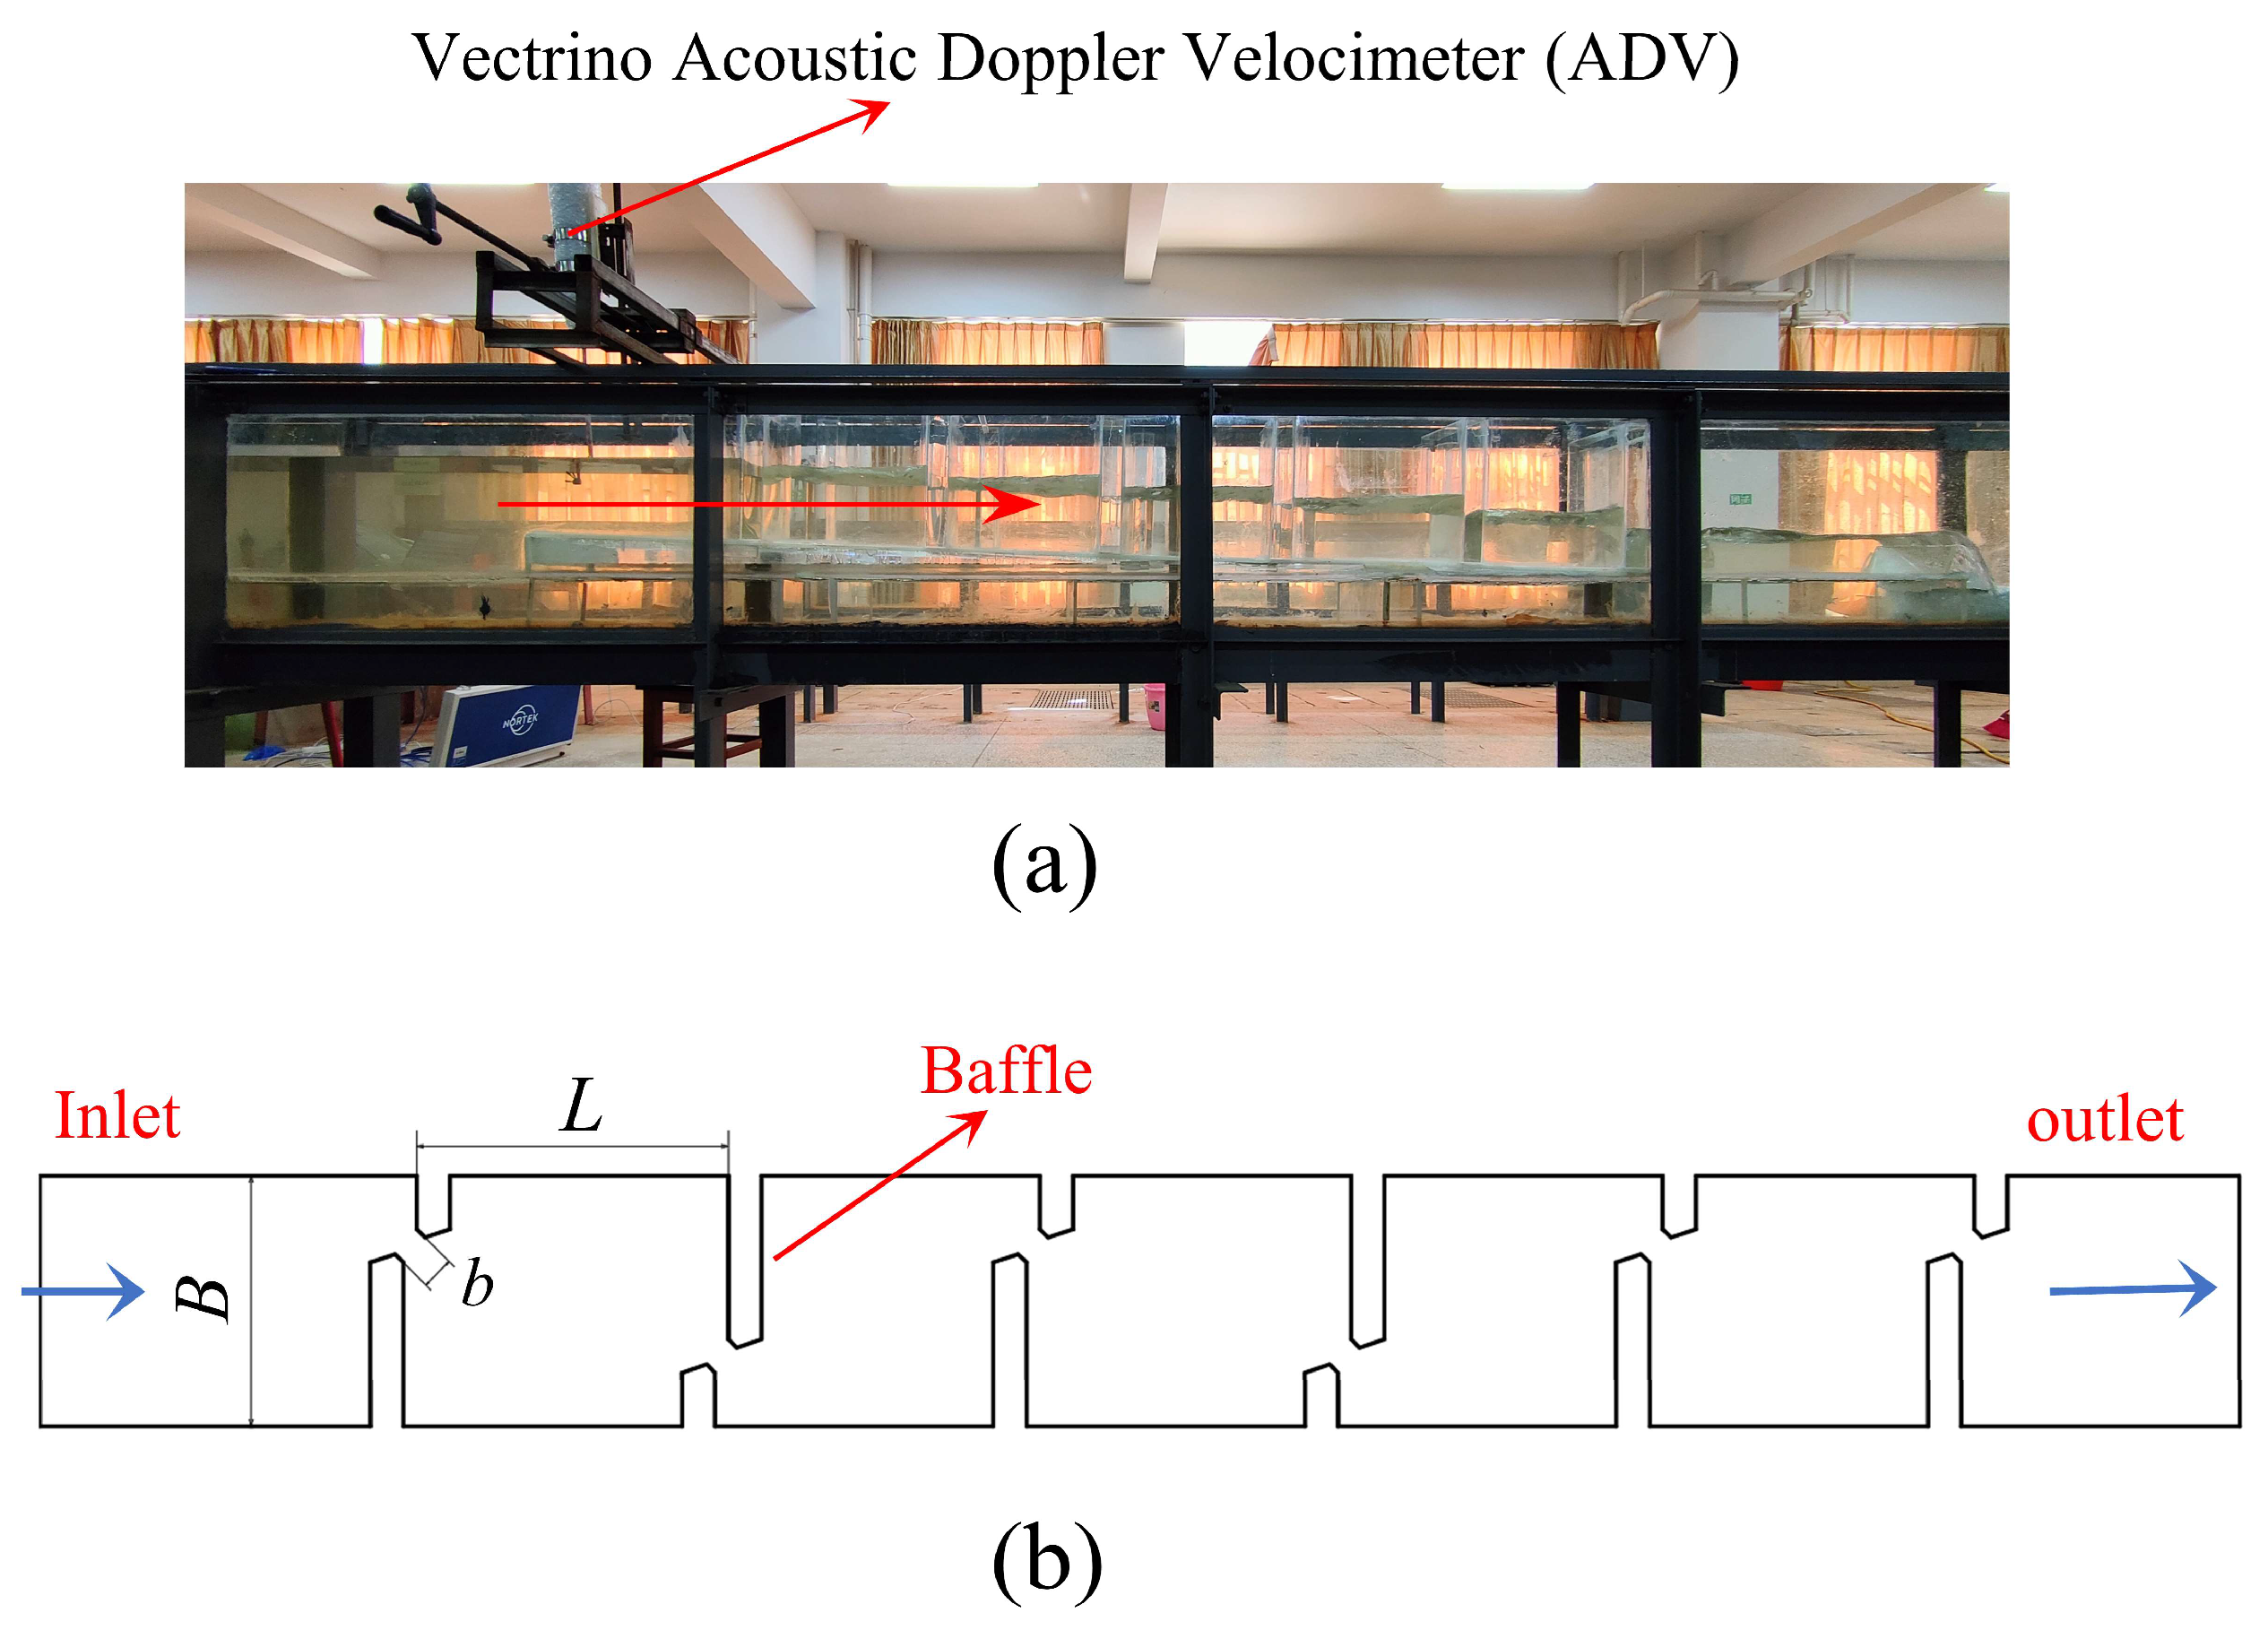
2.1. Experimental Conditions and Procedure

The experimental setup of the fishway flume is shown in Figure 1. The apparatus mainly consists of an inlet section, a working section, and an outflow section. The flume is 7.5 m long, 0.3 m wide, and 0.5 m deep. The flume flow is controlled by a regulating valve at the flume inlet. An infiltration flow system is located at the upstream inlet of the flume to reduce the turbulence in the inflow section. A right-angle triangular weir is placed in the upstream flume to regulate different flow rates according to the gate valve. The model scale is intended to fully use the capacity of the flume, where the flume width presents the limiting dimension.
The fishway model was constructed in a flume, using acrylic panels as the inner wall and flume glass as the outer wall. The design of the fishway experimental model was based on the study of Xu [32]. The fishway model was arranged with five levels of pools. The width of the fishway pool room B = 0.3 m, the length L = 0.375 m, and the width of the slot b = 0.04 m. The length-to-width ratio of the model was 10:8, and a bottom slope of 3% was used. To reduce the influence of the last stage of the fishway model on the water flow in the pool by the direct injection of water, a tailgate was set at the end of the model.
Three-dimensional flow velocity measurements were obtained by an ADV device mounted on a cart. The cart was supported on the wall of the flume, allowing it to be positioned at a predetermined location. To ensure the statistical significance of the velocity recordings, the velocity measurements were recorded for more than 3 min [33]. The correlation coefficient and signal-to-noise ratio of the measured data were found to be within the range reported in the literature for highly turbulent flows [34].

2.2. Turbulence Model

The LES equations for dynamic stresses were solved by the soft-ware FLUENT to simulate the flow field. In which, the algorithm uses the PISO algorithm, the momentum equation uses the second-order upwind, and the time term discretization is second order implicit. The Navier–Stokes equations under the transient state is processed using the filter function equation and the continuum equation, which in turn gives the control equations for the LES.
t ( ρ u ¯ i ) + x j ( ρ u ¯ i u ¯ j ) = p ¯ x i + μ ( u ¯ i x j + u ¯ j x i ) ρ τ i j x j
ρ t + ( ρ u ¯ i ) x i = 0
where i, j = 1, 2, 3; ρ is the density; μ is the dynamic viscosity; p ¯ and u ¯ i are the filtered pressure and velocity components; τ i j is subgrid-scale stress.
According to Smagorinsky’s basic model, it is assumed that the subgrid-scale stress is
τ i j 1 3 τ k k δ i j = 2 μ t S ¯ i j
where μ t = C S Δ 2 S ¯ ; S ¯ i j = 1 2 u ¯ i x j + u ¯ j x i ; S ¯ = 2 S ¯ i j S ¯ i j , δ i j is the Kronecker delta; μ t denotes the subgrid-scale vortex viscosity coefficient; S ¯ i j represents the strain rate tensor.
To trace the free surface within the fish passage, the VOF method [35] (the VOF method is available in FLUENT [36]) is used. It is designed for two or more immiscible fluids, the two fluids used here are water and air, and the interface between them forms an approximate free surface.

2.3. Vortex Identification Methods

To evaluate the effect of different vortex identification methods on the identification of vortices in the fish passage, the Q criterion, the Ω method, and the Liutex method were used to characterize the vortex structure of the fishway in this paper. Hunt et al. [37] derived the following expression for the Q-criterion:
Q = 1 2 B F 2 A F 2
where F 2 denotes the Frobenius parametrization of the matrix and A = 1 2 ( v + v T ) , B = 1 2 ( v v T ) , v represents the velocity. In practice, the Q-criterion must be adjusted by selecting a suitable threshold value.
The expression of Ω is as follows:
Ω = B F 2 A F 2 + B F 2 + ε
where ε is a small positive number that prevents the denominator of the equation from being zero.
Wang et al. [38] derived the following expression for the size R of the Liutex vector
R = w , r w , r 2 4 λ c i 2
where w denotes the vorticity, w = × V ; r is the real eigenvector which represents the rotational axis, indicating the direction of the Liutex vector; and λ c i denotes the complex conjugate eigenvalues.

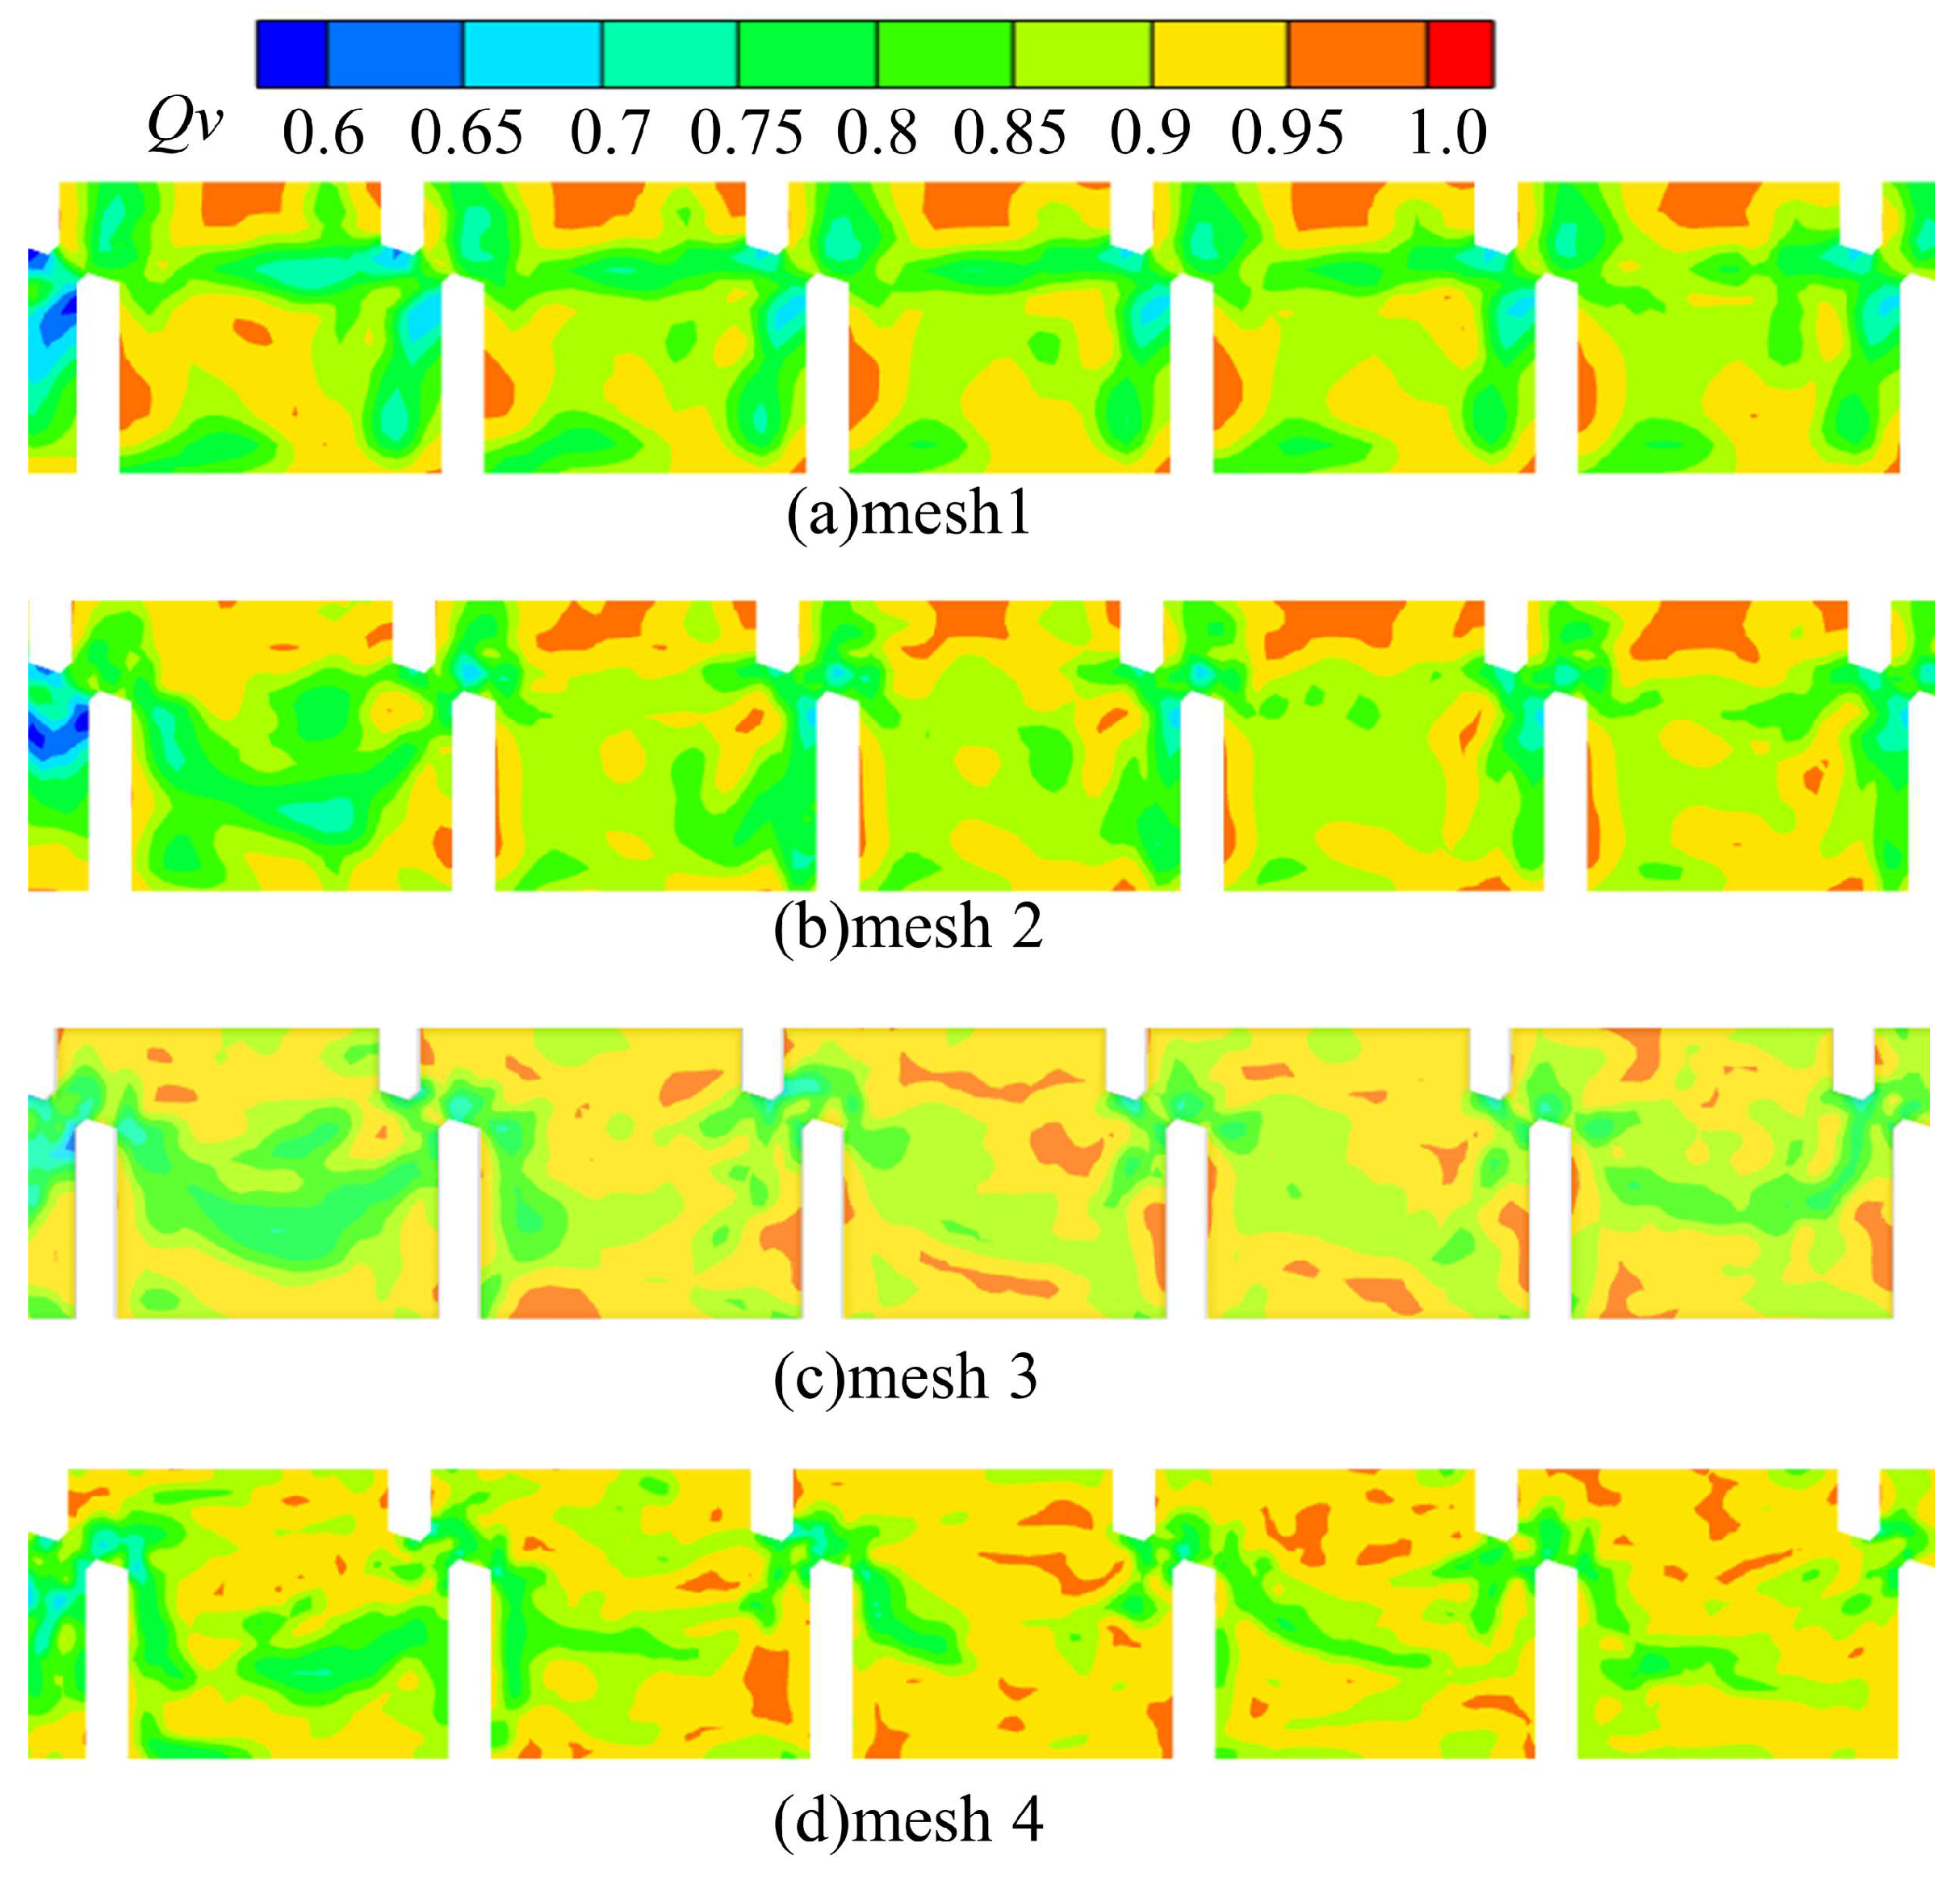
2.4. Meshing and Boundary Conditions

The model for the numerical simulations was constructed based on a physical model in the laboratory. The origin of the coordinate system is at the lower-left corner of the inlet, the longitudinal X-axis runs parallel to the bottom and the sink axis, the Y-axis runs perpendicular to the bottom, and the Z-axis runs in the transverse direction. The instantaneous velocity components u, v, and w correspond to the X, Y, and Z axes, respectively. The model was discretized using a hexahedral mesh for the fluid domain, as shown in Figure 2.
The top of the model was assigned a pressure boundary condition, with a relative pressure of zero. The bottom, side walls, and bulkhead of the fishway were set as solid boundaries with no-slip boundary conditions, and the viscous bottom layer near the wall was treated using the wall function method. A flow rate of Q = 4.427 L/s, giving a velocity of v0 = 0.072 m/s, was used for the inlet and a pressure outlet was applied to the outlet.

2.5. Model Validation

To capture the inherent vortex structures as accurately as possible, LES requires a finer mesh than that normally used for RANS calculations. Although extremely fine meshes are desirable, a compromise between the flow details and the computational cost should be made in practical applications [39]. We first simulated four groups of grids with different resolutions, as described in Table 1, to determine the appropriate grid for subsequent numerical calculations. All four meshes are structured grids consisting of hexahedra.
Grid independence cannot be achieved in the LES framework. Celik et al. [40] suggested that a well-resolved LES should include at least 80% of the total turbulent kinetic energy, but an LES index of quality (IQ) of 0.75–0.85 may be sufficient for most engineering applications at high Reynolds numbers (Quaresma and Pinheiro [41] think when the Reynolds number is greater than 5 × 10⁵ is applicable). The Reynolds number is defined as [42] Re = q v , q denotes unit discharge, v denotes the dynamic viscosity of water. To determine the optimal resolution, different grids were compared and one with an LESIQ greater than 0.75 was selected. Celik et al. defined LESIQv as
L E S I Q V = 1 1 + 0.05 μ + μ s g s μ 0.53
where μ is the viscosity and μ s g s is the subgrid viscosity.
LESIQv takes a value between 0 and 1. The constants in Equation (7) are calibrated so that the index is similar to the resolution ratio to total turbulent kinetic energy, with higher values indicating better resolution. In Figure 3, area blocks with Qv values lower than 0.75 appear on grids mesh 1 and 2 (indicated in blue). With the gradual refinement of the grid, the Qv values increase, and are eventually almost all greater than 0.75 on mesh 3 and mesh 4, with only tiny spots violating this condition. In this study, mesh 4 is used for the numerical simulations.
To validate the model, the simulation results using mesh4 are compared with experimentally measured data for the x- and z-directional velocities at each characteristic point of the fishway pool. The VOF method was used to track the free surface of the fishway model water flow. The water depths at each characteristic point from pool 1 to the inlet position of the fishway were compared under the flow condition Q = 0.073 L/s, as shown in Figure 4a. The numerical simulation results were found to be in good agreement with the experimental data. The simulated results for water depth were in general agreement with the experimental measurements, but the simulated predicted values were underestimated in pool chamber 2 and pool chamber 4. This may be due to the experimental process. During the experiment, the water depth was measured using a steel ruler, and the measurement inevitably caused errors.
The flow velocities were measured using an ADV 3D flow velocity meter. Under the same flow rate conditions, the flow velocities in the x-direction and z-direction were monitored at the outlet of the vertical slit in the five pools. The x-direction velocities at different water depths in the center of one pool were also monitored, and three relative velocity curves were obtained. The experimental data were compared and analyzed with the numerical simulation data. Near the surface of the water flow, the simulated flow velocity was underestimated by 16% and 7%, respectively. This may be due to testing errors caused by complex flow conditions on the water surface. Although there are some discrepancies concerning the experimental data, the numerical scheme is in overall agreement with acceptable accuracy (as shown in Figure 4b–d).

3. Results

In this study, three vortex identification methods, namely the Q criterion, Ω method, and Liutex method, were used to capture the vortex characteristics within different pools of the fishway.
This section analyzes the ability of the three vortex identification methods to capture the flow field information, as well as the 3D vortex structures within the pools and the vortex size, intensity, and core location.

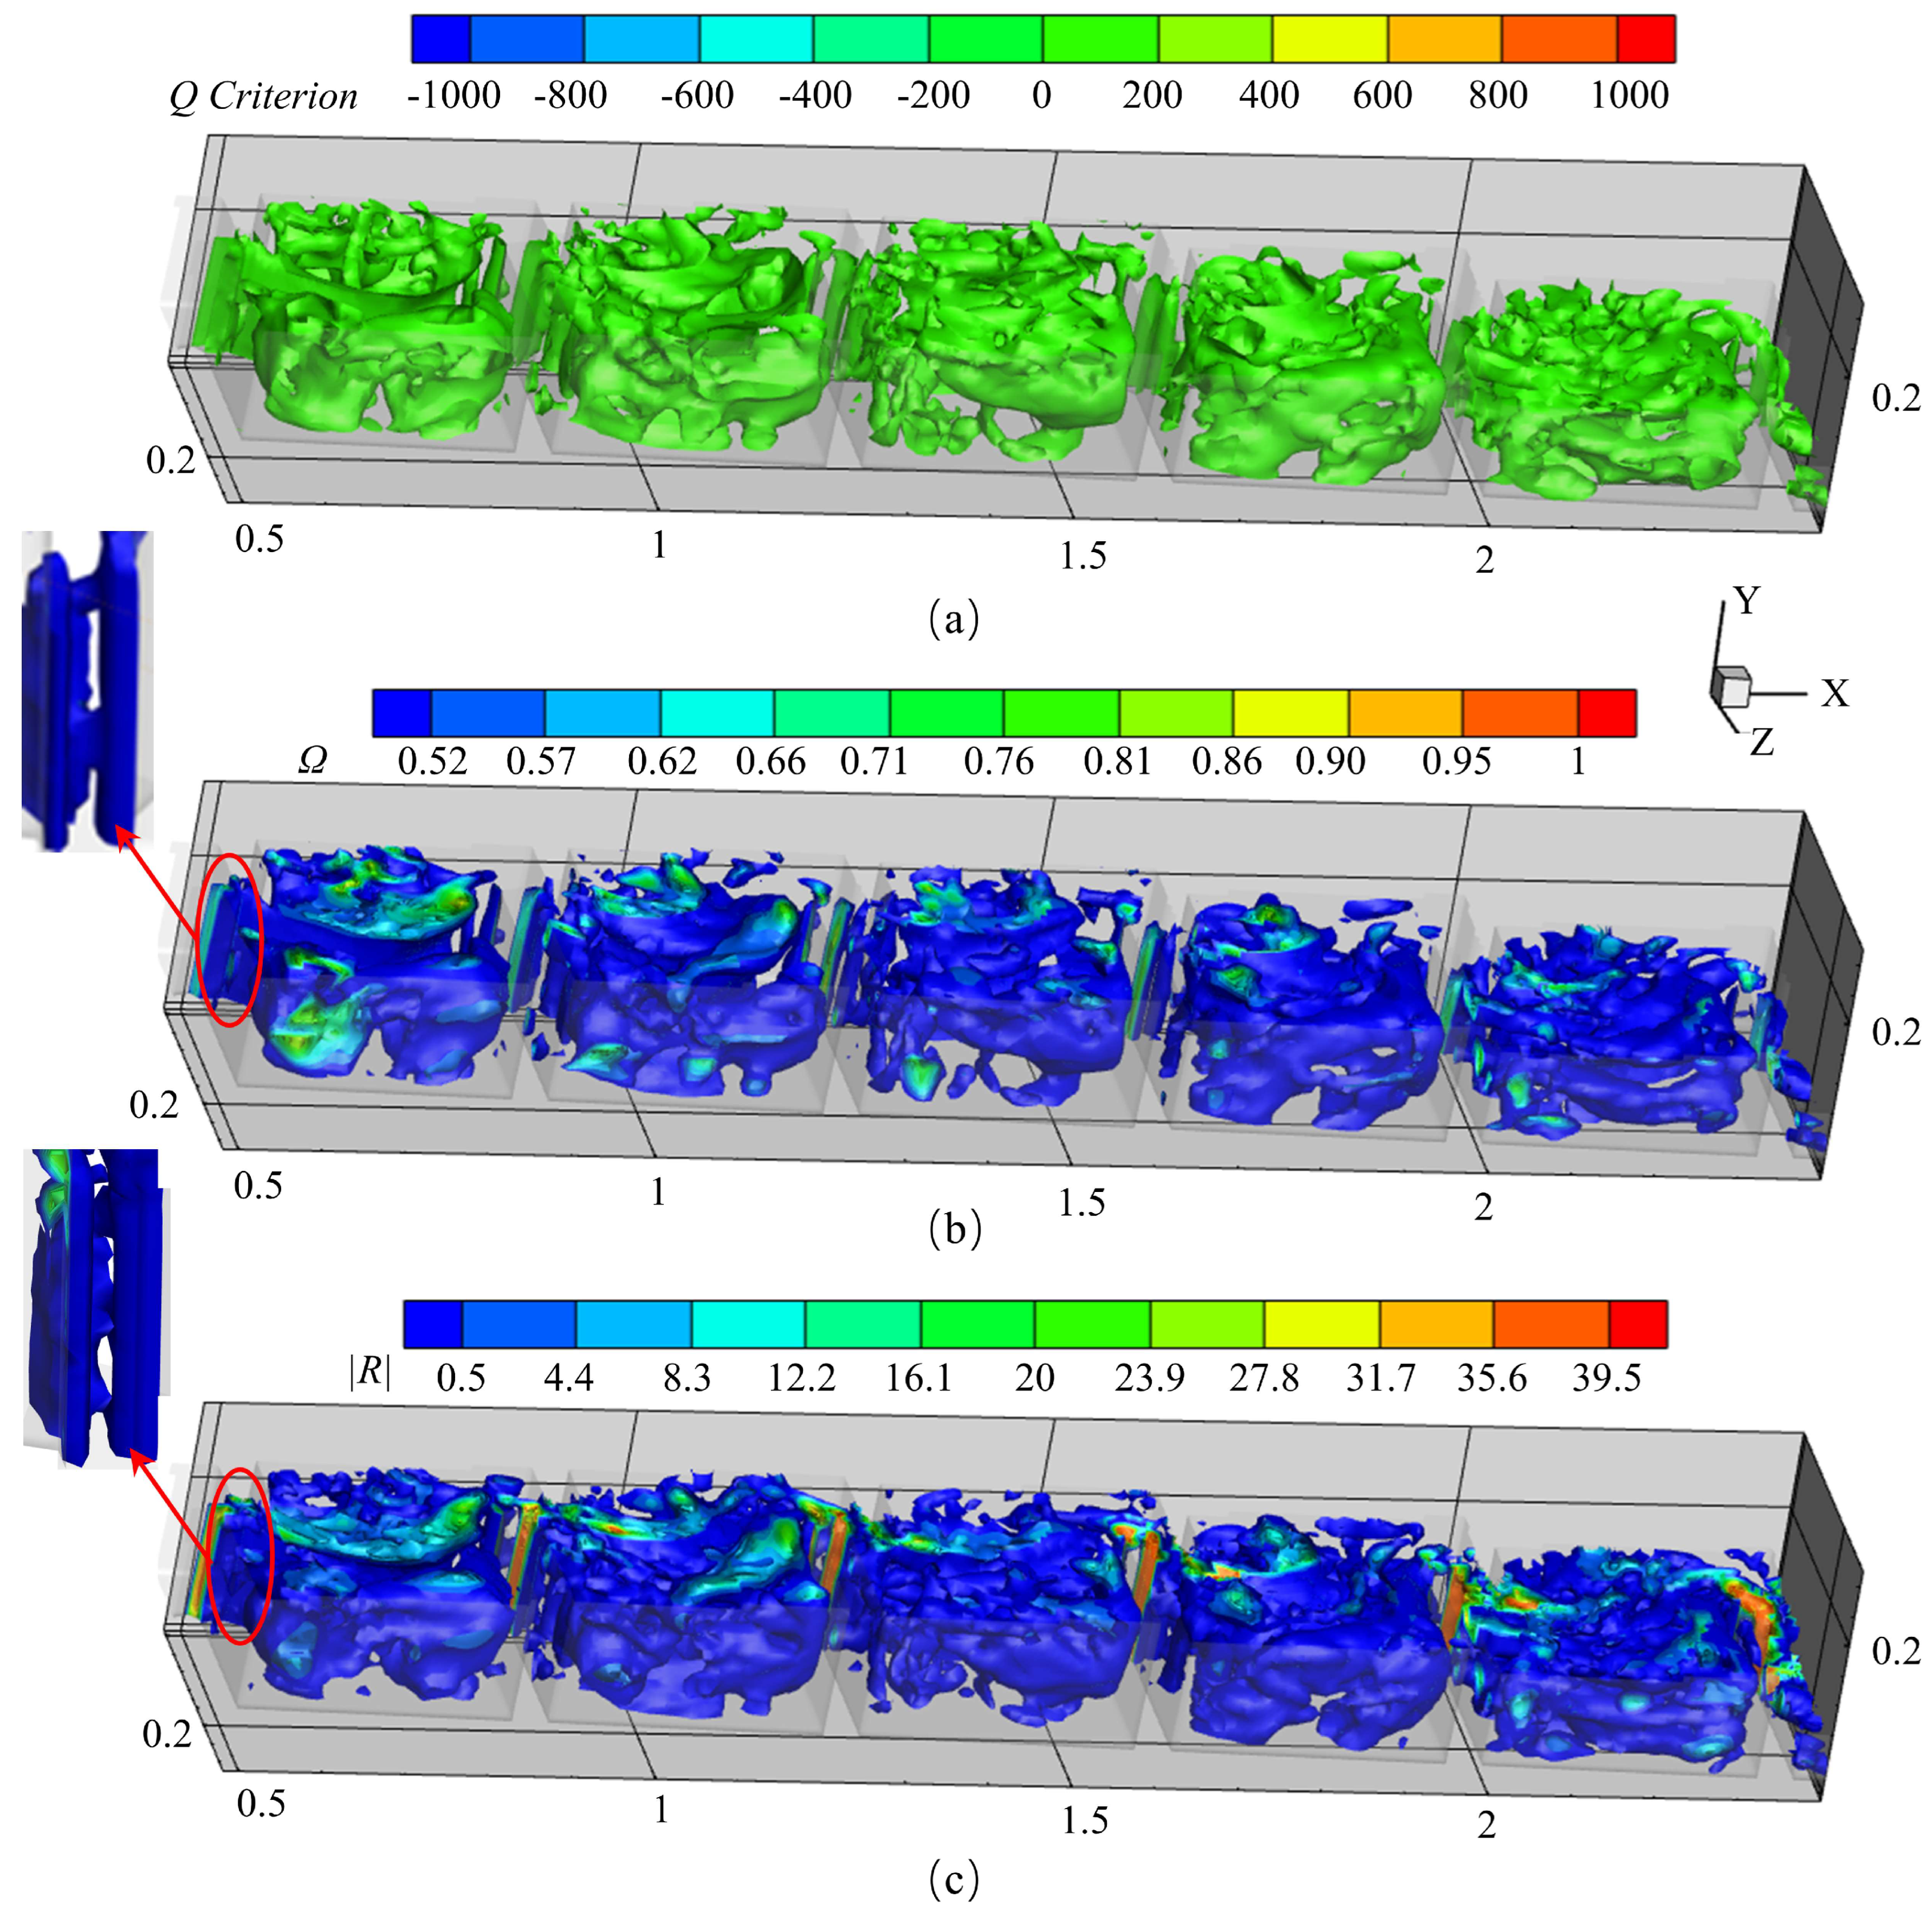
3.1. Vortex Structure Characteristics within Each Cell

Figure 5 shows that the three methods identify similar 3D vortex structures within the pools. The vortex structure identified by the Liutex method is slightly larger than those identified by the other two methods. The vortex structure inside the pool is very irregular. Although the left vortex is relatively regular on the surface close to the cell chamber, it is not a regular geometric structure. The turbulent flow inside the fishway pools results in irregular vortex structures. The main stream starts from the upper vertical slit and forms an arc inside the pool before flowing to the next vertical slit, creating corresponding vortices on both sides of the main stream. The main flow in the fishway chamber is to the right, so the vortices on the right side of the pools are distributed in two areas near the upstream and downstream baffles. The left side of the pool has a larger vortex structure. The surface of the vortex structure within the chamber becomes disturbed over time, but the basic position of the vortex remains the same.
There are differences in the vortex structures at each level within the fishway. The vortex structures of pools 1 and 2 are similar, and the vortices occupy most of the area within the pools. These vortex structures are significantly larger than those in the other chambers. The left side (z < 0.2 m) of the pool has a large horseshoe-shaped vortex, while the vortices on the right side (z > 0.2 m) of the pool area are mainly distributed near the upstream and downstream baffles. In the center of the fishway pool chamber (near z = 0.2 m), the impact of the main stream means that there are fewer vortices. Pools 1 and 2 have smaller flow velocities and smoother water flow, producing a more regular vortex structure, and larger vortex size. The vortices on the right side of pool 3 are mainly distributed near the downstream baffle, and the vortex structures on the left side are similar to those in pools 1 and 2. Pools 4 and 5 have significantly smaller vortex structures. Pool 5 is the last level of the pool, containing the exit of the fish channel water flow, and exhibits smaller vortices and different flow conditions from the other pools. The vortex structures on the right side of this chamber form a lateral arc.
The vertical slits in the fishway also produce vortices, and there is a vertical vortex close to the wall at the guide angle of the pool baffle. When the water flows through the vertical seam, the interaction with the solid boundary and the high flow velocity produce circulation close to the wall. The size of the vortex at the vertical seam is small, but this is a key location for fish swimming upstream. The presence of a vortex may cause the flow pattern in the pool chamber to deteriorate, thus affecting fish migration.
The surface of the water in the fishway exhibits some broken eddies. According to the experimental results, this is because of the water flow through the vertical seam. The contact between the water and air produces some bubbles on the surface.

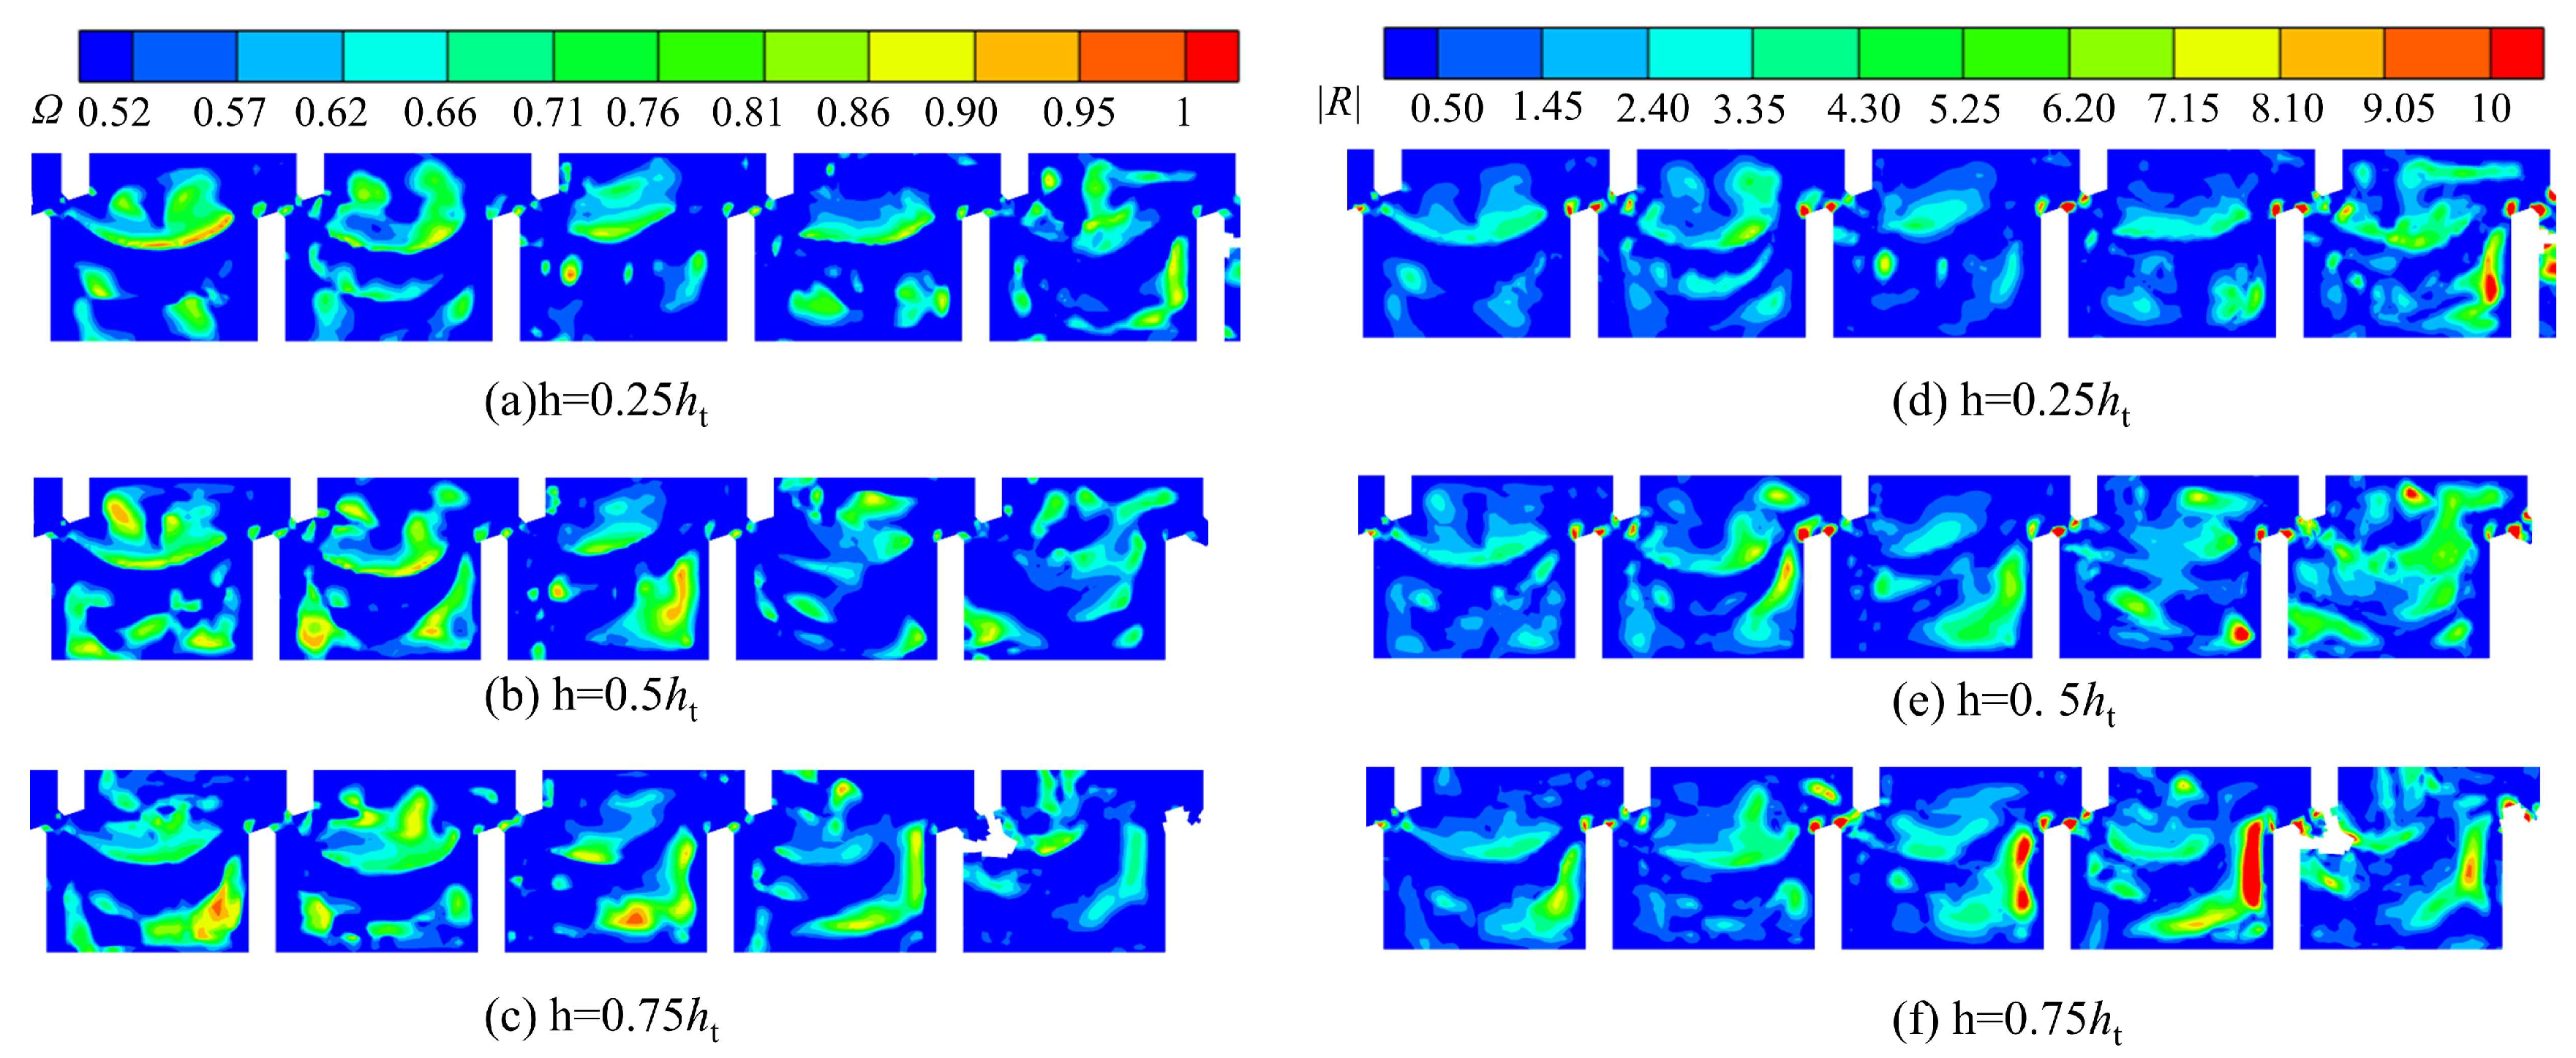
3.2. Vortex Parameter Distribution

A quantitative comparison is made between the Ω method and the Liutex method. The distribution of the vortex parameters identified by the two methods is similar, as shown in Figure 5. The size of the vortex structure identified by the Ω method is slightly smaller than that given by the Liutex method. According to the definition of the Ω method, the value of Ω is influenced by the small parameter ε , but the optimal value has not yet been determined. Although the distributions of the vortex parameters have similar characteristics, they have different properties. Ω denotes the relative intensity, which can be interpreted as the concentration of vortices in the fluid or the stiffness of the fluid. The Liutex magnitude indicates the absolute strength of the vortex and is the only physical quantity that measures the rigid rotational motion of the local fluid [43].
Figure 6a–c shows the distribution of Ω values for three different cross-sections. In the downstream direction, the area with Ω values greater than 0.52 gradually decreases. For the different vortex heights inside the fishway pool, there is a certain difference in the Ω value distribution, which again indicates that the vortex structure inside the fishway pool is irregular. As the relative height of the water flow increases, the area of pools 1–4 with Ω values greater than 0.52 gradually increases. The area occupied by the surface position of the water flow is the largest, accounting for about 40% of the pool chamber area. In contrast, the area of pool 5 in which Ω is greater than 0.52 is largely distributed at the bottom of the water flow because of the small size of the vortex.
Figure 6d–f shows the distribution of the Liutex magnitude at three different cross-sections. The region where R is greater than 0.5 gradually increases in the downstream flow direction. As the relative height of the water flow increases, the area with R greater than 0.5 in pools 1–4 gradually increases. The regions with larger R values in pool 5 are mainly distributed at the bottom and middle of the flow. The area with the highest absolute intensity of vorticity is located at the vertical seam. Although the size of the vortex at the vertical slit is small, its intensity has a great impact on fish migration. The vortex area at the inlet to the fishway is larger and the absolute intensity is high. This is an important factor affecting fish migration, so solving the vortex problem at the inlet is vital for aiding fish migration.
Based on the above quantitative comparison of the Ω and Liutex methods, it is apparent that the vortex structures inside the fishway pools are chaotic and have obvious 3D characteristics. In the direction of water flow, the size of the vortex structures inside the pools gradually decreases, but the vortex structures become more disordered, and their absolute intensity increases. Except for pool 5, the vortex intensity is mainly distributed on the upper surface of the water flow.

3.3. Vortex Diameter

Vorticity is a natural phenomenon that accompanies the rotational motion of fluid. The diameter of a vortex characterizes the dimensional information of vorticity. Because the vortices in pool 1 are larger than those in other pools, the vortex structure of the fishway pools is studied by taking pool 1 as a representative chamber. The vortex on the left side of the pool is an arc-shaped monolithic structure of large size, while the vorticity on the right side consists of two vortices with smaller diameters.
Figure 7a–c shows the vortex core diameters of the left vortex in fishway pool 1 as characterized by the three vortex identifications at different heights. The vortex diameters determined by the three vortex identification methods are similar in total size, but there are significant differences in their distribution and composition. The Q-criterion captures one long vortex, whereas the Ω method captures two shorter vortices and the Liutex method captures multiple vortices of small size. The Liutex method captures a more detailed vortex core structure, while the Q-criterion and the Ω method only capture a coarse vortex nucleus. The vortex nucleus captured by the Liutex method can be clearly characterized as a large vortex composed of multiple small vortex structures.
Figure 7d–f shows the diameter of the right vortex in fishway pool 1 at different heights. The vortex diameters determined by all three vortex identification methods comprise two small vortices. However, the diameter of the vortices varies, with the Liutex method giving the largest value, the Q-criterion giving the second largest value, and the Ω method giving the smallest value. The Liutex vector represents the rigid rotation of the fluid, allowing accurate identification of vortex cores, vortices, and short-circuit flows. The Liutex vector describes the vortex motion of the fishway that is closer to the actual motion of the fishway flow.

4. Discussion

To better recognize the vortex structures produced in fish passage facilities, the vorticity in a series of fish passage pools capture was examined using the Q-criterion, Ω method, and Liutex method. The parameters of the three vortex identification methods were found to be different, but the captured vortex structures and their vortex core locations remained consistent. The Liutex vector represents rigid fluid rotation, which can accurately identify the vortex [20]. In this study, in the analysis of the vortex structure diameter it can be found that using the Q criterion and Ω method can capture a more regular vortex structure, but the vortex structure captured by the Liutex method is not regular. To compare the prediction ability of the vortex identification method to the real flow field, the vortex structure inside the pool chamber in the test model was observed separately and the velocity vector of the characteristic points of the vortex in the fish passage was analyzed. It can be found that the Liutex method is closer to the real flow field. The vortex parameters Q and R are significantly smaller than in other vortex studies [44,45]. This may be related to the flow velocity, pressure, and other parameters of the fishway flow field. Compared with previous studies, the flow velocity in the fishway considered in this study is small, which may account for the small vortex parameters in the fishway. The size of the vortex in the fishway affects the fish passage [4], but elements such as the vortex intensity and the location of the vortex core are also important. Other vortex elements may affect fish passage. Note that the focus of this work is to better understand vortices and vorticity; the associated effects on fish passage may be discussed in future studies.

5. Conclusions

In this paper, an experimental model of a fishway was constructed to study the turbulence in the flow field. A combination of LES and VOF was used to simulate the 3D flow patterns in the fishway. The grid independence was evaluated in terms of LESIQ, and the simulated results were compared with experimental ADV data. The vortices in the pool chamber within the fishway were captured using the Q-criterion, Ω method, and Liutex method, and the vortex structure characteristics, vortex parameters, and vortex core diameters in different pools were analyzed. By comparing the ability of the three vortex identification methods to capture the vortices in the pool chambers of the fishway, the following major conclusions can be drawn:
(1) The vortex structures of the fishway pools have obvious 3D characteristics and exhibit irregular geometries. There are obvious differences in the vortex structures of different pools in the fishway. In the downstream direction, the size of the vortices gradually decreases, and the intensity gradually increases. The vortices in all pools except pool 5 are mainly distributed at the surface of the water flow.
(2) The vortices occupy most of the area of the fishway pools. Stronger vortices of smaller diameter distributed along the vertical axis were observed at the edge of the vertical seam of the fishway.
(3) The Liutex method captures more detailed structures of the vortex cores and was the only method that fully identified additional small-scale vortices. Additionally, the Liutex method captures the largest vortex diameter. Thus, the Liutex method is the most suitable technique for identifying the vortices inside fishway pools.

Author Contributions

Methodology, C.S., R.Y. and M.W.; validation, R.Y. and S.H.; formal analysis, C.S., R.Y. and S.Q.; writing—original draft preparation, R.Y.; writing—review and editing, M.W. and R.Y.; supervision, S.H.; project administration, C.S.; funding acquisition, C.S. All authors have read and agreed to the published version of the manuscript.

Funding

This research was funded by the National Natural Science Foundation of China (Grant numbers 52069009 and 51369013).

Institutional Review Board Statement

Not applicable.

Informed Consent Statement

Not applicable.

Data Availability Statement

The data presented in this study is contained and available within the article.

Acknowledgments

This study used the LiutexUTA code developed by Chaoqun Liu at the University of Texas at Arlington. This study was supported by the National Natural Science Foundation of China (Grant numbers 52069009 and 51369013).

Conflicts of Interest

All authors declare no conflict of interest.

References

  1. Sanagiotto, D.; Rossi, J.; Bravo, J. Applications of Computational Fluid Dynamics in The Design and Rehabilitation of Nonstandard Vertical Slot Fishways. Water 2019, 11, 199. [Google Scholar] [CrossRef]
  2. Valbuena-Castro, J.; Fuentes-Pérez, J.F.; García-Vega, A.; Bravo-Córdoba, F.J.; Ruiz-Legazpi, J.; Martínez de Azagra Paredes, A.; Sanz-Ronda, F.J. Coarse fishway assessment to prioritize retrofitting efforts: A case study in the Duero River basin. Ecol. Eng. 2020, 155, 105946. [Google Scholar] [CrossRef]
  3. Gilja, G.; Ocvirk, E.; Fliszar, R. Experimental Investigation of the Reynolds Shear Stress Exceedance Rate for the Injury and Disorientation Biocriteria Boundary in the Pool-Orifice and Vertical Slot Type Fishways. Appl. Sci. 2021, 11, 7708. [Google Scholar] [CrossRef]
  4. Rajaratnam, N.; Van der Vinne, G.; Katopodis, C. Hydraulics of vertical slot fishways. J. Hydraul. Eng. 1986, 112, 909–927. [Google Scholar] [CrossRef]
  5. Lupandin, A. Effect of flow turbulence on swimming speed of fish. Biol. Bull. 2005, 32, 461–466. [Google Scholar] [CrossRef]
  6. Silva, A.T.; Katopodis, C.; Santos, J.M.; Ferreira, M.T.; Pinheiro, A.N. Cyprinid swimming behaviour in response to turbulent flow. Ecol. Eng. 2012, 44, 314–328. [Google Scholar] [CrossRef]
  7. Tritico, H.M.; Cotel, A.J. The effects of turbulent eddies on the stability and critical swimming speed of creek chub (Semotilus atromaculatus). J. Exp. Biol. 2010, 213, 2284–2293. [Google Scholar] [CrossRef]
  8. Webb, P.W.; Weihs, D. Stability versus Maneuvering: Challenges for Stability during Swimming by Fishes. Integr. Comp. Biol. 2015, 55, 753–764. [Google Scholar] [CrossRef]
  9. Bermúdez, M.; Puertas, J.; Cea, L.; Pena, L.; Balairón, L. Influence of pool geometry on the biological efficiency of vertical slot fishways. Ecol. Eng. 2010, 36, 1355–1364. [Google Scholar] [CrossRef]
  10. Hinch, S.G.; Rand, P.S. Optimal swimming speeds and forward-assisted propulsion: Energy-conserving behaviours of upriver-migrating adult salmon. Can. J. Fish. Aquat. Sci. 2000, 57, 2470–2478. [Google Scholar] [CrossRef]
  11. Liao, J.C.; Beal, D.N.; Lauder, G.V.; Triantafyllou, M.S. Fish exploiting vortices decrease muscle activity. Science 2003, 302, 1566–1569. [Google Scholar] [CrossRef] [PubMed]
  12. Cote, A.J.; Webb, P.W. Living in a Turbulent World-A New Conceptual Framework for the Interactions of Fish and Eddies. Integr. Comp. Biol. 2015, 55, 662–672. [Google Scholar] [CrossRef] [PubMed]
  13. Gao, Z.; Andersson, H.I.; Dai, H.; Jiang, F.; Zhao, L. A new Eulerian–Lagrangian agent method to model fish paths in a vertical slot fishway. Ecol. Eng. 2016, 88, 217–225. [Google Scholar] [CrossRef]
  14. Ahmadi, M.; Ghaderi, A.; MohammadNezhad, H.; Kuriqi, A.; Di Francesco, S. Numerical Investigation of Hydraulics in a Vertical Slot Fishway with Upgraded Configurations. Water 2021, 13, 2711. [Google Scholar] [CrossRef]
  15. Yakhot, V.; Orszag, S.A.; Thangam, S.; Gatski, T.B.; Speziale, C.G. Development of turbulence models for shear flows by a double expansion technique. Phys. Fluids A 1992, 4, 1510–1520. [Google Scholar] [CrossRef]
  16. Tarrade, L.; Pineau, G.; Calluaud, D.; Texier, A.; David, L.; Larinier, M. Detailed experimental study of hydrodynamic turbulent flows generated in vertical slot fishways. Environ. Fluid Mech. 2011, 11, 1–21. [Google Scholar] [CrossRef]
  17. Marriner, B.A.; Baki, A.B.M.; Zhu, D.Z.; Thiem, J.D.; Cooke, S.J.; Katopodis, C. Field and numerical assessment of turning pool hydraulics in a vertical slot fishway. Ecol. Eng. 2014, 63, 88–101. [Google Scholar] [CrossRef]
  18. Liu, C.; Gao, Y.; Tian, S.; Dong, X. Rortex—A new vortex vector definition and vorticity tensor and vector decompositions. Phys. Fluids 2018, 30, 035103. [Google Scholar] [CrossRef]
  19. Robinson, S.K. Coherent motions in the turbulent boundary layer. Annu. Rev. Fluid Mech. 1991, 23, 601–639. [Google Scholar] [CrossRef]
  20. Zhang, Z.; Dong, S.; Jin, R.; Dong, K.; Hou, L.; Wang, B. Vortex characteristics of a gas cyclone determined with different vortex identification methods. Powder Technol. 2022, 404, 117370. [Google Scholar] [CrossRef]
  21. Zhang, Y.-N.; Wang, X.-Y.; Zhang, Y.-N.; Liu, C. Comparisons and analyses of vortex identification between Omega method and Q criterion. J. Hydrodyn. 2019, 31, 224–230. [Google Scholar] [CrossRef]
  22. Jeong, J.; Hussain, F. On the identification of a vortex. J. Fluid Mech. 1995, 285, 69–94. [Google Scholar] [CrossRef]
  23. Liu, C.; Wang, Y.; Yang, Y.; Duan, Z. New omega vortex identification method. Sci. China Phys. Mech. Astron. 2016, 59, 684711. [Google Scholar] [CrossRef]
  24. Liu, C. Letter: Galilean invariance of Rortex. Phys. Fluids 2018, 30, 111701. [Google Scholar] [CrossRef]
  25. Dong, X.; Gao, Y.; Liu, C. New normalized Rortex/vortex identification method. Phys. Fluids 2019, 31, 011701. [Google Scholar] [CrossRef]
  26. Gao, Y.; Liu, C. Rortex and comparison with eigenvalue-based vortex identification criteria. Phys. Fluids 2018, 30, 085107. [Google Scholar] [CrossRef]
  27. Liu, C.; Gao, Y.-S.; Dong, X.-R.; Wang, Y.-Q.; Liu, J.-M.; Zhang, Y.-N.; Cai, X.-S.; Gui, N. Third generation of vortex identification methods: Omega and Liutex/Rortex based systems. J. Hydrodyn. 2019, 31, 205–223. [Google Scholar] [CrossRef]
  28. Liu, J.; Liu, C. Modified normalized Rortex/vortex identification method. Phys. Fluids 2019, 31, 061704. [Google Scholar] [CrossRef]
  29. Liu, J.-M.; Gao, Y.-S.; Wang, Y.-Q.; Liu, C. Objective Omega vortex identification method. J. Hydrodyn. 2019, 31, 455–463. [Google Scholar] [CrossRef]
  30. Blocken, B.; Gualtieri, C. Ten iterative steps for model development and evaluation applied to Computational Fluid Dynamics for Environmental Fluid Mechanics. Environ. Model. Softw. 2012, 33, 1–22. [Google Scholar] [CrossRef]
  31. Fuentes-Pérez, J.F.; Silva, A.T.; Tuhtan, J.A.; García-Vega, A.; Carbonell-Baeza, R.; Musall, M.; Kruusmaa, M. 3D modelling of non-uniform and turbulent flow in vertical slot fishways. Environ. Model. Softw. 2018, 99, 156–169. [Google Scholar] [CrossRef]
  32. Xu, T.; Sun, S. Numerical simulation of the flow structure in vertical slot fishway. J. Hydraul. Eng 2009, 40, 1386–1391. [Google Scholar]
  33. Baki, A.B.M.; Zhu, D.Z.; Rajaratnam, N. Turbulence Characteristics in a Rock-Ramp-Type Fish Pass. J. Hydraul. Eng. 2015, 141, 04014075. [Google Scholar] [CrossRef]
  34. Wahl, T.L. Analyzing ADV data using WinADV. In Building Partnerships, Proceedings of the ASCE Joint Conference on Water Resources Engineering and Water Resources Planning and Management, Minneapolis, MN, USA, 30 July–2 August 2000; ASCE: Reston, VA, USA, 2020; pp. 1–10. [Google Scholar]
  35. Hirt, C.W.; Nichols, B.D. Volume of fluid (VOF) method for the dynamics of free boundaries. J. Comput. Phys. 1981, 39, 201–225. [Google Scholar] [CrossRef]
  36. Barton, A.F.; Keller, R.J. 3D Free Surface Model for a Vertical Slot Fishway. In Proceedings of the IAHR Congress, Thessaloniki, Greece, 24–29 August 2003. [Google Scholar]
  37. Hunt, J.C.; Wray, A.A.; Moin, P. Eddies, streams, and convergence zones in turbulent flows. In Proceedings of the Studying Turbulence Using Numerical Simulation Databases, 2. Proceedings of the 1988 Summer Program, Stanford University, Stanford, CA, USA, 1 December 1988. [Google Scholar]
  38. Wang, Y.-Q.; Gao, Y.-S.; Liu, J.-M.; Liu, C. Explicit formula for the Liutex vector and physical meaning of vorticity based on the Liutex-Shear decomposition. J. Hydrodyn. 2019, 31, 464–474. [Google Scholar] [CrossRef]
  39. Chen, Y.; Chen, X.; Li, J.; Gong, Z.; Lu, C. Large Eddy Simulation and investigation on the flow structure of the cascading cavitation shedding regime around 3D twisted hydrofoil. Ocean Eng. 2017, 129, 1–19. [Google Scholar] [CrossRef]
  40. Celik, I.; Cehreli, Z.; Yavuz, I. Index of resolution quality for large eddy simulations. J. Fluids Eng. 2005, 127, 949–958. [Google Scholar] [CrossRef]
  41. Quaresma, A.; Pinheiro, A. Modelling of Pool-Type Fishways Flows: Efficiency and Scale Effects Assessment. Water 2021, 13, 851. [Google Scholar] [CrossRef]
  42. Kucukali, S.; Hassinger, R. Flow and turbulence structure in a baffle–brush fish pass. Proc. Inst. Civ. Eng.-Water Manag. 2018, 171, 6–17. [Google Scholar] [CrossRef]
  43. Liu, X.-W.; Chen, S.-T.; Zhao, W.-W.; Wan, D.-C.; Wang, Y.-Q. Liutex-based centripetal force field model for improving the resistance and wake performances of JBC ship sailing in calm water. J. Hydrodyn. 2021, 33, 494–502. [Google Scholar] [CrossRef]
  44. Zhao, M.-S.; Zhao, W.-W.; Wan, D.-C.; Wang, Y.-Q. Applications of Liutex-based force field models for cavitation simulation. J. Hydrodyn. 2021, 33, 488–493. [Google Scholar] [CrossRef]
  45. Shen, C.-Y.; Yang, R.-G.; Qing, S.; He, S.-H. Vortex analysis of water flow through gates by different vortex identification methods. J. Hydrodyn. 2023, 35, 112–124. [Google Scholar] [CrossRef]
Figure 1. Experimental flume used (a) Side view of the flume; (b) Pool detail.
Water 15 02053 g001
Figure 2. Computational domain meshing diagram.
Water 15 02053 g002
Figure 3. Central plane colored by Qv.
Water 15 02053 g003
Figure 4. Comparison of experimental and simulated data. (a) Water depth at the central feature point of the fishway; (b) x-direction velocity at the central feature point of the fishway. (c) x-direction velocity at the vertical seam exit location; and (d) z-direction velocity at the vertical seam exit location.
Water 15 02053 g004
Figure 5. Three−dimensional vortex structures in fishway pools based on different vortex identification methods: (a) Q criterion; (b) Ω method; (c) Liutex method.
Water 15 02053 g005
Figure 6. Magnitude of (ac) Ω method and (df) Liutex method.
Water 15 02053 g006
Figure 7. Vortex diameter on the left side of pool 1: (a) Q criterion, (b) Ω method, (c) Liutex method; vortex diameter on the right side of pool 1: (d) Q criterion, (e) Ω method, (f) Liutex method.
Water 15 02053 g007
Table 1. Mesh parameters.
Mesh SeriesTotal Amount of Computational CellsGrid Nodes
Mesh 152,34660,930
Mesh 2101,881191,436
Mesh 3174,258193,600
Mesh 4359,964330,564
Disclaimer/Publisher’s Note: The statements, opinions and data contained in all publications are solely those of the individual author(s) and contributor(s) and not of MDPI and/or the editor(s). MDPI and/or the editor(s) disclaim responsibility for any injury to people or property resulting from any ideas, methods, instructions or products referred to in the content.

