Article

Assessment of Current Blue Energy Technologies and Their Potential Applications on Romanian Water Resources

by
Violeta-Monica Radu
,
Alexandru-Anton Ivanov
*,
Anca-Marina Vîjdea
,
Veronica-Elena Alexe
,
George Dincă
,
Andra-Elena Filiuță
and
Valentina-Maria Cetean
Geological Institute of Romania, 012271 Bucharest, Romania
*
Author to whom correspondence should be addressed.
Water 2023, 15(11), 2063; https://doi.org/10.3390/w15112063
Submission received: 20 April 2023 / Revised: 12 May 2023 / Accepted: 23 May 2023 / Published: 29 May 2023
(This article belongs to the Special Issue Water Environment Governance and Restoration)

Abstract

:
This study offers a comprehensive analysis of unconventional renewable and sustainable energy production options by tapping into the energy associated with the natural tendency to cancel salinity gradients that occur when salt water and fresh water come into contact. Furthermore, this paper assesses the potential for generating blue energy in Romania by examining historical data on flow rates from relevant fresh water sources, such as the Danube River, and the salt loading of potential receiving water bodies, including salt lakes, and the Black Sea. In addition, this study briefly references pilot-level technologies for blue energy production in other countries, including Norway, Japan, and the European Union. Based on literature data, this paper highlights the most important technological methods with applicative potential for harnessing energy from salinity gradients. The performances and limitations of these methods have been presented, acknowledging that despite recent years of advancements in materials and technologies, large-scale implementation and commercialization efforts are still limited. The analyzed data reveals that Romania possesses substantial potential blue energy resources for both large capacity installations, such as the Danube River-Black Sea with a potential achievable capacity of about 50 MW, as well as smaller capacity devices situated around saline lakes and salt deposits. This study concludes that Romania has a unique opportunity to capitalize on its vast blue energy potential and drive sustainable energy development.

1. Introduction

Research on renewable energy technologies has focused in recent years on resources for producing low-carbon renewable energy with the goal of meeting the European commitment to achieve climate neutrality by 2050 [1,2,3,4]. To combat climate change, an energy transition is necessary to replace fossil fuels with available renewable sources [5], including marine resources [6]. For several reasons, such as legislation, financial aspects, or environmental integration, marine energy exploitation is still insufficiently implemented; being largely unknown to the general public.
Romania has rich and varied renewable resources including biomass, hydro energy, geothermal, wind, solar, and photovoltaic. These resources are distributed throughout the country and can be exploited on a larger scale when the performance–price ratio is improved. Romania has advanced in its use of wind and photovoltaic technologies, which have a very low impact on the environment [7].
The need for clean energy grows, and low-emission renewable energy is a sustainable alternative to meet our daily energy needs. The capacity of renewable energy technologies to offer varied alternative solutions is gradually improving (Table 1).
In recent years, significant progress has been made in the development of power generation technologies to enhance the energy extraction from renewable sources. This is important because, although many older conventional renewable technologies have larger public use, great amounts of energy are required for their modules manufacture as in the case of semiconductor solar panels. In this context, hybrid unconventional green technologies are developed that harness multiple types of power sources simultaneously, such as the photovoltaic microbial fuel cells [10,11,12] that harness chemical, biological and solar energy sources. This field of research demonstrates the potential for advancements through the utilization of newly developed nano-structured materials and catalysts. These advancements not only enhance biocompatibility and energy transfer efficiency but also reduce the capital costs associated with many conventional green energy technologies.
One of the unconventional sources of renewable energy is called “Blue Energy” or “Power from Salinity Gradient” (SGP) [9]. In broad terms, it is energy obtained by controlled mixing of a stream of high salinity (HS) water (e.g., seawater) and a stream of low salinity (LS) water (e.g., treated wastewater or freshwater from a river). There are two main applications: (1) as an “autonomous power plant” located at the point where a river flows into the sea or (2) as a hybrid energy generation process that focuses on recovering energy from a production process, such as desalination or a wastewater treatment plant.
At a global level, there are several technologies available for obtaining renewable energy from salinity gradient by mixing fresh and saline water, which provide a new strategic approach to obtaining new sources of renewable energy [13].
However, energy production from salinity gradients is not yet used in Romania, despite its remarkable potential for applicability. In other countries, technologies based on salinity gradients have already been applied, and research has been conducted both at the laboratory-level and at the micro-pilot-level for certain types of technological approaches.
The most well-known and investigated technologies for generating energy from the salinity gradient are Pressure Retarded Osmosis (PRO), Reversed Electrodialysis (RED), and Capacitive Mixing (CAPMIX). The theoretical amount of energy available from mixing 1 m3 of seawater with 1 m3 of river water is about 1.8 MJ [14,15]. For other applications, which could use saturated brine instead of seawater, the theoretical energy available from mixing it with river water is 15 MJ [16,17]. Other scientists report that the theoretical mixing energy of 1 m3 of river water with seawater corresponds to 0.70~0.75 kWh [18]. Based on simple estimations, the theoretical global power of mixing seawater and river water can reach 1.9–2 TW of electricity (~15.102 TWh/year), which is approximately 10% of the current global energy consumption [2,3,19].
This study analyzed the existing methods for obtaining renewable energy from salinity gradients, their advantages and disadvantages, as well as Romania’s potential to generate blue energy.

2. Technologies for Obtaining Energy from Salinity Gradient

2.1. Pressure Retarded Osmosis

The most intensively studied technique for obtaining energy from the salinity gradient is pressure retarded osmosis (PRO), which first converts blue energy to mechanical work using a semipermeable membrane and then to electric energy using a hydro-turbine (Figure 1) [20,21].
PRO is an energy generation process that harnesses the salinity gradient between two bodies of water with different salinities [22,23]. PRO uses a semipermeable membrane placed between the two streams of different salinity, where water permeates from the less concentrated stream to the more concentrated one, to balance the concentration gradient between the two solutions [24,25].
In PRO technology, a salinity gradient is used as the driving force to produce osmotic power [26]. This is caused by a difference in osmotic pressure between the two sides of the membrane, resulting in lower salinity water from the feed solution being driven towards a pressurized draw solution with higher salinity [26].
PRO generates continuous electrical energy regardless of the time of day and weather conditions [21].
In the last decade, significant progress has been made in the rational design and fabrication of efficient PRO hollow fiber membranes. Both fully-formed phase inversion hollow fiber membranes and composite thin film coated hollow fiber membranes with suitable membrane structures, balanced permeation properties, and good mechanical strength have been developed [27].
However, a feasibility analysis of PRO-scale processes is hindered by the lack of a simulation-optimization framework for the PRO unit that takes into account the effects of: (1) non-ideality of the electrolyte solution on the evaluation of osmotic driving force, (2) non-development of the membrane idealness in evaluating permeate flux, (3) membrane pressure drop, (4) continuous dilution of the draw flow over large membrane surfaces, reducing the average driving force, and (5) inefficiency of pressured equipment. These phenomena have a significant impact on the amount of net recoverable energy from a particular PRO configuration [21].
Although there have been many recent advances in membrane performance and other system components for PRO, it is still uncertain whether the process can be implemented feasibly.

2.2. Reverse Electrodialysis (RED)

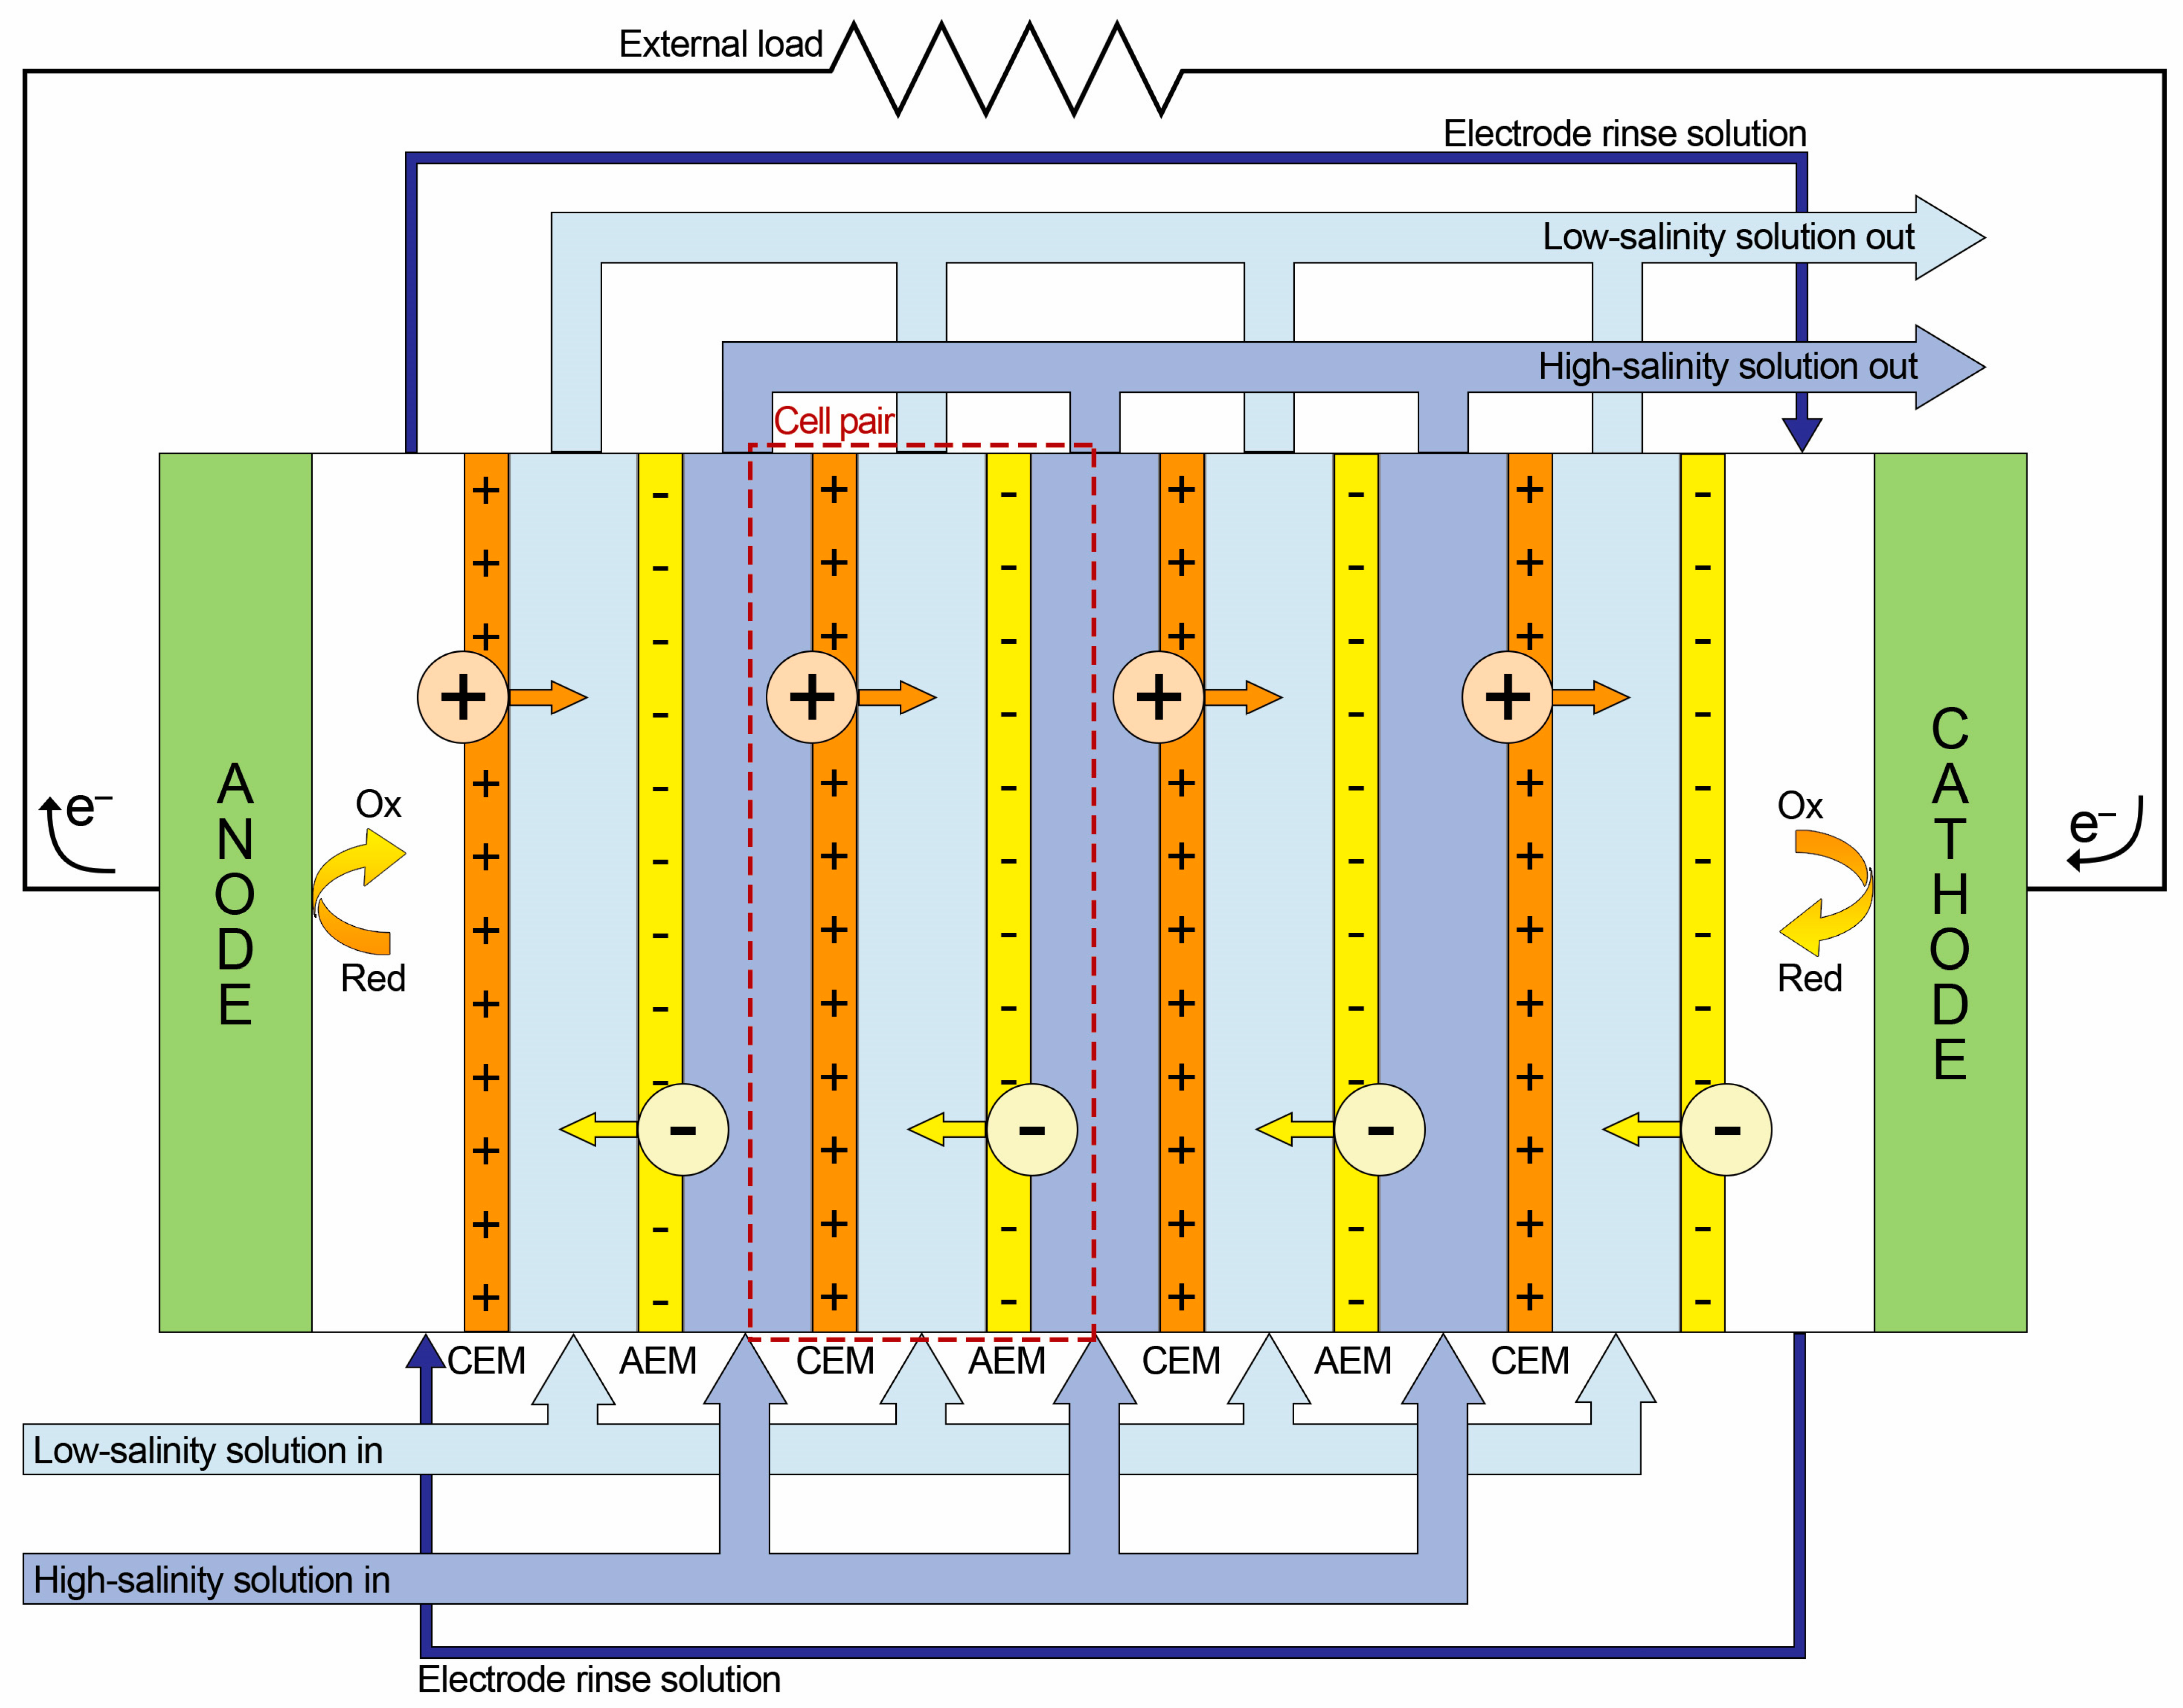
Direct electrodialysis uses an external current to force the ions migration through ion-selective membranes against their chemical potential. There are two types of membranes involved: anion exchange membranes (AEM) and cation exchange membranes (CEM). In an electrodialysis module, these membranes are alternately staked with spacers delimiting water flow chambers. At the ends of the stack, electrode chambers are used to close the electrical circuit. In direct electrodialysis, an external electric current will draw the anions from chamber x through AEM toward the anode. After passing through an AEM membrane to chamber y, the next membrane will be a CEM which prevents the anions to pass further. At the same time, cations from the next chamber z will be drawn toward the cathode, passing through the CEM membrane in the y chamber. From there, the AEM membrane prevents the cations from reaching the x chamber. This is how direct electrodialysis forms chambers with alternating low (x, z) salinity (LS) and high (y) salinity (HS). In reverse electrodialysis (RED), the HS water flow chambers are fed with sea water or brines and the LS water flow chambers are fed with river water (Figure 2).
The arrows from the internal circuit depict the positive ions migration toward the cathode and the negative ions migration toward the anode. In the external circuit, the migration direction of the electrons as negative charged carriers is depicted. The electric current conventional direction in the external circuit is inverse to the electron migration direction.
Since CEM and AEM membranes allow either positively charged ions or negatively charged ions to pass from HS towards LS (driven by their chemical potential difference between HS and LS), ionic concentration differences over the membrane surfaces are created which polarize each membrane. The alternate stacking of the membranes cumulates the individual membrane’s electrical potential differences towards a greater overall voltage. When the electrodes are connected to an electrical load which allows the flow of electrons in the external circuit, ions are transported in the internal circuit from HS toward LS chambers. At the ends of the stack, in the electrode chambers, the ionic current is converted to electrical current through reversible redox reactions to promote the energy generation [29,30].
The symmetry between ED and RED processes potentially allows the use of a specially designed electrodialysis module as an energy accumulator, functioning as an ED during the charge cycle and as a RED during discharge.
In modern times, pilot-level experimentation, such as the Netherlands Blue Energy project at Afsluitdijk and the European Union’s REAPower in Marsala, Italy had encouraged the scientific community to develop RED technologies with higher membrane power density (over 2.2 W·m−2) and a decrease in fouling and other adverse influences by improving membrane design and introducing periodic steps aimed at membrane’s surface reconditioning [30].

2.3. Capacitive Mixing (CapMix)

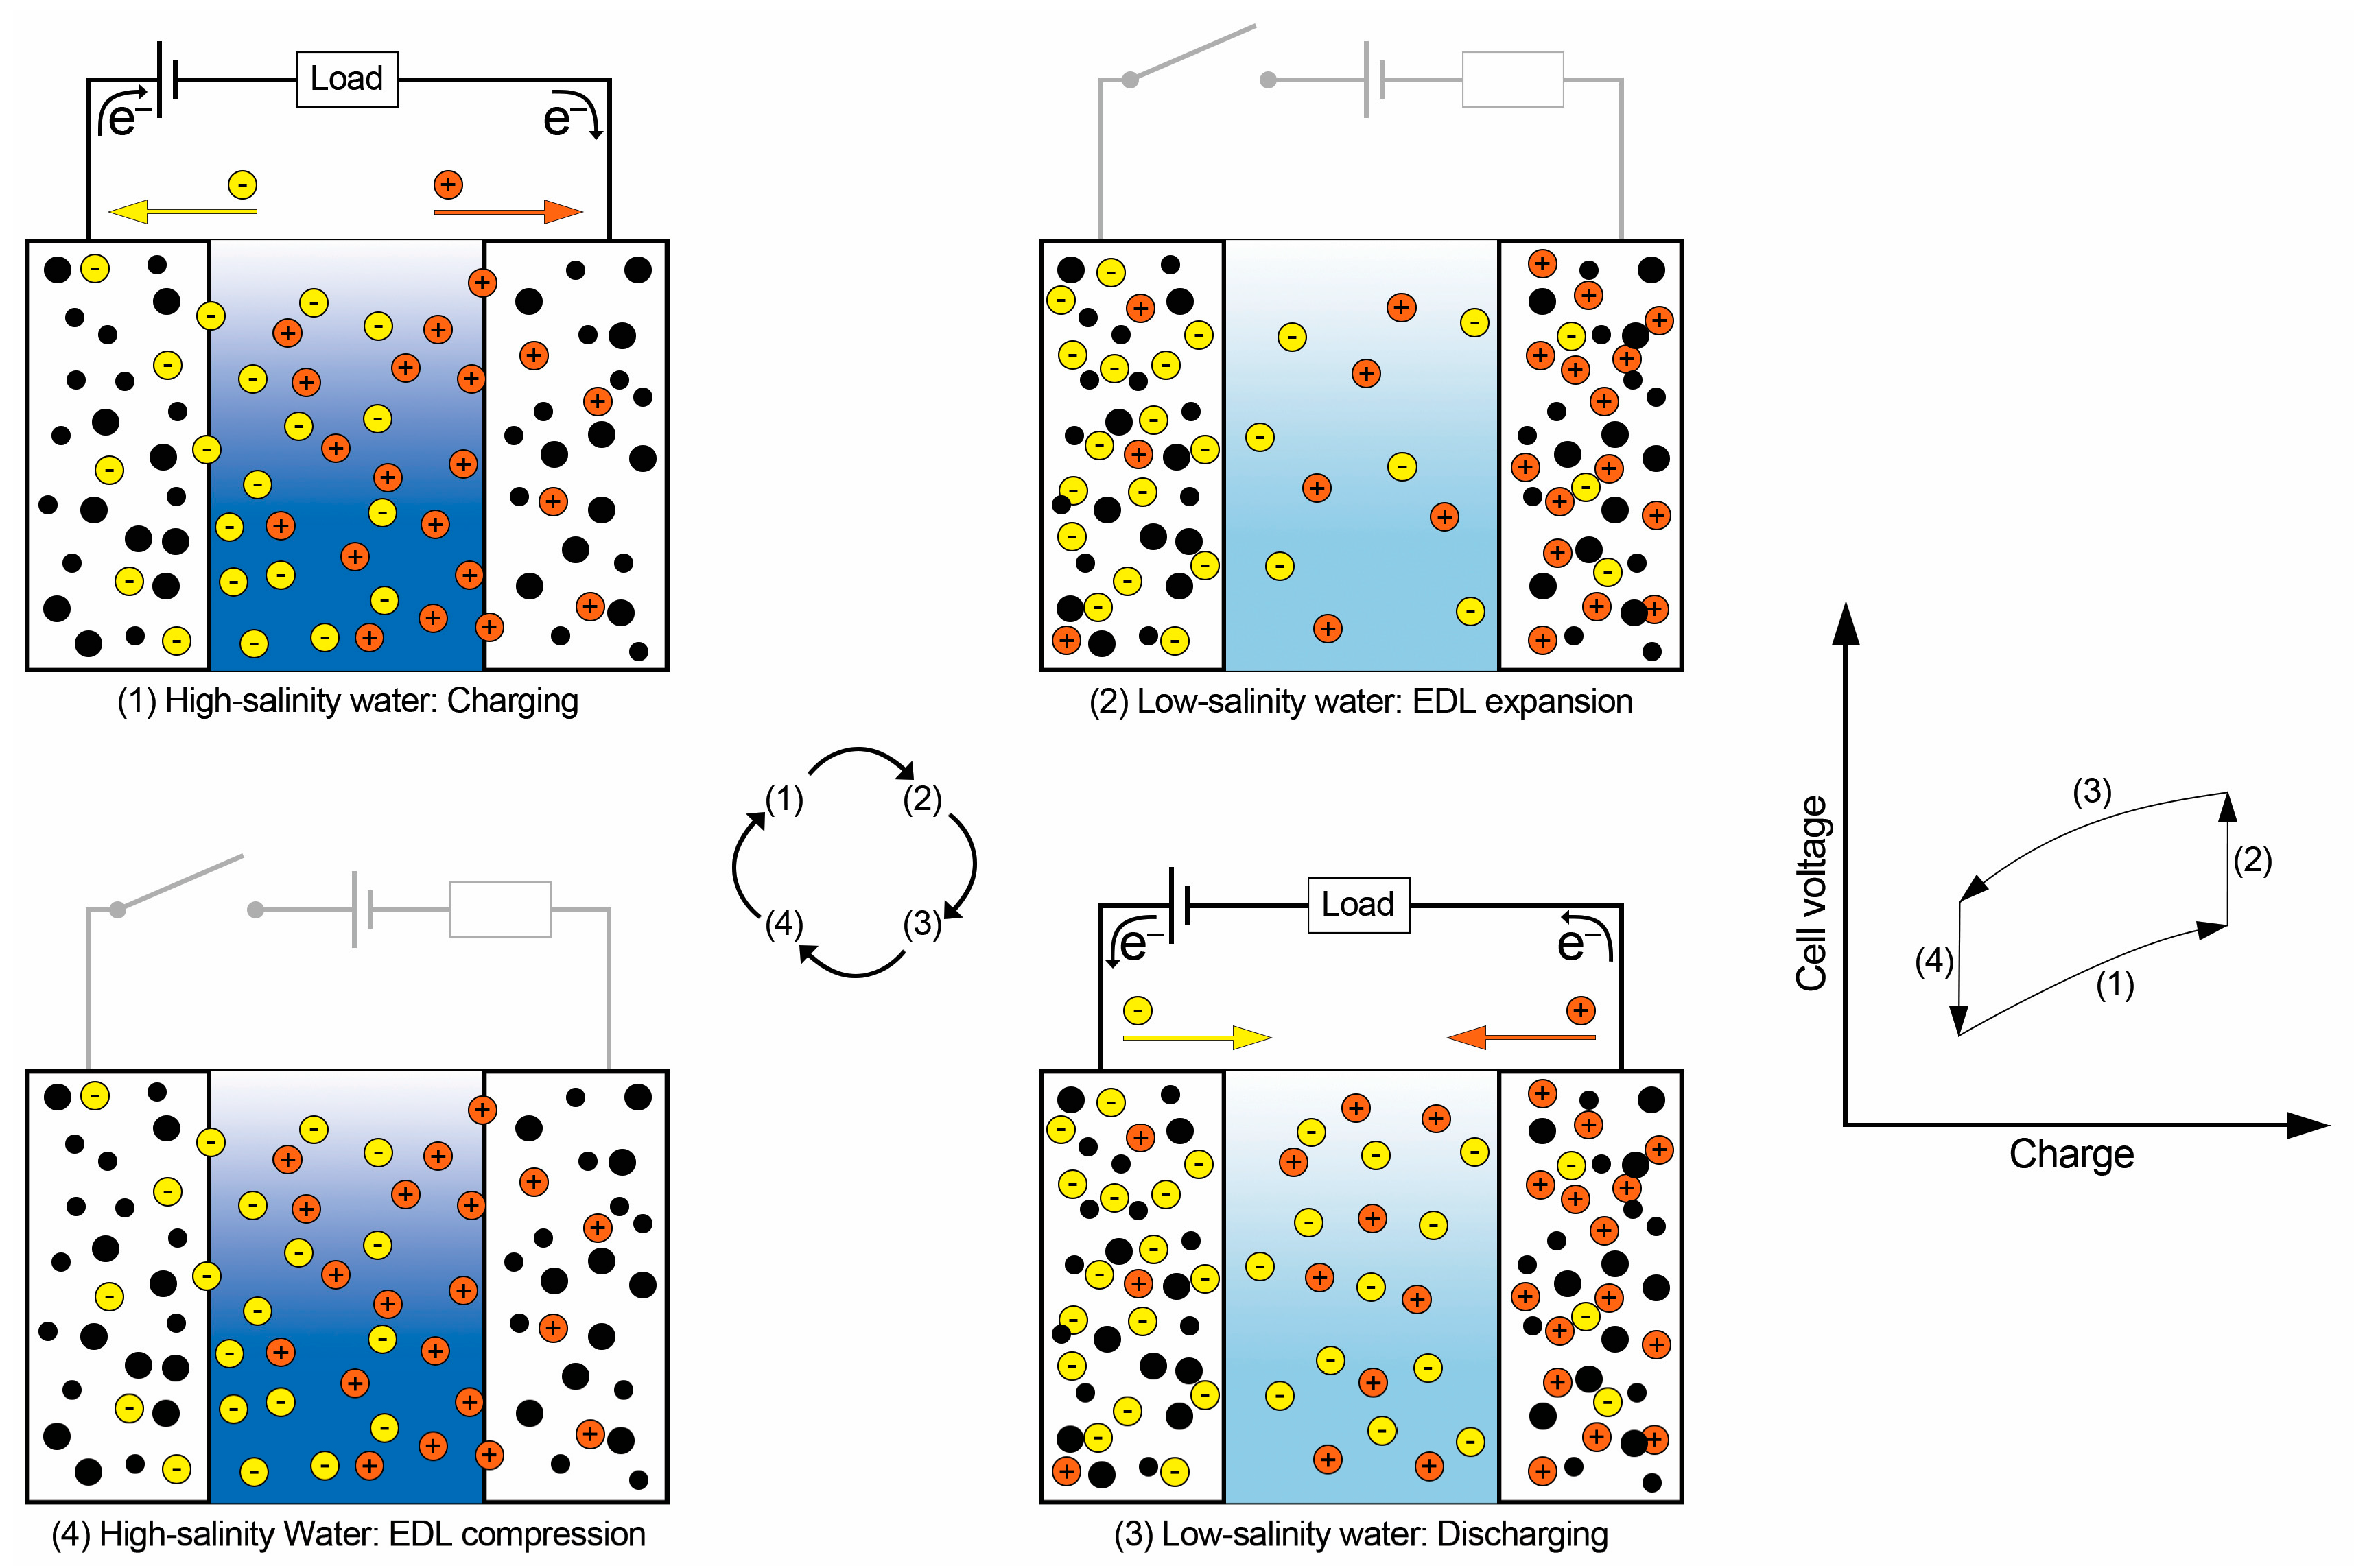
The advantages of CapMix over the PRO or RED technologies are derived from the fact that CapMix does not require the use of high pressures and turbines such as in PRO or special redox electrolytes such as in RED. CapMix is similar to PRO and RED due to the fact that it extracts energy from mixing waters with different salinity. Some of the differences between CapMix and RED are related to the fact that RED systems may operate continuously as opposed to CapMix which operates following cycles of charge and discharge. The CapMix cells use either the capacitive double-layer expansion (CDLE) or capacitive donnan potential (CDP) as the main mechanism for generating power from salinity differences [31]. In this respect, CDLE-CapMix technologies are similar to the behavior of electrical capacitors. In an electrical capacitor, the energy consumed during the charge cycle is slightly greater than the energy recovered during its discharge on an external resistor. In CapMix technologies, because the charging and discharging of the electrodes takes place in waters with different salinity, the discharging step provides more energy than the charging step consumes. Based on the electrodes types, the charge and discharge cycles may operate in respect to cell voltages either in steps that are always positive (i), in steps that alternate between positive and negative potentials, crossing the 0 V point (ii), or in steps that are always negative (iii), as seen in Figure 3.
The CDLE-CapMix cells following the (i) and (iii) cycles require an external energy source during the charging step, providing excess power during discharge as seen in Figure 4. The (ii) cycle, characteristic for CDP-CapMix, is usually achieved by using ionic exchange membranes or electrodes, and does not require an external power source to operate. In this case, both the charge and discharge steps provide power to an external load, alternating the voltage polarity as seen in Figure 5. If the accumulation of a greater charge is desired, CDP-CapMix may also be operated with an external power source.
In CDLE-CapMix the electric double-layer (EDL) is formed at the contact between the electrode and the electrolyte (salty water) under the external electrical voltage applied during the charge step in HS water. Practically, the applied voltage creates a charge on the surface of the electrodes which leads to the migration of the counter-ions to their respective electrodes. If the voltage difference is below the water splitting or below other ions discharge levels, no electrolysis is performed and the external voltage only creates the EDL with a gap on the order of a fraction of a nanometer. The mechanism in which EDL stores the electric charge is similar to those of an electrical capacitor. Replacing the electrolyte with a lower salinity one, causes the EDL to expand further apart leading to an increase in voltage. This increase in voltage is the one responsible for providing more power during discharge than the power consumed during charge. The electrodes are usually identical and made from porous activated carbon [32], amorphous coal, graphite or carbon nanotubes [33]. The cell and electrode geometry and type modify the active surface and implicitly the cell’s energy extraction efficiency [34]. One of the limitations of this type of CDLE-CapMix is posed by secondary redox reactions that cause charge leakage or self-discharge of the EDL. An improvement of the CDLE-CapMix with identical electrodes is the use of electrodes with different spontaneous potentials. The use of modified electrode pairs, one electrode with negatively charged molecules and the other one with positively charged molecules, reduce the need to use an external power source to maintain the EDL against secondary redox leakage.
In CDP-CapMix, the carbon electrode pair are covered by ion exchange membranes, one with AEM, the other with CEM. The specific affinity of the membranes for their respective ions allows, when they are immersed in HS water, to generate an electrical current as the specific ions are attracted and migrate toward the porous carbon electrodes. After the electrolyte is changed with LS water, the ions migration is reversed toward the electrolyte (also reversing the electrons flow direction in the external circuit).
Other promising directions for the CapMix process include the development of mixing entropy batteries based on pairs of electrodes made from different materials, capable to chemically exchange sodium and chloride ions with the HS and LS electrolytes. Various electrode materials are proposed, such as a sodium manganese oxide electrode (for Na+ capture) coupled with a silver chloride electrode (for Cl capture), or a Prussian blue analogues electrodes (for Na+ capture) coupled with a poly-pyrrole electrode (for Cl capture), or a copper hexacyanoferrate electrode (for Na+ capture) [35,36,37].

3. Pilot Centers for the Generation of Blue Energy

The world’s first osmotic power plant with a capacity of 4 kW was opened by Statkraft in 2009 in Tofte, Norway. This plant is able to produce a power density of 1 W/m2 of membrane which is obtained at a 10 L/s water flow at a pressure of 10 bar [38].
In Japan, the Mega-ton Water Project was carried out during the years 2010–2013 and focused also on PRO to reduce both the energy consumption and the environmental impact of seawater RO desalination plants [39].
The pilot plant in Afsluitdijk, Netherlands, opened in 2014 to produce 50 kW/h of blue energy and shows technical feasibility under real-life conditions using fresh water from the IJsselmeer and saltwater from the Wadden Sea [40].
The REAPower project developed in the EU used a concentrated brine and sea water as the two different salinity feeds for a RED pilot in Italy. Power densities of up to 11 W/m2 were achieved.

4. The Potential Applicability of Salinity Gradient in Romania

The dissolution of sodium chloride from massive salt deposits or from impregnations inevitably leads to an increase in the degree of mineralization of the rivers and streams that flow through or originate from the area of development of Miocene formations containing salt from Romania. Practically, the mineralization process starts from the numerous salty springs that exist in the Carpathian area and at which the highest concentrations of salts (often over 300 g/L) are reached. These springs lead to a rapid increase in the degree of mineralization of the streams that originate in the respective springs or contribute to the mineralization of streams or rivers in the basins they evolve in. For these elements of the hydrographic network, the average mineralization values are usually between 10 and 60–70 g/L. Their gradual collection in rivers with larger flows leads to an increase in the degree of mineralization of those rivers, so that in regions located in the lower course of these rivers, values of 1–5 g/L salt content can be reached, which is quite high for rivers with high flows. However, the degree of mineralization of the rivers also adds to the contribution of the solutions discharged through human activities, which are entirely subordinate, quantitatively.
In the salt rich area in the northeastern part of the Romanian Plain, the streams of several rivers with different degrees of mineralization accumulate, among which the Râmnicul Sărat, Slănicul de Buzău, Ialomița, Putna, Râmna, and Siret should be mentioned. From the above-mentioned rivers, Râmnicul Sărat stands out, sometimes equaled only by Ialomița, to which Buzău is added due to its generally highly mineralized tributary, namely Slănicul de Buzău. In the Transylvanian Basin, Târnava Mică, Someșul Mare, and Olt River stand out from this point of view.
Romania has a significant and untapped potential energy resource based on the salinity gradient, especially considering the discharge of the Danube River into the Black Sea [25].
The Black Sea is extremely valuable from various perspectives: economic, political, social, environmental, and strategic. Blue growth and blue energy should play a more important role in the projections and initiatives of the European Union for all maritime basins within its scope, especially that of the Black Sea [41].
Romania is rich in salt deposits and has also many salt and brackish water lakes, of various size and origin (Table 2).
Salt waters are defined as those waters having a concentration of dissolved mineral salts (salinity) between 30 and 40 g/L, while brackish waters have the mineral salts concentration between 0.5 and 30 g/L, and “fresh” waters less than 0.5 g/L [47]. For the sea water an average value of 35 g/L is used in calculations, but the salinity varies with the fresh water intake, precipitation amount, water currents, as well as with the season and climate zone. Due to these conditions, the salinity of the Black Sea varies between 17 and 21 g/L, even lower values being found in proximity of the Danube River discharge mouths. Hypersaline waters (brines), containing more than 40 g/L dissolved salts, and brine lakes are found, in Romania, located on old salt exploitations, whose ceilings collapsed.
Another classification took into consideration the limit of 1 g/L for fresh water (based on the perception of salty taste by humans), 1–25 g/L for brackish water, 30–50 g/L for the lakes with marine salinity and over 50 g/L for brines. Concentrations higher than 50 g/L were not found in the sea water [42,43].
Depending on the dominant anion, there are three types of lake waters: bicarbonatic, sulfatic and chloridic. Depending on the dominant cations, in each water type there can be three groups: Ca, Mg, and Na.
Table 2 shows the main properties of natural and man-made (ponds) lakes with brackish, salt and hypersaline water in Romania, information adapted from various authors [42,43,44]. All of the water bodies presence and state were checked on Google Earth time series images.
Natural lakes with brackish waters are found in areas with low humidity, where the water evaporation is higher and the precipitations lower than in the other areas.
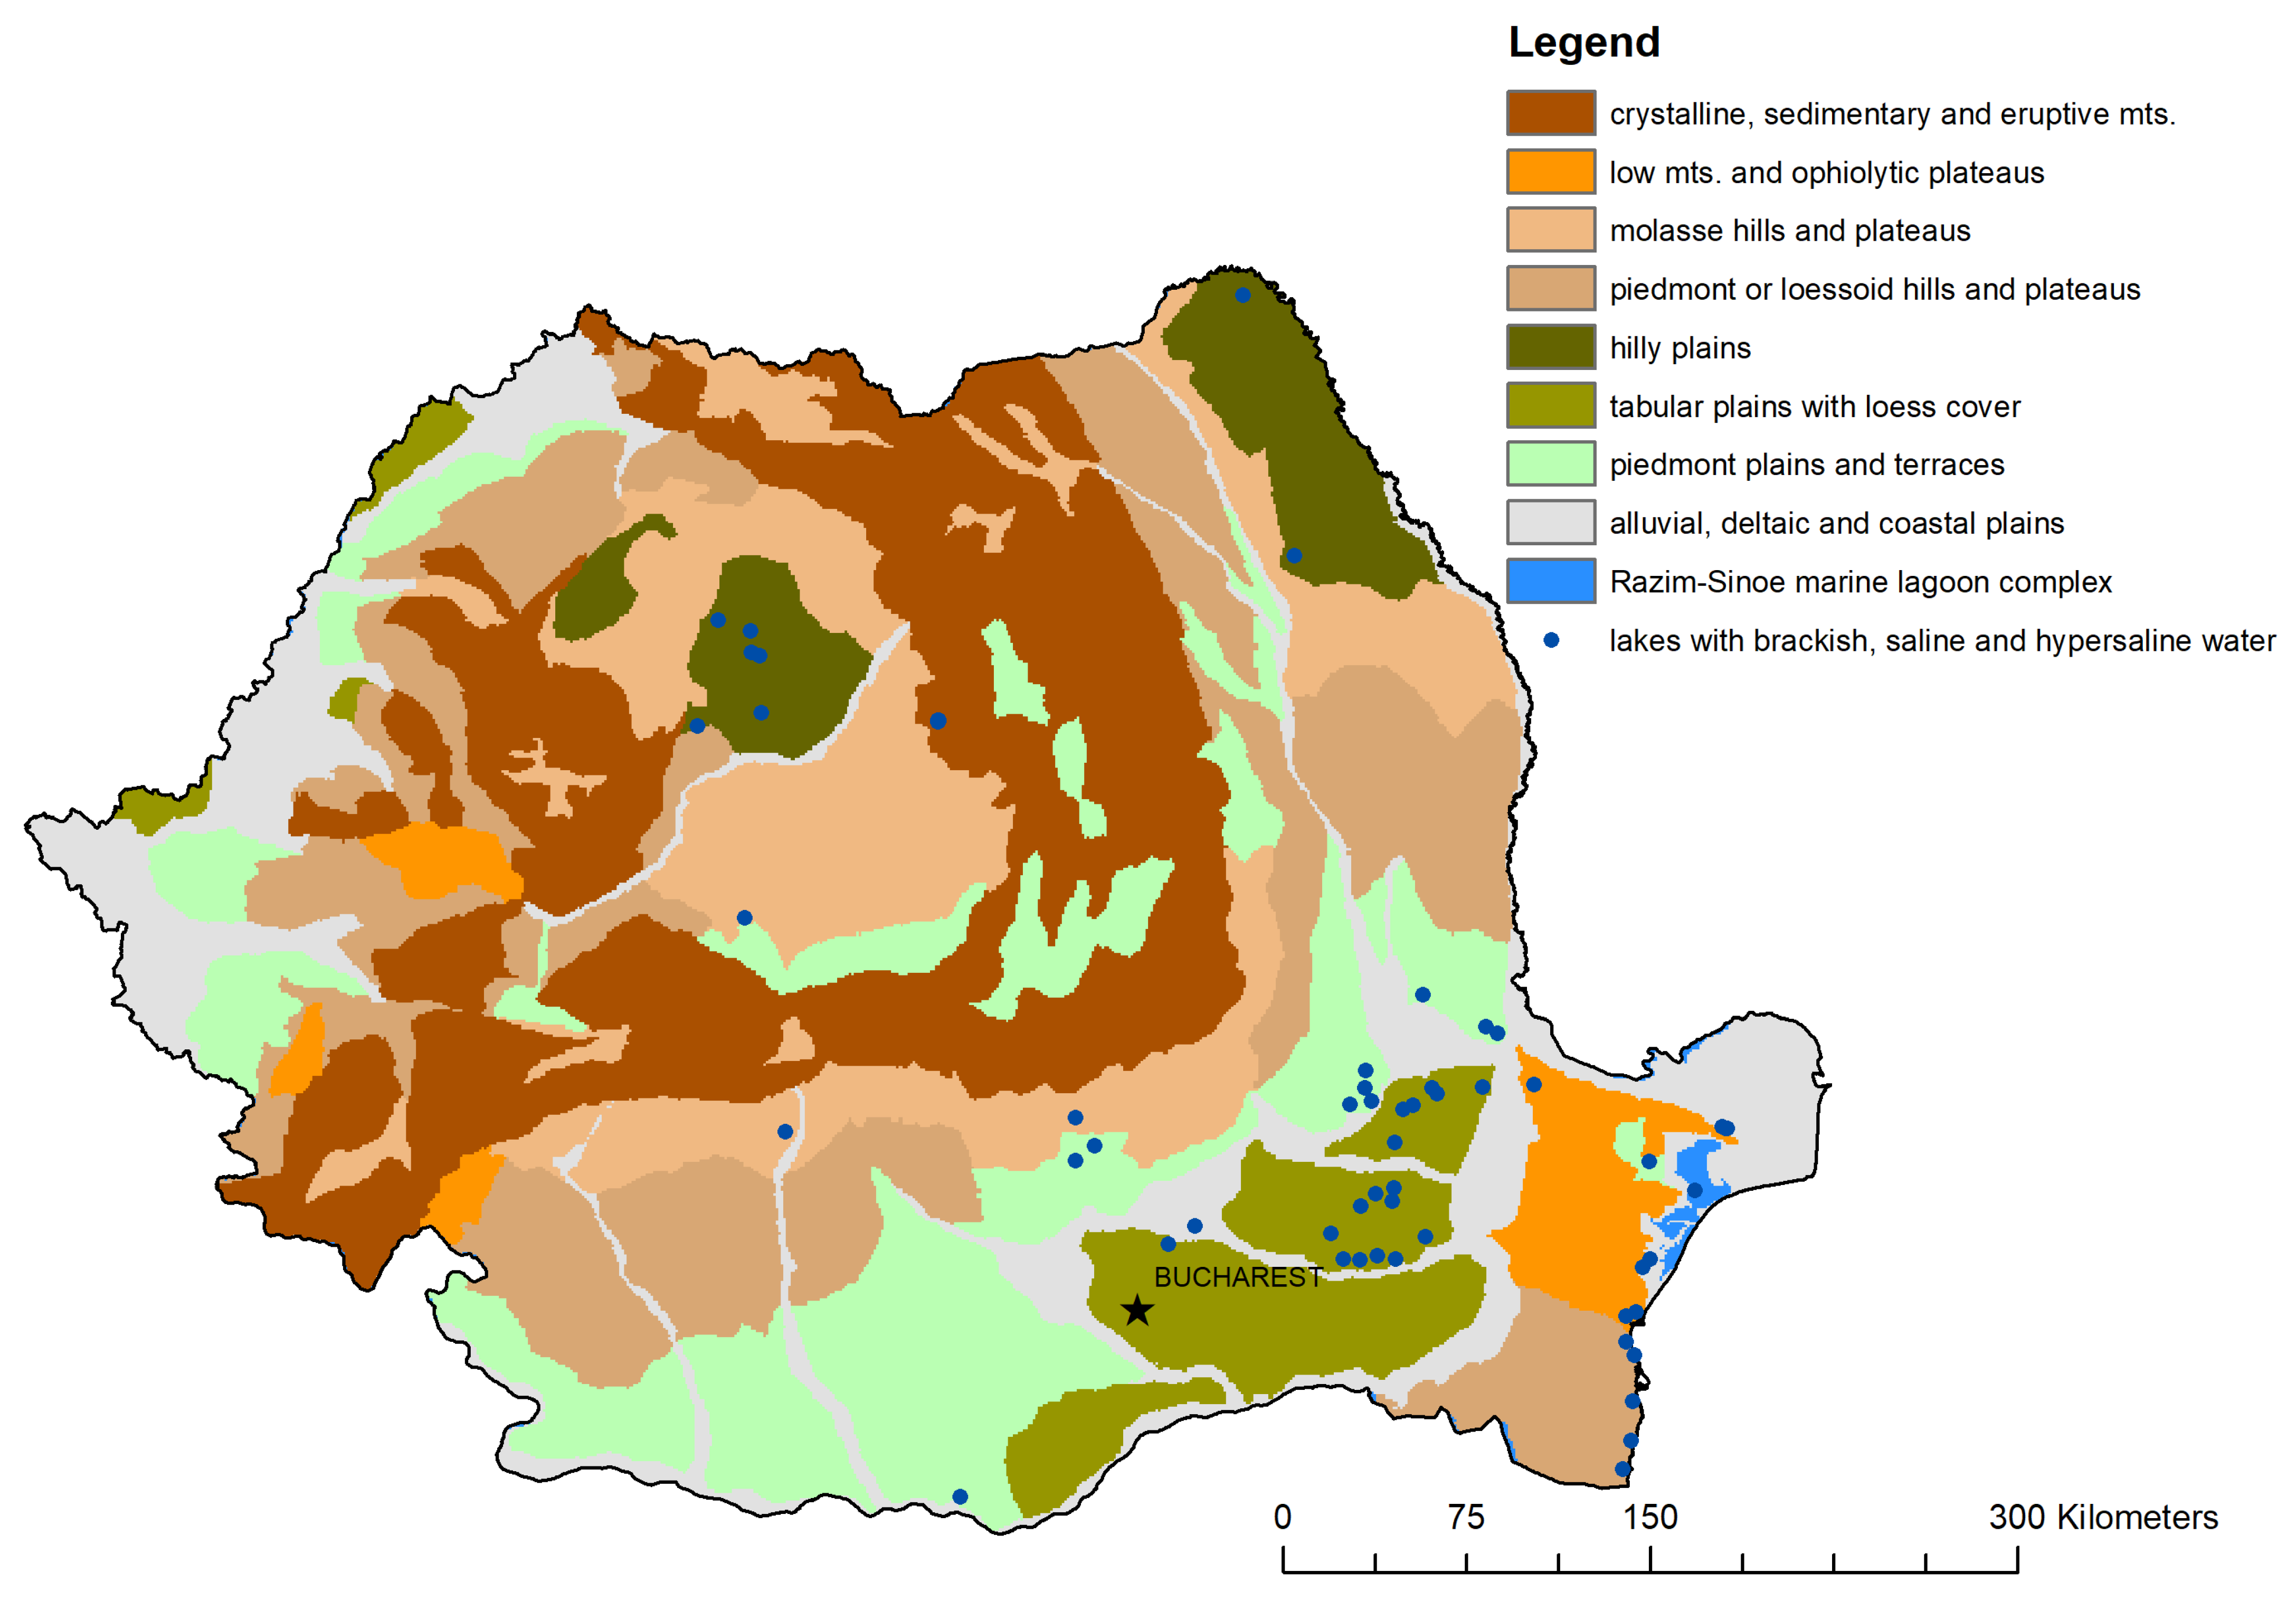
They can have various origins (Figure 6) and are located in the:
-
Danube River floodplain, near Zimnicea (Balta Suhaia);
-
Prahova River catchment (Balta Filipești-Târg);
-
Ialomița River catchment (Căldărușani, Balta Maia, Fundata, Reviga, Șchiauca, Amara—Slobozia, Iezer, Stachina);
-
Buzău River catchment (Balta Amara—Buzău, Balta Albă, Jirlău);
-
Padina Plain, near Făurei (Choibășești or Chichinețu, Plașcu, Tătaru);
-
Brăila Plain (Plopu, Lutu Alb);
-
Siret River Catchment (Balta Tălăbasca, Balta Mălina, Balta Cătușa);
-
Prut River catchment (Viișoara);
-
Dobrogea region (Babadag, Razelm complex, Tașaul, Gargalîc, Mangalia, Sărat-Greci, Tătlăgeac).
Man-made lakes (ponds) were mentioned on maps and old documents dating as far as 15th century. By damming the natural course of a river, people had increased the water supplies to be used in arid areas (many were found in the Moldavian Plateau, but they were present also, to a smaller extent, in the Transylvania Plateau) or for fish farms.
Salt lakes were found in the Romanian Plain (Movila Miresii, Ianca, Batogu, Lacu Sărat—Brăila), on the Black Sea shore (Histria or Duingi, Techirghiol), and in a great number in the Transylvania Plateau and Sub-Carpathians, in the areas of old salt mines (Ocnele Mari, Ocna Sibiului, Ocna Dej, Turda, etc.). The concentration in dissolved salts was less than 100 g/L in natural lakes located in areas with scarce humidity in the Eastern part of the Romanian Plain, which were formed by suffusion processes in loessoid deposits. In the lakes formed in or in the proximity of old salt mines the concentration was very high, close to saturation [42]. The concentration of salt lakes changes during the year depending on the hydrometeorological conditions.
Many of the salt lakes formed in relation with salt diapirs are used in balneology and some have also sapropelic mud. Figure 7 exemplifies the use of small hypersaline lakes in balneology, at Ocna Sibiului from the Transylvania Plateau.
Installing a PRO or RED plant in Romania could prove challenging due to the need of obtaining a license. Although there are numerous salt and brine lakes in the country, any proposed installation must ensure that the activities, such as balneology, and the equilibrium of the salt water body are not disturbed or negatively impacted. Furthermore, studies have shown [49] that the efficiency of running a power-generating installation based on SGP required the availability of some hundreds of m3/day of water as an input in the plant. We consider, therefore, that regarding the water flow, a prospective site would be on the dam of Sulina, which is advancing around 4 km into the sea, and where the fresh waters of the Danube River are mixing with the waters of the Black Sea. Another envisaged location could be on the shores of the Danube River Canal at Agigea or Năvodari.

Estimation of the Theoretical Amount of Energy Released When Mixing Water Streams with Different Salinity

The theoretical potential obtained from the Gibbs free energy balance between the input of concentrated and diluted streams and the resulting brackish effluent represents the maximum available energy considering an ideal extraction:
T P = G c + G d G b
G i = T i Q i m i R x i l n x i + y i l n y i
where TP is the theoretical available potential energy (W), G is the Gibbs free energy (W) for the concentrated, diluted and brackish streams (c, d, b), T is the absolute temperature (K) of the respective stream, Q is the flow-rate (m3·s−1), m is the total number of moles (anions, cations and water) per unit of volume (mol·m−3), R is the universal gas constant (8314 J·mol−1·K−1), x is the sum of the molar fractions of the corresponding anions and cations, y is the molar fraction of the water content [9].
Taking into account technological performance limitations and environmental restraints, only a fraction of this TP may be achieved. Other works detail the estimation algorithms of various constraints on the available TP [9]. As such, after considering the limitation of water extraction at river mounts due to environmental reasons (such as maintaining the minimum ecological flow), only about 20% of TP remains available. Further considering the natural variability of the river’s characteristics, only about 16.8% of TP remains available. After also factoring in the technological restraints and efficiencies, a better estimation of achievable power (AP) generation at river mouths of about 3.14% of the original TP is expected. These are all general assumptions useful for an initial assessment and comparison of different potential freshwater and saltwater sources. Further in-depth investigations are needed to confirm the AP of particular cases, since each particular case may pose additional restrictions or allotments and the specific selected technology may yield other efficiencies.
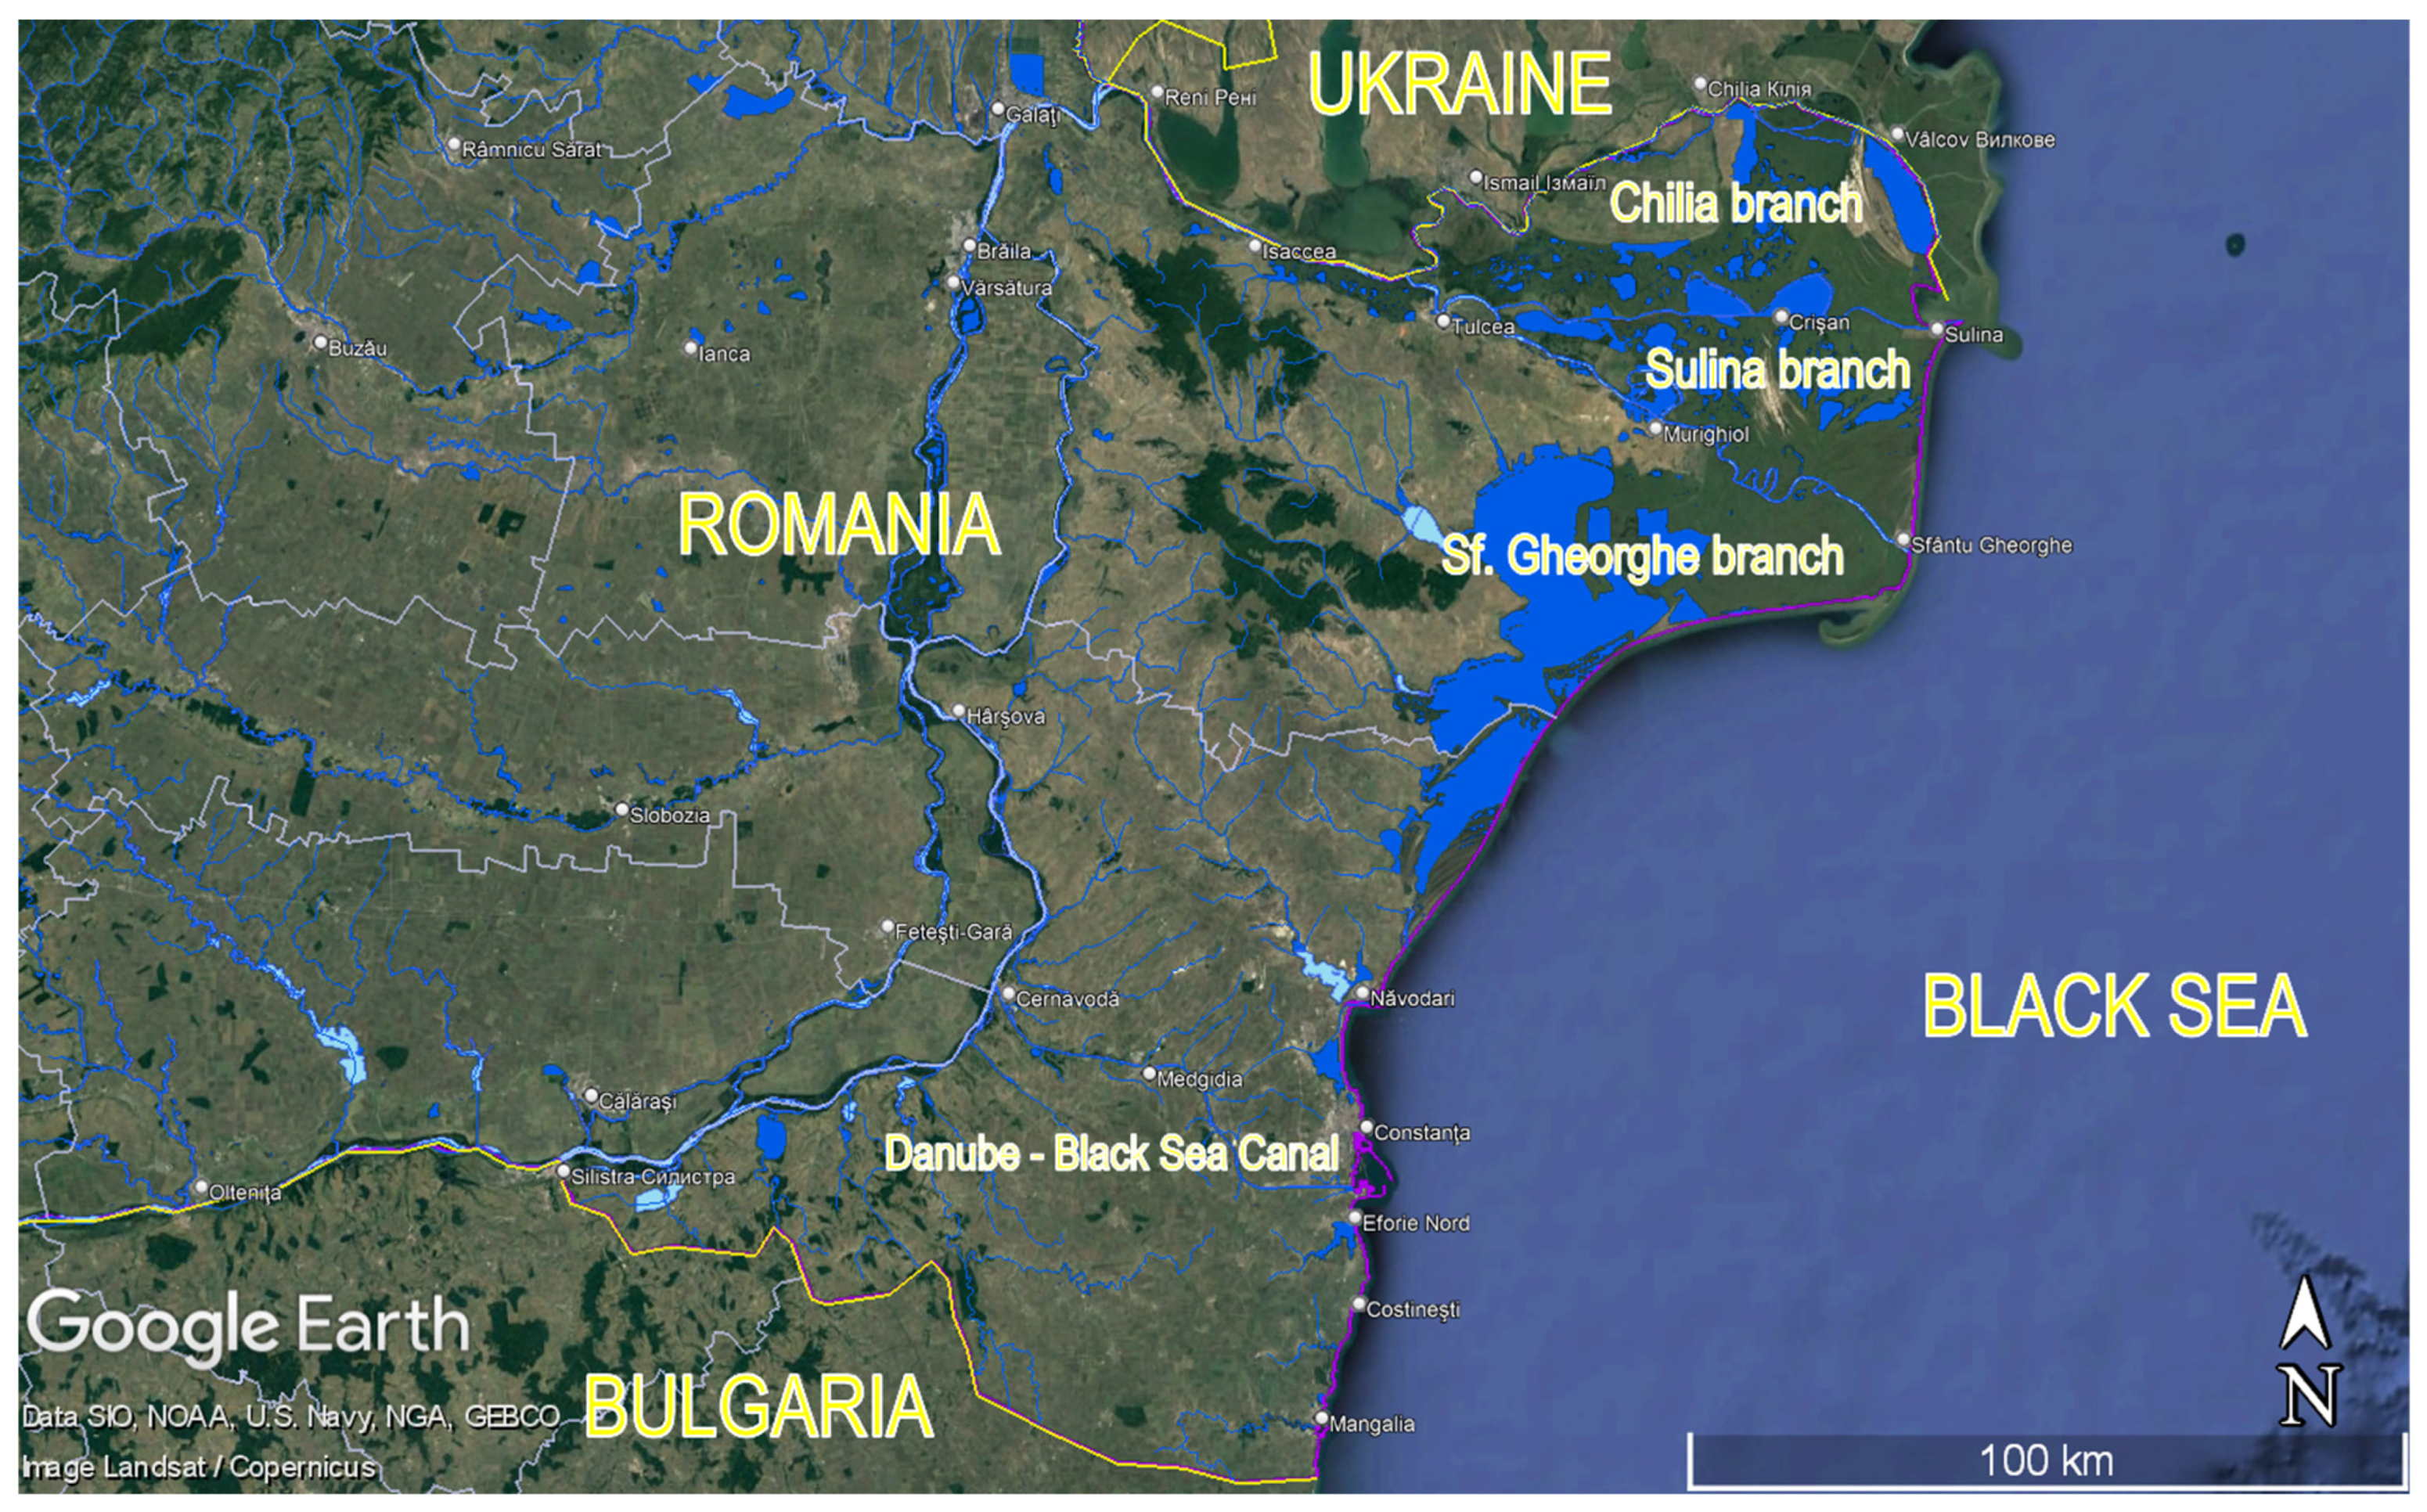
Table 3 presents the TP and AP for the main discharge pathways of the Danube River into the Black Sea. Sulina and Sf. Gheorghe branches have mouths on the Romanian coast to the Black Sea while the Chilia branch, also being a national border between Romania and Ukraine, has its main mouth on the Ukraine coast to the Black Sea.
The values in Table 3 were determined based on the Danube’s average flow-rate between 2014–2018 [50].
The Black Sea salinity near the Romanian coastline varies as a result of the freshwaters discharged by the Danube (Figure 8). In the northern region, influenced by the Chilia branch discharge, the salinity has values of around 6‰. The salinity increases towards 15‰ at Constanța and towards 20‰ at Vama Veche. For the estimation of TP, a salinity of around 10‰ was assumed. An increase in AP might be achieved by selecting a sea water extraction point to take advantage of the Black Sea stratification which may provide waters with higher salinities at depths greater than 120 m. Further assessment is needed to estimate if the increase in salinity will provide more AP than the supplemental power required for pumping water with higher salinity from greater depths.
The results of this present study may be useful for further research regarding public policies for the development of renewable energy. Furthermore, it provides a useful analysis in order to encourage future potential renewables energy investments in Romania.

5. Conclusions

“Blue Energy” is a promising renewable energy source for the future. If properly designed and adapted to the applied area, Pressure Retarded Osmosis (PRO), Reversed Electrodialysis (RED), and Capacitive Mixing (CAPMIX) represent sustainable energy technologies. By exploiting salinity gradients, the efficiency of the use of renewable natural resources increases, the environment is better preserved and protected, and the specific technologies keep a low-carbon footprint.
Although the potential of salinity gradient energy has been recognized for over half a century, its use has not been considered economically feasible at present.
Membrane fouling processes affect energy profitability, and the extent of this phenomenon depends on several factors, such as salinity levels, water’s ionic and organic constituents, biota, membrane types, cells geometry, exploitation regime, feed water pre-treatment steps, and so on. Stable technological configurations must be established through long-term testing under simulated in situ conditions.
Romania has significant potential for blue energy resources, both for large capacity installations (Danube River-Black Sea) and for smaller capacity devices located around saline lakes and salt deposits.
Romania’s potential for salinity gradient energy should be further explored, as it can provide a sustainable source of renewable energy. The development of this energy source could contribute to the country’s economic growth and reduce its dependence on fossil fuels. Additionally, the utilization of this resource can contribute to the EU’s blue growth and blue energy initiatives, especially in the Black Sea basin.
Further research and investment in salinity gradient energy technologies are needed to fully realize its potential in Romania. This can involve collaboration between government agencies, academic institutions, and private industry to develop efficient and cost-effective methods for energy production.

Author Contributions

Conceptualization, V.-M.R. and A.-A.I.; data collection, V.-M.R., A.-A.I., A.-M.V. and V.-E.A.; writing-original draft, V.-M.R., A.-A.I., A.-M.V. and V.-E.A.; writing—review and editing, V.-M.R., A.-A.I., A.-M.V., V.-E.A., G.D., A.-E.F. and V.-M.C. All authors have read and agreed to the published version of the manuscript.

Funding

This work was funded by the Geological Institute of Romania through the research project no. PN 23-39-02-02.

Data Availability Statement

The data presented in this study are available within the article. For the availability of detailed datasets, the corresponding authors can be contacted.

Conflicts of Interest

The authors declare no conflict of interest.

References

  1. Bilardi, S.; Calabrò, P.S.; Moraci, N. A Review of the Hydraulic Performance of Permeable Reactive Barriers Based on Granular Zero Valent Iron. Water 2023, 15, 200. [Google Scholar] [CrossRef]
  2. Shadman, M.; Roldan-Carvajal, M.; Pierart, F.G.; Haim, P.A.; Alonso, R.; Silva, C.; Osorio, A.F.; Almonacid, N.; Carreras, G.; Maali Amiri, M. A Review of Offshore Renewable Energy in South America: Current Status and Future Perspectives. Sustainability 2023, 15, 1740. [Google Scholar] [CrossRef]
  3. Wang, Z.; Wang, L.; Elimelech, M. Viability of Harvesting Salinity Gradient (Blue) Energy by Nanopore-Based Osmotic Power Generation. Engineering 2022, 9, 51–60. [Google Scholar] [CrossRef]
  4. Wu, Q.; Fang, Y.; Wang, X. Improvement in Operation Efficiency of Shallow Geothermal Energy System—A Case Study in Shandong Province, China. Water 2023, 15, 1409. [Google Scholar] [CrossRef]
  5. European Commission (2020). Communication from the Commission to the European Parliament, the European Council, the Council, the European economic and Social Committee and the Committee of the Regions: An EU Strategy to Harness the Potential of Offshore Renewable Energy for a Climate Neutral Future. Available online: https://eur-lex.europa.eu/legal-content/EN/TXT/PDF/?uri=CELEX:52020DC0741&from=EN (accessed on 24 March 2023).
  6. Altıok, E.; Kaya, T.Z.; Güler, E.; Kabay, N.; Bryjak, M. Performance of Reverse Electrodialysis System for Salinity Gradient Energy Generation by Using a Commercial Ion Exchange Membrane Pair with Homogeneous Bulk Structure. Water 2021, 13, 814. [Google Scholar] [CrossRef]
  7. Cîrstea, Ş.D.; Martiş, C.S.; Cîrstea, A.; Constantinescu-Dobra, A.; Fülöp, M.T. Current Situation and Future Perspectives of the Romanian Renewable Energy. Energies 2018, 11, 3289. [Google Scholar] [CrossRef]
  8. Turkenburg, W.C. World Energy Assessment: Energy and the Challenge of Sustainability; UNDP: New York, NY, USA, 2000; Chapter 7; p. 221. [Google Scholar]
  9. Alvarez-Silva, O.A.; Osorio, A.F.; Winter, C. Practical global salinity gradient energy potential. Renew. Sustain. Energy Rev. 2016, 60, 1387–1395. [Google Scholar] [CrossRef]
  10. Karthikeyan, C.; Jenita Rani, G.; Ng, F.L.; Periasamy, V.; Pappathi, M.; Rajan, M.J.; Al-Sehemi, A.G.; Pannipara, M.; Phang, S.-M.; Aziz, M.A.; et al. 3D Flower–Like FeWO4/CeO2 Hierarchical Architectures on rGO for Durable and High-Performance Microalgae Biophotovoltaic Fuel Cells. Appl. Biochem. Biotechnol. 2020, 192, 751–769. [Google Scholar] [CrossRef]
  11. Senthilkumar, N.; Sheet, S.; Sathishkumar, Y.; Lee, Y.S.; Phang, S.-M.; Periasamy, V.; Gnana Kumar, G. Titania/reduced graphene oxide composite nanofibers for the direct extraction of photosynthetic electrons from microalgae for biophotovoltaic cell applications. Appl. Phys. A 2018, 124, 769. [Google Scholar] [CrossRef]
  12. Karthikeyan, C.; Raj Kumar, T.; Pannipara, M.; Al-Sehemi, A.G.; Senthilkumar, N.; Angelaalincy, M.J.; Varalakshmi, P.; Phang, S.M.; Periasamy, V.; Gnana Kumar, G. Ruthenium oxide/tungsten oxide composite nanofibers as anode catalysts for the green energy generation of Chlorella vulgaris mediated biophotovoltaic cells. Environ. Prog. 2019, 38, e13262. [Google Scholar] [CrossRef]
  13. Micale, G.; Cipollina, A.; Tamburini, A. Chapter 1: Salinity gradient energy. In Sustainable Energy from Salinity Gradients; Elsevier B.V.: Amsterdam, The Netherlands, 2016; pp. 1–18. [Google Scholar]
  14. Zou, Z.; Liu, L.; Meng, S.; Bian, X. Comparative study on the performance of capacitive mixing under different operational modes. Energy Rep. 2022, 8, 7325–7335. [Google Scholar] [CrossRef]
  15. Simoes, C.; Vital, B.; Saakes, T.M.; Brilman, W. Scaled-up multistage reverse electrodialysis pilot study with natural waters. Chem. Eng. J. 2022, 450, 138412. [Google Scholar] [CrossRef]
  16. Jin, D.; Xi, R.; Xu, S.; Wang, P.; Wu, X. Numerical simulation of salinity gradient power generation using reverse electrodialysis. Desalination 2021, 512, 13. [Google Scholar] [CrossRef]
  17. Rahman, M.M. Membranes for Osmotic Power Generation by Reverse Electrodialysis. Membranes 2023, 13, 164. [Google Scholar] [CrossRef] [PubMed]
  18. Ju, J.; Choi, Y.; Lee, S.; Park, C.-g.; Hwang, T.; Jung, N. Comparison of Pretreatment Methods for Salinity Gradient Power Generation Using Reverse Electrodialysis (RED) Systems. Membranes 2022, 12, 372. [Google Scholar] [CrossRef] [PubMed]
  19. Mora, D.; de Rijck, A. Blue Energy: Salinity Gradient Power in Practice; Report No. GSDR 2015 Brief; Wageningen University and Research Centre: Wageningen, The Netherlands, 2009. [Google Scholar]
  20. Rai Khare, V.; Dubey, R. Blue Energy: Power from the Sea—A Review. In Proceedings of the Green Technology Jaipur Conference: National Conference of Green Technology by DST and ISTE, Jaipur, India, 28–29 March 2012. [Google Scholar]
  21. Matsuyama, K.; Makabe, R.; Ueyama, T.; Sakai, H.; Saito, K.; Okumura, T.; Hayashi, H.; Tanioka, A. Power generation system based on pressure retarded osmosis with a commercially-available hollow fiber PRO membrane module using seawater and freshwater. Desalination 2021, 499, 114805. [Google Scholar] [CrossRef]
  22. Obode, E.I.; Badreldin, A.; Adham, S.; Castier, M.; Abdel-Wahab, A. Techno-Economic Analysis towards Full-Scale Pressure Retarded Osmosis Plants. Energies 2023, 16, 325. [Google Scholar] [CrossRef]
  23. Straub, A.P.; Deshmukh, A.; Elimelech, M. Pressure-retarded osmosis for power generation from salinity gradients: Is it viable? Energy Environ. Sci. 2016, 9, 31–48. [Google Scholar] [CrossRef]
  24. Gonzales, R.R.; Abdel-Wahab, A.; Adham, S.; Suk Han, D.; Phuntsho, S.; Suwaileh, W.; Hilal, N.; Shon, H.K. Salinity gradient energy generation by pressure retarded osmosis: A review. Desalination 2021, 500, 114841. [Google Scholar] [CrossRef]
  25. Radu, V.M.; Boaja, I.P.; Ivanov, A.A.; Dinca, G.; Szabo, R. Forthcoming Opportunities for Obtaining Energy from New Renewable Sources in Romania. In Renewable Energy Systems in Smart Grid. Lecture Notes in Electrical Engineering; Kolhe, M.L., Ed.; Springer: Singapore, 2022; p. 938. [Google Scholar] [CrossRef]
  26. Abbasi-Garravand, E.; Mulligan, C.N. Feasibility of Pressure-Retarded Osmosis for Electricity Generation at Low Temperatures. Membranes 2021, 11, 556. [Google Scholar] [CrossRef]
  27. Han, G.; Feng, Y. Recent Development of Pressure Retarded Osmosis (PRO) Hollow Fiber Membranes; Chapter 22—Hollow Fiber Membranes; Chung, T.-S., Feng, Y., Eds.; Elsevier: Amsterdam, The Netherlands, 2021; pp. 473–493. [Google Scholar] [CrossRef]
  28. Nur Hidayati, O.; Nalan, K.; Enver, G. Principles of reverse electrodialysis and development of integrated-based system for power generation and water treatment: A review. Rev. Chem. Eng. 2022, 38, 921–958. [Google Scholar] [CrossRef]
  29. Mei, Y.; Tang, C.Y. Recent developments and future perspectives of reverse electrodialysis technology: A review. Desalination 2018, 425, 156–174. [Google Scholar] [CrossRef]
  30. Veerman, J.; Vermaas, D.A. Sustainable Energy from Salinity Gradients. In Chapter 4—Reverse Electrodialysis: Fundamentals; Woodhead Publishing: Sawston, UK, 2016; pp. 77–133. [Google Scholar]
  31. Iglesias, G.R.; Fernández, M.M.; Ahualli, S.; Jiménez, M.L.; Kozynchenko, O.P.; Delgado, Á.V. Materials selection for optimum energy production by double layer expansion methods. J. Power Sources 2014, 261, 371–377. [Google Scholar] [CrossRef]
  32. Rica, R.A.; Brogioli, D.; Ziano, R.; Salerno, D.; Mantegazza, F. Ions Transport and Adsorption Mechanisms in Porous Electrodes During Capacitive-Mixing Double Layer Expansion (CDLE). J. Phys. Chem. C 2012, 116, 16934–16938. [Google Scholar] [CrossRef]
  33. Brogioli, D.; Zhao, R.; Biesheuvel, P.M. A prototype cell for extracting energy from a water salinity difference by means of double layer expansion in nanoporous carbon electrodes. Energy Environ. Sci. 2011, 4, 772–777. [Google Scholar] [CrossRef]
  34. Sales, B.B.; Burheim, O.S.; Liu, F.; Schaetzle, O.; Buisman, C.J.N.; Hamelers, H.V.M. Impact of Wire Geometry in Energy Extraction from Salinity Differences Using Capacitive Technology. Environ. Sci. Technol. 2012, 46, 12203–12208. [Google Scholar] [CrossRef]
  35. La Mantia, F.; Pasta, M.; Deshazer, H.D.; Logan, B.E.; Cui, Y. Batteries for efficient energy extraction from a water salinity difference. Nano Lett. 2011, 11, 1810–1813. [Google Scholar] [CrossRef] [PubMed]
  36. Tehrani, H.M.H.; Seyedsadjadi, S.A.; Ghaffarinejad, A. Application of electrodeposited cobalt hexacyanoferrate film to extract energy from water salinity gradients. RSC Adv. 2015, 5, 30032–30037. [Google Scholar] [CrossRef]
  37. Ye, M.; Pasta, M.; Xie, X.; Dubrawski, K.L.; Xu, J.; Liu, C.; Cui, Y.; Criddle, C.S. Charge-Free Mixing Entropy Battery Enabled by Low-Cost Electrode Materials. ACS Omega 2019, 4, 11785–11790. [Google Scholar] [CrossRef]
  38. Statkraft Osmotic Power Plant. Available online: https://www.power-technology.com/projects/statkraft-osmotic/ (accessed on 6 April 2023).
  39. Kurihara, M.; Takeuchi, H. SWRO-PRO System in “Mega-ton Water System” for Energy Reduction and Low Environmental Impact. Water 2018, 10, 48. [Google Scholar] [CrossRef]
  40. Fujifilm Starts Production Line for Blue Energy Membranes in Tilburg, the Netherlands. Available online: https://www.dutchwatersector.com/news/fujifilm-starts-production-line-for-blue-energy-membranes-in-tilburg-the-netherlands/ (accessed on 6 April 2023).
  41. Abad Castelos, M. The Black Sea and Blue Energy: Challenges, Opportunities and the Role of the European Union. In The Future of the Law of the Sea; Andreone, G., Ed.; Springer: Cham, Switzerland, 2017. [Google Scholar]
  42. Gâștescu, P. Lacurile din Republica Populară Romînă. Geneză și Regim Hidrologic; Editura Academiei Republicii Populare Romîne: București, Romania, 1963. [Google Scholar]
  43. Gâștescu, P. Lacurile din România. Limnologie Regională; Editura Academiei Republicii Socialiste România: București, Romania, 1971. [Google Scholar]
  44. Pricăjan, A. Apele Minerale și Termale din România; Editura Tehnică: București, Romania, 1972. [Google Scholar]
  45. Bulgăreanu, V.-A.; Godeanu, D.; Izvoranu, V. New Data regarding the lake Sărătura 3 in Independeța (Murighiol), Tulcea county, Romania. Rev. Roum. Biol.-Biol. Végét. 1989, 34, 51–56. [Google Scholar]
  46. Bulgăreanu, V.-A.; Călinescu, E.; Cehlarov, A.; Cușmirenco, G.; Enache, G.; Opriș, E.; Prodănescu, I.; Rădan, S.; Urcan, T. Limnology and peloidogenesis evolution of “chot”—Type lake Sărătura 1—Murighiol (Independența village, Tulcea county, Romania). Rev. Roum. Géol., Géophys. Géogr. Geologie 1990, 34, 83–94. [Google Scholar]
  47. Momeu, L.; Cîmpean, M.; Battes, K. Hidrobiologie; Presa Universitară Clujeană: Cluj, Romania, 2018. [Google Scholar]
  48. Map View. Available online: https://earth.google.com/web/search/Lakes+of+Ocna+Sibiului (accessed on 3 April 2023).
  49. Papapetrou, M.; Kumpavat, K. 10—Environmental Aspects and Economics of Salinity Gradient Power (SGP) Processes. In Sustainable Energy from Salinity Gradients; Cipollina, A., Micale, M., Eds.; Woodhead Publishing Series in Energy: Sawston, UK, 2016; pp. 315–335. [Google Scholar] [CrossRef]
  50. Romanian Waters National Administration. Hydrographic Basin Management Plan 2023—Annex 6.1.2.E. The Updated National Management Plan 2021 Related to the Portion of the International River Basin of the Danube River that is Included in the Territory of Romania. Available online: https://rowater.ro/despre-noi/descrierea-activitatii/managementul-european-integrat-resurse-de-apa/planurile-de-management-ale-bazinelor-hidrografice/planuri-de-management-nationale/ (accessed on 11 May 2023).
  51. Map View. Available online: https://earth.google.com/web/@44.63230635,28.61319476,128.55605331a,336879.05068047d,35y,0h,0t,0r (accessed on 11 May 2023).
Figure 1. PRO system using seawater, river water and sewage-treated water, modified after [21].
Water 15 02063 g001
Figure 2. Schematic diagram of the RED system, modified after [28].
Water 15 02063 g002
Figure 3. Operating cycles for CapMix under three scenarios in respect to voltage versus charge, where the 1–4 numbers represent the four cycles of the CapMix process.
Water 15 02063 g003
Figure 4. Operating four-step cycle for a CDLE-CapMix cell. The arrows from the external circuit depict the electrons flow directions, modified after [14].
Water 15 02063 g004
Figure 5. Operating two-step cycle for a CDP-CapMix cell, modified after [14].
Water 15 02063 g005
Figure 6. Lakes with brackish, saline and hypersaline waters in Romania marked on a simplified map of geomorphological types.
Water 15 02063 g006
Figure 7. Balneology use for the hypersaline lakes at Ocna Sibiului [48].
Water 15 02063 g007
Figure 8. Danube River discharge toward the Black Sea [51].
Water 15 02063 g008
Table 1. Types of techniques for converting renewable sources into energy [8,9].
Energy TypeSourceTechnologyEnergy ProductApplication
Bioenergywaste and biomassCombustionHeat (cooking, space heating)
Process heat, steam, electricity
Widely applied
Gasification/power productionElectricity, heat (CHP).Demonstration phase
Gasification/fuel productionHydrocarbons, methanol, H2Development phase
Hydrolysis and fermentationEthanolCommercially applied; under development
Pyrolysis/production of liquid fuelsBio-oilsPilot phase; some technical barriers
Pyrolysis/production of solid fuelsCharcoalWidely applied
ExtractionBiodieselApplied, expensive
DigestionBiogasCommercially applied
SolarsunPhotovoltaic solar energy conversionElectricityWidely applied; rather expensive;
Solar thermal electricityHeat, steam, electricityDemonstrated;
Low-temperature solar energy useHeat (water and space heating, cooking, drying) and coldCommercially applied and demonstrated
Passive solar energy useHeat, cold, light, ventilationDemonstrations and applications;
Artificial photosynthesisH2 or hydrogen rich fuelsFundamental and applied research
WindwindWater pumping and battery chargingMovement, powerSmall wind machines, widely applied
Onshore wind turbinesElectricityWidely applied commercially
Offshore wind turbinesElectricityDevelopment and demonstration phase
HydropowerwaterHydro plants and damsPower, electricityCommercially applied
GeothermalearthGeothermal and head pumpsHeat, steam, electricityCommercially applied
Marinewaves, tides, salinity, currentsTidal energyElectricityApplied, expensive
Wave energyElectricityResearch, development, and demonstration phase
Current energyElectricityResearch and development phase
Ocean thermal energy conversionHeat, electricityResearch, development, and demonstration phase
Salinity gradient/osmotic energyElectricityTheoretical option
Marine biomass productionFuelsResearch and development phase
Table 2. Hydro-chemical data of some brackish, salt and hypersaline Romanian lakes [42,43,44].
Lake NameCountyArea (km2)Depth (m)Conc. (g/L)YearWater Class TypeCation GroupOrigin
CăldărușaniIlfov2.244.00.521956bicarbonaticNafluviatile liman
Balta MaiaIalomița0.2-0.701954bicarbonaticCafluviatile liman
FundataIalomița5-12.641956sulfaticNafluviatile liman
RevigaIalomița--5.731956bicarbonaticNafluviatile liman
SchiaucaIalomița1.0-5.731956chloridicNafluviatile liman
Amara-SloboziaIalomița1.323.020.061956chloridicNafluviatile liman
Iezer-IalomițaIalomița1.42-2.071956chloridicNafluviatile liman
StrachinaIalomița5.64-9.151957chloridicNafluviatile liman
Balta AmaraBuzău6.98-7.931957 Nafluviatile liman
Balta AlbăBuzău10.68-1.071957bicarbonaticNafluviatile liman
Balta JirlăuBrăila10.68-3.111956bicarbonaticNafluviatile liman
Cîineni (Sărat)Brăila0.56-29.251957chloridicNafluviatile liman
BatoguBrăila1.31 *-59.131957chloridicNakarsto-klastic
ChioibășeștiBrăila1.18 *-9.04 sulfaticNakarsto-klastic
PlașcuBrăila1.88-8.58 sulfaticNakarsto-klastic
TătaruBrăila3.28-12.50 sulfaticNakarsto-klastic
IancaBrăila3.32-34.46 chloridicNakarsto-klastic
PlopulBrăila1.80-18.89 chloridicNakarsto-klastic
Movila MiresiiBrăila1.80-137.97 chloridicNakarsto-klastic
Lutu AlbBrăila3.1
3.45 *
-21.58 chloridicNakarsto-klastic
Lacul Sărat-BrăilaBrăila1.72-83.961956sulfaticNakarsto-klastic
Balta Filipești-TârgPrahova0.02 *-0.721955bicarbonaticCafloodplain lake
Balta TălăbascaGalați1.44-0.821953bicarbonaticCafloodplain lake
Balta MălinaGalați0.8 *-0.721953bicarbonaticCafloodplain lake
Balta CătușaGalați0.42 *-0.611953bicarbonaticCafloodplain lake
ViișoaraBotoșani0.55 *-17.601956chloridicNapond
Balta SuhaiaTeleorman31.20-0.92 bicarbonaticNafloodplain lake
BabadagTulcea22.52-1.761957chloridicNafluviatile-maritime liman
Razelm (at Sarinasuf)Tulcea393.303.01.031956chloridicNasea lagoon
Razelm (at Jurilovca)Tulcea2.521957chloridicNa
Duingi (Histria)Tulcea3.76 *-36.991954chloridicNasea lagoon
TăbăcărieiConstanța1.10-0.801957bicarbonaticNasea lagoon
SiutghiolConstanța21.0518.00.751957bicarbonaticNasea lagoon
TașaulConstanța18.305.61.851957chloridicNafluviatile-maritime liman
Gargalîc (Corbu)Constanța3.10-2.971957chloridicNafluviatile-maritime liman
TechirghiolConstanța10.689.095.521953chloridicNafluviatile-maritime liman
MangaliaConstanța2.6-1.291949chloridicNafluviatile-maritime liman
Lacu Sărat Ocnele MariVâlcea0.02 *-262.131954chloridicNakarsto-saline
Stelei-ȚinteaPrahova0.005 *-79.111955chloridicNakarsto-saline
Sărat-TelegaPrahova0.004 * for all-117.731955chloridicNakarsto-saline
Ursu-SovataMureș0.03818.9256.701953chloridicNakarsto-saline
Aluniș-SovataMureș0.0037.477.761954chloridicNakarsto-saline
Șerpilor-SovataMureș--232.651954chloridicNakarsto-saline
Roșu-SovataMureș0.0012.5233.821954chloridicNakarsto-saline
Ocnița-Ocna SibiuluiSibiu--230.191953chloridicNakarsto-saline
Roman-TurdaCluj-777.781951chloridicNakarsto-saline
GeacaCluj0.55 Cătina
1.63 Țaga
2.89 Cătina
3.00 Țaga
0.72
Geaca
1953bicarbonaticCapond
Zaul-de-CîmpieMureș1.171.951.781955bicarbonaticCapond
Iazul PaharniculIașiPresently dried-0.911959bicarbonaticCapond
ȘtiucilorCluj0.8012.01.021958bicarbonaticCapond
Sărăturile I (Murighiol)Tulcea0.22.6036.111960chloridicNamixed **
Sărăturile II (Murighiol)Tulcea- 28.411960chloridicNamixed **
Sărat-GreciTulceaPresently dried-3.031960chloridicNafluviatile liman
TătlăgeacConstanța0.84-0.791960chloridicMgfluviatile-maritime liman
Note(s): * measured on Google Earth; ** mixed: karsto-klastic, floodplain lake and by aeolian damming processes [45,46].
Table 3. The TP and AP for the main discharge pathways of the Danube River into the Black Sea.
River PathwayAverage Flow (m3·s−1)TP (MW)AP (MW)
Danube—upstream branching into its Delta59003100100
Chilia Branch3000160050
Sf. Gheorghe Branch180095030
Sulina Branch120065020
Disclaimer/Publisher’s Note: The statements, opinions and data contained in all publications are solely those of the individual author(s) and contributor(s) and not of MDPI and/or the editor(s). MDPI and/or the editor(s) disclaim responsibility for any injury to people or property resulting from any ideas, methods, instructions or products referred to in the content.