Article

Influence of Natural Barriers on Small Rivers for Changes in Water Quality Parameters

Department of Environmental Engineering and Geodesy, University of Life Sciences in Lublin, Leszczyńskiego 7, 20-069 Lublin, Poland
*
Author to whom correspondence should be addressed.
Water 2023, 15(11), 2065; https://doi.org/10.3390/w15112065
Submission received: 3 April 2023 / Revised: 26 May 2023 / Accepted: 27 May 2023 / Published: 29 May 2023
(This article belongs to the Special Issue Monitoring of Freshwater Biodiversity and Water Quality)

Abstract

:
The occurrence of the protected species Castor fiber L., which creates a network of natural barriers for its own needs, may affect the changes in water quality parameters. This study shows changes in the water quality parameters (EC, BOD5, COD, TN, N-NH4, N-NO3, N-NO2, TP, P-PO4, Cl, SO42−) of small rivers in eastern Poland. The results were analysed using the one-way and three-way ANOVA Tukey’s HSD post hoc test to identify the significance of the changes in the water quality parameters for habitats, seasons, and land use. All parameters, with the exception of P-PO4, met the standards of a good ecological status. The average values of P-PO4 exceeded the threshold of the good ecological status in summer and meadows. The average annual changes in the water quality parameters, with the exception of N-NH4, are characterised by a decrease in pollution. The highest concentration decrease of 57% was found for P-PO4 and 45% for TP at the sites after the barriers. The lowest concentration decrease of 5% was found for EC. In the case of N-NH4, the concentration increase was 33%. The situation was completely different in the case of removing barriers, where an increase in the concentration of pollutants of about 30% was found. Changes in the water quality were significantly influenced by the season and land use. Due to the various construction, age, and removal of the barriers, beaver habitats may positively or negatively impact the water quality. It is crucial for the improvement of the water quality to ensure the durability of the functioning of barriers and the proper use of the land.

1. Introduction

Water is one of the basic factors determining the existence and functioning of organisms on Earth. Earth is called the blue planet because 71% of its surface is covered by water. However, only 2.5% is fresh water that can be used for economic purposes by humans. Water resources accumulated in rivers and lakes amount to only 93,100 km3. Nevertheless, rivers and lakes are the main sources of water that humans use [1,2].
Water can be used by humans for a variety of economic needs and ecosystem services. Water is mostly used for drinking, irrigation, and fish farming. The poor quality of water, i.e., its pollution by compounds of various origins, makes it difficult and sometimes impossible to use water resources. Poor water quality also affects the occurrence of changes in the water environment and the environment dependent on water conditions, ultimately worsening the quality of life and human health [3]. One of the greatest threats to surface waters is often unregulated wastewater management, breakdowns of wastewater treatment plants, and flood and surface runoff [4]. The resources and quality of surface water are affected by both natural and anthropogenic factors. Particular importance is attached to land use and land cover [5]. In addition to the industrial and agricultural development of the catchment area, changes in the quality of surface waters are also affected by changes in air temperature, total daily precipitation, and water levels. All of these factors result from climate change and global warming in a broad sense [6].
Due to the small water flows that cause small dilutions of pollutants, rivers in Poland are threatened by the ongoing eutrophication processes. There is a need to assess and monitor the quality of the surface waters in order to protect them against pollution [7]. Apart from passive water quality monitoring, looking for natural ways to improve water quality is very important. In recent years, particular attention has been paid to European beavers’ impact on water economy changes. In the Middle Ages, Castor fiber L. was present throughout the country, and at the beginning of the 20th century in Poland, this species was considered endangered [8]. In the 1980s, its reintroduction began, and Europe’s population of beavers is now about 1.5 million, and about 130,000 in Poland [9,10].
As keystone species, European beavers affect changes in the biodiversity of the areas inhabited by them [11]. Through the initiated biotic and abiotic processes, Castor fiber L. changes the quality of water and the circulation of nutrients and chemicals. Beaver dams also cause changes in the water flow regime in rivers, contribute to increased retention, and affect changes in the amount of sediment [12]. Beaver activity can have both positive and negative effects on changes in the water quality. This is due to many natural factors, such as the seasonality of precipitation and temperatures, the shape of the catchment area, and disturbances in the watercourse flow [13]. Watershed scale studies in South Africa comparing regions with high and low reservoir densities have shown that small dams’ high densities significantly reduce overall water quality [14]. However, research conducted in England showed that beaver ponds contributed to the improvement of water quality by reducing sediment N and P [15]. Still other conclusions result from studies conducted in Germany, where the improvement of water quality as a result of the reclamation of wetlands was small [16]. The lack of unequivocal conclusions from our research results from the different construction of beaver dams and their destruction by people. Removing the dam results in releasing pollutants accumulated in the bottom sediments [12,17,18].
This study aims to assess changes in the quality of surface waters in small lowland rivers in protected areas. The research was carried out in relation to the occurrence of a protected species causing changes in the flow of water due to the construction of natural dams on rivers. A comparative assessment of changes in the water quality parameters of Tyśmienica and Piwonia rivers in Poleski National Park was carried out. The BACI (Before-After-Contol-Impact) project was used to analyse the impact of natural barriers on water quality. The BACI project is often used to monitor the success of renovations. The difficulty in evaluating success may result from the lack of relevant data or the inappropriate location of monitoring stations downstream [19,20]. Determining the impact of the activity of a protected species on changes in the quality of surface waters may be important in terms of planning a strategy to reduce the spread of pollutants in connection with their surface runoff from the catchment area, as well as in the development of plans for natural water protection.

2. Materials and Methods
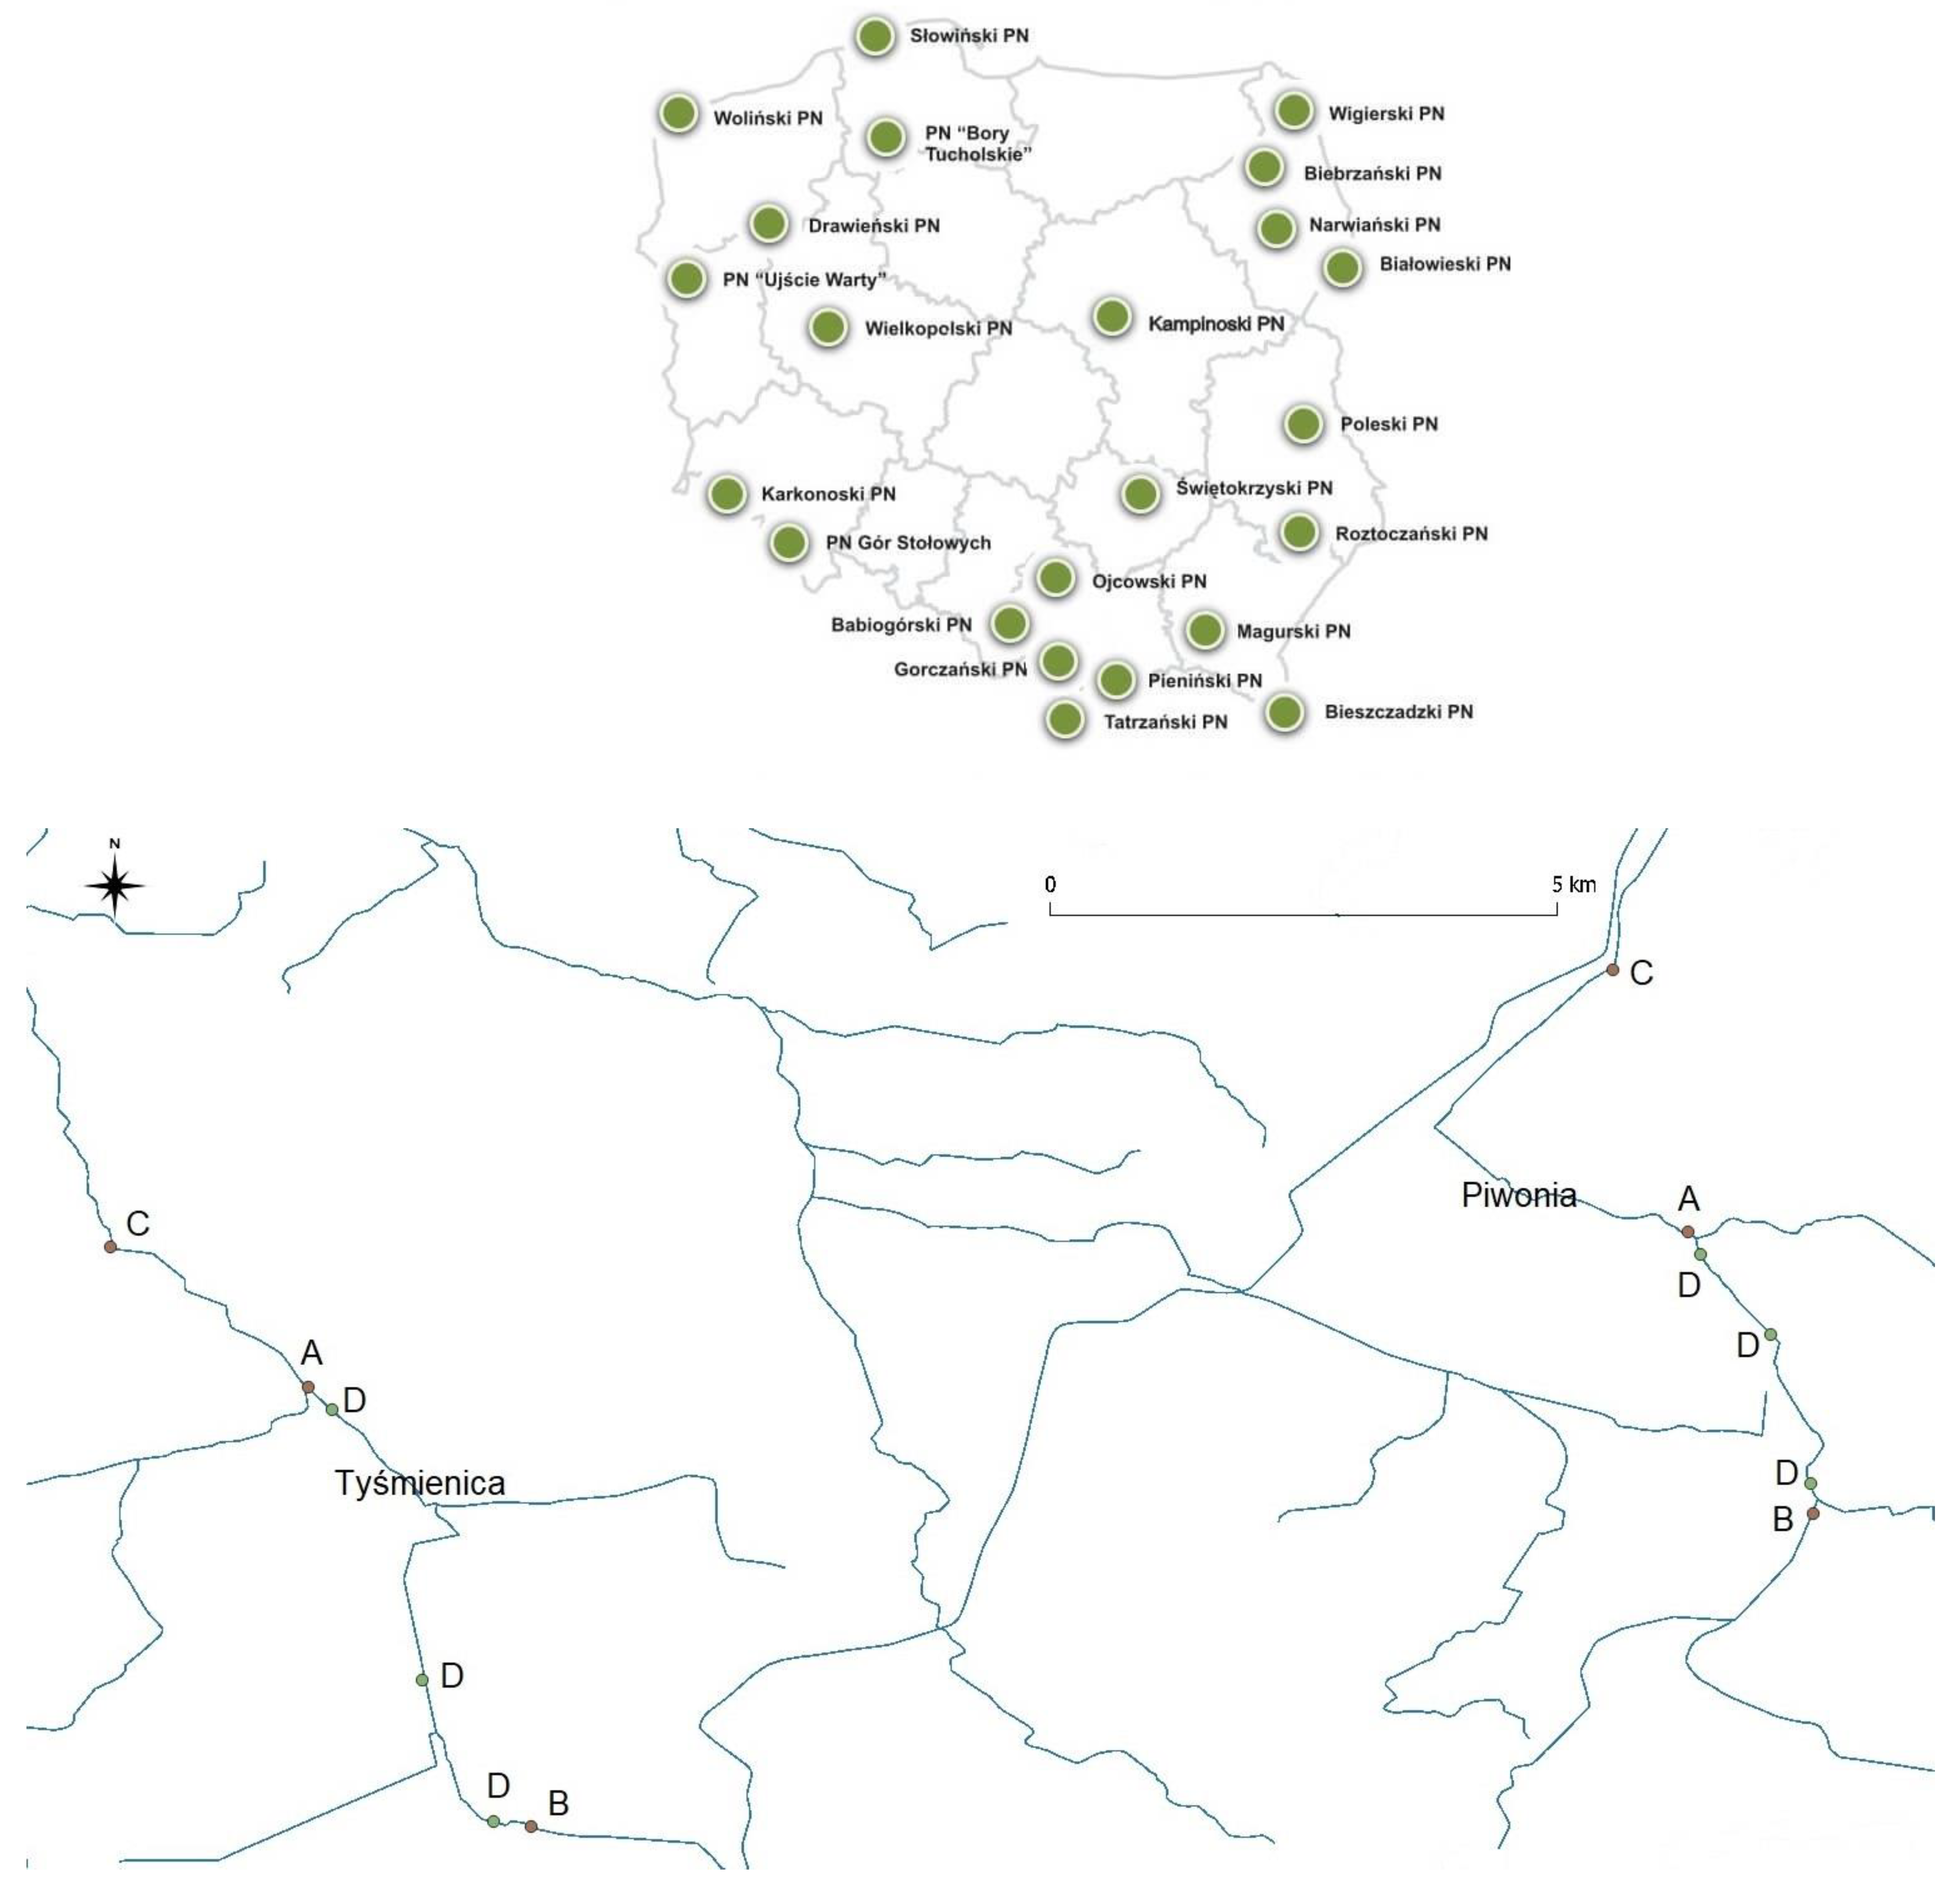
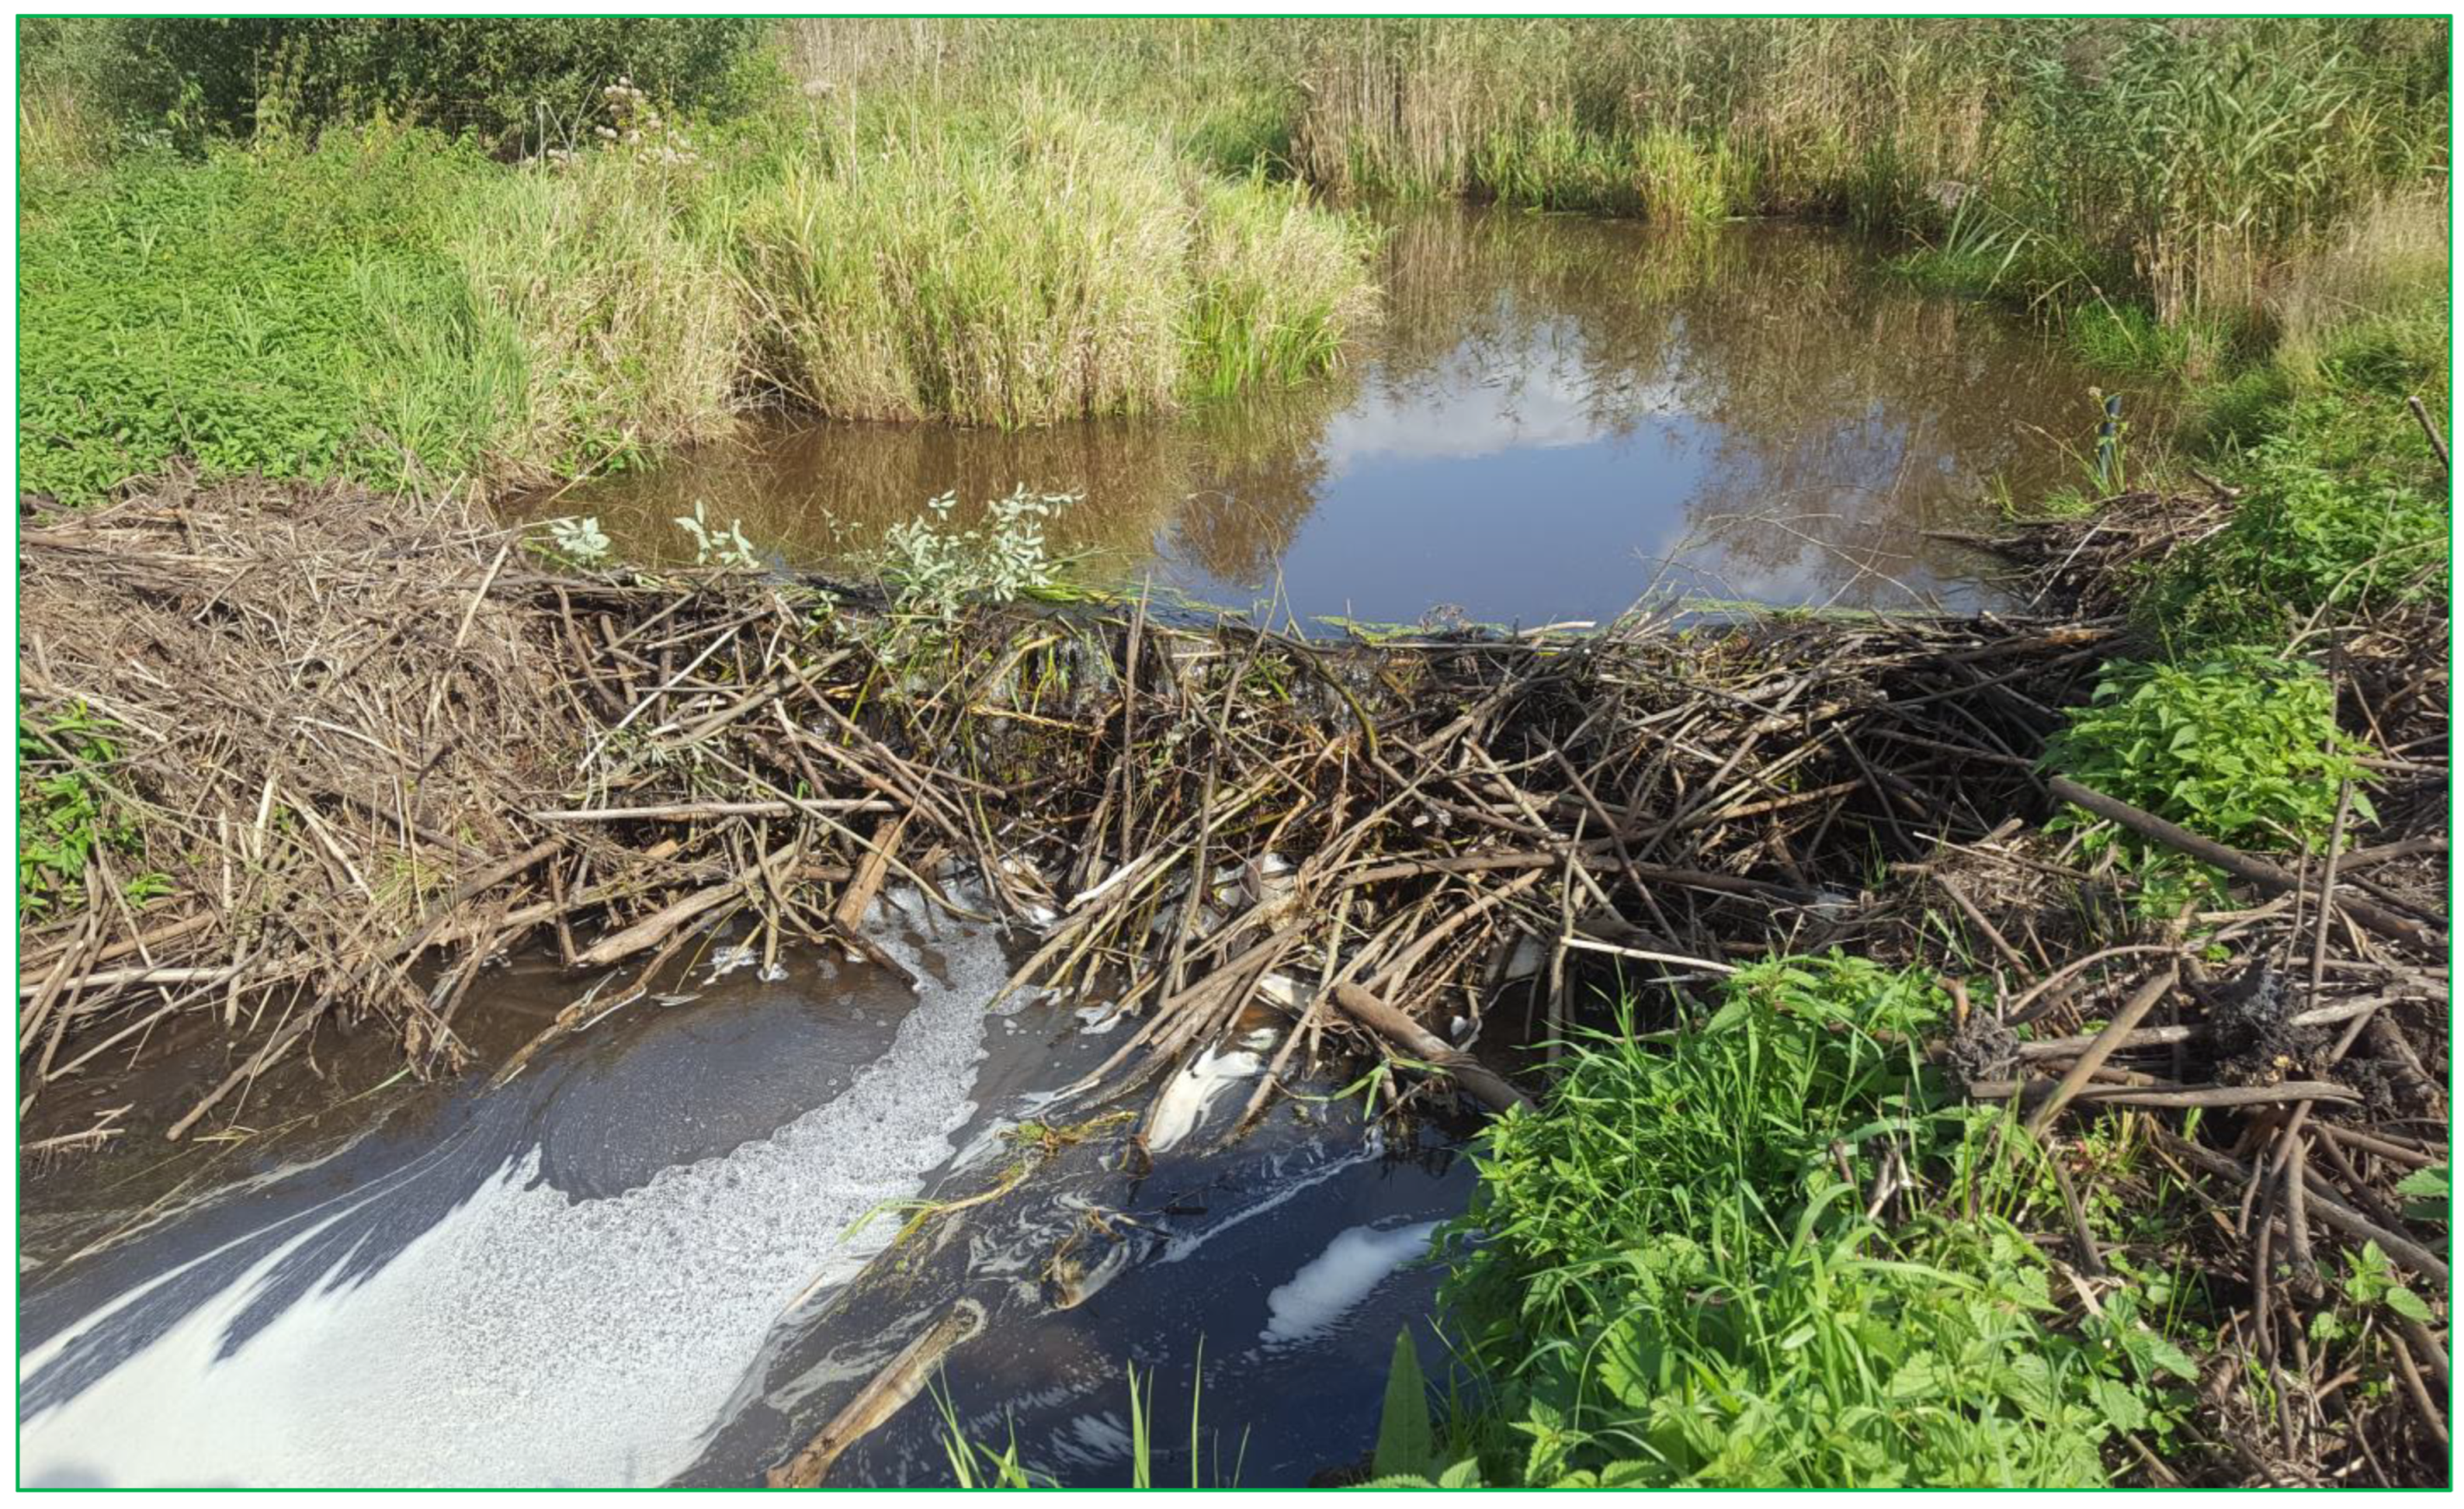
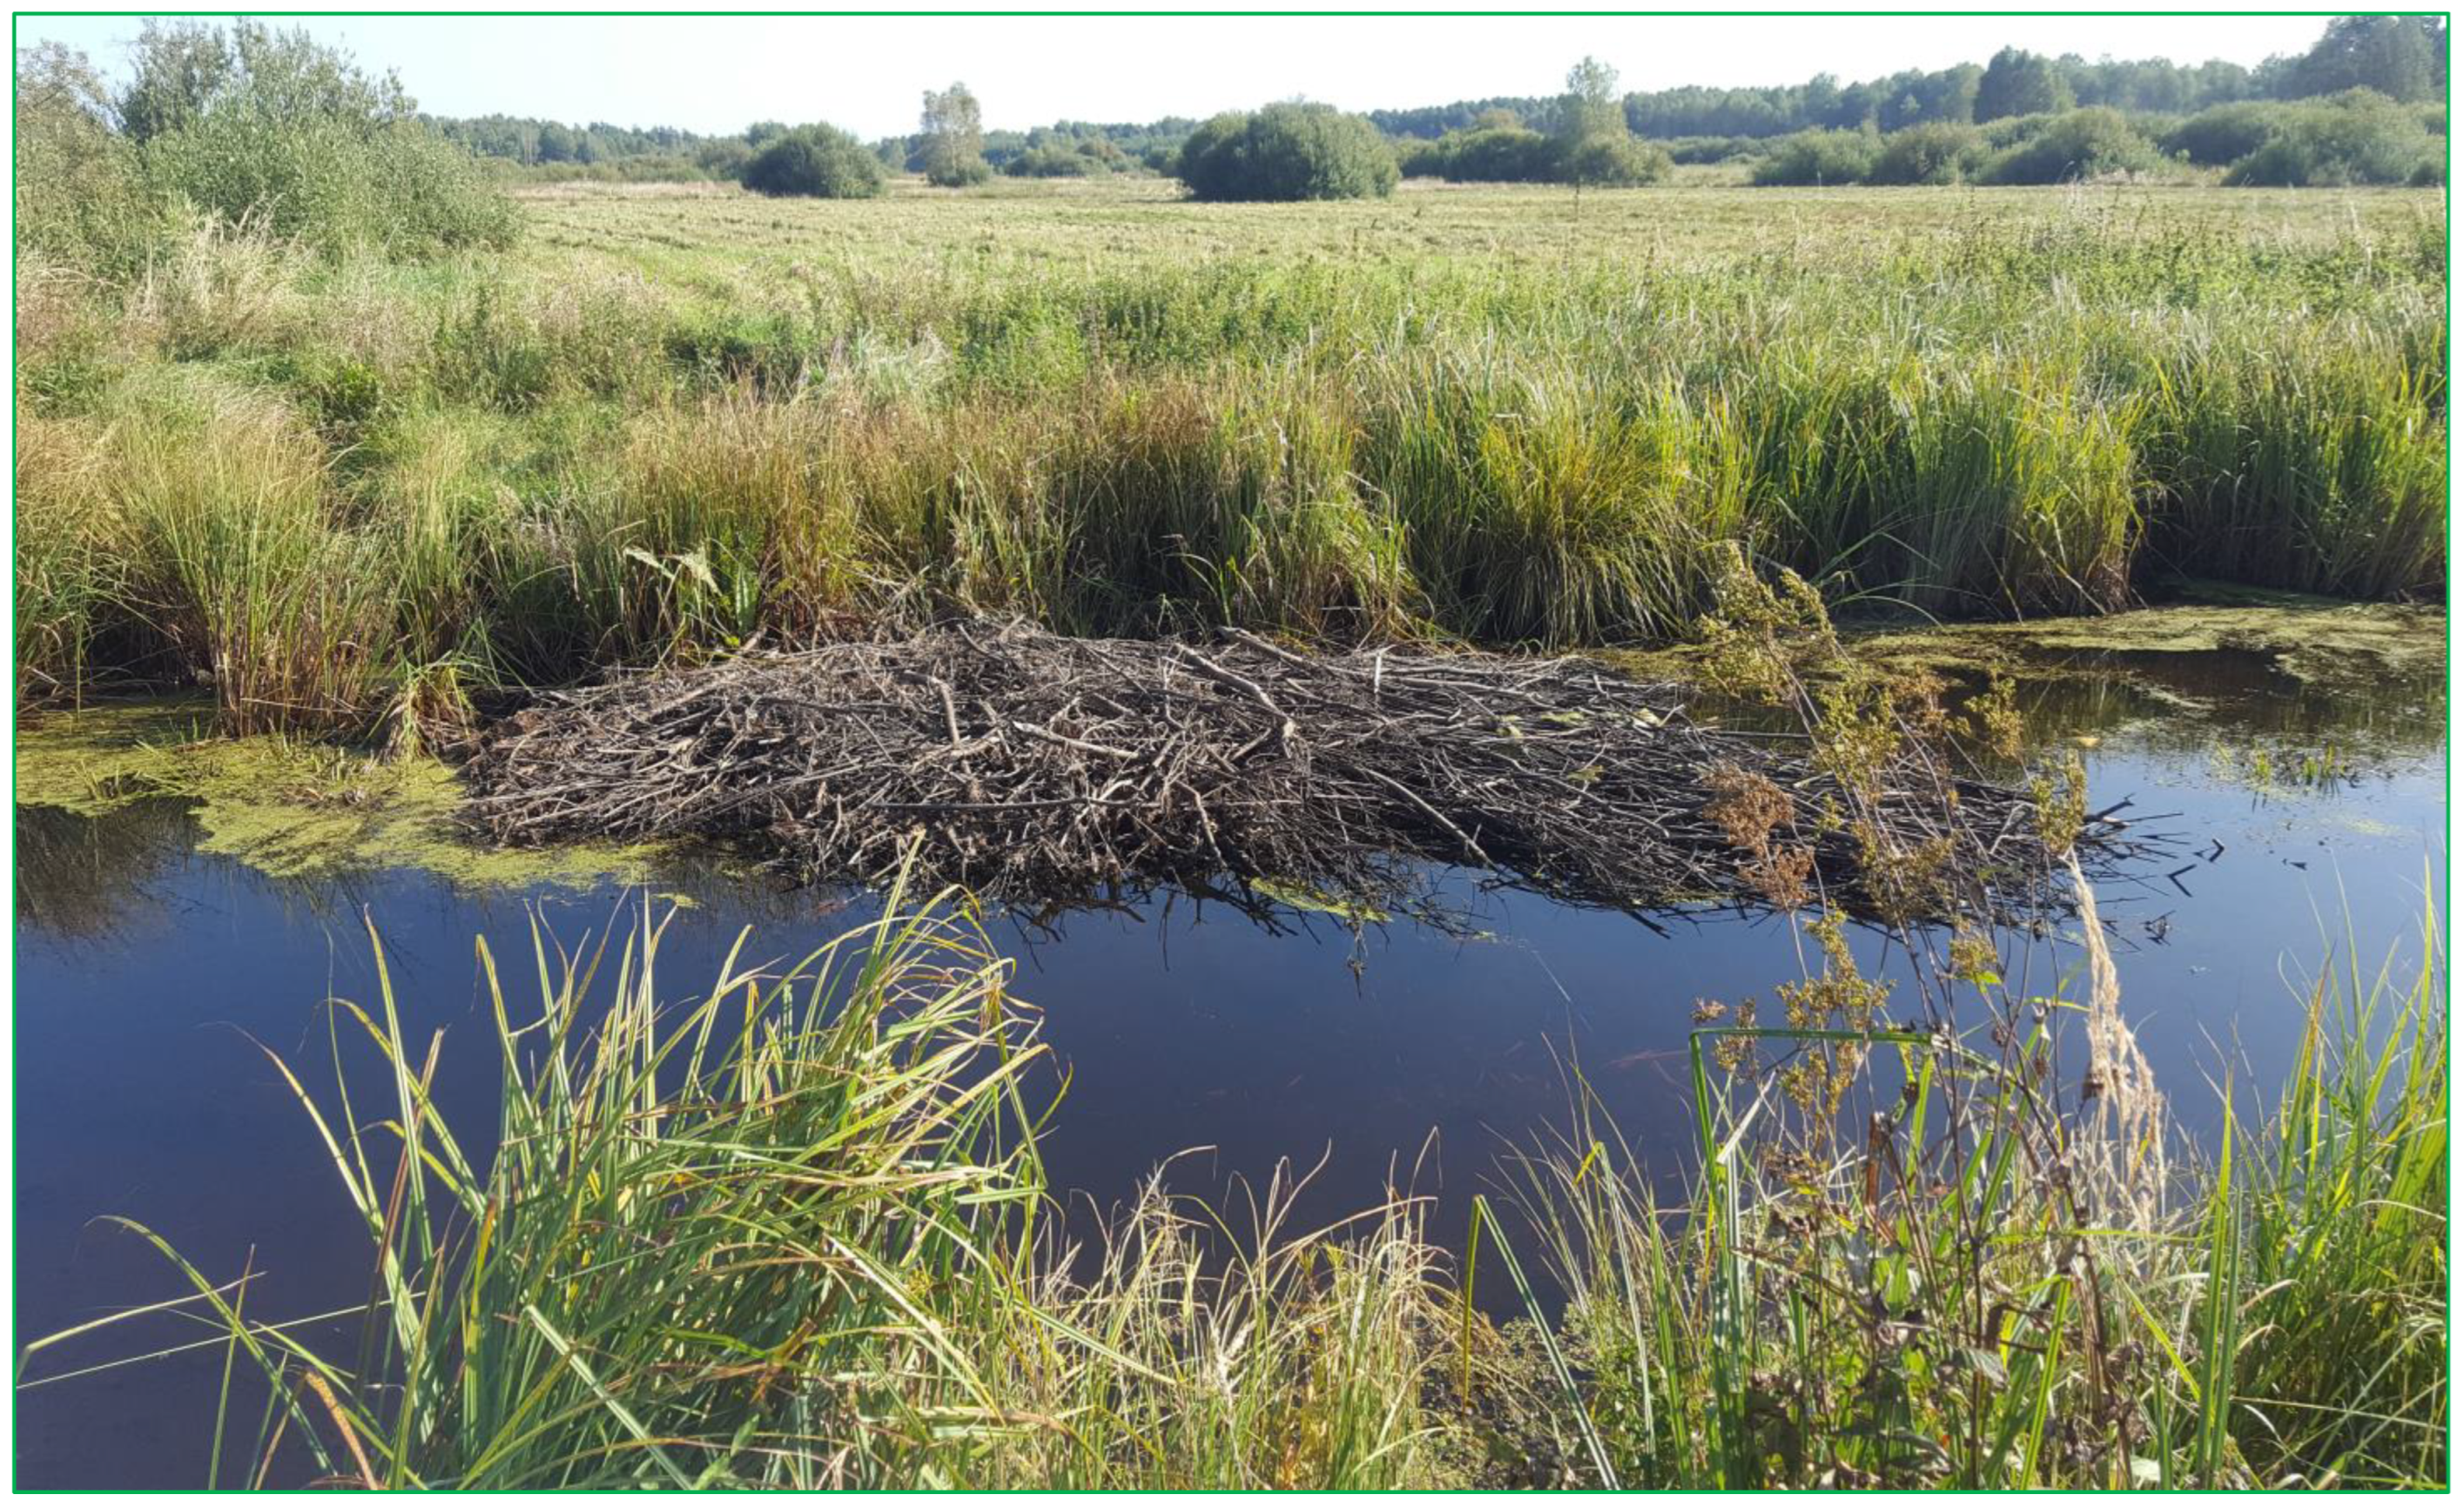
2.1. Study Area

The research was carried out in areas with a similar intensity of use but different types of land use (forests, meadows, scrub). The study area is in Poleski National Park, part of the Western Polesie Biosphere Reserve. The park is located in the western part of Polesie in eastern Poland. The park’s area is plain and heavily swampy, where the processes of river valley formation have not yet been marked. Its surface is flat, with many karst lakes, ponds, marshes, and peat land. Almost the entire area of the park is occupied by peat plains. The park’s vegetation is rich and abounds with species typical of wetlands and marshes. There are about a thousand species of vascular plants in the park, of which 170 are rare, 81 are under species protection, and another 15 are in the Polish Red Book of Plants. Most plant species are representatives of the northern flora, among which there are often relics of the ice age. The Poleski National Park is one of the richest areas in the country in terms of birds. About 200 species of birds have been found there, of which 148 are breeding species. In 1990, Grus grus became the park’s symbol [21,22]. In the PNP, the dominant type of ecosystem is meadow areas where the watercourses are the habitat of the European beaver. Selected research points were located in the Tyśmienica and Piwonia river heads (Figure 1). The studied rivers were characterised by a small catchment area (below 50 km2), the width of the river path (2–4 m), and a similar water level (20–60 cm). The average flow on the tested sections is 0.25 m3·s−1. A detailed hydromorphological characterisation was presented in an earlier paper [9]. A transitional climate with high seasonal variability characterises the study area. The average air temperature in January is −4 °C; in July, it reaches an average of 21 °C. The total annual precipitation is 600 mm, of which the highest monthly value is in July (average 90 mm) and the lowest monthly average is in January (average 25 mm).

2.2. Sample Collection

Water samples were collected at six checkpoints every month in four seasons (spring, summer, autumn, and winter). In 2021–2022, the surface water quality parameters were measured. The process of collecting water samples was carried out without disturbing the temperature and turbidity of the water using a laboratory scoop. Each time, 1000 mL of water was collected in glass bottles. Water samples were collected outside periods of heavy rainfall and snowmelt, which could affect the reliability of the results. Appropriate rules were observed during the sampling and handling of samples [23].
The collected water samples were used to determine conductivity (EC), biochemical oxygen demand (BOD5), chemical oxygen demand (COD), total nitrogen (TN), ammonium (N-NH4), nitrate (N-NO3), nitrite nitrogen (N-NO2), total phosphorus (TP), orthophosphates (P-PO4), sulphates (SO42−), and chlorine (Cl). The EC of water samples was determined in situ using the ORION Star A329 multi-parameter meter by ThermoScientific. Biochemical oxygen demand (BOD5) was measured by the dilution method based on the dissolved oxygen concentration in situ and after five days of incubation in the laboratory. The oxygen content was determined using the ORION Star A329 Set multi-parameter meter by ThermoScientific. Chemical oxygen demand was determined using the dichromate method. The determination was carried out with the NANOCOLOR UV/VIS spectrophotometer by Macherey-Nagel after the oxidation of the tested sample in a thermoreactor at 148 °C for two hours. The total nitrogen was determined using the NANOCOLOR UV/VIS spectrophotometer by Macherey-Nagel after oxidation of the tested sample in a thermoreactor at 100 °C for one hour. The total phosphorus was determined by spectrophotometry using a NANOCOLOR UV/VIS spectrophotometer by Macherey-Nagel after oxidation in a thermoreactor at 120 °C for 30 min. Other parameters of water quality (ammonium nitrogen, nitrate nitrogen, nitrite nitrogen, orthophosphates, sulphates, chlorine) were determined using the NANOCOLOR UV/VIS spectrophotometer by Macherey-Nagel. The laboratory analyses of the tested water samples of selected rivers were conducted in accordance with the relevant standards [24,25,26].

2.3. Data Analysis

This study aims to evaluate changes in the site due to the potential impact of the beaver dam. Six beaver dams were selected for the purposes of the research. Measurements were taken after the beaver (A), before the beaver sites on the river (B), and at the control site (C). Spatial distribution and natural expansion of the beaver dam upstream created a set of conditions on the basis of which it was possible to assess the impact of the development of the beaver dam on water quality parameters. The study used a naturally occurring experimental design before and after the impact [27,28]. This approach was popularised and became known as the BACI model (Before-After-Control-Impact). To assess the impact of a beaver dam’s construction on the water quality parameters, we calculated the difference in the minimum and maximum averages measured near the beaver dam and the control area unaffected by beavers. In accordance with the BACI project, we used a one-way ANOVA to test the significance of the differences between the beaver-affected areas and the control area. The influence of the season and land use on the water quality parameters under study was determined. For data not showing a normal distribution, logarithmic standardisation was used to meet the conditions for parametric analyses. The obtained results were analysed using three-way ANOVA. Tukey’s HSD post hoc test was used to identify the significance of changes in water quality parameters for habitats, seasons, and land use. Statistical analyses were performed using the R Studio program.

3. Results and Discussion

3.1. BACI Analyses

The paper presents the impact of natural damming on changes in water quality. The research was carried out for beavers’ habitats at the heads of the Tyśmienica and Piwonia rivers (Table 1 and Table 2).
In the case of the Piwonia River, a statistically significant improvement in water quality was found, as the decrease in COD was 9.56 and 12.16 mg·L−1 before and after the dam, respectively. In the case of the Tyśmienica River, the COD decrease was statistically insignificant and amounted to 2.90 and 8.73 mg·L−1, respectively (Table 3). The reduction of COD pollution for the Piwonia and Tyśmienica rivers was 24 and 17%, respectively. In the spring, on the Piwonia River, before the beaver, the concentration decrease in COD of 23.9 mg·L−1 (−44%) occurred (Table 1 and Table 2). Temporal variability was statistically insignificant. A highly statistically significant effect of land use was found and no efect of the habitat on changes in the oxygen conditions was found (Table 4). The impact of air temperature changes and the flow of water disturbed by the increased activity of beavers in the spring were not the dominant factors determining changes in the COD concentrations [29]. Both the impact of large amounts of sediments and the reduction of the freedom of the water outflow, which favour the decomposition of matter, create anaerobic conditions in the waters of beaver ponds [30]. Usually, the water below dams is better oxygenated than in places not affected by the damming structure on the river [31]. A low BOD5 value of less than 3 mg·L−1 indicates slight contamination with organic matter and an improvement in the aerobic conditions for microorganisms [32]. The improvement in the value of the BOD5 parameter was found in all the measured seasons. However, these changes were statistically significant. The decrease in BOD5 values for site B was 0.30 and 0.60 mg·L−1 for the Tyśmienica and Piwonia rivers, respectively. For site A, the decrease in BOD5 was 0.58 and 0.81 mg·L−1, respectively (Table 3). The reduction of BOD5 pollution for the Tyśmienica and Piwonia rivers was 19% and 27%, respectively. The greatest decrease in BOD5 contamination was found in the summer, when it amounted to 2.24 mg·L−1 (−61%) (Table 1 and Table 2). Statistically significant differences in the BOD5 parameter were found in temporal and land use variability (Table 4).
Analysing the purification of biogenic compounds released in the water from agricultural areas by surface runoff is particularly important for determining the impact of beaver dams on the river water quality. The concentration of nutrients due to the beaver dam was characterised by temporal and land use variability (Table 4). In the case of the Tyśmienica River, a statistically significant improvement in water quality was found, as the decrease in TP was 0.139 and 0.159 mg·L−1, before and after the beaver dam, respectively. In the Piwonia River case, the TP decrease was statistically insignificant and amounted to 0.015 and 0.071 mg L−1, respectively (Table 3). The reduction of TP pollution for the Piwonia and Tyśmienica rivers was 21 and 45%, respectively. In the autumn, on the Tyśmienica River, at the site after the beaver, a TP decrease of 0.247 mg·L−1 (−61%) occurred (Table 1 and Table 2). In the case of the Piwonia River, a statistically significant improvement in water quality was found, as the decrease in P-PO4 was 0.009 and 0.014 mg·L−1 before and after the dam, respectively. In the case of the Tyśmienica River, the decrease in P-PO4 was statistically significant and amounted to 0.043 and 0.060 mg·L−1, respectively (Table 3). The reduction of P-PO4 pollution for the Piwonia and Tyśmienica rivers was 16 and 57%, respectively. In the spring on the Tyśmienica River at the site after the beaver, the P-PO4 decreased by 0.100 mg·L−1 (−67%) (Table 1 and Table 2). In the case of the Piwonia River, the reduction of the TP and P-PO4 concentrations was much lower, which was caused by the decomposition of the dam in the summer. Similar results were obtained in England where the concentration of P-PO4 in the water flowing out after being filtered through a beaver dam was much lower than in sites where no impact of European beavers was found. Barriers can create suitable conditions for the removal of nutrients from agricultural fields [15,16]. Beaver ponds can act as a phosphorus accumulator in terms of accumulation in bottom sediments. Their dynamics are affected by both climatic and seasonal changes and the availability of organic matter [12]. This is confirmed by studies which showed that sediments from beaver ponds were characterised by higher concentrations of PO4 and NO3 than sediments collected after beaver dams [33]. In addition, ensuring a stable water level in rivers above the natural damming structure slows down the speed of the water flow, positively affecting the reduction of the movement of nutrients [34]. A tendency to maintain an elevated concentration of P-PO4 in the vicinity of beaver ponds and to decrease with increasing distance from the natural reservoir was also found [35]. Studies show the importance of runoff analysis as an important indicator of pollutant retention due to beaver activity. Natural beaver ponds are a source of phosphorus in water, accumulating with the increasing age of the beaver pond [36]. In addition, deteriorating conditions in the lower water layers of beaver pools are conducive to increasing the concentrations of ammonium and phosphate ions. Ensuring a stable water level in rivers above the natural damming structure slows down the speed of the water flow, positively affecting the reduction of the movement of nutrients [34]. Both sorption and desorption of phosphorus forms in aquatic environments depend on the geochemical composition, organic matter content, type of clay materials, and sediments. Understanding changes in TP and P-PO4 concentrations due to bottom sediments and river impoundments is crucial for managing policies to mitigate nutrient shifts within watersheds. The dam’s age and size may affect the phosphorus content in the waters of beaver ponds. Young beaver ponds were a source of phosphorus, while in the case of the impact of older natural barriers, a tendency to phosphorus retention was demonstrated [37].
In the case of the Tyśmienica River, an improvement in water quality was found, as the decrease in TN and N-NO2 pollution was statistically significant. In the case of the Piwonia River, the decrease was statistically insignificant. In the case of N-NO3, statistically insignificant decreases in pollution in places with beavers were recorded for both rivers (Table 1, Table 2 and Table 3). The reduction of pollution in the Tyśmienica for TN, N-NO3, and N-NO2 was 21, 34, and 44%, respectively. In the case of the Piwonia River, the reduction of the concentrations was much lower and amounted to 8, 15, and 33%. The situation differed in the case of N-NH4, whose concentration in Tyśmienica and Piwonia Rivers increased by 16 and 33%, respectively. In the Piwonia River, the pollution reduction was much lower, which was caused by the decomposition of the dam in the summer. A statistically significant variability in the parameters N-NH4, N-NO2, and N-NO3 temporal and land use was demonstrated. Water quality changes for TN showed statistically significant differences in land use (Table 4). Seasonal temperature increases positively affected the reduction of biogenic pollutants (spring and summer) by increasing their chemical reactivity. Increasing concentrations of N-NH4 were observed along with the distance from the damming downstream and decreasing directional trends for N-NO3 [13]. The increase in N-NH4 concentration below the beaver pond could result from releasing this compound from anaerobic sediments, peat mineralisation, and reducing nitrates to ammonia [38]. Pollutants can be retained seasonally: N-NO3 and organic nitrogen are retained in winter, N-NO3 is accumulated in spring, and organic nitrogen in summer [39]. The retention of decomposing organic remains in beaver ponds also created ideal conditions for the combined processes of nitrification and denitrification, enabling the removal of 5 to 45% of NO3 from the watershed [40]. A beaver pond could be both a sink and an emitter of nitrogen pollutants. Seasonality of changes in N-NO3 concentrations was found because, in the summer, the beaver pond absorbed pollutants (25% decrease in June), while in autumn, the beaver pond emitted pollution (63% increase in September) [41].
In the case of the Piwonia and Tyśmienica rivers, water quality was improved, as the decrease in EC, SO42−, and Cl pollution was statistically insignificant (Table 1, Table 2 and Table 3). The reduction of pollution in the Tyśmienica for EC, SO42−, and Cl was 8, 17, and 29%, respectively. In the case of the Piwonia River, the reduction of the concentrations was much lower and amounted to 1, 29, and 27%. Similar results of conductivity changes were found on the Bystrzyca River, showing a decrease in the EC value in the water below the weir. The increase in EC proved the quantitative increase of mineral impurities in water [29,42]. The values of the EC parameter showed statistically significant differences in terms of seasonality and land use (Table 4). Temporal variability of SO42− and Cl was statistically insignificant. Seasonal variations in EC can be influenced not only by temperature but by rainfall intensity and land use. Intensive rainfall may cause the dilution of water, reducing its conductivity. However, an intensive surface runoff contributes to the transport of salt ions leached from the soil to the water (increase in EC) [43]. In studies conducted on Herrington Creek, a slight reduction of sulphates was found, but no statistically significant differences were found between the sites upstream and downstream of the dam [44]. The opposite effect of the impact of beaver dams on the water quality resulted from research conducted in Germany, where significant changes caused by the construction of dams were listed as an increase in conductivity, water hardness, and the SO42− concentration. In addition, a positive correlation (r = 0.82) was identified between the number of dams along the river section and the change in sulphate [45]. In other studies, higher concentrations of SO4 were found below the beaver dam than in the water of the dam basin and directly in front of the beaver dam. Below the beaver dam, higher concentrations of sulphates and other pollutants may be dissolved from March to October. This is a direct result of the dry season, which causes lower water dilution [46]. Within the beaver dams, there is a different intensity of reduction in the concentration of sulphate ions depending on the depth of water retention. The concentration of sulphate ions is reduced in the waters of the lower parts of beaver ponds, while on the surface of stagnant waters, they are not reduced [47]. In the remaining seasons, no changes in chloride pollution were observed. Research conducted on small watercourses shows that surface waters are characterized by low concentrations of chlorides [7,32].

3.2. Impact Analysis

Different land use, construction parameters, and the age of the beaver dam characterised individual research stations. Beavers cut down many trees in the early stages and use branches to block the river. In the next stage, herbaceous plants are used to build the barriers. Then beavers build small and permeable compartments. In the third stage of construction, the beaver dams are sealed, and the outflow is blocked with silt and plant debris. After some time, some dams are abandoned, and no beaver presence is observed. During the research, it was observed that as a result of the flood runoff or human activities, some partitions were partially or completely destroyed [48]. In the case of the destruction of beaver dams, these animals use new building materials, such as cutting trees and bushes, for reconstruction [49,50]. The construction of beaver dams is also associated with the presence of clay and silt deposits, as beavers use clay-dust substrate as a building material [51]. Beavers build dams from various materials: wood, rock, sediment, and organic debris. It was shown that 27% of the examined dams contained stones and rocks in their construction [52]. Beaver dams can be divided according to the flow through their structure. The classification developed by Woo and Waddington [53] indicates four types of dam flows: overflow, gap flow, through flow, and underflow. The proper functioning of dams is disturbed by their washing away by flood waters or decomposition by people (Figure 2 and Figure 3). Beavers then rebuild the damaged dams. Often, however, beavers move to another habitat, where they build a new dam. Then the remains of the damaged and inactive dam are washed away by water, contributing to increased river pollution. Removing the dam releases pollutants accumulated in the bottom sediments [18].
Analyses carried out in Malaysia have shown that intensive agricultural use and degradation of forest land are the main causes of changes in the surface water quality, as 87% of the water quality is affected by urbanised areas, 82% by agricultural use, 77% by forestry, and 44% by other forms of land use. Agricultural and forestry activities contributed to significant changes in the surface water chemical and physicochemical parameters [54]. Research conducted in the Zêzere river basin in Portugal has demonstrated close links between water and land management. The reduction of mixed forest area shows a high correlation with the variability of the BOD5 parameter in surface waters. Water pollution results from using chemicals to increase agricultural production and increases the presence of NO3 and NH4+ in the waters. In the case of NO2, the greatest correlation between the occurrence of this parameter in water results from the extraction of minerals and agricultural use [55]. The research conducted on the Lublin Upland shows that the highest concentrations of nutrients were recorded in water flowing from agricultural fields. In forest areas, water runoff occurs much less frequently and carries the smallest pollutants [56,57,58]. The results of our research confirm the thesis on the positive impact of the forest on the reduction of surface water pollution (Table 5). The highest concentrations of N-NH4, N-NO2, TP, and P-PO4 were found in meadows. However, the highest concentrations of TN and N-NO3 were found in scrubs. Changes in water quality parameters, in addition to land use, are influenced by seasons and habitats. Total nitrogen concentrations in streams in the Wheeler Lake Watershed in northern Alabama in the summer waters were 34% higher than the annual average. Similarly, particulate matter and total phosphorus reached higher concentrations in summer (24% above the annual average), while in spring, their decrease was 25% below the average annual value of these parameters in water. The dissolved oxygen concentrations were 46% higher than the annual average in autumn, while their decrease to approx. 18–26% below the annual average was recorded in the summer [59]. Seasonal quality variability studies were also conducted in Poland on the Bug and Bystrzyca rivers [7,60]. In the Bug River, the concentration of chlorides, sulphates, and nitrates was the highest in winter. The periodic increase in water pollution is related to urbanisation, intense land use changes, and municipal wastewater discharges. In the Bystrzyca River, the highest concentrations of biogenic pollutants were recorded in winter. In this case, the seasonal increase in pollution was due to the low water levels and a lack of vegetation. Our research found the highest concentrations of phosphates and ammonium nitrogen in summer. In turn, the highest nitrate and total nitrogen concentrations were found in spring (Table 6). Very high concentrations of ammonium nitrogen during drought result from its release in drained peatlands [61,62]. The mean values of the concentrations of the water quality parameters tested were usually low. All parameters, with the exception of P-PO4, met the standards of a good ecological status [63]. The average values of P-PO4 exceeded the critical values of a good ecological status in the summer and meadows.

4. Conclusions

The research shows that the river water quality changes result from many factors, such as Castor fiber L. habitats. As a result of applying the BACI model, differences were found between the water in habitats with beavers and control habitats. Significant statistical changes in the water quality parameters for season and land use were found. The highest concentrations of TP, P-PO4, N-NH4, and N-NO2 were found in the summer on meadows. However, the highest concentrations of TN and N-NO3 were found in the spring in the shrubs. The variety of structures and the age of dams affect their functioning. Pollution is reduced in the case of stable barriers on the Tyśmienica River. We found that 57% of P-PO4, 45% of TP, 44% of N-NO2, 34% of N-NO3, and 21% of TN were removed on the scale of barrier coverage. The situation is different only in the case of N-NH4, where most often, there is a clear increase in concentration. In the event of the destruction of beaver habitats on the Piwonia River, pollutants are emitted, and water quality deteriorates. In certain periods, especially in summer, individual dams may contribute to reducing or emitting pollutants. Ensuring the durability and tightness of beaver dam structures may contribute to proper water quality management in the future. It is important to conduct further research in order to verify the impact of the presence of natural dams in rivers on changes in the environment. For a proper analysis of the effects of renovation, it is necessary to provide data before and after the event. The monitoring project should be carried out on two spatial scales: at the reach scale and the scale of the catchment area.

Author Contributions

Conceptualization, K.P. and A.G.; theoretical discussion, K.P. and A.G.; methodology, K.P.; data analysis, K.P. and A.G.; writing—original draft preparation, K.P.; writing—review and editing, A.G. All authors have read and agreed to the published version of the manuscript.

Funding

This paper was written on the basis of the research projects funded by: Polish Ministry of Science and Higher Education—project entitled: Water, wastewater and energy management (contracts No. TKD/DS1, TKD/S/1); The paper was written within the framework of a PhD thesis prepared by Katarzyna Połe´c, M.Sc., from the project no SD/27/ISGiE/2021 financed by the University of Life Science in Lublin (Poland) entitled “The influence of the European beaver (Castor fiber) activity on the shaping of water resources”.

Institutional Review Board Statement

Not applicable.

Informed Consent Statement

Not applicable.

Data Availability Statement

All data generated or analyzed during this study are included in this published article.

Conflicts of Interest

The authors declare no conflict of interest.

References

  1. Madhav, S.; Ahamad, A.; Singh, A.K.; Kushawaha, J.; Chauhan, J.S.; Sharma, S.; Singh, P. Water pollutants: Sources and impact on the environment and human health. In Sensors in Water Pollutants Monitoring: Role of Material; Springer: Singapore, 2020; pp. 43–62. [Google Scholar]
  2. Oki, T.; Kanae, S. Global Hydrological Cycles and World Water Resources. Science 2006, 313, 1068–1072. [Google Scholar] [CrossRef] [PubMed]
  3. Adimalla, N.; Qian, H. Groundwater quality evaluation using water quality index (WQI) for drinking purposes and human health risk (HHR) assessment in an agricultural region of Nanganur, south India. Ecotoxicol. Environ. Saf. 2019, 176, 153–161. [Google Scholar] [CrossRef] [PubMed]
  4. Szpak, D.; Boryczko, K.; Żywiec, J.; Piegoń, I.; Tchórzewska-Cieślak, B.; Rak, J.R. Risk assessment of water intakes in South-Eastern Poland in relation to the WHO requirements for water safety plans. Resources 2021, 10, 105. [Google Scholar] [CrossRef]
  5. Moss, B. Water pollution by agriculture. Phil. Trans. R. Soc. B 2008, 363, 659–666. [Google Scholar] [CrossRef] [PubMed]
  6. Puchlik, M.; Piekutin, J.; Dyszewska, K. Analysis of the impact of climate change on surface water quality in North-Eastern Poland. Energies 2022, 15, 164. [Google Scholar] [CrossRef]
  7. Grzywna, A.; Bronowicka-Mielniczuk, U. Spatial and temporal variability of water quality in the Bystrzyca River Basin. Poland. Water 2020, 12, 190. [Google Scholar] [CrossRef]
  8. Wróbel, M.; Krysztofiak-Kaniewska, A. Long-term dynamics of and potential management strategies for the beaver (Castor fiber) population in Poland. Eur. Zool. J. 2020, 87, 116–121. [Google Scholar] [CrossRef]
  9. Połeć, K.; Grzywna, A.; Tarkowska-Kukuryk, M.; Bronowicka-Mielniczuk, U. Changes in the ecological status of rivers caused by the functioning of natural barriers. Water 2022, 14, 1522. [Google Scholar] [CrossRef]
  10. Florek, M.; Domaradzki, P.; Skałecki, P.; Ryszkowska-Siwko, M.; Ziomek, M.; Tajchman, K.; Gondek, M.; Pyz-Łukasik, R. Content and solubility of collagen and their relation to proximate composition and shear force of meat from different anatomical location in carcass of European Beaver (Castor fiber). Foods 2022, 11, 1288. [Google Scholar] [CrossRef]
  11. Nica, A.; Petrea, M.S.; Simionov, I.A.; Antache, A.; Cristea, V. Ecological impact of European Beaver, Castor fiber. Sci. Pap. Ser. D Anim. Sci. 2022, 65, 640–647. [Google Scholar]
  12. Brazier, R.E.; Puttock, A.; Graham, H.A.; Auster, R.E.; Davies, K.H.; Brown, C.M.L. Beaver: Nature’s ecosystem engineers. Wire’s Water 2021, 8, e1494. [Google Scholar] [CrossRef] [PubMed]
  13. Grudzinski, B.P.; Fritz, K.; Golden, H.E.; Newcomer-Johnson, T.A.; Rech, J.A.; Levy, J.; Fain, J.; McCarty, J.L.; Johnson, B.; Keng Vang, T.; et al. A global review of beaver dam impacts: Stream conservation implications across biomes. Glob. Ecol. Conserv. 2022, 37, 14–23. [Google Scholar] [CrossRef] [PubMed]
  14. Hughes, D.A.; Mantel, S.K. Estimating the uncertainty in simulating the impacts of small farm dams on streamflow regimes in South Africa. Hydrol. Sci. J.–J. Sci. Hydrol. 2010, 55, 578–592. [Google Scholar] [CrossRef]
  15. Puttock, A.; Graham, H.A.; Cunliffe, A.M.; Elliott, M.; Brazier, R.E. Eurasian beaver activity increases water storage. attenuates flow and mitigates diffuse pollution from intensively-managed grasslands. Sci. Total Environ. 2017, 576, 430–443. [Google Scholar] [CrossRef] [PubMed]
  16. Smith, A.; Tetzlaff, D.; Gelbrecht, J.; Kleine, L.; Soulsby, C. Riparian wetland rehabilitation and beaver re-colonization impacts on hydrological processes and water quality in a lowland agricultural catchment. Sci. Total Environ. 2020, 699, 134302. [Google Scholar] [CrossRef]
  17. Shepherd, N.L.; Nairn, R.W. Induced mobilization of stored metal precipitates from beaver (Castor canadensis) created wetlands on a mine drainage impacted stream. Wetl. Ecol. Manag. 2022, 30, 127–137. [Google Scholar] [CrossRef]
  18. Kalvīte, Z.; Lībiete, Z.; Kļaviņš, I.; Bārdule, A.; Bičkovskis, K. The impact of beaver dam removal on the chemical properties of water in drainage ditches in peatland forests. Scand. J. For. Res. 2021, 36, 1–14. [Google Scholar] [CrossRef]
  19. Thompson, J.; Pelc, C.E.; Brogan, W.R., III; Jordan, T.E. The multiscale effects of stream restoration on water quality. Ecol. Eng. 2018, 124, 7–18. [Google Scholar] [CrossRef]
  20. Thompson, J.; Pelc, C.E.; Jordan, T.E. Water quality sampling methods may bias evaluations of watershed management practices. Sci. Total Environ. 2021, 765, 142739. [Google Scholar] [CrossRef]
  21. West Polesie Transboundary Biosphere Reserve. Belarus/Poland/Ukraine. UNESCO 2012. Available online: https://en.unesco.org/biosphere/eu-na/west-polesie (accessed on 2 April 2023).
  22. Rozporządzenie Rady Ministrów z dnia 10 kwietnia 1990 r. w sprawie utworzenia Poleskiego Parku Narodowego. Dz. Ustaw 1990, 27, 155.
  23. ISO 5667-6:2016-12; Water Quality—Sampling—Part 6: Guidance on Sampling of Rivers and Streams. PKN: Warszawa, Poland, 2016.
  24. ISO 15705:2002; Water Quality: Determination of the Chemical Oxygen Demand Index (ST-COD), Small-Scale Sealed-Tube Method. PKN: Warszawa, Poland, 2002.
  25. ISO 5815-1:2019; Water Quality—Determination of Biochemical Oxygen Demand after n Days (BODn), Dilution and Seeding Method with Allylthiourea Addition. ISO: Geneva, Switzerland, 2019.
  26. ISO 6878:2004; Water Quality-Determination of Phosphorus-Ammonium Molybdate Spectrometric Method. ISO: Geneva, Switzerland, 2004.
  27. Stewart-Oaten, A.; Bence, J.R. Temporal and spatial variation in environmental impact assessment. Ecol. Monogr. 2001, 71, 305–339. [Google Scholar] [CrossRef]
  28. Weber, N.; Bouwes, N.; Pollock, M.M.; Volk, C.; Wheaton, J.M.; Wathen, G. Alteration of stream temperature by natural and artificial beaver dams. PLoS ONE 2017, 12, e0176313. [Google Scholar] [CrossRef]
  29. Dou, M.; Li, G.; Li, C. Quantitative relations between chemical oxygen demand concentration and its influence factors in the sluice-controlled river reaches of Shaying River, China. Environ. Monit. Assess. 2015, 187, 4139. [Google Scholar] [CrossRef]
  30. Rozhkova-Timina, I.O.; Popkov, V.K.; Mitchell, P.J.; Kirpotin, S.N. Beavers as ecosystem engineers–a review of their positive and negative effects. IOP Conf. Ser. Earth Environ. Sci. 2018, 201, e012015. [Google Scholar] [CrossRef]
  31. Tomczyk, P.; Wiatkowski, M. Impact of a small hydropower plant on water quality dynamics in a diversion and natural river channel. Energie 2021, 50, 1156–1170. [Google Scholar] [CrossRef] [PubMed]
  32. Prambudy, H.; Supriyatin, T.; Setiawan, F. The testing of chemical oxygen demand (COD) and biological oxygen demand (BOD) of river water in Cipager Cirebon. J. Phys. Conf. Ser. 2019, 1360, 012010. [Google Scholar] [CrossRef]
  33. Gibbs, D. The effect of beaver ponds on the nutrient composition in the water column and the sediments of Cart Creek. Ecosystems 2014, 3, 1–8. [Google Scholar]
  34. Čiuldienė, D.; Vigricas, E.; Belova, O.; Aleinikovas, M.; Armolaitis, K. The effect of beaver dams on organic carbon. nutrients and methyl mercury distribution in impounded waterbodies. Wildl. Biol. 2020, 3, 1–8. [Google Scholar] [CrossRef]
  35. Błȩdzki, L.A.; Bubier, J.L.; Moulton, L.A.; Kyker-Snowman, T.D. Downstream effects of beaver ponds on the water quality of New England first-and second-order streams. Ecohydrology 2011, 4, 698–707. [Google Scholar] [CrossRef]
  36. Strzelec, M.; Białek, K.; Spyra, A. Activity of beavers as an ecological factor that affects the benthos of small rivers-a case study in the Żylica River (Poland). Biologia 2018, 73, 577–588. [Google Scholar] [CrossRef]
  37. Ecke, F.; Levanoni, O.; Audet, J.; Carlson, P.; Eklöf, K.; Hartman, G.; McKie, B.; Ledesma, J.; Segersten, J.; Truchy, A.; et al. Meta-analysis of environmental effects of beaver in relation to artificial dams. Environ. Res. Lett. 2017, 12, 113002. [Google Scholar] [CrossRef]
  38. Bason, C.W.; Kroes, D.E.; Brinson, M.M. The effect of beaver ponds on water quality in rural coastal plain streams. Southeast. Nat. 2017, 16, 584–602. [Google Scholar] [CrossRef]
  39. Correll, D.L.; Jordan, T.E.; Weller, D.E. Beaver Pond biogeochemical effects in the Maryland Coastal Plain. Biogeochemistry 2000, 49, 217–239. [Google Scholar] [CrossRef]
  40. Lazar, J.G.; Addy, K.; Gold, A.J.; Groffman, P.M.; McKinney, R.A.; Kellogg, D.Q. Beaver ponds: Resurgent nitrogen sinks for rural watersheds in the Northeastern United States. J. Environ. Qual. 2015, 44, 1684–1693. [Google Scholar] [CrossRef] [PubMed]
  41. Murray, D.; Neilson, B.T.; Brahney, J. Source or sink? Quantifying beaver pond influence on non-point source pollutant transport in the Intermountain West. J. Environ. Manag. 2021, 285, 112127. [Google Scholar] [CrossRef] [PubMed]
  42. Gugała, M.; Sikorska, A.; Kapela, K.; Zarzecka, K. Seasonal changes in selected indicators of water quality of the Łydynia river. J. Ecol. Eng. 2016, 17, 149–153. [Google Scholar] [CrossRef]
  43. Pal, M.; Samal, N.R.; Roy, P.K.; Roy, M.B. Electrical conductivity of lake water as environmental monitoring—A case study of Rudra agar Lake. J. Environ. Sci. 2015, 9, 66–71. [Google Scholar]
  44. Margolis, B.E.; Castro, M.S.; Raesly, R.L. The impact of beaver impoundments on the water chemistry of two Appalachian streams. Can. J. Fish. Aquat. 2001, 58, 2271–2283. [Google Scholar] [CrossRef]
  45. Koschorreck, M.; Herzsprung, P.; Brands, E.; Kirch, P.M.; Dalbeck, L. Minor effect of beaver dams on stream dissolved organic carbon in the catchment of a German drinking water reservoir. Limnologica 2016, 61, 36–43. [Google Scholar] [CrossRef]
  46. Shaw, M.; Yazbek, L.; Singer, D.; Herndon, E. Seasonal mixing from intermittent flow drives concentration—Discharge behavior in a stream affected by coal mine drainage. Hydrol. Process. 2020, 34, 3669–3682. [Google Scholar] [CrossRef]
  47. Kangur, M.; Puusepp, L.; Buhvestova, O.; Haldna, M.; Kangur, K. Spatio-temporal variability of surface sediment phosphorus fractions and water phosphorus concentration in Lake Peipsi (Estonia/Russia). Est. J. Earth Sci. 2013, 62, 171–180. [Google Scholar] [CrossRef]
  48. Ignatius, A.R.; Rasmussen, T.C. Small reservoir effects on headwater water quality in the rural-urban fringe. Georgia Piedmont. USA. J. Hydrol. Reg. Stud. 2016, 8, 145–161. [Google Scholar] [CrossRef]
  49. Janiszewski, P.; Wozniak, A.; Janiszewska, L. Wpływ tam bobrowych na zmiany w przegrodzonym cieku wodnym. Zesz. Probl. Postępów Nauk. Rol. 2005, 506, 197–204. [Google Scholar]
  50. Barnes, D.M.; Mallik, A.U. Use of woody plants in construction of beaver dams in northern Ontario. Can. J. Zool. 1996, 74, 1781–1786. [Google Scholar] [CrossRef]
  51. St-Pierre, M.L.; Labbé, J.; Darveau, M.; Imbeau, L.; Mazerolle, M.J. Factors affecting abundance of beaver dams in forested landscapes. Wetlands 2017, 37, 941–949. [Google Scholar] [CrossRef]
  52. Ronnquist, A.L.; Westbrook, C.J. Beaver dams: How structure flow state, and landscape setting regulate water storage and release. Sci. Total Environ. 2021, 785, 147333. [Google Scholar] [CrossRef]
  53. Woo, M.K.; Waddington, J.M. Effects of beaver dams on subarctic wetland hydrology. Arctic 1990, 2, 223–230. [Google Scholar] [CrossRef]
  54. Camara, M.; Jamil, N.R.; Abdullah, A.F.B. Impact of land uses on water quality in Malaysia: A review. Ecol. Process. 2019, 8, 10. [Google Scholar] [CrossRef]
  55. Meneses, B.M.; Reis, R.; Vale, M.J.; Saraiva, R. Land use and land cover changes in Zêzere watershed (Portugal)—Water quality implications. Sci. Total Environ. 2015, 527, 439–447. [Google Scholar] [CrossRef]
  56. Mazur, A. Quantity and quality of surface and subsurface runoff from an eroded loess slope used for agricultural purposes. Water 2018, 10, 1132. [Google Scholar] [CrossRef]
  57. Mazur, A. Surface and subsurface water runoff and selected matter components from the forested loess slope. J. Ecol. Eng. 2018, 19, 259–266. [Google Scholar] [CrossRef]
  58. Mazur, A. Losses of chemical nutrients of plants and soil as a result of the outflow of water from the sodded loess slope. Przemysł Chem. 2018, 12, 2154–2157. [Google Scholar]
  59. Tsegaye, T.; Sheppard, D.; Islam, K.R.; Tadesse, W.; Atalay, A.; Marzen, L. Development of chemical index as a measure of in-stream water quality in response to land-use and land cover changes. Water Air Soil Pollut. 2006, 174, 161–179. [Google Scholar] [CrossRef]
  60. Grzywna, A.; Bronowicka-Mielniczuk, U.; Połeć, K. Spatio-temporal changes of water pollution, and its sources and consequences in the Bug River, Poland. Desalination Water Treat. 2021, 243, 18–36. [Google Scholar] [CrossRef]
  61. Koskinen, M.; Tahvanainen, T.; Sarkkola, S.; Menberu, M.W.; Laurén, A.; Sallantaus, T.; Nieminen, M. Restoration of nutrient-rich forestry-drained peatlands poses a risk for high exports of dissolved organic carbon, nitrogen, and phosphorus. Sci. Total Environ. 2017, 586, 858–869. [Google Scholar] [CrossRef]
  62. Laine, M.P.; Strömmer, R.; Arvola, L. Nitrogen release in pristine and drained peat profiles in response to water table fluctuations: A mesocosm experiment. Appl. Environ. Soil Sci. 2013, 2013, 694368. [Google Scholar] [CrossRef]
  63. Rozporządzenie Ministra Infrastruktury z dnia 25 czerwca 2021 r. w sprawie klasyfikacji stanu ekologicznego, potencjału ekologicznego i stanu chemicznego oraz sposobu klasyfikacji stanu jednolitych części wód powierzchniowych, a także środowiskowych norm jakości dla substancji priorytetowych. Dz. Ustaw 2021, 1475. Available online: https://isap.sejm.gov.pl/isap.nsf/DocDetails.xsp?id=WDU20210001475 (accessed on 2 April 2023).
Figure 1. Location of the research object. B—before, A—after, C—control, D—dam.
Water 15 02065 g001
Figure 2. Active beaver young dam with gap flow.
Water 15 02065 g002
Figure 3. Beaver dam was destroyed by people.
Water 15 02065 g003
Table 1. BACI analysis of scale of Tyśmienica river.
SeasonHabitat ECBOD5CODTNN-NH4N-NO2N-NO3TPP-PO4SO42−Cl
springBmin−17.7−0.37−0.4−0.63 *−0.0390.004−0.03−0.116−0.040−0.65−9.76
max−55.2 *−0.56 *−2.50.190.041−0.030 *−0.26−0.163 *−0.063 *−6.65−0.76
mean−36.4−0.46 *−1.0−0.220.001−0.013 *−0.16−0.139−0.051 *−3.65−5.26
Amin−11.5−0.57 *−1.8−1.07 *−0.051−0.003−0.17−0.103−0.100 *−3.60−7.76
max−94.5 *−0.91 *−12.4 *−0.270.089 *0.026 *−1.29 *−0.122−0.063 *3.65−0.76
mean−53.0 *−0.74 *−9.6−0.65 *0.019−0.011 *−0.56−0.109−0.081 *0.01−4.26
summerBmin−15.5−0.11−3.8−0.61 *0.078 *−0.006−0.17 *−0.149 *−0.043−14.0 *−2.01
max−50.6 *−0.21−3.1−1.240.065 *−0.017 *−1.13 *−0.163 *−0.062 *−4.330.99
mean−33.1−0.15−3.4−0.92 *0.072 *−0.011 *−0.52−0.156 *−0.053 *−9.18−0.51
Amin−10.4−0.70 *−7.2−0.53 *0.059−0.013 *−0.33−0.155 *−0.043−12.3 *−2.01
max−69.0 *−0.85 *−11.6 *−1.61 *0.079 *−0.016 *−1.25 *−0.221 *−0.081 *−6.33−1.01
mean−39.7−0.77 *−9.4−1.07 *0.069 *−0.014 *−0.64 *−0.188 *−0.062 *−9.33−1.51
autumnBmin−18.9−0.48 *−1.5−0.130.027−0.020 *−0.54−0.132−0.032−1.320.51
max−24.2−0.18−12.2 *0.000.062 *−0.022 *0.54−0.232 *−0.077 *−10.3 *−2.19
mean−21.5−0.33−6.8−0.060.044−0.021 *0.00−0.182 *−0.050 *−5.82−0.84
Amin−63.7 *−0.47 *−4.0−0.050.025−0.022 *−0.07−0.134−0.042−10.3 *1.39
max−13.6−0.41 *−13.9 *−1.39 *0.061 *−0.020 *−1.04 *−0.247 *−0.083 *−2.32−1.51
mean−38.6−0.44 *−8.9−0.67 *0.043−0.021 *−0.52−0.191 *−0.063 *−6.32−0.06
winterBmin−4.4−0.202.0−0.240.011−0.001−0.24−0.027−0.002−4.67−0.03
max−25.1−0.34−2.8−0.51 *0.0310.009−0.49−0.131−0.038−14.6 *−12.0 *
mean−14.7−0.27−0.4−0.370.0160.004−0.36−0.079−0.021−9.67−6.03
Amin7.2−0.52 *−1.9−0.010.031−0.001−0.02−0.113−0.052 *−3.67−0.03
max−23.5−0.20−9.0−0.91 *0.092 *0.014 *−0.89 *−0.181 *−0.012−8.67−11.0 *
mean−8.2−0.36−5.5−0.500.061 *0.006−0.53−0.147 *−0.032−6.17−5.53
Notes: The results for the BACI analysis of seasonal differences in water quality parameters between the control point (C) and before and after the dam (B, A). The maximum values are given for each season. Thus, positive differences in the mean relative difference indicate an increase in value, and negative differences, a decrease in value. * Statistically significant differences for p < 0.05.
Table 2. BACI analysis of scale of Piwonia river.
SeasonHabitat ECBOD5CODTNN-NH4N-NO2N-NO3TPP-PO4SO42−Cl
springBmin−96.1 *−0.74 *−17.2 *−1.04 *0.167 *0.004−1.44 *−0.0060.017−10.2−10.49 *
max16.90.14−11.6 *−0.070.097 *−0.031 *0.30−0.100−0.050 *−6.2−1.49
mean−35.2−0.20−13.0 *−0.61 *0.127 *−0.012 *−0.55−0.052−0.015−8.03−6.32
Amin−96.8 *−0.97 *−23.9 *−1.77 *0.147 *0.004−1.47 *−0.0300.024−9.2−10.49 *
max10.2−0.12−10.0 *−0.090.047−0.031 *0.14−0.158 *−0.097 *−6.2−0.49
mean−41.3−0.41−17.2 *−1.00 *0.107 *−0.012 *−0.74−0.109−0.027−8.2−6.16
summerBmin−27.9−2.24 *−19.3 *0.290.197 *0.0041.14 *0.0590.068 *−6.76−5.21
max121.1 *−0.71−9.31.30 *0.347 *0.036 *0.250.213 *0.01411.24 *10.79 *
mean62.4 *−1.33 *−13.4 *0.89 *0.229 *0.024 *0.430.1210.039−1.431.12
Amin20.3−2.02 *−18.5 *0.590.160 *0.0071.16 *−0.0810.050 *−8.76−4.21
max172.1 *−1.49 *−19.3 *1.54 *0.390 *0.078 *−0.360.141 *0.00118.24 *4.79
mean82.5 *−1.76 *−18.9 *0.93 *0.210 *0.035 *0.320.0530.0260.070.12
autumnBmin−81.5 *−0.76 *−12.3 *0.350.191 *−0.009−0.28−0.071−0.029−16.9 *−2.8
max4.60.35−2.6−0.59−0.109 *0.041 *0.16−0.022−0.013−3.92.6
mean−28.6−0.23−6.1−0.0930.013 *0.009−0.092−0.053−0.020−10.9 *0
Amin−59 *−1.21 *−12.3 *0.64 *0.211 *−0.009−0.34−0.054−0.025−16.9 *−2
max−1.40.80 *−0.4−0.41−0.109 *0.031 *0.160.005−0.009−3.94.4
mean−24.9−0.04−5.9−0.0890.121 *0.005−0.155−0.034−0.016−10.9 *0.97
winterBmin−38.8−1.0 *−6.9−1.30 *−0.180 *−0.020 *−0.60−0.045−0.011−24 *0
max40.7 *−0.1−4.2−0.21 *0.0500.010 *−0.02−0.212 *−0.084 *−10 *−3.15
mean6.7−0.63 *−5.7−0.84 *−0.110 *−0.012 *−0.38−0.125−0.040−18.7 *−1.82
Amin−36.1−1.3 *−9.7−1.42 *−0.190 *−0.020 *−0.60−0.030−0.011−24 *−3.15
max21.8−0.76 *−4.5−0.57 *0.0600.025 *−0.16−0.220 *−0.074 *−11 *−0.15
mean−6.1−1.03 *−6.5−0.93 *−0.108 *0.001−0.31−0.112−0.040−18.5 *−1.65
Notes: The results for the BACI analysis of seasonal differences in water quality parameters between the control point (C) and before and after the dam (B, A). The maximum values are given for each season. Thus, positive differences in the mean relative difference indicate an increase in value, and negative differences, a decrease in value. * Statistically significant differences for p < 0.05.
Table 3. Mean BACI values.
RiverHabitatsECBOD5CODTNN-NH4N-NO2N-NO3TPP-PO4SO42−Cl
TyśmienicaB−26.43−0.30−2.90−0.3920.0333−0.0103 *−0.1100−0.1390−0.0433−7.08−3.16
A−34.88−0.58−8.73−0.737 *0.0480−0.0100 *−0.5525−0.1588 *−0.0598 *−5.45−2.84
PiwoniaB−0.47−0.60 *−9.56−0.1630.09000.0023−0.1480−0.0148−0.0090−9.77−2.71
A2.53−0.81 *−12.16 *−0.2730.1033 *0.0073−0.2243−0.0707−0.0143−9.38−1.68
Notes: * Statistically significant differences for p < 0.05.
Table 4. Impact of Habitats, Season and Land Use on changes in water quality parameters.
ParameterHabitatsSeasonLand useHabitats:
Season
Habitats:
Land Use
Season:
Land Use
Habitats: Season: Land Use
EC0.1970.0442 *4.59 × 10−7 ***0.3990.3940.3770.599
BOD50.1394.23 × 10−4 **0.0016 **0.3990.3990.0229 *0.506
COD0.1960.2720.0271 *0.3980.3990.4280.599
TN0.1510.2423.33 × 10−5 ***0.3960.3900.6600.604
N-NH40.1744.09 × 10−6 ***1.36 × 10⁻⁵ ***0.3990.3890.0079 **0.599
N-NO20.1910.0513 * 5.11 × 10−5 ***0.3880.3860.7380.546
N-NO30.1810.0611 *5.82 × 10−4 ***0.3880.3960.1980.598
TP0.1931.36 × 10−5 ***9.40 × 10⁻⁴ ***0.3960.3970.1940.449
P-PO40.1855.87 × 10−6 ***1.13 × 10⁻⁵ ***0.3980.3960.1350.557
SO42−0.1383.66 × 10−6 ***0.4620.3720.3920.4860.600
Cl0.1960.1042.01 × 10−4 ***0.3980.3940.1810.598
Notes: Statistically significant dependence: *** (p = 0.001). ** (p = 0.01). * (p = 0.05).
Table 5. Water quality parameters in relation to land use in Tyśmienica and Piwonia Rivers.
ParametersMeadowsScrubsForestTGES
EC423.3 a400.5 a305.25 b576
BOD52.96 a3.09 a2.4 b4.1
COD48.95 a49.70 a45.55 b79
TN3.63 a3.84 a2.55 b4.5
N-NH40.39 a0.22 b0.17 b0.68
N-NO20.019 a0.020 a0.011 b0.03
N-NO30.88 b1.47 a1.01 a2.5
TP0.388 a0.229 a0.153 b0.40
P-PO40.1063 a0.0893 a0.0725 b0.102
SO42−27 27 28 64.8
Cl12.5 a9.5 a4.5 b29.4
Notes: Different letters indicate statistically significant differences at p < 0.05. TGES—threshold good ecological status.
Table 6. Seasonal water quality parameters at Tyśmienica and Piwonia Rivers.
ParametersSpringSummerAutumnWinterTGES
EC351.9 b359.6 ab400.25 a402.05 a576
BOD52.89 b2.65 b3.28 a2.47 c4.1
COD49.00 47.45 47.15 48.55 79
TN3.38 3.34 3.31 3.344.5
N-NH40.16 c0.39 a0.18 c0.27 b0.68
N-NO20.016 ab0.023 a0.012 b0.012 b0.03
N-NO31.20 a1.06 c1.02 c1.09 b2.5
TP0.191 c0.334 a0.229 b0.195 bc0.40
P-PO40.0695 b0.1045 a0.0845 ab0.0955 ab0.102
SO42−26 b31 a27 ab25 b64.8
Cl9.0 7.47.9 10.9 29.4
Notes: Different letters indicate statistically significant differences at p < 0.05. TGES—threshold good ecological status.
Disclaimer/Publisher’s Note: The statements, opinions and data contained in all publications are solely those of the individual author(s) and contributor(s) and not of MDPI and/or the editor(s). MDPI and/or the editor(s) disclaim responsibility for any injury to people or property resulting from any ideas, methods, instructions or products referred to in the content.

