Article

Impact of Snowmelt Conditions on the Isotopic Composition of the Surface Waters of the Upper Ob River during the Flood Period

Institute for Water and Environmental Problems SB RAS, Barnaul 656038, Russia
*
Author to whom correspondence should be addressed.
Water 2023, 15(11), 2096; https://doi.org/10.3390/w15112096
Submission received: 3 April 2023 / Revised: 18 May 2023 / Accepted: 30 May 2023 / Published: 1 June 2023
(This article belongs to the Special Issue Research on Hydrology and Hydrochemistry in Siberia and the Arctic)

Abstract

:
For many of the Siberian rivers, and the Upper Ob in particular, 70–80% of the volume of the annual water runoff is formed during the spring flood. Thus, factors influencing the formation of water runoff during the spring flood are paramount. We explain changes in the isotopic composition of the Upper Ob surface waters by changing different components’ contribution to the runoff water discharge over the spring flood period. We suggest estimating the time of meltwater flow from the Upper Ob watershed to the outlet section using the difference between the date of the complete melting of the snow cover in the catchment area and the date of the maximum light isotope composition of water in the outlet section. We show that a sharp short-term weighting of the isotopic composition of water in the river at the end of the first phase of the flood may be associated with the influx of autumn soil moisture, displaced from the soils by snowmelt waters.

1. Introduction

A significant number of papers on the use of stable water isotopes (deuterium and oxygen-18) in the study of hydrological processes have recently been published [1,2,3,4,5,6,7,8,9,10]. Data on the water isotopic composition allow us to determine the genetic relationship between the surface water and atmospheric precipitation [10,11,12,13], rivers and groundwaters [11,13,14,15]; to quantify the formation of sea-ice [16]; to evaluate the impact of water evaporation and the rate of water exchange [17,18]; and to study the mechanisms of formation of the chemical composition of water masses coming from tributaries [15,19]. In contrast to the analysis of the isotopic composition of atmospheric precipitation, the study of the isotopic composition of river water has a great advantage, since river water reflects the isotopic composition of the entire watershed rather than a single sampling site [20]. At the same time, the formation of the isotopic composition of surface waters is associated not only with the main hydrological cycle and geomorphological and climatic characteristics of the catchment area, but, according to many researchers, it largely depends on the isotopic composition of precipitation falling on the surface of the catchment area [10,21,22].
Since 2002, the International Atomic Energy Agency (IAEA) at the United Nations (UN) has been conducting research under the project “Isotope tracing of hydrological processes in a large river basin”, aimed at studying the isotope composition of water, water balance, and related processes, as well as monitoring environmental changes in the watershed. For this purpose, a global network of data on the isotopic composition of rivers was created— the “Global Network for Isotopes in Rivers”. This project is supported by leading research institutes and universities of the world [6,23]. The use of water isotope data is a common tool in hydrological models as it helps in understanding the processes of the water cycle and identifying sources of water masses [8,24,25,26,27]. Models of hydrological processes using stable isotopes of water as indicators are built mainly for watersheds of temperate and warm climates and are poorly represented for watersheds with long-term seasonal snow cover. Therefore, such studies are especially important for the territory of Siberia, where the rivers are completely covered with ice for a significant part of the year, and their catchment area is covered with a thick layer of snow in winter.
Among the Siberian rivers, the Ob River has the largest catchment area, occupying almost the entire territory of Western Siberia. In this regard, the assessment of the effect of the snowmelt stage on the water balance of the Upper Ob system (south of Western Siberia) during the open-water period provides important information for understanding the features of hydrological processes occurring at the initial stage of the formation of the Ob River runoff at the northern border of the Central Asian watershed.
In this work, we used the stable isotopes of oxygen and hydrogen in precipitation, snow cover, and river water to study the sources of water runoff formation in the territory of the Upper Ob watershed (outlet section in Barnaul) and to assess their contribution to the water balance of the river during the snowmelt and flood period.

2. Materials and Methods

2.1. Study Area

The studied catchment area of the Upper Ob (Figure 1a) is typically flat. The water regime in this section of the river is formed by glacial and snow feeding, groundwater, and summer precipitation [28]. The climate in the catchment area is continental, characterized by hot summers and cold winters, and is formed as a result of frequent changes in air masses coming from the Arctic, Central Asia, and the Atlantic. Average annual temperatures are positive at approximately 0.5–2.1 °C. Average maximum temperatures in July are 26–28 °C, and average minimum temperatures in January are (−20)–(−24) °C. The average annual precipitation is 433 mm, about 65% of which falls during the warm period of the year [29]. The snow cover is established mainly in mid-November and collapses in early April; its average depth is 40–60 cm [30]. The relief of the study area is determined by the Ob plateau and the valleys of the Ob River and its tributaries. The left-bank part of the catchment area is located at an altitude of 185–251 m. It is composed of loams in the upper layers and heavy loams in the lower layers; clay outcrops are also noted everywhere [31]. The right bank of the river is floodplain everywhere, up to 10 km wide, with numerous lakes, oxbow lakes, and channels. The altitude of the floodplain is 3–4 m [32,33]. Alluvial formations of the first–third floodplain terraces represented by sands of various compositions and loams are distributed here [34].
The width of the river at the sampling site is about 500 m (Figure 1b), and the depth varies on average from 2–3.5 m during the low-water to 6–8 m during the high-water period. Freezing is usually established by mid-November and lasts for five months. The thickness of the ice layer on the river by the end of the winter period reaches 0.9–1.1 m. In mid-April (or the first ten days of April, at the earliest), the Ob River opens up and the ice drift begins. The periods for the maximum flow and the beginning and the end of the flood period fluctuate significantly from year to year. The hydrograph of the Ob River is characterized by an extended spring–summer flood, in which two phases (waves) can be distinguished, and stable autumn and winter low-water periods. Up to 70–80% of the river’s annual runoff passes during the flood period [30,33]. The first phase of the spring flood, associated with the melting of snow from the catchment area of the river, occurs from the end of April. This snowmelt phase includes 15–20% of the total runoff during the entire flood. The waters of this phase largely accumulate in the Ob channel, rarely reaching the floodplain. The maximum levels and floodplain flooding for up to 2–3 months are observed during the second main flood phase, which occurs in May–June and is associated with melting of the snow cover and glaciers in the sources of the Ob River in the mountains [35].

2.2. Sampling

Sampling of the surface water was carried out at the outlet section of the Ob River before the city of Barnaul at three verticals (left bank, middle, right bank) every two weeks from early-March to mid-July (from the end of the winter low-water period to the end of the flood) in 2020–2021. A schematic map of the water sampling sites is shown in Figure 1b. Sampling was carried out with a bathometer at a depth of 20 cm from the water surface. Sampling was carried out through drilled holes in the ice during the freeze-up period (for safety reasons, before the ice drift, sampling was carried out only at two verticals near the riverbank), and a boat was used for sampling during the open-water period (after the ice drift). The collected samples were placed in a hermetically sealed plastic container and delivered to the laboratory, where they were filtered through a membrane filter with a 0.45 μm pore diameter using sterile syringes and Minisart NML Plus syringe nozzles. Three to five parallel samples were taken from the resulting filtrate and placed in sealed test tubes, which were stored in a refrigerator until isotopic analysis.
Rain samples were collected during August–October and then during April–June immediately after they fell on the experimental site located on the roof of the building of the Institute for Water and Environmental Problems of the Siberian Branch of the Russian Academy of Sciences (IWEP SB RAS), at a height of 25 m from the ground. Samples were passed through a funnel into a plastic flask-receiver. After the end of rainfall, the flask-receiver was disconnected from the funnel, and the volume of the sample was measured and filtered through the membrane filter with a 0.45 μm pore diameter (using sterile syringes and Minisart NML Plus syringe nozzles). Three to five parallel samples were taken from the resulting filtrate and placed in sealed test tubes, which were stored in a refrigerator until isotopic analysis.
It is known that the snow cover of temperate and polar latitudes as a whole determines the integral seasonal (for the winter period) characteristics of the isotopic composition of moisture entering the study area [36,37]. For the watersheds of a cold climate, the contribution of winter precipitation to the water runoff occurs only from the beginning of the snowmelt period; therefore, the bulk snowpack sampled just before the snowmelt is a convenient object for studying the distribution of winter snowfalls over the catchment area. For this purpose, the bulk snowpack samples were taken at the sites of the network located in the catchment area above the studied outlet section (Figure 1a) at the time of maximum snow accumulation (during 10–14 March in 2020 and 15–18 March in 2021). All sites were located in a field on flat territory free from trees and bushes. Sampling was performed using the envelope method (10 m × 10 m). The composite sample consisted of 5 snow pits collected with a plastic pipe of 4.5 cm inner diameter. After collection, composite samples of the snowpack were placed in clean tight-closing plastic bags and stored frozen until analysis. Before instrumental analysis, snow samples were transferred into specially prepared closed plastic containers [36] and melted at room temperature. Then, by analogy with river and rain waters, they were filtered through a membrane filter with 0.45 μm pore diameter; three to five parallel samples were taken from the resulting filtrate and placed in sealed test tubes.
Over the 2 years, 147 samples (55 surface water, 24 snowpack, 24 rainfalls in the spring–summer of the current year, and 44 rainfalls in the autumn of the previous year) were taken and analyzed.

2.3. Analytical Methods

The main experimental and theoretical positions of the isotopic systematics of deuterium and oxygen-18 were developed in the works of Craig and Dansgaard [38,39]:
δ = [(Rsample/Rstd) − 1] × 1000‰,
where Rsample and Rstd are the ratios of 2H/1H and 18O/16O in the measured sample and in the standard, respectively.
The relationship between the ratio of stable isotopes of oxygen (δ18O) and hydrogen (δD or δ2H) in precipitation is described by an empirical relationship called the global meteoric water line (GMWL) [38,40]:
δD = 8 × δ18O + 10,
The ratio of δ18O and δD in precipitation at a given location can be described by its local meteoric water line (LMWL), whose deviation from GMWL can be used to estimate the isotope fractionation of local precipitation. In isotope studies, the calculation criterion d-excess proposed by Dansgaard [39] is used for this purpose, together with measurements of δ18O and δD. The d-excess parameter is associated with the kinetic processes of isotope fractionation, which characterize the processes of evaporation or freezing. Seasonal variations in d-excess can provide information about moisture sources and their hydrological cycle, as well as the influence of local climatic conditions [41]. The deuterium excess (d-excess) is calculated as:
d-excess = δD − 8 × δ18O,
The stable isotope (δ18O, δD) analysis of samples was carried out at the Chemical Analytical Center of IWEP SB RAS. The analysis was performed by laser absorption IR spectrometry on a PICARRO L2130-i instrument (WS-CRDS). The measurement accuracy of δD and δ18O (1σ, n = 5) was ±0.4‰ and ±0.1‰, respectively. International standards GRESP and USGS-47 were used for instrumental calibration.
Precipitation-weighted mean values of stable isotope compositions (δD, δ18O, and d-excess) in precipitation for a certain period were calculated by the formula:
Cvwm = ( Cj · Qj ) Q
where Cvwm is the precipitation-weighted mean values for the calculated period, ‰; Cj is the value of δD, δ18O, or d-excess in the j-th precipitation sample, ‰; Qj is the amount of the j-th precipitation sample, mm weq.; and Q is the total precipitation amount for the calculated period, mm weq.

3. Results

The study of the isotopic composition of surface water in the Ob River near Barnaul City showed that over the period from March 15 to July 15, its isotopic composition varied: δ18O from −15.8‰ to −14.7‰ and δD from −121.4‰ to −112.8‰ in 2020; δ18O from −16.1‰ to −14.7‰ and δD from −122.9‰ to −112.9‰ in 2021. At the same time, the average values of the isotopic composition of water for the period under study were close to each other in different years and amounted to −15.2‰ for δ18O and −117.0‰ for δD in 2020 and −15.4‰ for δ18O and −117.5‰ for δD in 2021. The average values of deuterium excess (4.7‰ in 2020 and 5.7‰ in 2021) indicate some depletion in deuterium atoms (δD) relative to δ18O in the surface water.
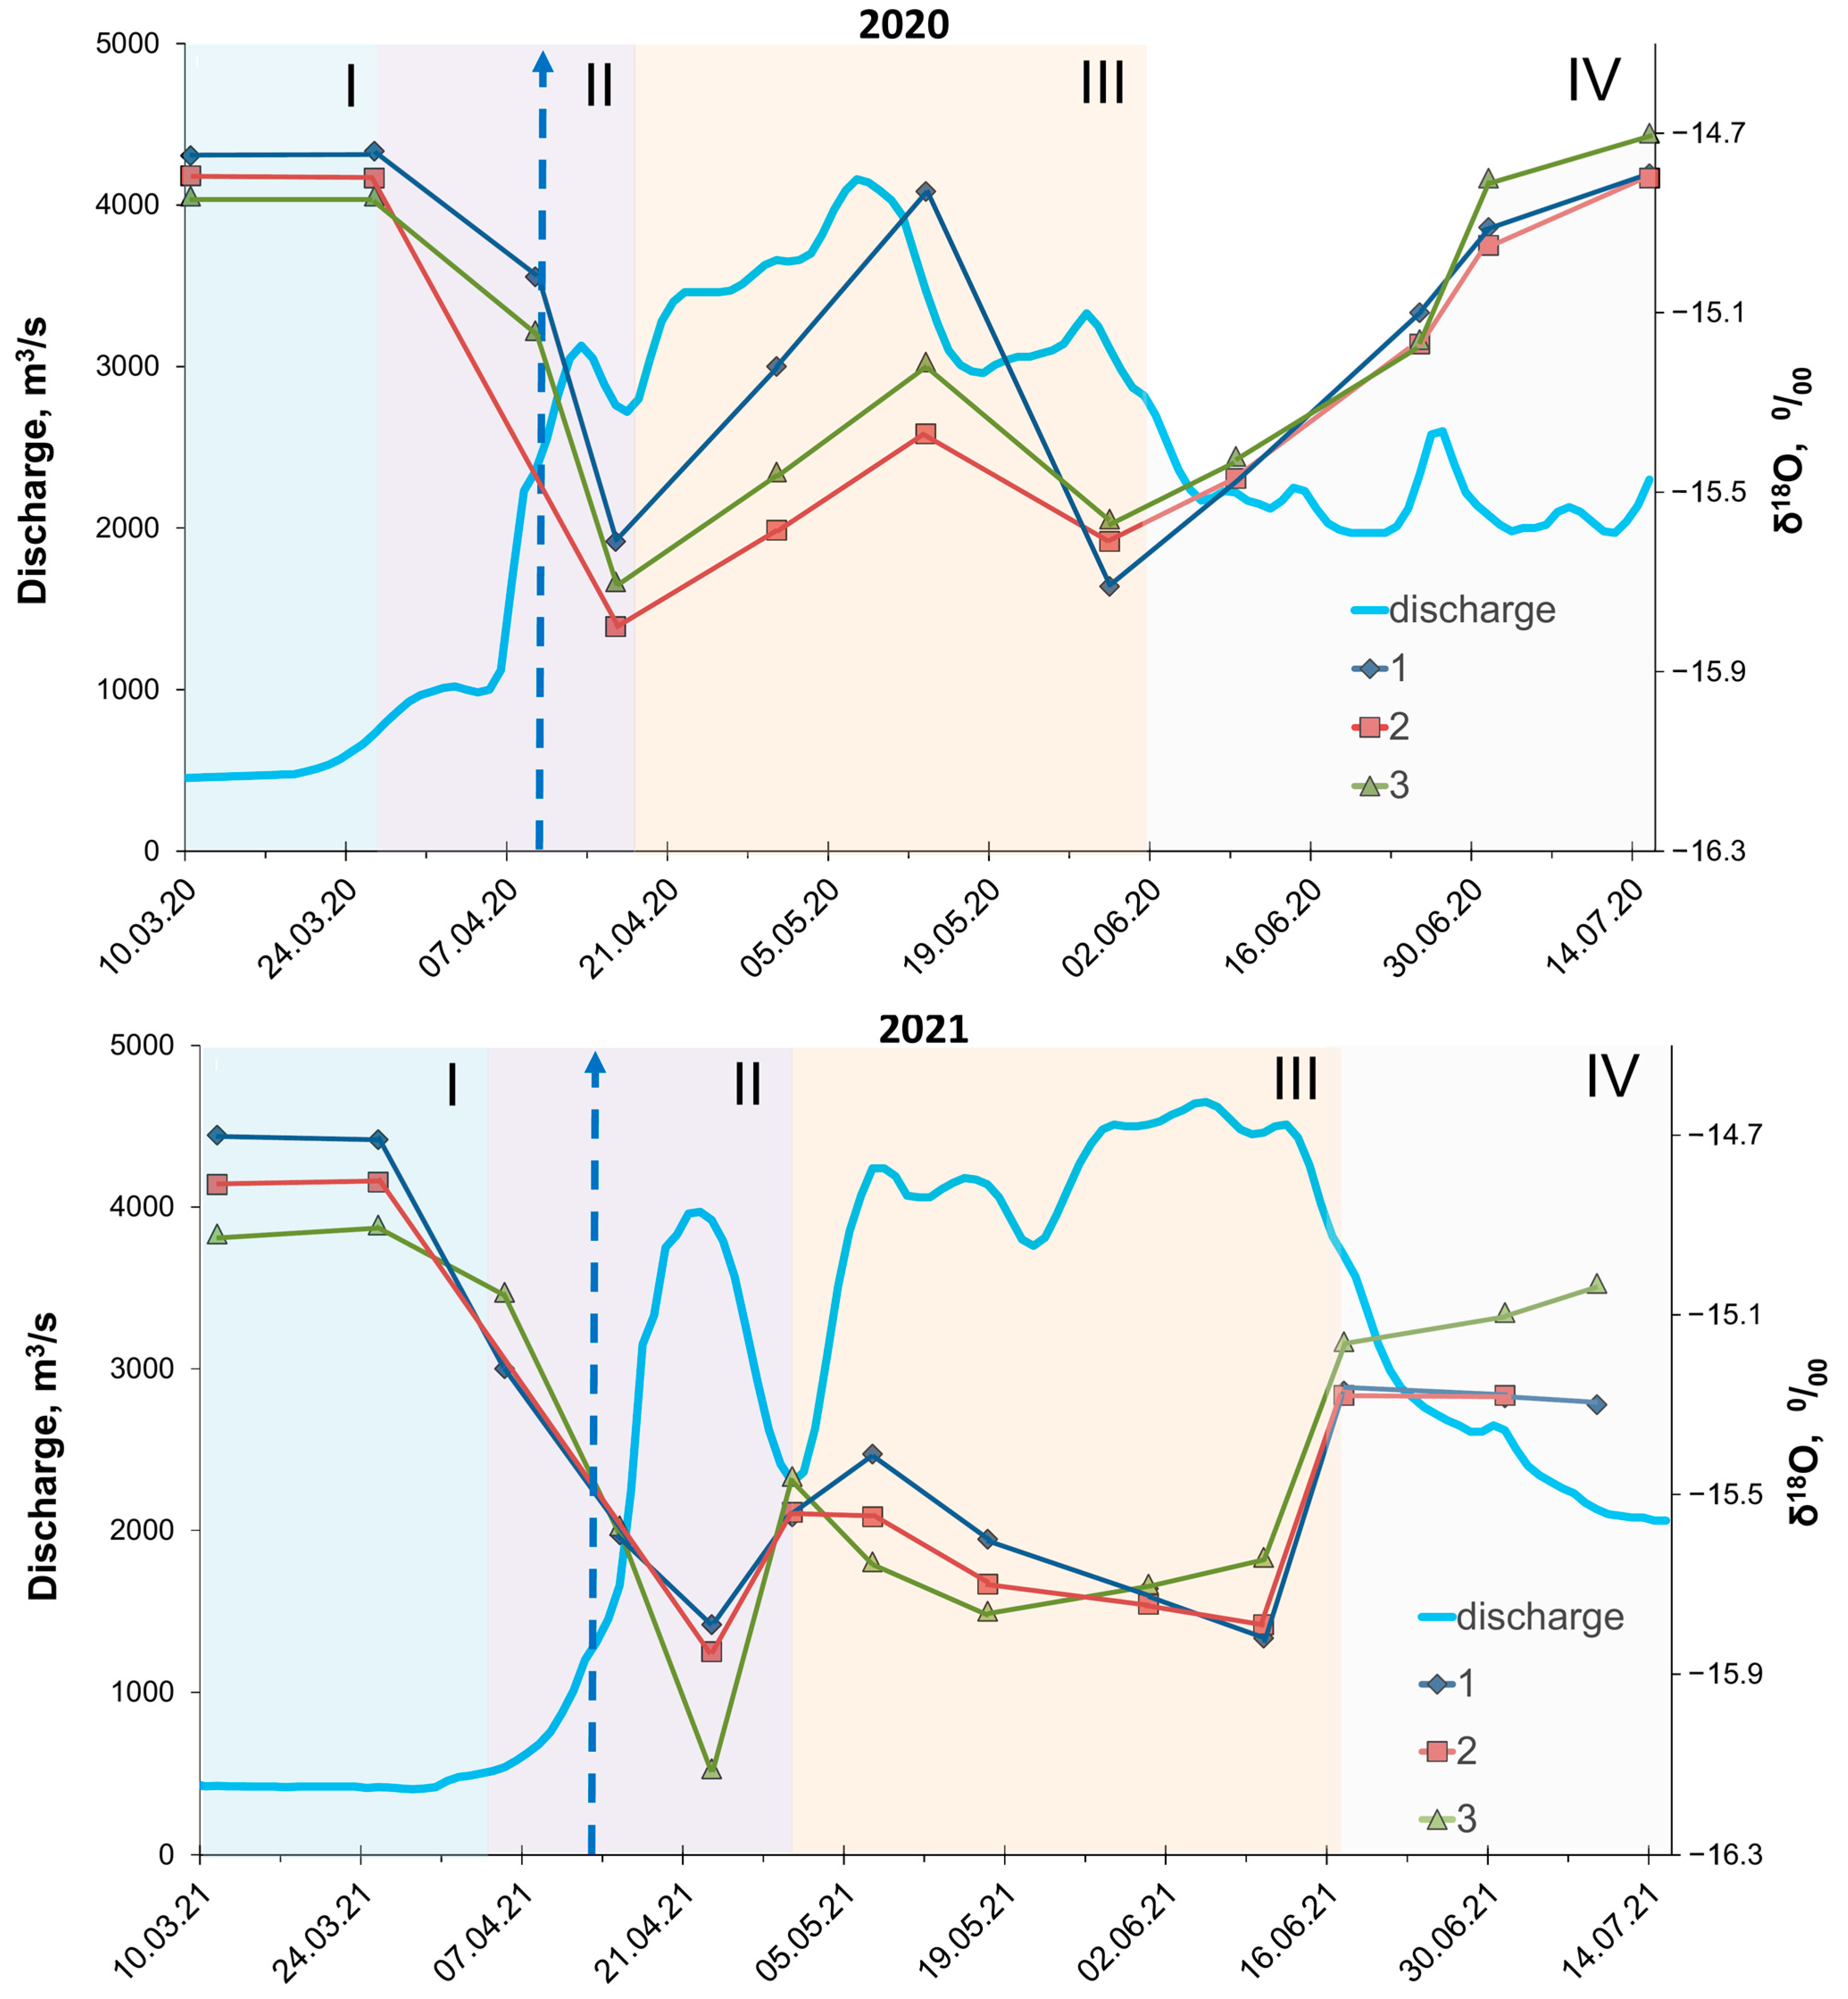
To analyze the temporal variability of the isotope composition of water in the Ob River during the spring flood, curves of the change in water discharge and water isotopic composition (δ18O) were plotted for three verticals of the river outlet section from 15 March to 15 July 2020 and 2021 (Figure 2). The water-discharge curve was constructed according to data from the daily discharges measured at the hydro-meteorological station located 300 m downstream from the sampling site [42]. This curve makes it possible to identify the phases of the water regime in accordance with the change in the values of the water discharge in the river section. For the Upper Ob, it often happens that the first and the second flood phases overlap each other and are not identified on the discharge curve [30,33]. In our case, especially for 2021, the flood phases can be distinguished.
In 2020 and 2021, the lightest isotopic compositions of river water were at the end of the first and second flood phases (Figure 2), while in each year, at the beginning of the second flood stage, a short-term weighting of the isotopic composition of water (by 0.5–0.9‰ in terms of δ18O) was observed. Temporal changes in the isotopic composition of water at different verticals of the river for both years also have a similar character (with small local differences).
Table 1 presents the average values of the isotopic composition of water in the Ob outlet section near Barnaul in the different seasons of the hydrological regime of the river in 2020 and 2021: the winter low-water (under-ice period), the first phase of the spring flood (snowmelt period, opening of the river from ice), and the second phase of the spring flood (melting of snow and glaciers in the mountains at the source of the Ob River). For comparison, the table contains the precipitation-weighted mean values of the isotope composition of rainfall during the autumn period of the previous year (from August to October) and during the current flood period, as well as the depth-weighted mean values of the snow cover of the past winter.
According to the results of the analysis of the snow cover, the average value of the isotopic composition of atmospheric precipitation was −20.3‰ for δ18O and −157.8‰ for δD in winter 2019–2020, and it was −19.8‰ for δ18O and −151.3‰ for δD in winter 2020–2021 (Table 1).
The data in Table 1 indicate similar average values of the isotopic composition of surface water in the Ob outlet section in the different hydrological seasons of 2020 and 2021. For all studied hydrological seasons, the difference in values between 2020 and 2021 was 0.2–0.3‰ for δ18O and 0.1–0.8‰ for δD. At the same time, the heaviest isotopic composition of water was observed in the winter low-water period, and in the first phase of the flood, it was lighter relative to the winter low-water period by 0.6–0.7‰ and 4.4–5.1‰, and in the second phase by 0.6‰ and 5.2–5.4‰ for δ18O and δD, respectively. The value of the deuterium excess (d-excess) in all studied hydrological periods indicates that the river water was affected by evaporative fractionation. Among all objects of study, snowmelt waters had the lightest isotopic composition, and the difference between the average values between years was quite small (0.5‰ for δ18O and 6.5‰ for δD). The spring–summer rainfall had the heaviest isotopic composition, and the autumn precipitation significantly affected by evaporative fractionation was the most depleted in deuterium atoms (δD) relative to δ18O.

4. Discussion

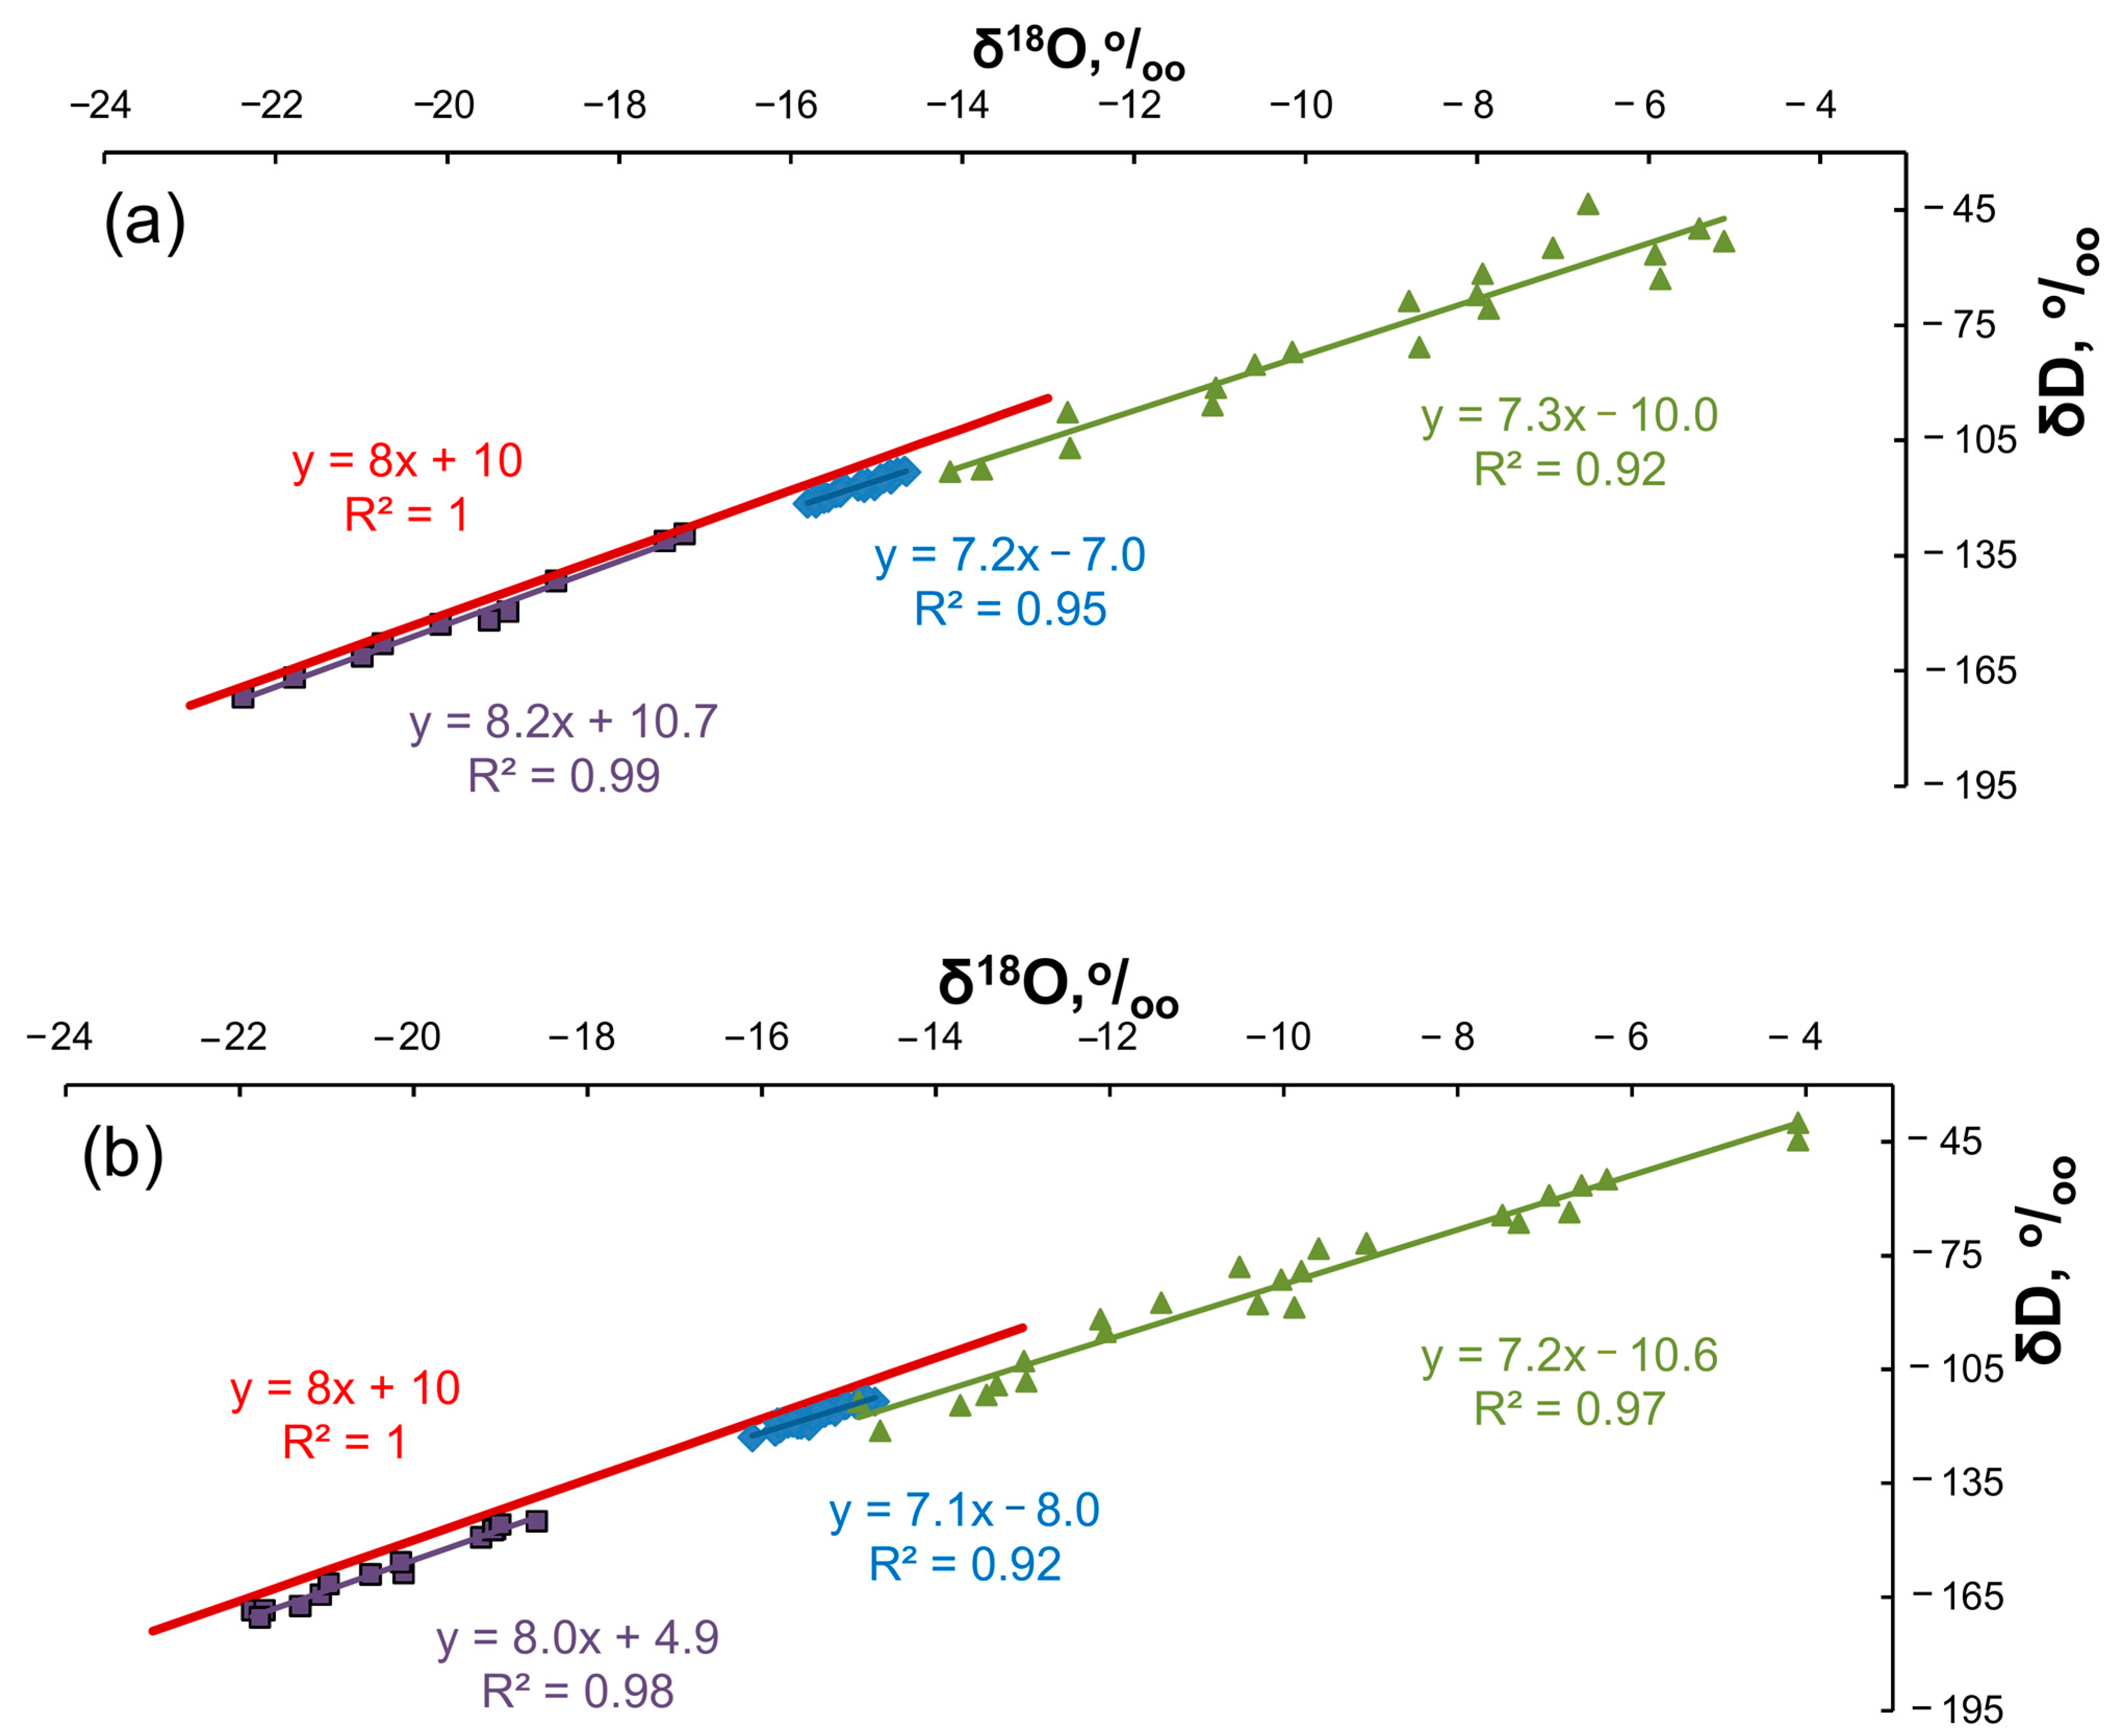
The local meteoric water lines (LMWLs) for the Ob River water during the spring–summer flood period in 2020 and 2021, as well as for the snowpack melting water in the catchment area in 2020 and 2021 and autumn rainfalls in previous 2019 and 2020, are shown in Figure 3. For comparison, the figure also shows the global meteoric water line (GMWL). It follows from Figure 3 that for both years, the values of the slope coefficients in the LMWL equations for rainfalls and river water are somewhat lower than the slope of the global meteor water line (GMWL) described by the equation δD = 8 × δ18O + 10 [38], while the slope of LMWL for the snow cover did not differ from the GMWL one. The slopes of LMWL equations for rainfalls and river water indicate the process of evaporative fractionation of their initial isotopic composition of water or moisture, and the values of d-excess (Table 1) indicate maximum depletion in deuterium atoms relative to δ18O for autumn precipitation.
Figure 3 clearly shows that the isotopic composition of the surface water samples in the outlet section occupies an intermediate position between the samples of autumn precipitation and snowpack. Additionally, as expected, the range of variation in the values of the isotopic composition for individual events (autumn precipitation) is much larger than the scatter of values for integral media (samples of river water in the outlet section and samples of bulk snowpack).
Using the data from Table 1, and taking into account that during the flood period, the contribution of groundwater runoff and spring precipitation to the water flow in the river can be neglected, the contribution of the autumn rain and snow precipitation to the water flow in the river at the outlet section was estimated for the snowmelting period (the first phase of the flood). For a preliminary assessment of the autumn rain and snow contributions, the following equations were solved:
( 20.3 ) · X + ( 10.2 ) · ( 1 X ) = ( 15.4 )   for   2020
( 19.8 ) · X + ( 12.6 ) · ( 1 X ) = ( 15.7 )   for   2021
where X is the share of snowmelt water in the river runoff, (1 − X) is the share of autumn precipitation in the river runoff; and the numbers are the average values of the isotopic composition of the surface water, autumn precipitation, and snow cover (Table 1).
Solving these equations showed that during the snowy winter of 2019–2020 (where snow cover reached up to 170 mm weq.) and lower autumn precipitation in 2019, the contribution of melted snow to the water flow in the outlet section during the first phase of the flood in 2020 reached 52%, while during winter 2020–2021 (snow cover reached only 115 mm weq.) and a larger amount of autumn rainfall in 2020, it dropped to 43% in 2021.
Figure 2 shows that the isotopic composition of the water in the Ob River begins to become lighter due to snowmelt more than a week before the ice drift, and the sharpest change in the isotopic composition was observed in the spring of 2021, although a rise in the water level and an increase in water discharge were noted earlier in 2020 [37,43,44]. In our opinion, these differences can be associated with the conditions of snow accumulation, the main characteristics of which are given in Table 2 for the winters of 2019–2020 and 2020–2021.
Reference information on meteorological parameters (daily data on air temperature, precipitation, snow depth) of the study area (Table 2) was taken from the site “Specialized data sets for climate studies” [45], where, among other data, data from the weather station located in the suburbs of Barnaul were published. Based on these daily data, we calculated the average monthly daily air temperatures during the winters 2019–2020 and 2020–2021. In addition, we determined the day of the beginning of the formation and the end of the melting of the snow cover (according to daily data on snow depth from 0 cm in early November to 0 cm by early April) and the time of the onset of the climatic spring (the beginning of stable positive average daily temperatures), as well as the depth of the snow cover at the first low winter temperatures (<−25 °C) lasting more than three days. The data presented in the “standard average” column in Table 2 were taken from [34].
The authors [46], when studying the features of floods on the tributaries of the Upper Ob, concluded that if the height of the snow cover in the watershed before the onset of significant frosts is more than 20–25 cm, then the soil under the snow does not freeze and melt water intensively penetrates and is retained in the soil in the spring. According to Table 2, stable snow cover in the study catchment area was established on 13 November for both years; however, the depth of snow cover before the first severe frosts lasting more than three days was 20 cm at the beginning of winter 2019–2020 and only 10 cm at the beginning of winter 2020–2021. Thus, in the winter of 2020–2021, deep freezing of the soil could have occurred, and melted snow water of light isotope composition (Table 1) could have directly flowed to the riverbed along the frozen soil surface during the snowmelt from 5 to 13 April 2021 (Table 2), which could explain the sharp change in the isotopic composition of river water from the very beginning of the snowmelt (Figure 3).
The climatic spring in 2020 began a week earlier than in 2021, but since the soil under the snow was not frozen, the first portions of meltwater were absorbed and retained by the upper soil layer, and a sharp change in the isotopic composition of a river water began only by the end of the snowmelt (by 09.04.2020, Table 2 and Figure 2).
The lowest values of the isotope composition of river water in the first phase of the spring flood indicate the maximum contribution of snowmelt water to the water discharge in the riverbed. Therefore, using the difference between the date of the complete melting of the snow cover in the catchment area and the date of its maximum contribution to the river discharge (the lightest isotope composition of water in the outlet section), it is possible to estimate the time it takes for meltwater to flow from the surface of the Upper Ob catchment area (the section of the river from Biysk to Barnaul) to the outlet section. In 2020, the end of the snowmelt fell on 9 April, and in 2021 on 13 April (Table 2), while the maximum contribution of meltwater was on 20 April in 2020, and on 23 April in 2021 (Figure 2). From here, the time for the melted snow runoff to reach the outlet section in 2020 was 11 days, and in 2021, 10 days. It should be noted that during the first phase of the spring flood, as a rule, a small amount of precipitation falls in the region under study (in 2020 and 2021, the amount of rainfall was 5 and 4 mm, respectively), which, in our opinion, does not warrant significant adjustments in the calculation of the time for melted snow water to reach the outlet section.
Both in 2020 and 2021, during the first phase of the flood, the weighting of the isotopic composition of water in the river outlet section begins with a decrease in the peak of water discharge (Figure 2). We associate the initial stage of the weighting of the isotope composition of water with the possible discharge of groundwater due to the expulsion of autumn moisture by snowmelt waters. During this period, the groundwater flow is a mixture of last year’s autumn rainfall and melted snow water of the current year.
In the second phase of the spring flood, changes in the isotopic composition of river water are determined by the mixing of relatively isotopically heavy spring–summer rainfalls and maximally isotopically lighter melt snow and glacial waters in the high mountains at the source of the Ob River. At this time, due to the maximum high-water level in the river (Figure 2), the contribution of groundwater to the Ob runoff is significantly reduced, so the inflow of rainwater is mainly associated with surface flat runoff. As in the case of snowmelt, by the end of the second phase of the flood, the lowest values of the isotopic composition of river water are noted. This situation characterizes the maximum contribution of melted snow and glacier waters from the high mountains of the Ob source to the water flow in the river channel at the outlet section.

5. Conclusions

This paper determined the features of the formation of water runoff in the outlet section of the Ob River near Barnaul during the spring floods in 2020–2021 using the stable isotope composition of these runoff components, namely, the snow cover of the catchment area, as well as river water and rain precipitation in different phases of the hydrological regime of the river. For the Siberian rivers, and for the Upper Ob in particular, the study of the factors influencing the formation of water runoff during the spring flood is very important, because 70–80% their annual water runoff occurs during the spring–summer flood. In the present study, we paid special attention to the first phase of the flood (the snowmelt period). The results can be summarized as follows:
  • The lightest isotopic composition of the Upper Ob River water occurred at the end of the first and the second flood phases due to the influx of melted snow from the flat catchment area (first phase), and then due to melted snow and glacial waters from the high mountains (second phase).
  • In our opinion, a short-term weighting of the water isotope composition by 0.5–0.9‰ in terms of δ18O at the beginning of the second stage of the flood is attributed to the discharge of groundwater due to the expulsion of autumn moisture by snowmelt waters. During this period, the groundwater flow is a mixture of last year’s autumn rainfalls and the melted snow water of the current year.
  • The main factors controlling the rate and volume of snowmelt water flow from the catchment area to the Upper Ob channel are the initial conditions of the snow cover formation (autumn moisture content and freezing of the soil in the catchment area at the beginning of winter). Therefore, monitoring these conditions will allow the prediction of the magnitude and features of the first phase of the flood.
  • An assessment of the rain and snow contributions to the Upper Ob River runoff during the snowmelt period was carried out using the average values of the isotopic composition of the surface water, the precipitation-weighted mean of autumn rainfalls, and the depth-weighted mean of snow cover. The calculations showed that the contributions of the melted winter snow and autumn rainfalls from the previous year to the river water flow were, respectively, 52% and 48% in spring 2020 and 43% and 57% in spring 2021.
  • The difference between the date of complete melting of the snow cover in the catchment area and the date of the maximum light isotopic composition of water in the outlet section was proposed for estimating the time for meltwater runoff from the catchment area to the outlet section. This substantiated approach allowed us to estimate the time for the melted snow runoff to reach the outlet section of the Upper Ob River, being 11 and 10 days in 2020 and 2021, respectively.

Author Contributions

Conceptualization, T.P.; methodology, T.P. and A.E.; sampling, A.K. and T.N.; analyses, A.E.; investigation, A.E., A.K. and T.N.; writing—original draft preparation, T.P., A.E. and T.N.; writing—review and editing, T.P.; visualization, T.N.; resources and funding acquisition, T.P. All authors have read and agreed to the published version of the manuscript.

Funding

This research was carried out within the framework of the state task of the IWEP SB RAS.

Data Availability Statement

The data presented in this study are available from the corresponding author (Tatyana Papina) on reasonable request.

Acknowledgments

The authors are grateful to the researchers of the Institute for Water and Environmental Problems of the SB RAS; to Maria Panina, for her help with sampling the snowpack and atmospheric precipitation; and to Alexander Dyachenko, for the data on the vertical distribution of the flow velocity and depth values of the Ob River at the sampling point.

Conflicts of Interest

The authors declare no conflict of interest.

References

  1. Gat, J.R. Oxygen and hydrogen isotopes in the hydrologic cycle. Annu. Rev. Earth Planet. Sci. 1996, 24, 225–262. [Google Scholar] [CrossRef]
  2. Gibson, J.J.; Aggarwal, P.; Hogan, J.; Kendall, C.; Martinelli, L.A.; Stichler, W.; Rank, D.; Goni, I.; Choudhry, M.; Gat, J.; et al. Isotope studies in large river basins: A new global research focus. Eos. Trans. AGU 2002, 83, 613–617. [Google Scholar] [CrossRef]
  3. Kendall, C.; Doctor, D.H. Stable Isotope Applications in Hydrologic Studies. In Treatise on Geochemistry, 1st ed.; Turekian, K.K., Holland, H.D., Eds.; Elsevier: Amsterdam, The Netherlands, 2003; Volume 5, pp. 319–364. [Google Scholar]
  4. Gibson, J.J.; Birks, S.J.; Yi, Y.; Vitt, D.H. Runoff to boreal lakes linked to land cover, watershed morphology and permafrost thaw: A 9-year isotope mass balance assessment. Hydrol. Process. 2015, 29, 3848–3861. [Google Scholar] [CrossRef]
  5. Gibson, J.J.; Yi, Y.; Birks, S.J. Isotope-based partitioning of streamflow in the oil sands region, northern Alberta: Towards a monitoring strategy for assessing flow sources and water quality controls. J. Hydrol. Region. Stud. 2016, 5, 131–148. [Google Scholar] [CrossRef]
  6. Ala-aho, P.; Soulsby, C.; Pokrovsky, O.S.; Kirpotin, S.N.; Karlsson, J.; Serikova, S.; Vorobyev, S.N.; Manasypov, R.M.; Loiko, S.; Tetzlaff, D. Using stable isotopes to assess surface water source dynamics and hydrological connectivity in a high-latitude wetland and permafrost influenced landscape. J. Hydrol. 2018, 556, 279–293. [Google Scholar] [CrossRef]
  7. Beria, H.; Larsen, J.R.; Ceperley, N.; Michelon, A.; Vennemann, T.; Schaefli, B. Understanding snow hydrological processes through the lens of stable water isotopes. Wiley Interdiscip. Rev. Water 2018, 5, e1311. [Google Scholar] [CrossRef]
  8. Bowen, G.J.; Cai, Z.; Fiorella, R.P.; Putman, A.L. Isotopes in the Water Cycle: Regional-to Global-Scale Patterns and Applications. Annu. Rev. Earth Planet. Sci. 2019, 47, 453–479. [Google Scholar] [CrossRef]
  9. Nan, Y.; Tian, F.; Hu, H.; Wang, L.; Zhao, S. Stable Isotope Composition of River Waters across the World. Water 2019, 11, 1760. [Google Scholar] [CrossRef]
  10. Lucianetti, G.; Penna, D.; Mastrorillo, L.; Mazza, R. The Role of Snowmelt on the Spatio-Temporal Variability of Spring Recharge in a Dolomitic Mountain Group, Italian Alps. Water 2020, 12, 2256. [Google Scholar] [CrossRef]
  11. Earman, S.; Campbell, A.R.; Phillips, F.M.; Newman, B.D. Isotopic exchange between snow and atmospheric water vapor: Estimation of the snowmelt component of groundwater recharge in the southwestern United States. J. Geophys. Res-Atmos. 2006, 111, 1–18. [Google Scholar] [CrossRef]
  12. Ala-aho, P.; Welker, J.M.; Bailey, H.; Hojlund Pedersen, S.; Kopec, B.; Klein, E.; Mellat, M.; Mustonen, K.-R.; Noor, K.; Marttila, H. Arctic Snow Isotope Hydrology: A Comparative Snow-Water Vapor Study. Atmosphere 2021, 12, 150. [Google Scholar] [CrossRef]
  13. Feng, M.; Zhang, W.; Zhang, S.; Sun, Z.; Li, Y.; Huan, Y.; Wang, W.; Qi, P.; Zou, Y.; Jiang, M. The role of snowmelt discharge to runoff of an alpine watershed: Evidence from water stable isotopes. J. Hydrol. 2022, 604, 127209. [Google Scholar] [CrossRef]
  14. Meng, Y.; Liu, G.; Li, M. Tracing the Sources and Processes of Groundwater in an Alpine Glacierized Region in Southwest China: Evidence from Environmental Isotopes. Water 2015, 7, 2673–2690. [Google Scholar] [CrossRef]
  15. Živković, K.; Radulović, M.; Lojen, S.; Pucarević, M. Overview of the Chemical and Isotopic Investigations of the Mareza Springs and the Zeta River in Montenegro. Water 2020, 12, 957. [Google Scholar] [CrossRef]
  16. Tang, S.; Qin, D.; Ren, J.; Kang, J.; Li, Z. Structure, salinity and isotopic composition of multi-year landfast sea ice in Nella Fjord, Antarctica. Cold Reg. Sci. Technol. 2007, 49, 170–177. [Google Scholar] [CrossRef]
  17. Jasechko, S.; Gibson, J.J.; Edwards, T.W.D. Stable isotope mass balance of the Laurentian Great Lakes. J. Great Lakes Res. 2014, 40, 336–346. [Google Scholar] [CrossRef]
  18. Gudkov, A.V.; Tolstikhin, I.N.; Tokarev, I.V. The formation and balance of the atmospheric precipitations, surface water, and groundwater on the southern slopes of the khibiny massif (based on data on the isotopic composition of oxygen and hydrogen). Water Resour. 2021, 48, 124–132. [Google Scholar] [CrossRef]
  19. Penna, D.; Meerveld, H.J.; Zuecco, G.; Fontana, G.D.; Borga, M. Hydrological response of an Alpine catchment to rainfall and snowmelt events. J. Hydrol. 2016, 537, 382–397. [Google Scholar] [CrossRef]
  20. Kendall, C.; Coplen, T.B. Distribution of oxygen-18 and deuterium in river waters across the United States. Hydrol. Process. 2001, 15, 1363–1393. [Google Scholar] [CrossRef]
  21. Ogrinc, N.; Kanduc, T.; Stichler, W.; Vreca, P. Spatial and seasonal variations in δ18O and δD values in the River Sava in Slovenia. J. Hydrol. 2008, 359, 303–312. [Google Scholar] [CrossRef]
  22. Koeniger, P.; Leibundgut, C.; Stichler, W. Spatial and temporal characterisation of stable isotopes in river water as indicators of groundwater contribution and confirmation of modelling results; a study of the Weser River, Germany. Isot. Environ. Health Stud. 2009, 45, 289–302. [Google Scholar] [CrossRef] [PubMed]
  23. Gibson, J.J.; Edwards, T.W.D. Regional water balance trends and evaporation-transpiration partitioning from a stable isotope survey of lakes in northern Canada. Glob. Biogeochem. Cycles 2002, 16, 1026. [Google Scholar] [CrossRef]
  24. Wang, X.; Zhang, X.; Zhang, W.; Zhang, X.; Luo, Z. Comparison on Spatial Distribution of Hydrogen and Oxygen Stable Isotope GCM Simulation in Global Precipitation. Adv. Earth Sci. 2017, 32, 983–995. [Google Scholar]
  25. He, Z.; Unger-Shayesteh, K.; Vorogushyn, S.; Weise, S.M.; Kalashnikova, O.; Gafurov, A.; Merz, B. Constraining hydrological model parameters using water isotopic compositions in a glacierized basin, Central Asia. J. Hydrol. 2019, 571, 332–348. [Google Scholar] [CrossRef]
  26. Pu, T.; Wang, K.; Kong, Y.; Shi, X.; Kang, S.; Huang, Y.; He, Y.; Wang, S.; Lee, J.; Cuntz, M. Observing and Modeling the Isotopic Evolution of Snow Meltwater on the Southeastern Tibetan Plateau. Water Resour. Res. 2020, 56, e2019WR026423. [Google Scholar] [CrossRef]
  27. Nan, Y.; He, Z.; Tian, F.; Wei, Z.; Tian, L. Can we use precipitation isotope outputs of Isotopic General Circulation Models to 2 improve hydrological modeling in large mountainous catchments on the Tibetan Plateau? Hydrol. Earth. Syst. Sci. 2021, 25, 6151–6172. [Google Scholar] [CrossRef]
  28. Chernyaev, A.M. Water of Russia. River Basins; FSUE: Moscow, Russia, 2002; p. 572. (In Russian) [Google Scholar]
  29. Borodaev, V.D.; Bulatov, V.I.; Vedukhina, V.G.; Vorobyov, K.V.; Ershova, I.N.; Kalyuzhnaya, T.V.; Kontev, A.V.; Krupochkin, E.P.; Kurepina, N.Y.; Mardasova, E.V.; et al. Barnaul: Scientific Reference Atlas, 2nd ed.; PO Inzhgeodeziya: Novosibirsk, Russia, 2007; p. 112. (In Russian) [Google Scholar]
  30. Kharlamova, N.F. Climate and Seasonal Rhythmics of Barnaul Nature: Monograph; AltSU Publishing House: Barnaul, Russia, 2013; p. 132. (In Russian) [Google Scholar]
  31. Gefke, I.V.; Aleshina, N.I. Physical and geographical characteristics Upper Obi basin. Int. J. Humanit. Nat. Sci. 2019, 11–12, 61–63. (In Russian) [Google Scholar] [CrossRef]
  32. Marusin, K.V.; Dyachenko, A.V.; Kolomeytsev, A.A.; Wagner, A.A. Modern morphodynamics and history of evolution of Ob River at Barnaul City. Bull. AB RGS 2019, 55, 82–92. (In Russian) [Google Scholar]
  33. Shvetsov, A.Y.; Gorlov, E.A. Natural Conditions of Barnaul; Publishing House “New Format”: Barnaul, Russia, 2020; p. 178. (In Russian) [Google Scholar]
  34. Kurkina, T.V. On the State and Environmental Protection of the City District—The City of Barnaul in the Altai Territory in 2020; Publishing House “Skywalker”: Barnaul, Russia, 2021; p. 191. (In Russian) [Google Scholar]
  35. Andreeva, I.V.; Rotanova, I.N.; Tsymbaley, Y.M. Design of water protection zones of rivers with non-linear channels (for example, a section of the Ob River in the Cities of Barnaul). Water Sect. Russ. Probl. Technol. Manag. 2012, 2, 4–16. (In Russian) [Google Scholar]
  36. Papina, T.S.; Eirikh, A.N.; Malygina, N.S.; Eyrikh, S.S.; Ostanin, O.V.; Yashina, T.V. Microelement and stable isotopic composition of snowpack in the Katunsky Biosphere Reserve (Altai Republic). Ice Snow 2018, 58, 41–55. [Google Scholar] [CrossRef]
  37. Papina, T.; Eirikh, A.; Noskova, T. Factors influencing changes of the initial stable water isotopes composition in the seasonal snowpack of the south of Western Siberia, Russia. Appl. Sci. 2022, 12, 625. [Google Scholar] [CrossRef]
  38. Craig, H. Isotopic variations in meteoric waters. Science 1961, 133, 1702–1703. [Google Scholar] [CrossRef] [PubMed]
  39. Dansgaard, W. Stable isotopes in precipitation. Tellus 1964, 16, 436–468. [Google Scholar] [CrossRef]
  40. Rozanski, K.; Aragufis-Aragufis, L.; Gonfiantini, R. Isotopic patterns in modern global precipitation. In Climate Change in Continental Isotopic Records; Swart, P.K., Lohmann, K.C., Mckenzie, J., Savin, S., Eds.; American Geophysical Union: Washington, DC, USA, 1993; Volume 78, pp. 1–36. [Google Scholar]
  41. Tian, L.; Yao, T.; MacClune, K.; White, J.W.C.; Schilla, A.; Vaughn, B.; Vachon, R.; Ichiyanagi, K. Stable isotopic variations in West China: A consideration of moisture sources. J. Geophys. Res. 2007, 112, D10112. [Google Scholar] [CrossRef]
  42. Automated Information System for State Monitoring of Water Bodies. Available online: https://gmvo.skniivh.ru// (accessed on 31 March 2023).
  43. Strelkovskiy, A.N. On the State and Environmental Protection in the Altai Territory in 2021; Publishing House “Print”: Izhevsk, Russia, 2022; p. 192. (In Russian) [Google Scholar]
  44. Strelkovskiy, A.N. On the State and Environmental Protection in the Altai Territory in 2020; Publishing House “Print”: Izhevsk, Russia, 2021; p. 200. (In Russian) [Google Scholar]
  45. Specialized Data Sets for Climate Research. Available online: http://aisori-m.meteo.ru/waisori/ (accessed on 31 March 2023).
  46. Galakhov, V.P.; Mardasova, E.V.; Lyutsiger, N.V.; Samoilova, S.Y. Influence of fall freezing on maximum levels of Charysh river basin. Bull. AB RGS 2018, 49, 54–57. (In Russian) [Google Scholar]
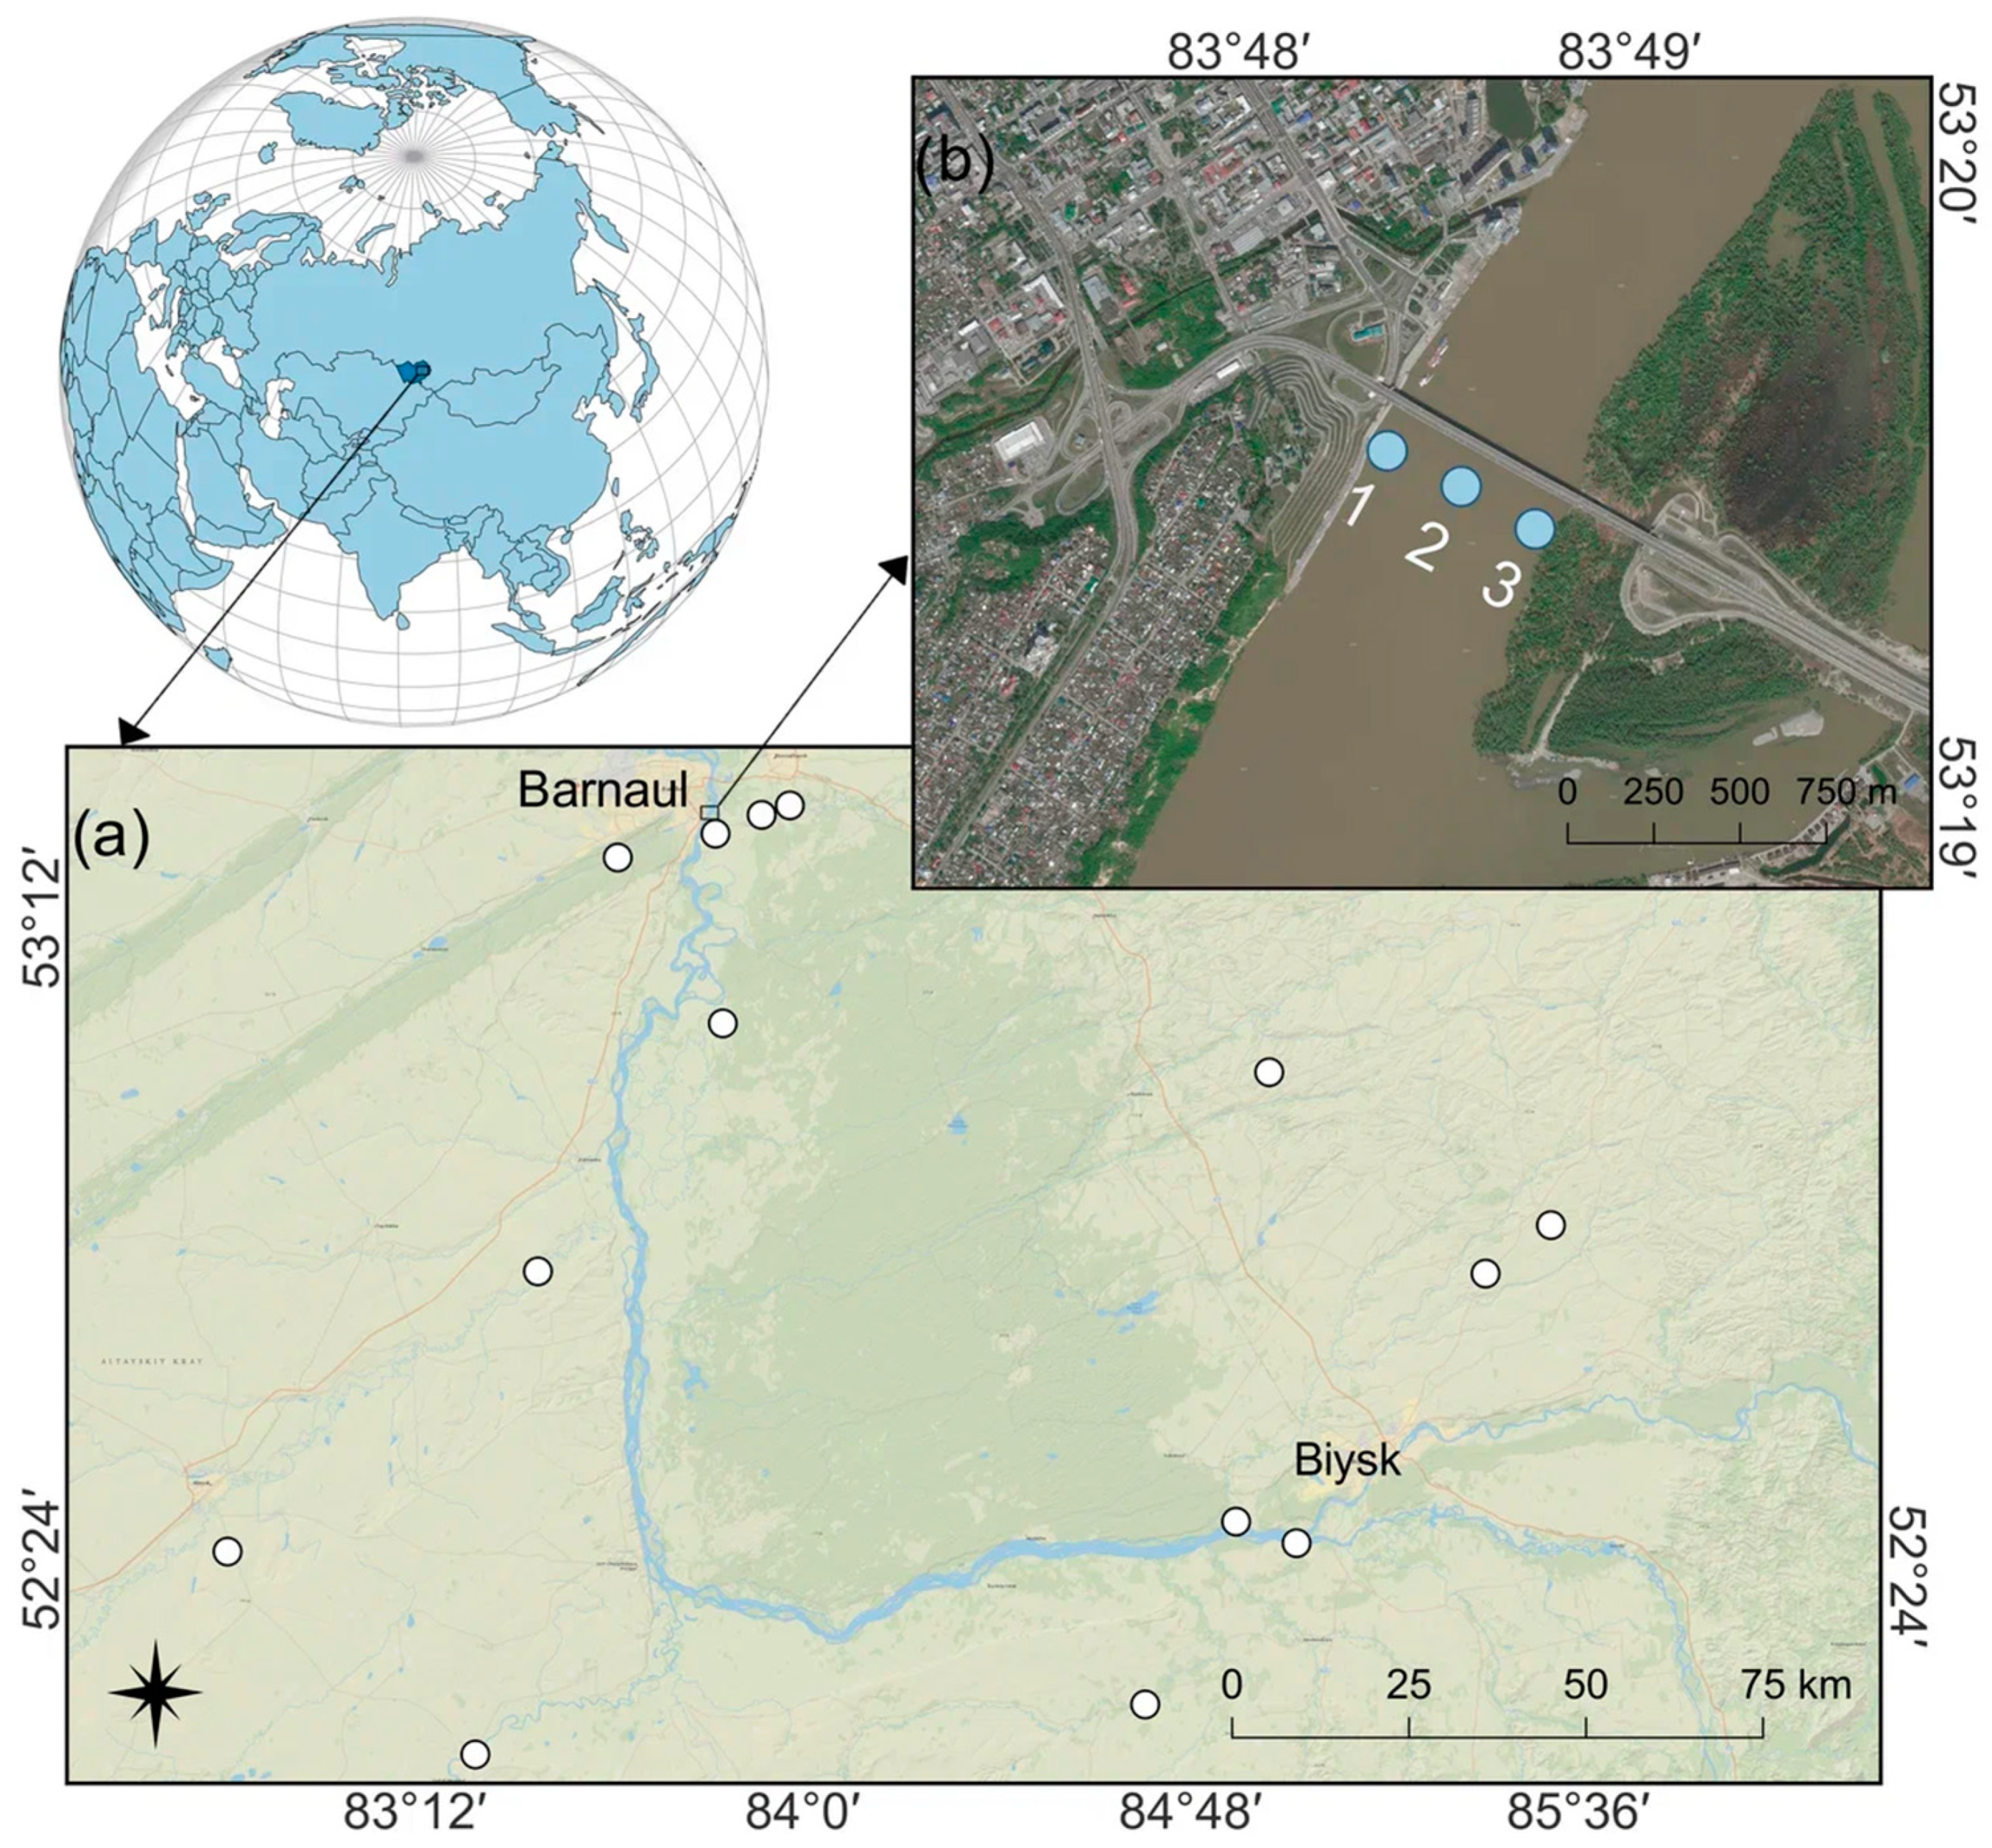
Figure 1. Map-scheme of the sampling point locations in 2020–2021: (a) sampling of snow cover in the catchment area of the Ob River from Biysk to Barnaul (white circles); (b) water sampling (blue circles) on the Ob River near Barnaul (1—left bank, 2—middle, 3—right bank).
Water 15 02096 g001
Figure 2. Change in δ18O (1—left bank, 2—middle, 3—right bank, Figure 1c) and water discharge in the Ob River during the flood period in 2020 and 2021. I—the end of the winter low-water period (under-ice period); II—the first phase of the spring flood; III—the second phase of the spring flood; IV—the beginning of the summer low-water period; the vertical arrow line indicates the date of the ice drift.
Water 15 02096 g002
Figure 3. Local meteoric water lines (LMWL) for water (blue line) in the outlet section of the Ob River near Barnaul for the period of snowmelt and flood in 2020 (a) and 2021 (b); for snowpack (violet line) in the catchment area at the time of maximum snow accumulation in winter 2019–2020 (a) and 2020–2021 (b); and for rainfalls in Barnaul (green line) for autumn 2019 (a) and 2020 (b); the red line is the global meteoric water line (GMWL).
Water 15 02096 g003
Table 1. Average values of the isotopic composition of the surface water of the Ob outlet section in different periods of the hydrological regime in 2020 (1) and 2021 (2); precipitation-weighted mean of autumn (August–October 2019 (1) and 2020 (2)) and spring–summer (first and second phases of the floods in 2020 (1) and 2021 (2)) rainfalls; depth-weighted mean of snow cover in winter 2019–2020 (1) and 2020–2021 (2).
δ18O, ‰δD, ‰d-Excess, ‰
121212
river water:
the entire period −15.2−15.4−117.0−117.54.75.7
the winter low-water −14.8−15.0−113.8−113.94.94.6
the first phase of the flood−15.4−15.7−118.2−119.04.35.5
the second phase of the flood−15.4−15.6−119.2−119.15.16.7
autumn precipitation (94/127 mm) 1−10.2−12.6−81.5−99.9−0.1−0.5
snow cover (170/115 mm weq.) 2−20.3−19.8−157.8−151.34.77.2
spring–summer precipitation 3:
the first phase of the flood (5/4 mm)−8.6−5.0−60.3−44.08.5−3.9
the second phase of the flood (38/45 mm)−8.3−10.6−61.2−82.65.02.6
Notes: 1 Precipitation-weighted mean for the period of August–October in the previous year; the amount of precipitation in autumn of 2019/2020 is specified in brackets. 2 Depth-weighted mean; the average snow depth at the time of maximum snow accumulation is specified in brackets; 3 Precipitation-weighted mean for the period of the flood; the amount of precipitation in 2020/2021 is specified in brackets.
Table 2. Conditions of snow accumulation and snowmelting in winter–spring 2019–2020 and 2020–2021 in the study area near the city of Barnaul according to [45].
2019–20202020–2021Standard
Average [34]
The day of snow cover formation13.11.1913.11.207–10.11
Winter precipitation, mm170115139
Snow depth at an air temperature <−25 °C for more than 3 days, cm2010
Maximum depth of the snowpack, cm7252
Climate spring (start of the active snowmelt)30.03.2005.04.2107.04
End of the snowmelt09.04.2013.04.2110–15.04
Average monthly temperature for the winter and spring seasons
November−9−4.2−6.3
December−8.7−15.5−12.9
January−10.5−19.8−15.5
February−7.7−13.8−13.7
March−2.9−5.5−6.5
April9.74.63.7
May16.815.612.1
Disclaimer/Publisher’s Note: The statements, opinions and data contained in all publications are solely those of the individual author(s) and contributor(s) and not of MDPI and/or the editor(s). MDPI and/or the editor(s) disclaim responsibility for any injury to people or property resulting from any ideas, methods, instructions or products referred to in the content.