Abstract
The aim of this study was the systematization and generalization of data obtained by authors during the last decade and the comparison of these data with those obtained by other authors. Gas chromatography (GC-MS) was used for the determination of PAHs and the positive matrix factorization (PMF) model and principal component analysis (PCA) were used for source apportionment of PAHs. It was found that the total concentration of 16 priority PAHs in surface waters varied from 5 to 200 ng/L, whereas the concentration of 16 PAHs in bottom sediments varied from 50 to 700 ng/g. The 2–3-ring PAHs were dominant in water, whereas the 4–6-ring PAHs were dominant in sediments. That was due to PAHs fractionation in the soil–water system. The source apportionment results showed that the PAHs in both water and sediments mostly originated from the combustion of biomass and fossil fuels. In contrast to sediments, there was a PAH fraction in water that did not originate from a single source. The pollution of freshwater ecosystems manifested itself in the lack of correlation between values of octanol/water partitioning coefficients and sediment/water partitioning coefficients of PAHs.
1. Introduction
Polycyclic aromatic hydrocarbons (PAHs) are a class of complex organic chemicals that have a fused-ring structure containing at least two benzene rings [1]. In the seventies of the last century, the United States Environmental Protection Agency (USEPA) listed 16 PAHs (Table 1) as priority pollutants in aquatic and terrestrial ecosystems [2,3]. The selection of priority PAHs was based more on their measurability using current analytical methods, than on their toxicity to organisms [3]. As a result, the maximum contaminant levels (MCL) for the most part of those PAHs in water still have not been established. The MCLs established for certain priority PAHs differ considerably between countries. For example, in China, the MCL for BaP in water is equal to 10 ng/L, and the MCL for a total concentration of 16 PAHs is equal to 2000 ng/L [4]. According to European Community drinking water quality standards the MCLs for BbF, BkF, BghiP and IcdP are equal to 100 ng/L [5]. According to USEPA standards, the MCL for BaP is equal to 200 ng/L [6]. In Canada, the MCL for BaP is equal to 40 ng/L [7]. In Russia, the MCL for BaP is equal to 5 ng/L and MCL for NAP is equal to 10,000 ng/L [8]. In the case of sediments, the situation is quite different: several levels of toxicity (to benthic fauna) have been established for almost all priority PAHs. The established levels vary from 20 ng/g for ACE and ACY to 5100 ng/g for PYR and FLU [9]. Unfortunately, most of the sediment quality guidelines have been developed for the environmental conditions of North America [9]. The environmental fate and behavior of PAHs are affected by two factors. These factors are the molecular weight and origin of PAHs. The PAH distribution among environmental compartments in any location is largely determined by their molecular mass. Low molecular weight (LMW) PAHs, which are composed of two to three benzene rings, are generally more water soluble and partition less readily into organic matter than high molecular weight (HMW) PAHs, which are composed of four to six rings [10]. The PAH composition of a particular environmental compartment at a particular location is largely determined by the origin of PAHs. Pyrogenic PAHs, which arise from the combustion of organic compounds, are released into the atmosphere and thus more widespread in the environment than petrogenic PAHs that are peculiar to crude oil and oil products. Petrogenic PAHs affect the environment locally after oil spills [11]. LMW PAHs are mostly petrogenic, whereas HMW PAHs are mostly pyrogenic [12].

Table 1.
Structure and properties of the 16 US EPA PAHs.
In the past five decades, thousands of studies all over the world have been devoted to the environmental fate and behavior of PAHs in freshwater ecosystems ([13,14,15,16,17,18], etc.). Against this background, the effect of PAHs on aquatic ecosystems of the Lake Baikal watershed seems to be almost unstudied. So far, just a few dozen articles (mostly conference proceedings papers) have been published on this matter. The overwhelming majority of those papers were published in Russian and thus could not be read by most scientists outside the Russian Federation. The first papers [19,20] were devoted to estimating the riverine mass fluxes of technogenic organic compounds including PAHs to Lake Baikal. Within 10 years thereafter, only papers devoted to atmospheric PAHs have been published [21,22,23,24,25]. It was shown that the highest PAH concentrations in the air are characteristic of urban and industrial areas of the Lake Baikal watershed. At the beginning of the 2000s, articles concerned with the PAHs in the bottom sediments of Lake Baikal and its tributaries [26,27,28,29,30,31,32] began to appear in Russian and international academic journals. The results of these studies showed that the highest concentrations of PAHs in riverine and lacustrine sediments were observed in areas located in big cities and near industrial enterprises. The obtained idea that the PAH source closest to the water body is the primary contributor of PAHs to its water and sediments reduced the interest in studies concerned with source apportionment of PAHs. The results of such studies began to appear in the scientific literature in the past six or seven years [33,34,35,36,37]. The lack of data on the PAH composition of surface water until the middle of the 2000s was probably conditioned by difficulties in measuring low PAH concentrations. The first data on PAHs in water [21,38] were obtained using high-performance liquid chromatography with fluorescence detection (HPLC-FD) that had, at that time, a lower detection limit than the currently used gas chromatography with mass spectrometric detection (GC-MS). PAH concentrations reanalyzed later in the water of various water bodies using GC-MS were also quite low [39,40,41,42] in comparison with MCLs, but quite variable over time. This fact reduced the interest in the problem of PAHs on the surface waters of the Lake Baikal basin. The interest in waterborne and airborne PAHs increased after the problem of the impact of forest fires on human health became relevant [34,43,44,45,46]. Owing to the problem of forest fires, new data on the PAH composition of Baikal water has become available [46]. Unfortunately, unlike the previous studies, the emphasis in the new study was based on measuring the LMW PAHs. Thus, it is quite difficult to compare the new and the old data. Taking into account all the mentioned above, it can be concluded that studies concerned with measuring PAH concentrations in various environmental compartments of the Lake Baikal watershed were, to a great extent, occasional and unsystematic. The aim of this study was the systematization of data on the composition, concentration and origin of PAHs in surface waters and bottom sediments of Lake Baikal and its tributaries obtained by authors in the period from 2011 to 2023 and the comparison of these data with those obtained by other authors. The results of the study should help to reveal the causes of high spatial and temporal variability of data on PAH concentrations in water and sediments and thus to avoid future difficulties in the interpretation of the ecological status of freshwater ecosystems in the study area.
2. Materials and Methods
2.1. Study Objects
The study was conducted in the Lake Baikal watershed (Figure 1) between 2011 to 2023. The study area is a mountainous region characterized by long cold winters (from November to April) and short hot summers (from June to August). The water and bottom sediments were sampled from Lake Baikal and nineteen lake tributaries, namely Kichera, Teeya, Sarma, Rel (the northwest coast), Tompuda, Turka, Sukhaya (the northeast coast), Utulik, Pereyomnaya, Khara-Murin, Snezhnaya, Mishikha (the southeast coast), Buguldeika, Goloustnaya, Anga and Sarma (the southwest coast). The water and sediments of the main Lake Baikal tributaries such as Selenga, Barguzin, Upper (Verkhnyaya) Angara were also sampled. The water of Lake Baikal was sampled in 2011, 2015, 2017 and the water of lake tributaries was sampled in 2011, 2012, 2015, 2017, 2018 and 2023. The Lake Baikal bottom sediments were sampled in 2018 and 2019 and the bottom sediments of lake tributaries were sampled in 2017, 2018, 2019 and 2023.
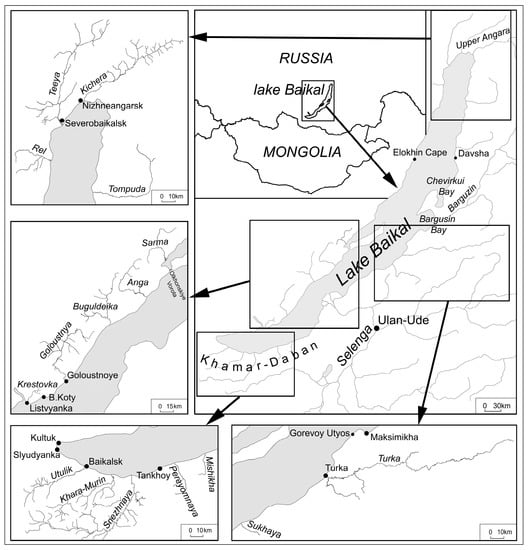
Figure 1.
Study area.
2.2. Sampling
Samples of lake water and bottom sediments were collected in both the littoral and pelagic zones of the lake. The lake water was sampled from the surface. Riverine water was sampled from the surface near the river mouths. Eighty-three samples of riverine and lake water were collected in total. Bottom sediments in both the lake and the tributaries were sampled using dredge. Twenty-nine samples of bottom sediments were collected in total. Water and sediment samples were stored in a refrigerator at 4 °C prior to extraction.
2.3. Chemical Determinations
Since the concentrations of both PAHs and suspended sediments in the surface waters of the Lake Baikal watershed are quite low [46], the water was not filtered prior to analysis as in all other studies carried out in the Lake Baikal watershed. Thus, the total concentrations of PAHs (dissolved + particulate) were measured. To control the quality of chemical measurements the water and sediment samples were spiked with 100 μL of a mixture of d-labeled acenaphthene, phenanthrene and chrysene dissolved in acetone (EPA 525 Fortification solution B). PAHs were extracted using hexane, extracts were filtered using 0.45 μm Advantec membrane filters. Extracts were then concentrated using a rotary evaporator. In different years, different sets of PAHs were analyzed, nevertheless, each of the sixteen priority PAHs was measured at least in one of the studies. All the measured PAHs are listed in Table 1. PAHs were measured using an Agilent GC/MS system consisting of an Agilent 7890B gas chromatograph and Agilent Model 5977A mass selective detector. GC-MS was calibrated using an eight-point calibration curve. For optimum sensitivity, the detector was operated in selected ion monitoring (SIM) mode.
2.4. Contamination Identification
To identify the relationship between the PAH compositions of water and bottom sediments (or to establish its absence), the coefficients of PAH partitioning between water and sediments (KSW) as well as between octanol and water (KOW) were used:
where COc—PAH concentration in n-octanol saturated with water and CWt—PAH concentration in water saturated with n-octanol, CS—PAH concentration in bottom sediments and CW—PAH concentration in water.
KOW = log COc/CWt
KSW = log CS/CW
The tabulated KOW value is the measure of PAH lipophilicity: the higher the KOW the higher should be the sorption of the respective PAH onto the organic matter of the bottom sediments. In contrast to KOW, KSW reflects the real distribution of PAHs between sediments and the overlying water column. Thus, the location of PAH points on the KOW/KSW scatterplot indicates correspondence or discrepancy between the theoretically expected and actually observed distribution of PAHs between water and sediment.
2.5. Source Identification Using Diagnostic Ratio Approach
The diagnostic ratio approach is based on the assumption that PAH emissions from different sources are characterized by different ratios of concentrations of indicator PAHs called diagnostic ratios (DRs). The essence of the approach is to divide the scatterplot into areas of emission sources, limited by the lines, passing through certain DR values. Source identification was considered successful only when the scatterplot area was attributed to one source on the basis of two different DRs at once. The names of identical sources in the scatterplot area were written in red. When the scatterplot area was attributed to two different sources, the names of those sources were written in black.
2.6. Source Apportionment Using the Dimensionality Reduction Techniques
Source apportionment of PAHs in water and sediments was carried out using dimensionality reduction techniques. The purpose of these techniques is to reduce a large number of variables (PAHs) into fewer numbers of factors. To reduce variables the data matrix is decomposed into a matrix of projections of PAHs onto a new coordinate system (matrix of loadings), a matrix of sample coordinates in a new coordinate system (matrix of scores) and a matrix of residuals:
where X—matrix of initial data (I × J), T—matrix of scores (I × A), P—matrix of loadings (J × A) and E—matrix of residuals (I × J).
X = TPt + E
2.6.1. Surface Waters
The source apportionment of PAHs in water was performed using a new approach to factor analysis (FA) called Positive Matrix Factorization (PMF) model (EPA PMF 5 software package). PMF approach is based on a weighted least square fit. The primary aspect of FA is to unearth the factors that store the information. The relationship between the PAHs, samples and pollution sources in the PMF model can be presented as follows:
where Xij—concentration of species j in sample i, fkj—concentration of species j in the emission of source k, gik—contribution of source k to sample i and eij—residuals, i.e., the difference between the measured and calculated amounts of species j in sample i.
The idea of calculating the gik and fkj is to minimize the eij. The uncertainty of data is also used in the model as input data along with PAH measurement data. The data uncertainty due to chemical measurements was calculated by adding the one-third of the detection limit to the error of measurement [47]. The calculated uncertainty was then increased by 10% to take into account the uncertainty due to sample preparation [48]. Two to ten factors were run to identify the sources. Since there are no rules to determine the number of factors that should be retained, the final number of factors was decided on the base of their physical interpretability [49].
2.6.2. Bottom Sediments
The distinctive feature of the PMF model is the necessity of a large number of input data [50,51]. Since the number of bottom sediment samples was insufficient for PMF analysis, the source apportionment of PAHs in bottom sediments was performed using principal component analysis (PCA). Unlike FA, the primary aspect of PCA is just to reduce the unnecessary features, which are present in the data, by creating or deriving new dimensions (factors). These factors are a linear combination of the original variables (PAHs):
where ta—is a factor, x1 and xJ—are initial variables (PAHs), pa1 and paJ—are projections of variables x1 and xJ onto a new coordinate system where axes are factors (instead of PAHs).
ta= pa1x1 + … + paJxJ,
The rows of loadings matrix (P) calculated using STATISTICA software were used as profiles of PAH sources and the percentages of data variance explained by derived factors were used as source contributions to pollution.
3. Results and Discussion
3.1. PAHs in Water
3.1.1. PAHs in Water of Lake Baikal Tributaries
The existing data on PAH concentrations in surface waters of Lake Baikal watershed are highly contradictory, which indicates their significant spatial and temporal variability. In the water of the same water body, the concentration of the same PAH may vary from a few nanograms per liter to a few tens of nanograms per liter. The only thing that the studied water bodies have in common is the prevalence of LMW PAHs over HMW PAHs in water. However, the proportion of LMW PAHs in the total concentration of the 16 priority PAHs is still unclear because different researchers measured different numbers of PAHs. According to studies by the authors conducted in 2015, 2016, 2017 and 2018 [33,34,35], the highest total concentrations of 12 priority PAHs (6 ng/L on average) were characteristic of large rivers (Figure 2a), whereas the lowest concentrations (4 ng/L on average) were characteristic of small rivers (Figure 2b).
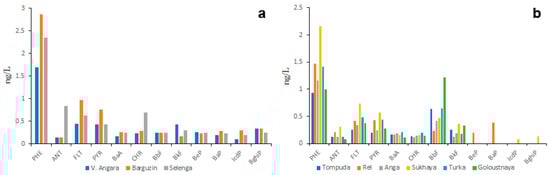
Figure 2.
PAH composition of water of large (a) and small (b) tributaries of Lake Baikal, obtained in 2015–2018.
According to the data obtained by Marinaite et al. in the early 2000s [39], the PAH concentrations in the water of Lake Baikal tributaries were much higher than those observed in the present study (Figure S1). For example, the concentrations of the lightest PAHs such as PHE and FLT in water of small tributaries varied from 20 ng/L to 90 ng/L and from 7 ng/L to 30 ng/L (Figure S2a), respectively. In the water of large tributaries, the concentrations of PHE and FLT varied from 1.5 ng/L to 40 ng/L and from 0.5 ng/L to 22 ng/L (Figure S2b and Figure S3a), respectively. Similar data were reported by Khalikov and Lukyanova [52]. The differences between data reported by different authors as well as the differences between data reported by the same author at different times may be due to water pollution from temporary sources. The idea of the existence of temporary PAH sources is supported by the data obtained for three northwest Lake Baikal tributaries in 2011 and 2015 (Figure 3).
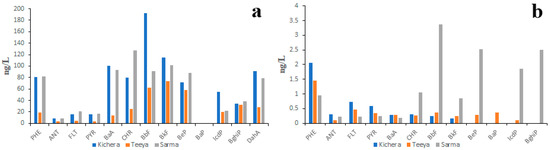
Figure 3.
PAH composition of water of three northwest Lake Baikal tributaries measured in 2011 (a) and 2015 (b).
In 2011 (Figure 3a), the concentration of PAHs in the water of those rivers was several times higher than in 2015 (Figure 3b). The sources of “additional” PAHs in 2011 could be the intermittent rivers and ephemeral streams. The fact is that, in 2011, rivers Kichera, Teeya and Sarma were characterized by higher water discharge than in 2015. Thus, it is quite probable that “additional” PAHs were washed from the contaminated lowlands called critical source areas into rivers. Since the water samples were not filtered prior to chemical analysis it is reasonable to assume that the suspended sediments were the carriers of those “additional” PAHs. The prevalence of HMW PAHs over LMW PAHs in the water of Sarma River in 2011 can also be explained by higher concentrations of suspended sediments. Thus, the variability of data on the PAH composition of surface waters may be due to different amounts of suspended sediments in the water samples collected under different weather conditions.
The studies primarily focused on LMW PAHs showed that the concentration of NAP, which predominated over the other PAHs, did not depend on the size of the river or the land use (Figure 4). The second most abundant PAH in water was PHE.
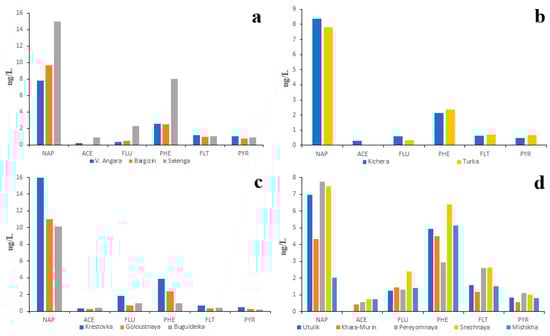
Figure 4.
Two year (2018, 2023) average PAH composition of water of main tributaries (a), small northern tributaries (b), small southwestern tributaries (c) and small southeastern tributaries (d) of the Lake Baikal.
Similar data (Figure S2) were also obtained by Gorshkov et al. [46]: the NAP concentrations in all studied rivers varied from 2 to 15 ng/L and the PHE concentrations varied from 1.5 to 8 ng/L. It is quite probable that the absence of correlation between ecological conditions of the river basin and NAP concentration in water was conditioned by PAH fractionation in the soil–water system: the less soluble PAHs remained in the soil whereas highly soluble PAHs, such as NAP, were washed away from soils into rivers [34].
3.1.2. PAHs in Lake Baikal Water
The existing data on PAH concentrations in Lake Baikal water are also contradictory. According to the data of studies conducted by authors in 2015–2017, the PAH concentrations in lake water were somewhat lower than those in the water of lake tributaries [34,35]. For example, concentrations of PHE and FLT in lake water under pristine conditions rarely exceeded 2 ng/L and 1 ng/L, respectively, and the total concentration of 12 PAHs (including 11 priority ones) rarely exceeded 5 ng/L (Figure 5a). This was probably due to the long lake water residence time: it would take 400 years to empty Lake Baikal through its outflow (Angara River). However, the PAH concentrations in lake water sampled in the vicinity of densely populated areas were almost 10 times higher (Figure 5b). There was no doubt that high PAH concentrations were the result of pollution. In the vicinity of Baikalsk city, the lake water was polluted by LMW PAHs, whereas in the vicinity of Davsha settlement and in Bargusin Bay, the water was polluted by HMW PAHs.
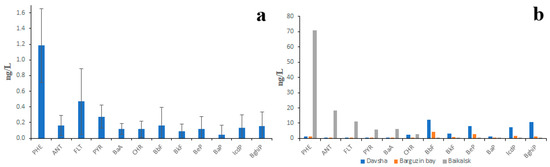
Figure 5.
PAH composition of Lake Baikal water under pristine conditions (a) and under anthropogenic pressure (b); whiskers represent standard deviations.
According to the other authors, the PAH concentrations in Lake Baikal water are much higher than those observed in the present study. The data obtained by Gorshkov et al. [40] in the early 2000s, showed that the total concentration of 16 priority PAHs in lake water under pristine conditions varied from 60 ng/L to 100 ng/L, whereas in water polluted by crude oil concentration of PAHs varied from 5.5 µg/L to 8.2 µg/L (Figures S3 and S4). In addition to that, the proportion of HMW PAHs in water sampled in areas of natural oil seeps was higher than in water sampled in unpolluted areas. The total concentrations of 19 PAHs (including 16 priority ones) reported by Morozov et al. [42] varied from 8 to 27 ng/L. These values are higher than those reported by Semenov et al. [26,27] but lower than those reported by Gorshkov et al. [40]. Considering PAHs in all three studies were measured using the same model of GC-MS, the differences in PAH concentrations obtained by the three authors may be due to different concentrations of suspended sediments at the moment of sampling or different conditions of sample storage.
The studies primarily focused on LMW PAHs also showed great differences among PAH concentrations obtained by different authors. The individual concentrations of ACE, FLU, PHE, FLT and PYR obtained by the authors of the present study in 2018 for the northern and middle hollows of Baikal (unpublished data) rarely exceeded 1 ng/L and were similar to those obtained earlier (Figure 6a), whereas concentrations of the same PAHs obtained for the most-contaminated southern hollow were almost twice as high (Figure 6b). At the same time, the concentrations of NAP in all three hollows were almost equal (5–7 ng/L). Similar concentrations of NAP in waters characterized by different degrees of pollution may be another proof of PAH fractionation in soil–water systems in addition to the predominance of LMW PAHs over HMW PAHs in all studied waters.
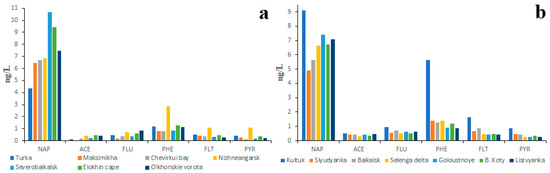
Figure 6.
Concentrations of six priority PAHs in water of northern, middle (a) and southern (b) Lake Baikal hollows.
These data contradict those obtained by Gorshkov with co-authors [46]. According to Gorshkov et al., the average concentration of NAP in the water of the southern lake hollow in September 2016 was 9 ng/L (Figure S5a), whereas, in the water of the northern hollow in June 2019, the concentration of NAP was 68 ng/L (Figure S5b). In addition to that, in 2016 the predominant PAHs in the water of the southern hollow were FLU and FLT, whereas, in 2019 the predominant PAHs in water of the northern hollow, were NAP and PHE. Authors explain these differences by the forest fires occurred in 2019. However, taking into account much lower total concentration of 8 PAHs in 2019 with respect to that in 2016 those differences can also be explained by different weather conditions during two sampling campaigns and, consequently, by different concentrations of suspended sediments in lake surface water.
To understand more precisely whether obtained PAH concentrations in lake water are true or false it is necessary to compare them to those measured in the water of other lakes of Lake Baikal watershed. Unfortunately, such data are quite scarce: only a small lake in the area in which water was analyzed for PAHs was Lake Gusinoye. According to the data obtained by Shirapova et al. [41] in 2009, the average total concentration of 16 priority PAHs in lake water did not exceed 20 ng/L (Figure S6). The average concentrations of most abundant PAHs in lake water such as NAP and PHE were 5.8 ng/L and 3.5 ng/L, respectively. These concentration values are between those obtained by the authors of the present study and those obtained by other authors [40,42,46]. Thus, the question about the true PAH composition of Lake Baikal water remains open.
3.2. PAHs in Sediments
3.2.1. PAHs in Sediments of Lake Baikal Tributaries
The data on quantitative and qualitative PAH compositions of riverine bottom sediments is no less contradictory than the data on the PAH composition of the water and is much scarcer. According to unpublished data of the present study obtained in 2018, 2019 and 2023, the total concentration of 14 priority PAHs in bottom sediments of the main channels of Lake Baikal tributaries varied from 20 ng/g to 150 ng/g (Figure 7). That is 1000–10,000 times higher than in water. The average proportion of the five heaviest PAHs (BbF, BkF, BaP, IcdP, BghiP) in the total PAH concentration was between 54% and 75%. The prevalence of HMW PAHs over LMW PAHs in sediments was conditioned by their lower solubility in water as well as by their high affinity to organic matter. The differences in quantitative and qualitative compositions of PAHs between small and large rivers were quite small. For example, the proportion of soluble NAP in sediments of the Selenga River (under pristine conditions) was slightly greater (Figure 7a) than that in sediments of the cleanest Lake Baikal tributaries such as the rivers of the Khamar-Daban Ridge (Figure 7b). The proportions of insoluble BkF and BaP in Selenga sediments were, on the contrary, slightly lesser than those in the Khamar-Daban rivers.
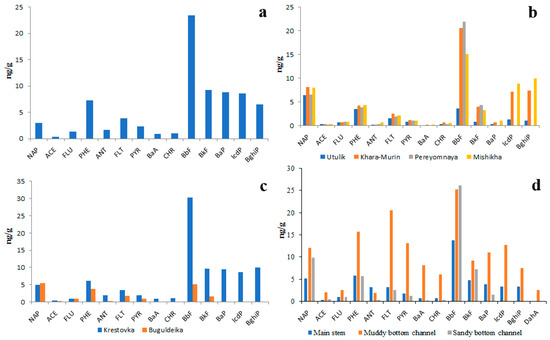
Figure 7.
Concentrations of 14 priority PAHs in bottom sediments of Selenga River (a), southeastern tributaries of Lake Baikal (Khamar-Daban rivers) (b), western tributaries of Lake Baikal (c) and Goloustnaya river (d).
The total concentrations of PAHs in the bottom sediments of the Selenga River under pristine conditions and in sediments of small tributaries were equal.
It is interesting that the PAH concentrations in sediments of main river channels under pristine conditions and under anthropogenic pressure were also similar. For example, in sediments of rivers Krestovka (Figure 7c) and Goloustnaya (Figure 7d) within heavily polluted settlements Listvyanka and Bolshoye Goloustnoe, respectively, the PAH concentrations were slightly higher than in riverine sediments of background areas such as Khamar-Daban Ridge (Figure 7b). Probably, this was due to similar particle size distribution in sediments of studied rivers and, consequently, due to the similar PAH absorbing capacity of sediments. As is seen in Figure 7d, there is a relationship between the particle size distribution of sediment and the concentration of PAHs: the lower the size of particles the higher the PAH concentration. This relationship is explained by the higher surface area of thin particles with respect to coarse ones as well as by higher concentrations of organic matter in thin particles [35]. Thus, the greatest sediment contamination by PAHs should be observed in river channels characterized by slow flow and in oxbow lakes.
According to Batoev et al. [27] the PAH concentrations in the bottom sediments of the study territory are much higher than those observed in the present study. For example, the concentrations of 16 priority PAHs in sediments of four Lake Baikal tributaries, namely, Selenga, Turka, Khaeem and Barguzin reported by Batoev et al. varied in 2002 from 0.2 µg/g to 2.0 µg/g (Figure S7). The most abundant PAHs were PHE, ANT and PYR. Since the sediments were sampled within settlements, the high PAH concentrations were probably due to anthropogenic contamination.
3.2.2. Lake Baikal Sediments
The bottom sediments of Lake Baikal are the most studied object in regard to the quantitative and qualitative composition of PAHs. Nevertheless, no clear patterns of the spatial and temporal distribution of PAHs in lake sediments have yet been identified. According to the data obtained by the authors of the present study in 2017–2018, the total concentrations of 15 priority PAHs in Baikal sediments varied from 64 ng/g to 528 ng/g. The lowest concentrations (20–70 ng/g) were characteristic of the littoral zone (Figure 8), whereas the highest concentrations (100–700 ng/g) were characteristic of the pelagic zone (Figure 9). The higher PAH concentrations in sediments of the pelagic zone were probably due to the higher proportion of silt and clay particles [29,30,31] in relation to sediments of the littoral zone. The results obtained in the present study are somewhat different from those published earlier [35]. According to the previously published data, the PAH concentrations in sediments of the littoral zone were higher than those in the pelagic zone. That is due to the fact that, in previous work, the PAH concentrations were calculated for the total weight of sediment (including gravel), whereas in the present study the PAH concentrations were calculated for the sum of silt, clay and sand fractions only.
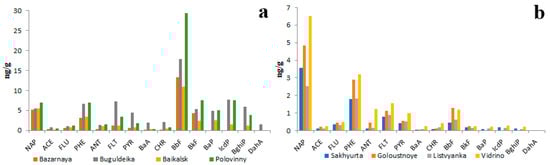
Figure 8.
PAH composition of bottom sediments in littoral zone of Lake Baikal characterized by high abundance of HMW (a) and LMW (b) PAHs.
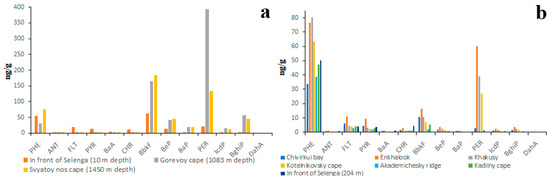
Figure 9.
PAH composition of bottom sediments of pelagic zone of Lake Baikal characterized by high abundance of HMW (a) and by high abundance of LMW (b) PAHs; BbkF—is total concentration of BbF and BkF.
To date, the two types of PAH compositions of lake sediments in the littoral zone have been identified. The first type is characterized by a high abundance of HMW PAHs (Figure 8a), whereas the second type, on the contrary, is characterized by a high abundance of LMW PAHs (Figure 8b). BbF is the most abundant PAH in sediments rich in HMW PAHs, whereas NAP is the most abundant PAH in sediments rich in LMW PAHs.
The total PAH concentrations in sediments rich in HMW PAHs were several times higher than those in sediments rich in LMW PAHs.
The correlation between the high proportion of HMW PAHs and the high total concentration of PAHs was also characteristic of sediments of the pelagic zone (Figure 9). For example, the total concentrations of PAHs in sediments rich in HMW PAHs varied from 200 to 700 ng/g (Figure 8a), whereas in sediments rich in LMW PAHs the total concentrations of PAHs varied from 50 ng/g to 200 ng/g (Figure 8b). Taking into account the fact that the particle size distributions in littoral and pelagic sediments are different, the high proportion of HMW PAHs and the high total concentration of PAHs are definitely indicators of sediment pollution in both the littoral and pelagic zones. Unlike the littoral zone, the sediments of the pelagic zone are characterized by a high proportion of PER in both HMW-rich and LMW-rich sediments. It is quite probable that PER is a product of early diagenesis, which is formed from all kinds of organic matter [53,54].
The data on the composition and concentration of PAHs in the bottom sediments of Lake Baikal obtained during this study are in agreement with the data obtained earlier by other authors. According to Reznikov and Adzhiev [31], the total concentration of 16 priority PAHs in sediments of the littoral zone of Baikal in 2013 varied from 25 ng/g to 250 ng/g. The lowest concentrations were observed in sediments sampled in rural and remote areas and the highest concentrations were observed in sediments sampled in areas nearby the industrial enterprises and railways. The PAH compositions of littoral sediments reported by Batoev et al. [27] and Khalikov et al. [52,55,56] are similar (except for low NAP concentration) to those of LMW-rich littoral sediments obtained in the present study (Figures S7 and S8). The only observation made by other authors that is not consistent with the results of the present study is the absence of a correlation between the concentration of BaP and concentrations of fine particle fractions [26].
The data on the PAH composition of bottom sediments of the other lakes of Lake Baikal watershed are quite scarce. Only the sediments of Lake Gusinoye have been studied on this subject so far. According to data obtained by Shirapova et al. [41] in 2012, the total concentration of 16 priority PAHs in lake sediments varied from 43 to 222 ng/g (Figure S9). These values are similar to those obtained during the present study for the littoral sediments of Lake Baikal and for pelagic sediments rich in LMW PAHs. The most abundant PAHs in the sediments of Lake Gusinoye were NAP and PHE. Taking into account the presence of the State District Power Plant on the lake shore, it is quite possible that the high abundance of LMW PAHs in the sediments of Lake Gusinoye is the result of pollution. If this is true, it means that the contamination of sediments of Lake Baikal with LMW PAHs is also possible in some places.
3.3. Sediment-Water Partitioning of PAHs
As seen in Table 1, the lowest KOW values are characteristic of water-soluble LMW PAHs, whereas the highest KOW values are characteristic of water-insoluble HMW PAHs. From this, it follows that the sediment enrichment in PAHs relative to water should increase from NAP to IcdP. Consequently, the KSW values of PAHs should also increase from NAP to IcdP. Such a positive correlation (r = 0.68–0.76) between log KOW and log KSW values was observed for Lake Baikal sediments (Figure 10). However, in the case of sediments characterized by high concentrations of PAHs (Figure 10a), some PAHs such as PHE, BbF and BaP on KOW/KSW scatterplots are located far above from the regression line. This probably means that, due to contamination, the enrichment of sediments in PHE, BbF and BaP exceeds their naturally conditioned absorbing capacity with respect to those PAHs. In contrast, ANT, BaA and IcdP are located far below the regression line. This probably indicates the higher water enrichment in these PAHs in comparison with sediments. This is probably due to the higher concentrations of ANT, BaA and IcdP in water in comparison with sediments or due to their desorption from sediments. In the case of sediments characterized by low concentrations of PAHs, the distances between the data points and the regression line are much lower. (Figure 10b). This probably indicates the lower contamination of both water and sediments in corresponding locations. The strong correlation between log KOW and log KSW values and the low scattering of PAH points observed for Lake Baikal tributaries (Figure 11) indicate a low level of pollution of riverine water and sediments.
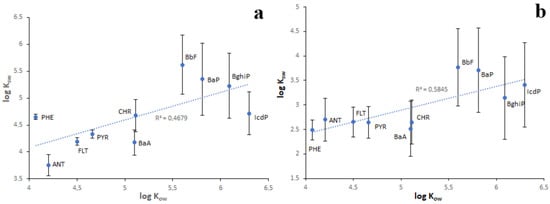
Figure 10.
The relationship between log KOW and log KSW values in Lake Baikal in the case of high (a) and low (b) concentrations of PAHs in bottom sediments.
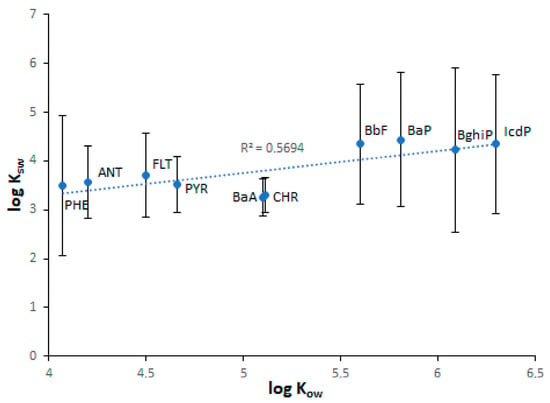
Figure 11.
The relationship between log Kow and log Ksw values in Lake Baikal tributaries.
A negative correlation between log KOW and log KSW values is observed when using some data on the PAH composition of sediments extracted from the literature [27] and the data on the PAH composition of water obtained in the present study (Figure S10). Taking into account that the sediments were sampled in heavily polluted sites, the inverse relationship between log KOW and log KSW was probably due to the ecosystem contamination with LMW PAHs. The correlation between log KOW and log KSW values obtained using the data on PAH compositions of water and sediments from Lake Gusinoye [41] was positive (Figure S11), but due to the slight contamination from a power plant located on the lake shore, it was a little weaker (r = 0.55) than that obtained for Lake Baikal.
3.4. Origin of PAHs in Water
When comparing the PAH profiles of water obtained in this study and those of some local emission sources available in the literature [25] (Figure 12), it can be clearly seen that the water is rich in LMW PAHs, whereas the source emissions are rich in HMW PAHs. There are three possible explanations for this fact:
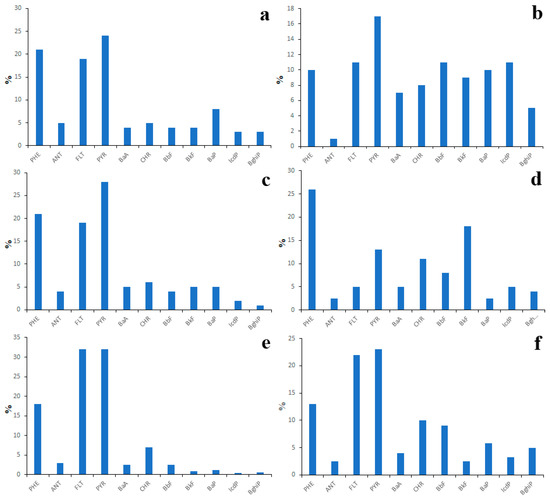
Figure 12.
PAH composition of total (gaseous + particulate) emissions from coal-burning stoves (a), wood-burning stoves (b), oil-fired boilers (c), coal-fired boilers (d), aluminum production after purification (e) and aluminum production before purification (f), extracted from Belykh et al., 2002 [25].
- (1)
- The sources whose profiles are presented in Figure 12 are not the sources of PAHs measured in water;
- (2)
- Source profiles presented in Figure 12 were measured incorrectly and the concentrations of LMW PAHs were underestimated;
- (3)
- There is the PAH fractionation in the soil–water system that results in water enrichment with LMW PAHs.
As regards sources reported by Belykh et al. [25], although they are located in Shelekhov city, which is outside the Lake Baikal basin, they use the same fuels that are used in the Lake Baikal watershed [57]. Moreover, the pollution of the Lake Baikal watershed from these sources is also probable due to the transfer of air masses along the Angara River valley, because Shelekhov City is located upwind from the lake [58]. Thus, it is quite possible that the PAH profiles of emission sources located in Lake Baikal basin look exactly as depicted in Figure 12.
Nevertheless, underestimation of concentrations of LMW PAHs due to design flaws of the sampling train used by Belykh et al. is also possible. A lot of PAH source profiles characterized by a high abundance of LMW PAHs have been reported in the peer-reviewed scientific literature in the last decade. For example, the high abundance of LMW PAHs (especially the high abundance of NAP) is characteristic of emissions of coal-fired power plants (Figures S12 and S13) located in China [59,60] and Norway [61]. It is notable that the capacity of the power plant directly relates to the molecular weight of emitted PAHs: as the capacity decreases the molecular weight increases. The LMW PAHs are also the most abundant PAHs (Figure S14) in emissions from biomass boilers [62], however, the highest proportion of LMW PAHs is characteristic of vehicular emissions (Figure S15). According to the data presented by Ho et al. [63], the total contribution of NAP, ACY and ACE to the total concentration of PAHs in the atmosphere of Shing Mun Tunnel (Hong Kong) varied from 80% to 90%. Similar data (Figure S16) were presented by Liu et al. [64].
The fractionation of PAHs in a soil–water system is also possible. To make sure of that, it is enough to compare the PAH profiles of emission sources, surface waters, bottom sediments and soils (Figure 13) in the Lake Baikal watershed.
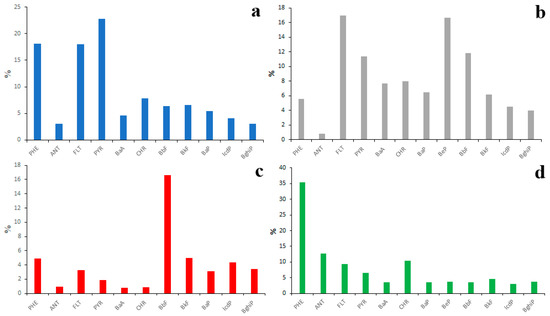
Figure 13.
Average PAH compositions of source emissions (a), soils (b), bottom sediments (c) and water (d) in Lake Baikal watershed.
3.4.1. Source Identification Using Diagnostic Ratios
Since the attempt to identify PAH sources by comparing the PAH profiles of water and source emissions failed, it was decided to identify them using the diagnostic ratio (DR) approach [65]. Four PAH isomer concentration ratios such as ANT/(ANT + PHE), FLT/(FLT + PYR), BaA/(BaA + CHR) and IcdP/(IcdP + BghiP) were used as source tracers [1,66,67].
As seen in Figure 14a, the main source of PAHs in the surface waters of the Lake Baikal basin was biomass combustion. However, the use of ANT/(ANT + PHE) and FLT/(FLT + PYR) ratios as source tracers was not really appropriate because ANT, PHE, FLT and PYR occur in source emissions in both gaseous and particulate form. Thus, the source signature may be distorted during the transportation of ANT, PHE, FLT and PYR due to their different solubility in water and different affinity to organic matter. According to Figure 14b, the main source of PAHs in water was either vehicular emissions or biomass combustion, but this was not accurate. As depicted in Figure 14c, vehicular emissions were the main source of PAHs in water, whereas petroleum combustion was the minor source. This result seems to be more adequate than those presented above because BaA/(BaA + CHR) and IcdP/(IcdP + BghiP) are more conservative tracers than ANT/(ANT + PHE) and FLT/(FLT + PYR). According to Figure 14d, biomass combustion was definitely the source of PAHs in water, but its contribution to pollution seemed to be small. Since the obtained results were not unambiguous, it was acknowledged that the attempt to identify sources of PAHs in the surface water of Lake Baikal watershed using the DR approach failed.
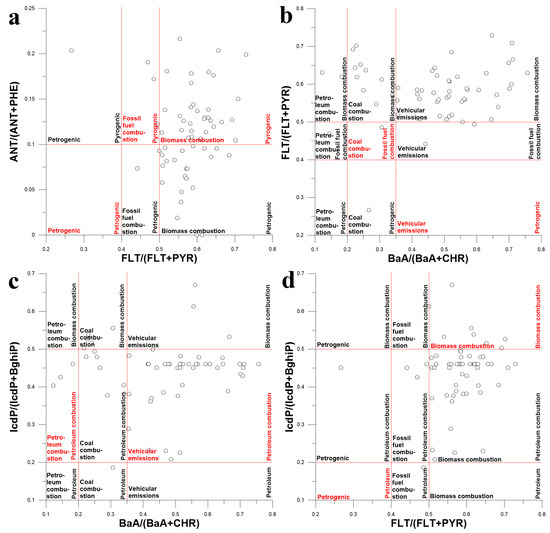
Figure 14.
Diagram illustrating the mixing of PAHs from different sources in surface waters of Lake Baikal watershed using different PAH isomer concentration ratios as tracers: FLA/(FLA + PYR) and ANT/(ANT + PHE) (a), BaA/(BaA + CHR) and FLT/(FLT + PYR) (b), BaA/(BaA + CHR) and IcdP/(Icdp + BghiP) (c), FLT/(FLT+PYR) and IcdP/(Icdp + BghiP) (d).
3.4.2. Source Apportionment Using PMF Model
Since the source identification using the DR approach was not successful, the data on the PAH composition of surface waters (Table 2) were analyzed using the PMF model.
Table 2.
Basic statistical parameters of PAH composition of surface waters of Baikal watershed, ng/L.
As a result, seven factors were extracted. These factors contributed 16%, 29%, 6%, 10%, 23%, 10% and 5% of PAHs to water pollution, respectively. Identified factors may conditionally be divided into three groups: (1) factors characterized by a high abundance of five- and six-ring PAHs (Figure 15a,b), (2) factors characterized by a high abundance of three- and four-ring PAHs (Figure 15c–e), (3) factors characterized by a high abundance of BbF or BkF (Figure 15f,g).
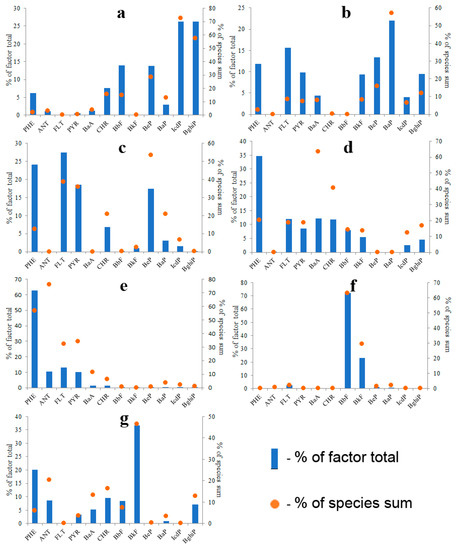
Figure 15.
PMF-derived source profiles of waterborne PAHs; Factor 1: Coal combustion (a), Factor 2: Biomass combustion (b), Factor 3: Petroleum products combustion (c), Factor 4: Petroleum product spills (d), Factor 5: Product of PAH fractionation in soil–water system (e), Factor 6: Fresh asphalt particles (f), Factor 7: Aged asphalt particles (g).
Factor 1 (Figure 15a) was characterized by the highest concentration of IcdP and BghiP among all factors. Abnormally high concentrations of IcdP and BghiP had been previously found in the soil influenced by the emission from thermal power stations in Ulan-Ude city [36]. Therefore, it was assumed that Factor 1 represented coal combustion, although its PAH composition was similar to that of a wood-burning stove (Figure 12b).
Factor 2 was the second largest contributor of five- and six-ring PAHs to water (Figure 15b). The PAH composition of Factor 2 was quite similar to the PAH composition of wood combustion identified to be one of the main sources of particulate matter in the air above Lake Baikal [37]. The profile of Factor 2 was also similar to that of biomass combustion presented in the work of Li et al. [68]. As a result, Factor 2 was identified as biomass combustion. In fairness, it should be noted that the PAH profile of Factor 2 was also similar to that of the emission of coal-fired boiler (Figure 12d).
The factor profiles characterized by a high abundance of three- and four-ring PAHs (Factors 3, 4 and 5) looked like profiles of automotive exhaust emissions [63,64,69,70] and petroleum products [71,72,73] simultaneously. The identification of those factors was based on a comparison of the ratio between the sum of ANT and PHE and the sum of the rest of the PAHs because petroleum products are characterized by significantly higher proportions of two- and three-ring PAHs in comparison with products of combustion of automotive fuels. This principle was in agreement with the generally accepted idea that the emissions from petrogenic sources are characterized by a higher LMW/HMW PAH ratio than the emissions from pyrogenic sources [12]. Therefore, Factor 3, most rich in HMW PAHs, was identified as the combustion of oil and petroleum products. In addition, the PAH composition of Factor 3 was similar to the PAH composition of emission of oil-fired boiler (Figure 12c) and almost identical to the PAH composition of oil and diesel fuel combustion identified to be one of the sources of particulate matter in the air above the Lake Baikal [37].
Factor 4 was identified as petroleum products and Factor 5 was identified as PAH fraction formed as a result of PAH fractionation in the soil–water system. The existence of the fractionation phenomenon is indirectly confirmed by the similarity of PAH compositions of inland waters around the world. In fairness, it should be noted that the PAH compositions of Factors 4 and 5 are quite similar to that of products of gasoline combustion [36,69].
Factors 6 and 7 characterized by a high abundance of PAHs with a molecular weight of 252 (BbF и BkF) stood apart from the other factors. Factors 6 and 7 may have resulted from artifacts in the data matrix. However, if the sampling and chemical analyses were performed correctly, those factors must be identified. The BbF/BkF ratio was previously used as a tracer for the identification of six different PAH sources such as automotive exhaust emissions, aluminum plant emissions, coal combustion, wood combustion [74], gas oil [75] and coal tar [76]. The value of the BbF/BkF ratio calculated for Factor 6 (Figure 15f) was equal to 3.2. This value was similar to those calculated for coal tar in asphalt (2.53) and for aluminum production (2.49–2.89). However, the PAH composition of Factor 6 was quite different from both coal tar and aluminum production. The value of the BbF/BkF ratio calculated for Factor 7 (Figure 15g) was equal to 0.19. This value was quite different from any BbF/BkF value presented in the literature; however, the PAH composition of Factor 7 was similar to that of road dust [77,78] (Figure S17). Based on this, it was assumed that Factor 6 represented fresh asphalt particles (BbF/BkF = 3.2), whereas Factor 7 represented aged asphalt particles because the concentration of more soluble BbF in Factor 6 dominates the concentration of less soluble BkF. The relatively high abundances of PHE and ANT in Factor 7 were probably due to their sorption from the water to particulate matter.
3.5. Origin of PAHs in Sediments
3.5.1. Source Identification Using Diagnostic Ratios
Four PAH diagnostic ratios such as ANT/(ANT + PHE), BaA/(BaA + CHR), FLT/(FLT + PYR) and IcdP/(IcdP + Bghip) were used for the identification of PAH sources in bottom sediments (Figure 16). According to the majority of mixing biplots in Figure 16, the main source of PAHs in bottom sediments was the combustion of organic matter. For example, according to Figure 16a, the combustion of automotive fuels such as gasoline or diesel was definitely the source of PAHs in some sediment samples. According to Figure 16b–d,f, PAHs in sediment samples originated mostly from the combustion of grass, coal and wood. However, the proportion of sample points for which the same emission sources were identified in two different DRs was less than 50%. For example, only two sample points in Figure 16e were unequivocally attributed to the combustion of grass, coal and wood. That was a clear indication of the restricted applicability of the DR approach to the identification of PAH sources in the bottom sediments of the Lake Baikal watershed. Source identification using the PMF method was the only viable alternative to the DR approach; however, it could not be used due to the small number of sediment samples. Thus, it was decided to use principal component analysis (PCA) for the source apportionment of PAHs in sediments.
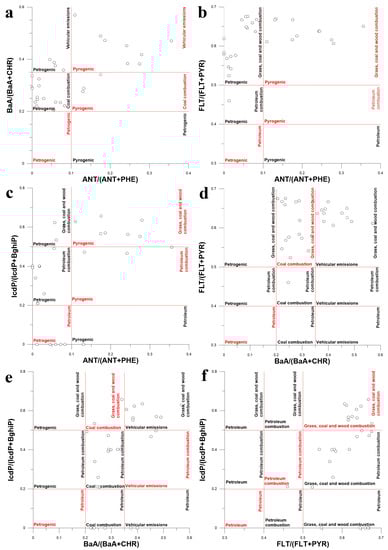
Figure 16.
Diagram illustrating the mixing of PAHs from different sources in bottom sediments of Lake Baikal and its tributaries using different PAH isomer concentration ratios as tracers: ANT/(ANT + PHE), BaA/(BaA + CHR) (a), ANT/(ANT + PHE), FLT/(FLT + PYR) (b), ANT/(ANT + PHE), IcdP/(IcdP + BghiP) (c), BaA/(BaA + CHR), FLT/(FLT + PYR) (d), BaA/(BaA + CHR), IcdP/(IcdP + BghiP) (e), FLT/(FLT + PYR), IcdP/(IcdP + BghiP) (f).
3.5.2. Source Apportionment Using PCA
The brief statistical description of the data on the PAH composition of bottom sediments used for source apportionment is given in Table 3.
Table 3.
Basic statistical parameters of PAH composition of bottom sediments of Baikal watershed, ng/g.
The number of factors to retain was determined using the eigenvalues of the covariance matrix obtained from the initial data matrix: only the factors with eigenvalues ≥1 were retained for interpretation. At the same time, the variability explained by the retained factors had to be not less than 90%. As a result, four factors were selected (Table 4). Those factors explained 45%, 32%, 11% and 6% of the data variability, respectively. Since the absolute majority of coefficients of correlation between PAHs and retained factors were positive values, the PAH composition of each factor (Figure 17) was also presented as a scaled version of the squared correlations between variables and principal components (variable contributions to PCs).
Table 4.
PCA loading factors for PAH compounds in bottom sediments of Lake Baikal watershed.
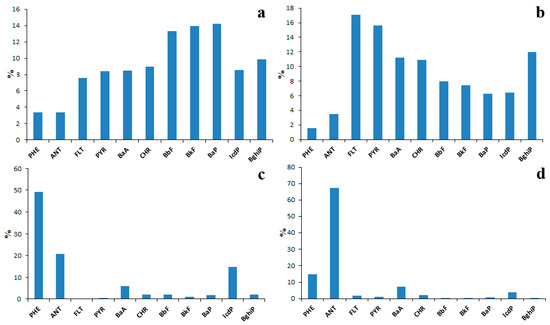
Figure 17.
PCA-derived source profiles of sediment PAHs; Factor 1: Coal combustion (a), Factor 2: Wood and biomass combustion (b), Factor 3: Fresh petroleum products (c), Factor 4: Aged petroleum products (d).
Factor 1 was characterized by the highest abundance of four- and five-ring PAHs among all factors (Figure 17a). The PAH composition of this factor was similar to that of coal combustion (Figure 15a) obtained for water using the PMF model. The profile of PCA-derived Factor 1 was also similar to that of coal and wood combustion identified using the data on the PAH composition of soil sampled near the coal-fired thermal power plant in Ulan-Ude city [36]. Taking everything mentioned above into account, Factor 1 was identified as coal combustion.
Factor 2 (Figure 17b) was characterized by a high abundance of four-ring PAHs such as FLT, PYR, BaA and CHR. The profile of Factor 2 was similar to the profile of biomass combustion obtained for water using the PMF model (Figure 15b) and to the profile of wood combustion obtained previously using the PMF analysis of data on the PAH composition of atmospheric PM sampled above Lake Baikal. For this reason, PCA-derived Factor 2 was identified as wood and biomass combustion. The high abundance of three-ring PAHs such as PHE and ANT in profiles of Factor 3 (Figure 17c) and Factor 4 (Figure 17d) definitely indicated their association with petroleum products.
The profile of Factor 3 was quite similar to those of Factors 4 (Figure 15d) and 5 (Figure 15e) obtained for water using the PMF model. For this reason, it was also identified as petroleum products. In this regard, the profile of Factor 4 was assumed to represent aged oil products (for example, oil-suspended particulate matter aggregates) because the solubility of ANT, which is the most abundant PAH in the profile of Factor 4 is several times lesser than the solubility of PHE, which is the most abundant PAH in the profile of Factor 3.
4. Conclusions
The main conclusions reached in this study are as follows:
- Due to PAH fractionation in the soil–water system, the water-soluble LMW PAHs were most abundant in water, whereas the insoluble HMW PAHs were most abundant in sediments.
- The total concentration of 16 priority PAHs in water obtained during this study varied from 5 ng/L in Lake Baikal to 200 ng/L in tributaries.
- Data on the PAH composition of water obtained during this study are not consistent with some of the data obtained by other authors. The wide range of PAH concentrations in the water reported in the literature was probably due to the wide range of concentrations of suspended sediments. To make the results of different studies comparable and to avoid future difficulties in the interpretation of water PAH composition, PAH concentrations should be measured in unfiltered water, filtered water and suspended sediments.
- The total concentration of 16 priority PAHs in sediments varied from 50 to 700 ng/g. PAH concentrations in sediments were conditioned by particle size distribution: the lower the particle sizes the higher the PAH concentrations. The data on the composition and concentration of PAHs in sediments obtained in this study are generally in agreement with those obtained by other authors.
- It was found that the lower the correlation between log KOW and log KSW values, the higher the ecosystem contamination by PAHs. The points of PAHs in KOW/KSW scatterplots that lay far from the regression line indicate the ecosystem contamination by respective PAH. The points that lay above the line indicate the pollution of sediments, whereas the points that lay below the line indicate water pollution.
- According to the results obtained using PMF and PCA, the main source of PAHs in both water and sediments was the combustion of biomass and fossil fuels.
Supplementary Materials
The following supporting information can be downloaded at: https://www.mdpi.com/article/10.3390/w15132324/s1, Figure S1: PAH concentration in water of rivers of Khamar-Daban Ridge (a) and averaged PAH concentrations in water of Khamar-Daban rivers and Selenga River (b) according to Marinaite et al., 2006 [39]; whiskers are standard deviations; Figure S2: Concentrations of two- three- and four-ring PAHs in water of Khamar-Daban rivers reported by Gorshkov et al., 2021 [46]; whiskers are standard deviations; Figure S3: Concentrations of 16 priority PAHs in water of Lake Baikal between Listvyanka and Tankhoy (a) and in the area of Natural oil spills near the Gorevoy Utyos cape (b), calculated using the data reported by Gorshkov et al., 2010 [40]; whiskers are standard deviations; Figure S4: Concentrations of 11 priority PAHs in water of Lake Baikal between Listvyanka and Tankhoy (a) and in the area of Natural oil spills near the Gorevoy Utyos cape (b), calculated using the data reported by Gorshkov et al., 2010 [40]; whiskers are standard deviations; Figure S5: Concentrations of 6 priority PAHs in water of southern Baikal hollow in September 2016 (a), in water of northern Baikal hollow in June 2019 (b) and in water of Lake Baikal during the period of open water in 2020 (c), calculated using the data reported by Gorshkov et al., 2021 [46]; Figure S6: Concentration of 16 priority PAHs in water of Lake Gusinoye, reported by Shirapova et al., 2013 [41]; whiskers are standard deviations; Figure S7: Concentrations of 16 priority PAHs in bottom sediments of Selenga River (a) and in sediments of northeastern tributaries of Lake Baikal (b) reported by Batoev et al., 2003 [27]; Figure S8: PAH composition of bottom sediments of littoral zone of Lake Baikal, characterized by predominance of LMW PAHs, reported by Batoev et al., 2003 [27]; Figure S9: Average PAH composition of bottom sediments of Gusinoye Lake reported by Shirapova et al., 2013 [41]; whiskers are standard deviations; Figure S10: The relationship between log Kow and log Ksw values in Lake Baikal obtained using PAH concentrations in bottom sediment extracted from work of Batoev et al., 2003 [27]; whiskers are standard deviations; Figure S11: The relationship between log Kow and log Ksw values in Lake Gusinoye calculated using the data reported by Shirapova et al., 2013 [41]; whiskers are standard deviations; Figure S12: Bulk (gaseous + particulate) PAH composition of emission from 300 MW (a) and from 600 MW (b) coal-fired utility boilers located in Hefei city, reported by Wang et al., 2015 [59]; Figure S13: Bulk (gaseous + particulate) PAH composition of emission from 32 MW coal-fired boiler reported by Drotikova et al., 2020 [61] (a) and from 15 MW circulating fluidized bed (CFB) coal-fired boiler, reported by Wang et al., 2018 [60]; Figure S14: Bulk (gaseous + particulate) PAH composition of emission from 50 KW Wood-fired boiler (full flame) (a) and 50 KW Wood-fired boiler (slumber mode) (b), located in Flimwell, East Sussex, UK, reported by Bignal et al., 2008 [62]; Figure S15: Bulk (gaseous + particulate) concentrations of 17 PAH in air in Shing Mun Tunnel in Summer (a) and winter (b), reported by Ho et al., 2009 [63]; Figure S16: Bulk (gaseous + particulate) concentrations of 21 PAH in air in Shing Mun Tunnel in Summer (a) and winter (b), reported by Ho et al., 2009 [63]; Figure S17: PAH composition of road dust from Bangkok city, Thailand, reported by Boonyatumanond et al., 2007 [78] (a) and PAH composition of atmospheric particulate matter sampled on the sidelines in Harbin, China, reported by Gao et al., 2015 [77] (b).
Author Contributions
Research design, data analysis and writing, M.Y.S.; chemical analyses, I.I.M., L.A.B.; digital mapping, A.V.S. All authors have read and agreed to the published version of the manuscript.
Funding
This work has been supported by a grant from the Russian Science Foundation, RSF 23-27-00101.
Data Availability Statement
Data is available on request from the authors.
Conflicts of Interest
The authors declare no conflict of interest.
References
- Ravindra, K.; Sokhi, R.; Van Grieken, R. Atmospheric polycyclic aromatic hydrocarbons: Source attribution, emission factors and regulation. Atmos. Environ. 2008, 42, 2895–2921. [Google Scholar] [CrossRef]
- Andersson, J.T.; Achten, C. Time to say goodbye to the 16 EPA PAHs? Toward an up-to-date use of PACs for environmental purposes. Polycycl. Aromat. Compd. 2015, 35, 330–354. [Google Scholar] [CrossRef] [PubMed]
- Keith, L.H. The source of US EPA’s sixteen PAH priority pollutants. Polycycl. Aromat. Compd. 2015, 35, 147–160. [Google Scholar] [CrossRef]
- GB 5749-2006; Standards for Drinking Water Quality. Ministry of Health of the People’s Republic of China, Standardization Administration of the People’s Republic of China. Standards Press of China: Beijing, China, 2007. Available online: https://www.chinesestandard.net/PDF.aspx/GB5749-2006 (accessed on 17 June 2023).
- European Communities, (EC). The Quality of Water Intended for Human Consumption, Official Journal of the European Communities. CouncilDirective98/83/EC. 1998. Available online: http://www.fsai.ie/uploadedFiles/Legislation/Food_Legisation_Links/Water/EU_Directive_98_83_EC.pdf (accessed on 17 June 2023).
- United States EPA. 2018 Edition of the Drinking Water Standards and Health Advisories Tables. Available online: https://www.epa.gov/sites/production/files/2018-03/documents/dwtable2018.pdf (accessed on 17 June 2023).
- CCME. Canadian Water Quality Guidelines for the Protection of Aquatic Life: CCME Water Quality Index 1.0, Technical Report. In Canadian Environmental Quality Guidelines 1999; Canadian Council of Ministers of the Environment: Winnipeg, MB, Canada, 2001; Available online: https://www.canada.ca/content/dam/hc-sc/migration/hc-sc/ewh-semt/alt_formats/pdf/pubs/water-eau/sum_guide-res_recom/summary-tables-sept-2022-eng.pdf (accessed on 17 June 2023).
- Russian Ministry of Health. SanPin 2.1.4.1074-01. Drinking Water. Hygienic Requirements for Water Quality of Centralized Drinking Water Supply Systems. Quality Control (Instead SanPin 2.1.4.559-96). Available online: https://www.russiangost.com/p-19277-sanpin-2141074-01.aspx (accessed on 17 June 2023).
- Burton, G., Jr. Sediment quality criteria in use around the world. Limnology 2002, 3, 65–76. [Google Scholar] [CrossRef]
- Amodu, O.S.; Ojumu, T.V.; Ntwampe, S.K.O. Bioavailability of high molecular weight polycyclic aromatic hydrocarbons using renewable resources. Environ. Biotechnol. New Approaches Prospect. Appl. 2013, 171, 54727. [Google Scholar] [CrossRef]
- Zhang, W.; Zhang, S.; Wan, C.; Yue, D.; Ye, Y.; Wang, X. Source diagnostics of polycyclic aromatic hydrocarbons in urban road runoff, dust, rain and canopy through fall. Environ. Pollut. 2008, 153, 594–601. [Google Scholar] [CrossRef]
- Huang, M.; Penning, T.M. Processing Contaminants: Polycyclic Aromatic Hydrocarbons (PAHs). Encycl. Food Saf. 2014, 2, 416–423. [Google Scholar] [CrossRef]
- Hites, R.A.; Biemann, W.G. Identification of specific organic compounds in a highly anoxic sedimentby GC/MS and HRMS. Adv. Chum Ser. 1975, 147, 188–201. [Google Scholar]
- Bouloubassi, I.; Saliot, A. Composition and sources of dissolved and paniculate PAH in surface waters from the Rhône delta (NW Mediterranean). Mar. Pollut. Bull. 1991, 22, 588–594. [Google Scholar] [CrossRef]
- Fernandez, P.; Vilanova, R.; Grimalt, J. Sediment fluxes of polycyclic aromatic hydrocarbons in European high altitude Mountain Lakes. Environ. Sci. Technol. 1999, 33, 3716–3722. [Google Scholar] [CrossRef]
- Jesus, F.; Pereira, J.L.; Campos, I.; Santos, M.; Ré, A.; Keizer, J.; Nogueira, A.; Gonçalves, F.J.M.; Abrantes, N.; Serpa, D. A review on polycyclic aromatic hydrocarbons distribution in freshwater ecosystems and their toxicity to benthic fauna. Sci. Total Environ. 2022, 820, 153282. [Google Scholar] [CrossRef]
- Montuori, P.; De Rosa, E.; Di Duca, F.; Provvisiero, D.P.; Sarnacchiaro, P.; Nardone, A.; Triassi, M. Estimation of Polycyclic Aromatic Hydrocarbons Pollution in Mediterranean Sea from Volturno River, Southern Italy: Distribution, Risk Assessment and Loads. Int. J. Environ. Res. Public Health 2021, 18, 1383. [Google Scholar] [CrossRef] [PubMed]
- Montuori, P.; De Rosa, E.; Di Duca, F.; De Simone, B.; Scippa, S.; Russo, I.; Triassi, M. Polycyclic Aromatic Hydrocarbons (PAHs) in the Dissolved Phase, Particulate Matter, and Sediment of the Sele River, Southern Italy: A Focus on Distribution, Risk Assessment, and Sources. Toxics 2022, 10, 401. [Google Scholar] [CrossRef]
- Snytko, V.A.; Afonina, T.E. Tehnogennie potoki uglevodorodnih soedinenii v geosistemah basseina ozera Baikal [Technogenic flows of hydrocarbon compounds in the geosystems of the Lake Baikal]. Geogr. Nat. Resour. 1993, 2, 68–72. (In Russian) [Google Scholar]
- Snytko, V.A.; Afonina, T.E. O balance uglevodorodnih soedinenii v ozere Baikal [On the balance of hydrocarbon compounds in Lake Baikal]. Proc. Russ. Geogr. Soc. 1994, 126, 65–69. (In Russian) [Google Scholar]
- Gorshkov, A.G.; Marinaite, I.I.; Obolkin, V.A.; Baram, G.I.; Khodzher, T.V. Poliziklicheskie aromaticheskie uglevodorodi v snezhnom pokrove Yuzhnogo poberezhyay ozera Baikal [Polycyclic aromatic hydrocarbons in the snow cover of the southern coast of Lake Baikal]. Atmos. Oceanic. Opt. 1998, 11, 913–918. (In Russian) [Google Scholar]
- Raputa, V.F.; Khodzher, T.V.; Gorshkov, A.G.; Kutsenogii, K.P. Nekotorii zakonomernosti zagryazneniya okresnostei Irkutska poliaromaticheskimi uglevodorodami [Some patterns of pollution of Irkutsk environs with polyaromatic hydrocarbons]. Atmos. Oceanic. Opt. 1998, 11, 650–653. (In Russian) [Google Scholar]
- Koroleva, G.P.; Gorshkov, A.G.; Vinogradova, T.P.; Butakov, E.V.; Marinaite, I.I.; Khodzher, T.V. Issledovaniye zagryazneniya snegovogo pokrova kak deponiruyushchei sredi (Yuzhnoye Pribaikal’e) [Stadying the snow cover as the accumulating media in Southern Baikal region]. Chem. Sustain. Dev. 1998, 6, 327–337. (In Russian) [Google Scholar]
- Gorshkov, A.G.; Marinaite, I.I. Monitoring ekotoksikantov v obʹektah okruzhayushchei sredi Pribaikalya. Chastʹ 1. Opredelenie politciklicheskih aromaticheskih uglevodorodov v aerozole promashlennih centrov (na primere Irkutska) [Monitoring of ecotoxicants in environmental objects of the Baikal region. Part I. Determination of polycyclic aromatic hydrocarbons in aerosol of industrial centers (on the example of Irkutsk)]. Atmos. Oceanic. Opt. 2000, 13, 967–970. [Google Scholar]
- Belykh, L.I.; Malykh, Y.; Penzina, E.E.; Smagunova, A.N. Istochniki zagryazneniya atmosphery politsiklicheskimi aromaticheskimi uglevodorodamy v promyshlennom pribaikalye [Sources of atmosphere pollution by polycyclic aromatic hydrocarbons in industrial Transbaikalia]. Atmos. Ocean. Opt. 2002, 10, 944–948. (In Russian) [Google Scholar]
- Kirso, U.; Irha, N.; Paalme, L.; Reznikov, S.; Matveyev, A. Levels and origin of PAHs in some big lakes. Polycycl. Aromat. Comp. 2002, 22, 715–728. [Google Scholar] [CrossRef]
- Batoev, V.B.; Vaisflog, L.; Ventsel, K.D.; Tsydenova, O.V.; Palitsyna, S.S. Pollution of the basin of the Lake Baikal: Polyaromatic hydrocarbons. Chem. Sustain. Dev. 2003, 11, 829–834. (In Russian) [Google Scholar]
- Kontorovich, A.E.; Kashirtsev, V.A.; Moskvin, V.I.; Burshtein, L.M.; Zemskaya, T.I.; Kostyreva, E.A.; Kalmychkov, G.V.; Khlystov, O.M. Petroleum potential of Baikal deposits. Russ. Geol. Geophys. 2007, 48, 1046–1053. [Google Scholar] [CrossRef]
- Nikanorov, A.M.; Reznikov, S.A.; Matveev, A.A.; Arakelyan, V.S. Monitoring of polycyclic aromatic hydrocarbons in the Lake Baikal basin in the areas of intensive anthropogenic impact. Russ. Meteorol. Hydrol. 2012, 37, 477–484. [Google Scholar] [CrossRef]
- Nikanorov, A.M.; Matveev, A.A.; Reznikov, S.A.; Arakelyan, V.S.; Luk’yanova, N.N. Results of multiyear studies on the dynamics of pollution of lake Baikal by polycyclicaromatic hydrocarbons in the area waste water discharge from the Baikal pulp and paper plant. Dokl. Earth. Sci. 2012, 443, 361–364. [Google Scholar] [CrossRef]
- Reznikov, S.A.; Adzhiev, R.A. Persistent organic pollutants in bottom sediments in the north of Lake Baikal in the area of the Baikal-Amur mainline impact. Russ. Meteorol. Hydrol. 2015, 40, 207–214. [Google Scholar] [CrossRef]
- Gorshkov, A.; Pavlova, O.; Khlystov, O.; Zemskaya, T. Fractioning of petroleum hydrocarbons from seeped oil as a factor of purity preservation of water in Lake Baikal (Russia). J. Great Lakes Res. 2020, 46, 115–122. [Google Scholar] [CrossRef]
- Semenov, M.Y.; Marinaite, I.I. Using the end-member mixing approach to apportion sources of polycyclic aromatic hydrocarbons in various environmental compartments. Environ. Earth Sci. 2016, 75, 207. [Google Scholar] [CrossRef]
- Semenov, M.Y.; Marinaite, I.I.; Golobokova, L.P.; Khuriganova, O.I.; Khodzher, T.V.; Semenov, Y.M. Source apportionment of polycyclic aromatic hydrocarbons in Lake Baikal water and adjacent air layer. Chem. Ecol. 2017, 33, 977–990. [Google Scholar] [CrossRef]
- Semenov, M.; Marinaite, I.; Zhuchenko, N.; Silaev, A.; Vershinin, K.; Semenov, Y. Revealing the factors affecting occurrence and distribution of polycyclic aromatic hydrocarbons in water and sediments of Lake Baikal and its tributaries. Chem. Ecol. 2018, 34, 925–940. [Google Scholar] [CrossRef]
- Semenov, M.Y.; Silaev, A.V.; Semenov, Y.M.; Begunova, L.A.; Semenov, Y.M. Identifying and Characterizing Critical Source Areas of Organic and Inorganic Pollutants in Urban Agglomeration in Lake Baikal Watershed. Sustainability 2022, 14, 14827. [Google Scholar] [CrossRef]
- Semenov, M.Y.; Marinaite, I.I.; Golobokova, L.P.; Semenov, Y.M.; Khodzher, T.V. Revealing the chemical profiles of airborne particulate matter sources in Lake Baikal area: A combination of three techniques. Sustainability 2022, 14, 6170. [Google Scholar] [CrossRef]
- Gorshkov, A.G.; Marinayte, I.I.; Obolkin, V.A.; Baram, G.I.; Khodger, T.V. Polynuclear Aromatic Hydrocarbons in the Surface Aerosol of the Southern Coast of Lake Baikal. In Nucleation and Atmospheric Aerosols; MarkkuKulmala, P.E.W., Ed.; Elsevier: Amsterdam, The Netherlands, 1996; pp. 597–600. [Google Scholar] [CrossRef]
- Marinayte, I.I. Polycyclic aromatic hydrocarbons in water of tributaries of Southern Baikal. Atmos. Ocean. Opt. 2006, 19, 499–503. [Google Scholar]
- Gorshkov, A.G.; Marinayte, I.I.; Zemskaya, T.I.; Khodger, T.V. Sovremennii uroven’ nefteproduktov v vode ozera Baikal I ego pritokov [The current level of oil products in the water of Lake Baikal and its tributaries]. Chem. Sustain. Dev. 2010, 18, 711–718. (In Russian) [Google Scholar]
- Shirapova, G.S.; Utyugnikova, N.S.; Rabina, O.A.; Vyalkov, A.I.; Morozov, S.V.; Batoev, V.B. Zagryaznenie poliaromaticheskimi uglevodorodami basseina ozera Baikal: Ozero Gusinoe [Contamination of the Lake Baikal Basin with Polyaromatic Hydrocarbons: The Gusinoye Lake]. Chem. Sustain. Dev. 2013, 21, 189–195. (In Russian) [Google Scholar]
- Morozov, S.V.; Shirapova, G.S.; Ermolaeva, O.A.; Chernyak, E.I.; Tkacheva, N.I.; Batoev, V.B.; Mognonov, D.M. Studies of the Behaviour of Persistent Organic Pollutants in the Baikal-Selenga Ecosystem as an Element of the Implementation of the Stockholm Convention. Chem. Sustain. Dev. 2022, 30, 600–611. [Google Scholar] [CrossRef]
- Golobokova, L.; Khodzher, T.; Khuriganova, O.; Marinayte, I.; Onishchuk, N.; Rusanova, P.; Potemkin, V. Variability of chemical properties of the atmospheric aerosol above Lake Baikal during large wildfires in Siberia. Atmosphere 2020, 11, 1230. [Google Scholar] [CrossRef]
- Marinaite, I.I.; Potyomkin, V.L.; Khodzher, T.V. Evaluation of atmospheric pollution with PAHS and PM10 above the water area of Lake Baikal during wildfires in Summer 2019. In Proceedings of the 26th International Symposium on Atmospheric and Ocean Optics, Atmospheric Physics, Moscow, Russia, 6–10 July 2020; Volume 115602. [Google Scholar] [CrossRef]
- Marinaite, I.I.; Potyomkin, V.L.; Molozhnikova, E.V.; Penner, I.E.; Shikhovtsev, M.Y.; Izosimova, O.N.; Khodzher, T.V. Polycyclic aromatic hydrocarbons and PM10 solid particles above the water area of Lake Baikal in the summer of 2020. In Proceedings of the 27th International Symposium on Atmospheric and Ocean Optics, Atmospheric Physics, Moscow, Russia, 5–9 July 2021; Volume 119161. [Google Scholar] [CrossRef]
- Gorshkov, A.G.; Izosimova, O.N.; Kustova, O.V.; Marinaite, I.I.; Galachyants, Y.P.; Sinyukovich, V.N.; Khodzher, T.V. Wildfires as a Source of PAHs in Surface Waters of Background Areas (Lake Baikal, Russia). Water 2021, 13, 2636. [Google Scholar] [CrossRef]
- Belis, C.A.; Favez, O.; Mircea, M.; Diapouli, E.; Manousakas, M.-I.; Vratolis, S.; Gilardoni, S.; Paglione, M.; Decesari, S.; Mocnik, G.; et al. European Guide on Air Pollution Source Apportionment with Receptor Models-Revised Version 2019, EUR 29816 EN; Publications Office of the European Union: Luxembourg, 2019; 166p.
- Javed, W.; Guo, B. Chemical characterization and source apportionment of fine and coarse atmospheric particulate matter in Doha, Qatar. Atmos. Pollut. Res. 2020, 12, 122–136. [Google Scholar] [CrossRef]
- Zhou, X.; Li, Z.; Zhang, T.; Wang, F.; Tao, Y.; Zhang, X.; Wang, F.; Huang, J.; Cheng, T.; Jiang, H.; et al. Chemical nature and predominant sources of PM10 and PM2.5 from multiple sites on the Silk Road, Northwest China. Atmos. Pollut. Res. 2020, 12, 425–436. [Google Scholar] [CrossRef]
- Reff, A.; Eberly, S.I.; Bhave, P.V. Receptor Modeling of Ambient Particulate Matter Data Using Positive Matrix Factorization: Review of Existing Methods. J. Air Waste Manag. Assoc. 2007, 57, 146–154. [Google Scholar] [CrossRef]
- Norris, G.; Duvall, R.; Brown, S.; Bai, S. EPA Positive Matrix Factorization (PMF) 5.0 Fundamentals and User Guide; U.S. Environmental Protection Agency: Washington, DC, USA, 2014; EPA/600/R-14/108 (NTIS PB2015-105147).
- Khalikov, I.S.; Lukyanova, N.N. Polycyclic aromatic hydrocarbons content in bottom sediments of baikal lake According to results of monitoring in 2017–2018. Int. J. Res. 2020, 96, 69–73. (In Russian) [Google Scholar] [CrossRef]
- Jiang, C.; Alexander, R.; Kagi, R.I.; Murray, A.P. Origin of perylene in ancient sediments and its geological significance. Org. Geochem. 2000, 31, 1545–1559. [Google Scholar] [CrossRef]
- Silliman, J.E.; Meyers, P.A.; Eadie, B.J.; Klump, J.V. A hypothesis for the origin of perylene based on its low abundance in sediments of Green Bay, Wisconsin. Chem. Geol. 2001, 177, 309–322. [Google Scholar] [CrossRef]
- Khalikov, I.S. The contents of PAHs in bottom sediments of the Baikal Lake in the region of the Selenga shallow waters. Nauchniy Alm. 2016, 1–2, 447–451. (In Russian) [Google Scholar] [CrossRef]
- Khalikov, I.S.; Makarenko, A.A.; Levshin, D.G.; Lukyanova, N.N.; Yakhryushin, V.N. New Data on the Content of Polycyclic Aromatic Hydrocarbons in Bottom Sediments of the Coastal Zone of Lake Baikal. Ecol. Khimiya 2021, 30, 117–128. (In Russian) [Google Scholar]
- Saneev, B.G.; Ivanova, I.; Maisyuk, E.P.; Tuguzova, T.F.; Ivanov, R.A. Energeticheskaya infrastructura tsentralnoy ecologicheskoy zony Baikalskoi prirodnoy territorii: Vozdeystviye na prirodnuyu sredu i puti ego snizheniya [The power generation infrastructure in the central ecological zone of the Baikal natural territory: The environmental impact and ways to mitigate it]. Geogr. Nat. Res. 2016, 5, 218–224. (In Russian) [Google Scholar]
- Obolkin, V.A.; Potemkin, V.L.; Makukhin, V.L.; Khodzher, T.V.; Chipanina, E.V. Long-range transport of plumes of atmospheric emissions from regional coal power plants to the South Baikal water basin. Atmos. Ocean. Opt. 2017, 30, 360–365. [Google Scholar] [CrossRef]
- Wang, R.; Liu, G.; Zhang, J. Variations of emission characterization of PAHs emitted from different utility boilers of coal-fired power plants and risk assessment related to atmospheric PAHs. Sci. Total. Environ. 2015, 538, 180–190. [Google Scholar] [CrossRef]
- Wang, R.; Liu, G.; Sun, R.; Yousaf, B.; Wang, J.; Liu, R.; Zhang, H. Emission characteristics for gaseous- and size-segregated particulate PAHs in coal combustion flue gas from circulating fluidized bed (CFB) boiler. Environ. Pollut. 2018, 238, 581–589. [Google Scholar] [CrossRef]
- Drotikova, T.; Ali, A.M.; Halse, A.K.; Reinardy, H.C.; Kallenborn, R. Polycyclic aromatic hydrocarbons (PAHs) and oxy- and nitro-PAHs in ambient air of the Arctic town Longyearbyen, Svalbard. Atmos. Chem. Phys. 2020, 20, 9997–10014. [Google Scholar] [CrossRef]
- Bignal, K.L.; Langridge, S.; Zhou, J.L. Release of polycyclic aromatic hydrocarbons, carbon monoxide and particulate matter from biomass combustion in a wood-fired boiler under varying boiler conditions. Atmos. Environ. 2008, 42, 8863–8871. [Google Scholar] [CrossRef]
- Ho, K.F.; Sai, S.; Ho, H.; Lee, S.C.; Cheng, Y.; Chow, J.C.; Watson, J.G.; Louie, P.K.K.; Tian, L. Emissions of gas- and particle-phase polycyclic aromatic hydrocarbons (PAHs) in the ShingMun Tunnel, Hong Kong. Atmos. Environ. 2009, 43, 6343–6351. [Google Scholar] [CrossRef]
- Liu, Y.; Gao, Y.; Yu, N.; Zhang, C.; Wang, S.; Ma, L.; Zhao, J.; Lohmann, R. Particulate matter, gaseous and particulate polycyclic aromatic hydrocarbons (PAHs) in an urban traffic tunnel of China: Emission from on-road vehicles and gas-particle partitioning. Chemosphere 2015, 134, 52–59. [Google Scholar] [CrossRef] [PubMed]
- Yunker, M.B.; Macdonald, R.W.; Vingarzan, R.; Mitchell, R.H.; Goyette, D.; Sylvestre, S. PAHs in the Fraser River basin: A critical appraisal of PAH ratios as indicators of PAH source and composition. Org. Geochem. 2002, 33, 489–515. [Google Scholar] [CrossRef]
- Tobiszewski, M.; Namiesnik, J. PAH diagnostic ratios for the identification of pollution emission sources. Environ. Pollut. 2012, 162, 110–119. [Google Scholar] [CrossRef]
- Li, M.; Shi, M.; Hu, T.; Liu, W.; Mao, Y.; Yu, Y.; Yu, H.; Xu, A.; Yang, W.; Xing, X.; et al. Geochemical characteristics and behaviors of polycyclic aromatic hydrocarbons (PAHs) in soil, water, and sediment near a typical nonferrous smelter. J. Soils Sediments 2023, 23, 2258–2272. [Google Scholar] [CrossRef]
- Li, X.; Wang, Z.; Guo, T. Emission of PM2.5-bound polycyclic aromatic hydrocarbons from biomass and coal combustion in China. Atmosphere 2021, 12, 1129. [Google Scholar] [CrossRef]
- Mi, H.H.; Lee, W.J.; Tsai, P.J.; Chen, C.B. A comparison on the emission of polycyclic aromatic hydrocarbons and their corresponding carcinogenic potencies from a vehicle engine using leaded and lead-free gasoline. Environ. Health Perspect. 2001, 109, 1285–1290. [Google Scholar] [CrossRef]
- Abrantes, R.; Assunção, J.V.; Pesquero, C.R. Emission of polycyclic aromatic hydrocarbons from light-duty diesel vehicles exhaust. Atmos. Environ. 2004, 38, 1631–1640. [Google Scholar] [CrossRef]
- Marr, L.C.; Kirchstetter, T.W.; Harley, R.A.; Miguel, A.H.; Hering, S.V.; Hammond, S.K. Characterization of Polycyclic Aromatic Hydrocarbons in Motor Vehicle Fuels and Exhaust Emissions. Environ. Sci. Technol. 1999, 33, 3091–3099. [Google Scholar] [CrossRef]
- Almeda, R.; Wambaugh, Z.; Chai, C.; Wang, Z.; Liu, Z.; Buskey, E.J. Effects of Crude Oil Exposure on Bioaccumulation of Polycyclic Aromatic Hydrocarbons and Survival of Adult and Larval Stages of Gelatinous Zooplankton. PLoS ONE 2013, 8, e74476. [Google Scholar] [CrossRef]
- Goto, Y.; Nakamuta, K.; Nakata, H. Parent and alkylated PAHs profiles in 11 petroleum fuels and lubricants: Application for oil spill accidents in the environment. Ecotoxicol. Environ. Saf. 2021, 224, 112644. [Google Scholar] [CrossRef]
- Dickhut, R.M.; Canuel, E.A.; Gustafson, K.E.; Liu, K.; Arzayus, K.M.; Walker, S.E.; Edgecombe, G.; Gaylor, M.O.; MacDonald, E.H. Automotive Sources of Carcinogenic Polycyclic Aromatic Hydrocarbons Associated with Particulate Matter in the Chesapeake Bay Region. Environ. Sci. Technol. 2000, 34, 4635–4640. [Google Scholar] [CrossRef]
- Callén, M.S.; de la Cruz, M.T.; López, J.M.; Mastral, A.M. PAH in airborne particulate matter.: Carcinogenic character of PM10 samples and assessment of the energy generation impact. Fuel Process. Technol. 2011, 92, 176–182. [Google Scholar] [CrossRef]
- Van Metre, P.C.; Majewski, M.S.; Mahler, B.J.; Foreman, W.T.; Braun, C.L.; Wilson, J.T.; Burbank, T.L. PAH volatilization following application of coal-tar-based pavement sealant. Atmos. Environ. 2012, 51, 108–115. [Google Scholar] [CrossRef]
- Gao, P.; Liu, S.; Feng, Y.; Lin, N.; Lu, B.; Zhang, Z.; Cui, F.; Xing, B.; Hammond, S.K. Concentrations of polycyclic aromatic hydrocarbons in resuspendable fraction of settled bus dust and its implications for human exposure. Environ. Pollut. 2015, 198, 1–7. [Google Scholar] [CrossRef]
- Boonyatumanond, R.; Murakami, M.; Wattayakorn, G.; Togo, A.; Takada, H. Sources of polycyclic aromatic hydrocarbons (PAHs) in street dust in a tropical Asian mega-city, Bangkok, Thailand. Sci. Total Environ. 2007, 384, 420–432. [Google Scholar] [CrossRef]


Disclaimer/Publisher’s Note: The statements, opinions and data contained in all publications are solely those of the individual author(s) and contributor(s) and not of MDPI and/or the editor(s). MDPI and/or the editor(s) disclaim responsibility for any injury to people or property resulting from any ideas, methods, instructions or products referred to in the content. |
© 2023 by the authors. Licensee MDPI, Basel, Switzerland. This article is an open access article distributed under the terms and conditions of the Creative Commons Attribution (CC BY) license (https://creativecommons.org/licenses/by/4.0/).